29
Energy Fuels Inc. NYSE American: UUUU TSX: EFR January 2019 URANIUM The Largest U.S. Producer VANADIUM The Only Primary Producer in North America

Energy Fuels Inc. NYSE American: UUUU TSX: EFR January 2019
URANIUM The Largest U.S. Producer VANADIUM The Only Primary Producer in North America

IMPORTANT INFORMATION
2
• Please carefully review important information about this presentation – Forward looking statements, page 26 – Notice regarding technical disclosure, page 27 – Cautionary statements for US investors concerning mineral resources, page 28

ENERGY FUELS – INVESTMENT THEMES
3
1 #1 Uranium Producer in the U.S. Leading production portfolio to capitalize on recovery faster – and on a greater scale – than peers
2
3
4
5
6
U.S. Launches §232 Investigation on Uranium Imports Proposal for trade quotas reserving 25% of U.S. market for U.S. uranium miners
92
U Uranium
238.03
23
V Vanadium
50.94
Uranium Alternate Feed Materials Super low-cost uranium production able to generate cash flow in today’s challenging market
Land Cleanup & Copper Recovery Additional opportunities to generate significant future cash flow
Uranium & Vanadium Poised for Growth Nuclear energy growing at fastest rate in 25 years; Vanadium markets very strong
Only Primary Vanadium Producer in the U.S. Resumed V2O5 production in Q4-2018; Up to 4 million lbs. recoverable in 2019 – 2020

MARKET-LEADING PORTFOLIO URANIUM & VANADIUM ASSET S IN T HE U.S.
4
Energy Fuels’ Uranium Production Rank in U.S.
• Track record of sustained market leadership
• Unmatched ability to increase uranium production as prices rise
• The only U.S. uranium supplier with both conventional & in-situ recovery (ISR)
– White Mesa Mill (Utah): The only licensed, permitted & operating conventional uranium and vanadium mill in the U.S.
– Nichols Ranch ISR Facility (Wyoming): Licensed, permitted, and operating ISR uranium production
– Alta Mesa ISR Facility (Texas): Licensed, permitted, and constructed ISR uranium facility on standby
• Resumed vanadium (V2O5) production in Q4-2018 at the White Mesa Mill
2017 – 181 2016
#1 2015
#2 #3
1Based on Company estimate of U.S. production in 2018

VANADIUM BLACK FLAKE PRODUCED AT THE WHITE MESA MILL IN JANUARY 2019
5

STRATEGIC URANIUM PRODUCTION ASSETS IN U.S. T HE U.S. IS T HE WORLD’S B IGGEST NUCLEAR MARKET
6
Conventional uranium & vanadium mill
ISR uranium plant and mine
Uranium mine/project
Uranium/vanadium mine/project
Existing nuclear power plant
Nuclear power plant under construction
Sheep Mountain
Nichols Ranch ISR
Canyon Roca Honda
Alta Mesa ISR
Henry Mountains
White Mesa Mill
Whirlwind La Sal

“THE ENERGY FUELS ADVANTAGE” ASSET S NOW IN PRODUCT ION & ON STANDBY
7
• Assets that can ramp-up production much more quickly than unpermitted or undeveloped projects
• What is an asset on “Standby”? – Fully licensed & permitted – Substantially developed & constructed – On care & maintenance – Most are able to ramp-up to full production within 12 – 18 months
In the U.S., licenses, permits, and public acceptance are just as important as technical & economic feasibility
5-10+ years Typical time to
license & permit a new uranium mine
or processing facility in the U.S.
In Production Unpermitted – Undeveloped On Standby

PRODUCTION FACILITY: Alta Mesa ISR Plant Nichols Ranch ISR Plant
UNMATCHED FLEXIBILITY TO INCREASE URANIUM PRODUCTION
8
10 yr.
20 yr. MINE or
PRODUCTION FACILITY STATUS
MAX. ANNUAL PRODUCTION
SINCE 2005 (Lbs. U3O8)1
AVERAGE ANNUAL FUTURE
PRODUCTION (PFS/PEA; Lbs. U3O8)2
M&I RESOURCES
(M Lbs.)3
INFERRED RESOURCES
(Lbs.)3
OTHER RECOVERABLE
MINERALS
IN PRODUCTION4
Nichols Ranch ISR Permitted, Developed & Operating 335,000 630,000 7.2 1.1 ---
White Mesa Mill Permitted, Developed & Operating 1,270,000 -- n/a n/a Vanadium/Copper
La Sal Complex Permitted, Developed & Test Mining 470,000 -- 4.1 0.4 Vanadium
ON STANDBY5
Alta Mesa ISR Permitted & Substantially Developed 1,100,000 -- 3.6 16.8 ---
Canyon Mine Permitted & Substantially Developed -- -- 2.4 0.2 Copper
Whirlwind Mine Permitted & Substantially Developed -- -- 1.0 2.0 Vanadium
Tony M Mine Permitted & Substantially Developed 260,000 -- 8.1 2.8 ---
Daneros Mine Permitted & Substantially Developed 270,000 -- 0.1 0.1 ---
LONG-TERM, LARGE-SCALE MINES6
Roca Honda Advanced Permitting -- 2,700,000 14.6 11.2 ---
Sheep Mountain Mine Permitted -- 1,500,000 30.3 -- ---
Bullfrog Pre-Permitting -- -- 4.7 5.3 ---
1. Maximum actual U3O8 production achieved since 2005; Figures rounded to nearest 10,000; Past figures not necessarily representative of future results. 2. PEA or PFS estimates; If there is no figure, there is no PFS or PEA to support a production estimate; Figures rounded to nearest 10,000. 3. All NI 43-101 compliant resources. Please see resource table on page 27 for further information on pounds, resource classification, grade and tonnage. 4. “In Production” means a facility that is currently in production and would generally be expected to be able to ramp-up to full production within 6-12 months 5. “On Standby” means a mine or facility that would generally be expected to be able to ramp-up to full production within 12-18 months. 6. “Permitting” means a mine or facility that would generally be expected to be able to be in full production within 5-7 years.
White Mesa Mill Heap Leach Facility (To be Permitted)

NICHOLS RANCH ISR FACILITY FULLY LICENSED, CONSTRUCTED, AND IN PRODUCTION
2017 U3O8 production
• Producing today
• Ready to increase production within 6 months of “GO” decision
• 34 fully-permitted wellfields w/ significant in-ground resources provide long-term production profile
– Nichols Ranch Wellfields – 4 future wellfields
– Jane Dough Wellfields – 22 future wellfields – Hank Wellfields – 8 future wellfields
9
259,000 lbs. Annual licensed capacity
2M lbs. Wellfields now in production
9
Jackson
Casper
Nichols Ranch ISR
Cheyenne
URANIUM

ALTA MESA ISR FACILITY FULLY-PERMITTED, CONSTRUCTED, AND READY TO RESUME PRODUCTION
U3O8 Produced 2005 – 2013
• On standby today
• Ready to resume production within 12 months of “GO” decision
• Significant in-ground uranium resources
• Potential to greatly expand resources through exploration
10
4.6M lbs. Annual licensed capacity
1.5M lbs. Total project area (acres)
200,000
Corpus Christi
Alta Mesa ISR
Austin
Houston
Dallas
URANIUM

Salt Lake City
White Mesa Mill
WHITE MESA MILL THE ONLY CONVENTIONAL URANIUM & VANADIUM MILL IN THE U.S.
2017 U3O8 Production
• Uranium – In production today with considerable excess capacity – Central to the highest-grade uranium deposits in U.S. – Separate circuit for processing low-cost alternate feed materials – 450,000 lbs. of U3O8 processed for 3rd party in 2018
• Vanadium – Separate vanadium production circuit – Significant past V2O5 production – Resumed production in Q4-2018
• Other Business Opportunities – Alternate feed materials and land cleanup work – 3rd party toll milling (no agreements in place at this time)
11
366,000 lbs. Annual licensed capacity
8M+ lbs.
Moab
946,000 lbs. U3O8 Processed for 3rd Party in 2017
URANIUM + VANADIUM

• 11.9M lbs. of Copper – 5.9% Cu(1)
CANYON MINE FULLY-PERMITTED, CONSTRUCTED, AND READY TO ENTER PRODUCTION
• High-grade uranium + copper
• Surface development + main shaft complete
• Very low “all-in” cost of production
– Copper credits could reduce costs further
• Process mined material at White Mesa Mill
• Reduced activity today
12
2017 Resource Estimate:
• 2.4M lbs. of Uranium – 0.9% U3O8(1)
1 Please refer to page 27 for more information on grade, tonnage, and resource classification
Phoenix
Tucson
Canyon Mine
The highest-grade uranium mine in the U.S.
Production Ready:
Flagstaff
URANIUM + COPPER
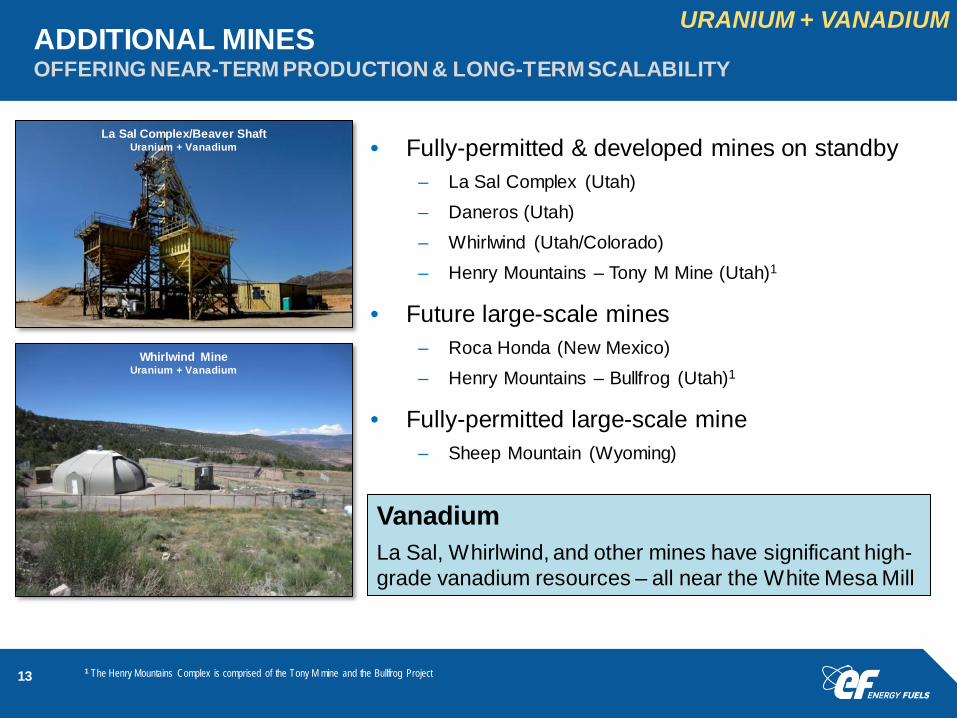
ADDITIONAL MINES OFFERING NEAR-TERM PRODUCTION & LONG-TERM SCALABILITY
• Fully-permitted & developed mines on standby – La Sal Complex (Utah) – Daneros (Utah) – Whirlwind (Utah/Colorado) – Henry Mountains – Tony M Mine (Utah)1
• Future large-scale mines – Roca Honda (New Mexico) – Henry Mountains – Bullfrog (Utah)1
• Fully-permitted large-scale mine – Sheep Mountain (Wyoming)
13 1 The Henry Mountains Complex is comprised of the Tony M mine and the Bullfrog Project
La Sal Complex/Beaver Shaft Uranium + Vanadium
Vanadium La Sal, Whirlwind, and other mines have significant high-grade vanadium resources – all near the White Mesa Mill
Whirlwind Mine Uranium + Vanadium
URANIUM + VANADIUM

VANADIUM ENERGY FUELS TO BECOME THE ONLY PRIMARY VANADIUM PRODUCER IN NORTH AMERICA IN Q4-2018
14
WHITE MESA MILL • The only conventional vanadium mill
in North America
• Separate vanadium recovery circuit
• 4 million lbs. of recoverable, dissolved V2O5 in pond solutions
• 200k – 225k lbs. of V2O5 production per month for 16 – 20 months1
• Last produced 1.5M lbs. of V2O5 in 2013
4M lbs. V2O5 Expected production – 2019 to 20201
32M lbs. Energy Fuels’ in-ground vanadium resources2
VANADIUM MINES
• Licensed/Permitted
• Developed
• Past Producing
• Currently test mining for high-grade V2O5 at La Sal
1 Subject to market conditions, recoveries, and costs
2 Measured & Indicated; Please refer to page 27 for more information on grade, tonnage, and resource classification; the 32M lbs. does not include the 4M lbs. estimated by the Company to be recoverable from the pond solutions at White Mesa
La Sal has produced more V2O5 than any other mine in the U.S. since 2008
VANADIUM ENERGY FUELS BECOMING THE ONLY PRIMARY VANADIUM PRODUCER IN THE U.S.

VANADIUM MARKET OBSERVATIONS
15
USES OF VANADIUM
• Steel, titanium, & other alloys
• Strategic mineral for defense applications
• Advanced high-capacity vanadium batteries to store renewable energy
CHINA: ENERGIZING TODAY’S MARKET • Large vanadium production cuts; new production
unlikely to come online soon
• Significant new demand
• New rebar standards effective Nov. 1, 2018 that can only be met through increased use of vanadium
• Exports from China at/near zero, creating global market tightness
1 Metal Bulletin
$2.50
$15.50
$-
$5.00
$10.00
$15.00
$20.00
$25.00
$30.00
$35.00
Dec-
15Fe
b-16
Apr-
16Ju
n-16
Aug-
16O
ct-1
6De
c-16
Feb-
17Ap
r-17
Jun-
17Au
g-17
Oct
-17
Dec-
17Fe
b-18
Apr-
18Ju
n-18
Aug-
18O
ct-1
8De
c-18
3-Year V2O5 Price Chart1

NUCLEAR ENERGY IS GROWING ALL FUELED BY URANIUM
16
33
94
222
439
55
152
335
453
Units UnderConstruction
Units Planned UnitsProposed
Operable Units
World Nuclear Association Reactor Data
(Oct. 2007 vs. Oct. 2018)
October 2007
October 2018
• Global energy demand growing – clean energy demand growing faster
• Nuclear is the best clean energy – Operates 24/7 – Reliable – High capacity factors – Grid stability – Safe – Zero carbon + zero air pollution
• Nuclear provides 20% of all electricity – and 60% of all clean energy – in U.S.1
1 Nuclear Energy Institute; 2017 data

17
Kazakhstan • Production cuts announced for 2018 – 2020 (~29M lbs. total1) • Significant production declines possible through 20351
Canada • McArthur River (Cameco) suspended indefinitely starting in 2018 (~18M lb./yr) • Rabbit Lake (Cameco) suspended indefinitely starting in 2016 (~4M lbs/yr)
Namibia • Langer-Heinrich (Paladin) suspended indefinitely starting in 2018 (~5M lbs/yr3) • Rio Tinto selling Rossing to Chinese state-owned entity (~4M lbs/yr3) • Husab – a majority-owned Chinese mine – not meeting production targets
Australia • Ranger (Rio Tinto) halting ALL production in 2021 (~6M lbs/yr3)
Niger • Orano’s Somair and Cominak mines reducing production (~1.5M lbs/yr3)
Spain • Government may block Berkeley’s Salamanca Project (~4.4M lbs/yr4)
U.S • Uranium production at its lowest levels since the late 1940’s5
1 World Nuclear Association 2 Kazatomprom representative at 2018 WNFC Conference in Madrid, Spain 3 Based on 5-year average production for 2013-2017; data from World Nuclear Association 4 October 16 article in Reuters; TradeTech estimated production by 2021 5 Energy Information Administration
LOW PRICES CREATING SIGNIFICANT SUPPLY RISKS PRODUCTION CUTS
When utility demand returns to the market, history indicates that production will lag

POSITIVE MARKET DEVELOPMENTS GLOBALLY
18 1 Includes January 2018 exchange of conversion components for U3O8 2 TradeTech Uranium Market Study, 2018: Issue 2 3 July 25, 2018 Cameco news release 4 Of which significant portions will be used to buy physical uranium and uranium products
County-Specific News China • Aggressive nuclear construction program
• By 2020, 58 GWe capacity installed + 30 GWe under construction
Japan • 9 reactors restarted • 15 reactors approved for restart or under review • Reaffirming goal of 20% - 22% nuclear by 2030
France • Maintaining high share of nuclear energy
Other Positive Developments Significant Uranium Purchases by Financial Entities & Producers
• Yellowcake plc (Purchased 8.4M Lbs. in 2018) • Cameco (Purchasing up to 15M lbs. in 2018-20193) • Tribeca Partners raising $100M4 • Uranium Trading Corporation $57.5M IPO4
• Purchasing by Uranium Participation Corp.
Near-Term Uncovered Utility Demand
• 485M lbs. for 2018 - 2025

POSITIVE DEVELOPMENTS U.S. URANIUM MARKET
• Trump Administration highly supportive of nuclear energy and domestic mining
• U.S. Department of Energy (“DOE”) working to support U.S. nuclear reactor fleet through Federal Energy Regulatory Commission (“FERC”) rule-making
• State legislation supporting nuclear has passed in Illinois, New York, Connecticut, and New Jersey
• Two new reactors in Georgia being constructed
• DOE halting uranium sales for remainder of 2018 and FY-2019
• U.S. Department of Interior (“DOI”): Uranium and vanadium ‘critical minerals’
19

PETITIONING U.S. GOVERNMENT FOR URANIUM QUOTA INITIATING SECTION 232 INVESTIGATION
20
• §232 Investigation into the effects of uranium imports on U.S. national security led by U.S. Department of Commerce (“DOC”)
• DOC appears to also be investigating other aspects of the fuel cycle
• DOC has maximum of 270 days (4/14/2019) to prepare a report and recommendation to the President
• President has maximum of 90 days (7/13/2019) to adjust trade
• Proposed trade remedies: – Quota reserving 25% of U.S. nuclear market for U.S. uranium miners
– U.S. government utilities & agencies required to buy U.S. uranium
• §232 is extremely flexible: Remedies can include quotas, tariffs, direct subsidies, etc.
• If successful, U.S. uranium industry could be revitalized with negligible effects on U.S. utilities & consumers
12M UP TO
POUNDS/YEAR RESERVED
FOR U.S. MINERS
JULY 18, 2018: U.S. GOVERNMENT LAUNCHES NATIONAL SECURITY PROBE INTO URANIUM IMPORTS

ENERGY FUELS’ STRONG COMPETETIVE POSITIONING PROVEN TRACK RECORD OF PRODUCTION & SALES
21
MARKET CAP (US$MM)
M&I (MM LBS.)(1)
INFERRED (MM LBS.)(1)
MKT. CAP PER LB. M&I
(US$MM)
WORKING CAPITAL
(US$MM)(2) ISR CONVENTIONAL VANADIUM
PRODUCTION
ALTERNATE FEED
PRODUCTION
Cameco $4,431 883 190 $5.02 $1,090 NexGen Energy $591(3) 180 122 $3.28 $94(3) Energy Fuels $247 81 49 $3.05 $51 Denison Mines $282 109 8 $2.59 $17(3) (6) Uranium Energy $211 58 45 $3.64 $10 Fission Uranium $191(3) 88 53 $2.17 $22(3) Ur-Energy $96 22 6 $4.36 $5 Peninsula Energy $29(4) 40(5) 72(5) $0.72 $1
CURRENT COMMERCIAL-SCALE PRODUCTION
North American Uranium Space – As of December 28, 2018
1 See Slide 27 for tons, grade and resource classification for Energy Fuels 2 For most recently reported period; September 30, 2018 for Energy Fuels 3 Cdn$1 = US$0.73 4 Au$ = US$0.70
5 In accordance with JORC; not NI 43-101 compliant 6 Does not include minority share of production of operating McClean Lake Mill

OPPORTUNITY TO PARTICIPATE IN GOVERNMENT CLEANUP ABANDONED URANIUM MINES
• Potential to participate in cleanup of Cold War era uranium sites – U.S. government holds $1.7
billion to clean-up mines on Navajo Nation1
– Other companies have legacy cleanup obligations
– Energy Fuels’ White Mesa Mill is well positioned:
• Within close trucking distance • Fully-permitted to handle material • Only facility in the U.S. that can
recycle material into usable uranium
22 1 U.S. Environmental Protection Agency; Navajo Nation: Cleaning Up Abandoned Uranium Mines
White Mesa Mill (Approximate Location)

FOCUSED ON MAINTAINING FINANCIAL FLEXIBILITY
• Strategic positioning during current uranium market – July 18, 2018: U.S. launches §232 investigation on uranium imports into the U.S. – Q4-2018: Resumed vanadium (V2O5) production at White Mesa Mill – Enhancing ability to increase/resume production at Nichols Ranch, Alta Mesa and Canyon – Pursuing test mining campaign at La Sal Complex that targets vanadium
• 2018 Guidance: – 460,000 to 520,000 pounds of U3O8 production – 650,000 pounds of U3O8 contract sales at an expected average price of $48.00 per pound
• Reducing Debt: – Paid off Wyoming Industrial Bond in September 2018
23
385,000 POUNDS OF INVENTORY1
$42.0M CASH & SECURITIES1
$51.3M WORKING CAPITAL1
1 Quarter-ended September 30, 2018

ENERGY FUELS #1 IN U.S. URANIUM AND VANADIUM PRODUCTION
• Unmatched combination of low-costs and production scalability in U.S. uranium space
• Uniquely equipped to respond quickly to increased demand
• Energy Fuels became the only primary vanadium producer in North America in Q4-2018
• Strong cash and working capital position, reducing debt, and committed to maintaining average cost of capital as low as possible
• Alternate feed material, copper, and land cleanup opportunities provide additional upside
24
232 Petition – Potential Revitalization of the U.S. Uranium Industry

FORWARD LOOKING STATEMENTS
Certain of the information contained in this presentation constitutes "forward-looking information" (as defined in the Securities Act (Ontario)) and "forward-looking statements" (as defined in the U.S. Private Securities Litigation Reform Act of 1995) that are based on expectations, estimates and projections of management of Energy Fuels Inc. ("Energy Fuels“) as of today's date. Such forward-looking information and forward-looking statements include but are not limited to: the business strategy for Energy Fuels; Energy Fuels expectations with regard to current and future uranium and vanadium market conditions; the uranium industry’s ability to respond to higher demand; the impacts of recent market developments; business plans; outlook; objectives; expectations as to the prices of U3O8, V2O5, and Cu; expectations as to reserves, resources, results of exploration and related expenses; estimated future production and costs; changes in project parameters; the expected permitting and production time lines; the Company’s belief that it has significant production growth potential and unmatched flexibility to scale-up production; the potential for additional business opportunities including vanadium, copper, alternate feed materials, and the cleanup of historic mines on the Navajo Nation and in the Four Corners Region of the U.S.; the potential for optimizing mining and processing; the Company’s belief in its readiness to capitalize on improving markets; global uranium supply risks; and expected worldwide uranium supply and demand fundamentals. All statements contained herein which are not historical facts are forward-looking statements that involve risks, uncertainties and other factors that could cause actual results to differ materially from those expressed or implied by such forward-looking information and forward-looking statements. Factors that could cause such differences, without limiting the generality of the foregoing include: risks that the synergies and effects on value described herein may not be achieved; risks inherent in exploration, development and production activities; volatility in market prices for uranium and vanadium; the impact of the sales volume of uranium and vanadium; the ability to sustain production from mines and the mill; competition; the impact of change in foreign currency exchange; imprecision in mineral resource and reserve estimates; environmental and safety risks including increased regulatory burdens; changes to reclamation requirements; unexpected geological or hydrological conditions; a possible deterioration in political support for nuclear energy; changes in government regulations and policies, including trade laws and policies; demand for nuclear power; replacement of production and failure to obtain necessary permits and approvals from government authorities; weather and other natural phenomena; ability to maintain and further improve positive labour relations; operating performance of the facilities; success of planned development projects; and other development and operating risks. Should one or more of these risks or uncertainties materialize, or should underlying assumptions prove incorrect, actual results may vary materially from those anticipated, believed, estimated or expected. Although Energy Fuels believes that the assumptions inherent in the forward-looking statements are reasonable, undue reliance should not be placed on these statements, which only apply as of the date of this presentation. Energy Fuels does not undertake any obligation to publicly update or revise any forward-looking information or forward looking statements after the date of this presentation to conform such information to actual results or to changes in Energy Fuels’ expectations except as otherwise required by applicable legislation. Additional information about the material factors or assumptions on which forward looking information is based or the material risk factors that may affect results is contained under “Risk Factors” in Energy Fuels' annual report on Form 10-K for the year ended December 31, 2017 which was filed with the SEC on March 9, 2018. These documents are available on SEDAR at www.sedar.com and on EDGAR at www.sec.gov.
25

NOTICE REGARDING TECHNICAL DISCLOSURE
All of the technical information in this presentation concerning Energy Fuels’ properties was prepared in accordance with the Canadian regulatory requirements set out in National Instrument 43-101 - Standards of Disclosure for Mineral Projects of the Canadian Securities Administrators (“NI 43-101”). The technical information on each of the properties which are currently material to Energy Fuels is based on independent technical reports prepared in accordance with NI 43-101, as detailed below. The following technical reports are available for viewing at www.sedar.com under Energy Fuels’ SEDAR profile: Technical information regarding Energy Fuels’ Colorado Plateau properties is based on the following technical reports: (i) “Technical Report on the Henry Mountains Complex Uranium Property, Utah, U.S.A.” dated June 27, 2012 authored by William E. Roscoe, Ph.D., P.Eng., Douglas H. Underhill, Ph.D., C.P.G., and Thomas C. Pool, P.E. of Roscoe Postle Associates Inc.; (ii) “Updated Report on The Daneros Mine Project, San Juan County, Utah, U.S.A.“ dated March 2, 2018 authored by Douglas C. Peters, C.P.G., of Peters Geosciences; (iii) “Updated Technical Report on Sage Plain Project (Including the Calliham Mine), San Juan County, Utah, USA” dated March 18, 2015 authored by Douglas C. Peters, C.P.G., of Peters Geosciences; (iv) “Updated Technical Report on Energy Fuels Resources Corporation’s Whirlwind Property (Including Whirlwind, Far West, and Crosswind Claim Groups and Utah State Metalliferous Minerals Lease ML-49312), Mesa County, Colorado and Grand County, Utah” dated March 15, 2011 authored by Douglas C. Peters, C.P.G., of Peters Geosciences. Technical information regarding Energy Fuels’ Arizona Strip properties is based on the following technical reports: (i) "Technical Report on the Arizona Strip Uranium Project, Arizona, U.S.A.“ dated June 27, 2012 and authored by Thomas C. Pool, P.E. and David A. Ross, M. Sc., P.Geo. of Roscoe Postle Associates Inc.; (ii) "Technical Report on the EZ1 and EZ2 Breccia Pipes, Arizona Strip District, U.S.A.“ dated June 27, 2012 and authored by David A. Ross, M.Sc., P.Geo. and Christopher Moreton, Ph.D., P.Geo., of Roscoe Postle Associates Inc.; (iii) “NI 43-101 Technical Report on Resources Wate Uranium Breccia Pipe – Northern Arizona, USA” dated March 10, 2015 and authored by Allan Moran, CPG AIPG and Frank A. Daviess, MAusIM, RM SME of SRK Consulting (US), Inc.; and (iv) “Technical Report on the Canyon Mine, Coconino County, Arizona, U.S.A.” dated October 6, 2017, and authored by Mark B. Mathisen, C.P.G., Valerie Wilson, M.Sc., P.Geo., and Jeffrey L. Woods, QP MMSA of Roscoe Postle Associates. The technical information in this presentation regarding the Sheep Mountain Project is based on the technical report entitled “Sheep Mountain Uranium Project Fremont County, Wyoming USA – Updated Preliminary Feasibility Study – National Instrument 43-101 Technical Report” dated April 13, 2012 authored by Douglas L. Beahm P.E., P.G. The technical information in this presentation regarding the Roca Honda Project is based on the technical report entitled “Technical Report on the Roca Honda Project, McKinley County, New Mexico, U.S.A.” dated October 27, 2016 authored by Robert Michaud, P.Eng; Stuart E. Collins, P.E.; Mark B. Mathisen, CPG, of RPA (USA) Ltd. and Harold R. Roberts, P.E. and COO of Energy Fuels. The technical information in this presentation regarding the La Sal project is based on a technical report entitled “Technical Report on La Sal District Project (Including the Pandora, Beaver and Energy Queen Projects), San Juan County, Utah, U.S.A.” dated March 26, 2014 authored by Douglas C. Peters, CPG. The technical information in this presentation regarding the Alta Mesa ISR Project is based on a technical report entitled “Alta Mesa Uranium Project, Alta Mesa and Mesteña Grande Mineral Resources and Exploration Target, Technical Report National Instrument 43-101”, dated July 19, 2016 authored by Douglas L. Beahm, P.E., P.G. of BRS Engineering. The following technical reports are available for viewing at www.sedar.com under Uranerz’ SEDAR profile: The technical information in this presentation regarding the Nichols Ranch, Jane Dough, and Hank properties is based on the technical report entitled “Nichols Ranch Uranium Project 43-101 Technical Report – Preliminary Economic Assessment - Campbell and Johnson Counties, Wyoming" dated February 25, 2015” authored by Douglas L. Beahm, P.E., P.G. of BRS and Paul Goranson, P.E. of Uranerz Energy Corporation. The technical information in this presentation regarding the Reno Creek Property is based on the technical report entitled “Reno Creek Property: "Technical Report - Reno Creek Property- Campbell County, Wyoming, U.S.A." dated October 13, 2010” authored by Douglass H. Graves, P.E. of TREC, Inc. The technical information in this presentation regarding Uranerz’ West North Butte Properties is based on the technical report entitled “West North Butte Properties: "Technical Report - West North Butte Satellite Properties - Campbell County, Wyoming, U.S.A." dated December 9, 2008” Douglass H. Graves, P.E. of TREC, Inc. The technical information in this presentation regarding Uranerz’ North Rolling Pin Property is based on the technical report entitled " North Rolling Pin Property: "Technical Report - North Rolling Pin Property - Campbell County, Wyoming, U.S.A." dated June 4, 2010” authored by Douglass H. Graves, P.E. of TREC, Inc. John White, P.E., is a Qualified Person as defined by NI 43-101 and has reviewed and approved the technical disclosure contained in this document.
26

CAUTIONARY STATEMENTS FOR US INVESTORS CONCERNING MINERAL RESOURCES
This presentation may use the terms "Measured", "Indicated“ and "Inferred" Resources. U.S. investors are advised that, while such terms are recognized and required by Canadian regulations, the United States Securities and Exchange Commission (“SEC”) does not recognize them. "Inferred Resources" have a great amount of uncertainty as to their existence, and great uncertainty as to their economic feasibility. It cannot be assumed that all or any part of an Inferred Resource will ever be upgraded to a higher category. Under Canadian rules, estimates of Inferred Resources may not form the basis of feasibility or pre-feasibility studies. U.S. investors are cautioned not to assume that all or any part of Measured or Indicated Mineral Resources will ever be converted into Mineral Reserves. Accordingly, U.S. investors are advised that information regarding Mineral Resources contained in this presentation may not be comparable to similar information made public by United States companies. Mineral resources disclosed in this presentation and in the NI 43-101 technical reports referenced herein have been estimated in accordance with the definition standards on mineral resources and mineral reserves of the Canadian Institute of Mining, Metallurgy and Petroleum referred to in National Instrument 43-101, commonly referred to as "NI 43-101". The NI 43-101 technical reports may include estimations of potential mineral resources for further targeted exploration by Energy Fuels, disclosed pursuant to the applicable provisions of NI 43-101.The NI 43-101 technical reports referenced herein are a requirement of NI 43-101 and includes estimations of mineral resources and potential mineral resources for further targeted exploration by the issuer disclosed pursuant to the applicable provisions of NI 43-101. As a company listed on the TSX, Energy Fuels is required by Canadian law to provide disclosure in accordance with NI 43-101. US reporting requirements for disclosure of mineral properties are governed by the SEC and included in the SEC's Securities Act Industry Guide 7 entitled "Description of Property by Issuers Engaged or to be Engaged in Significant Mining Operations" ("Guide 7"). NI 43-101 and Guide 7 standards are substantially different. For example, the terms "mineral reserve", "proven mineral reserve" and "probable mineral reserve" are Canadian mining terms as defined in accordance with NI 43-101. These definitions differ from the definitions in Guide 7. The NI 43-101 technical reports and this presentation use or may use the terms “probable mineral reserve”, "mineral resource“, “measured mineral resource”, “indicated mineral resource”, “Inferred mineral resource”, "potential uranium exploration target", "potential mineral resource", "potential mineral deposit" and "potential target mineral resource". US Investors are advised that these terms and concepts are set out in and required to be disclosed by NI 43-101 as information material to the issuer; however, these terms and concepts are not recognized by the SEC or included in Guide 7, and these terms and concepts are normally not permitted to be used in reports and registration statements filed with the SEC. US Investors should be aware that Energy Fuels has no "reserves" as defined by Guide 7 and are cautioned not to assume that any part or all of an inferred mineral resource or potential target mineral resources will ever be upgraded to a higher category or confirmed or converted into Guide 7 compliant "reserves". US Investors are cautioned not to assume that all or any part of a potential mineral resource exists, or is economically or legally mineable.
27

RESOURCE SUMMARY
URANIUM Measured Indicated Inferred Tons (‘000) Grade (% U3O8) Lbs. U3O8 (‘000) Tons (‘000) Grade (% U3O8) Lbs. U3O8 (‘000) Tons (‘000) Grade (% U3O8) Lbs. U3O8 (‘000)
Nichols Ranch 641 0.13% 1,694 428 0.13% 1,079 - - - Jane Dough2 - - - 1,533 0.11% 3,567 138 0.11% 309 Hank2 - - - 450 0.10% 855 423 0.10% 803 West North Butte Satellite Properties - - - 926 0.15% 2,837 1,117 0.12% 2,682 North Rolling Pin 310 0.06% 387 272 0.05% 278 39 0.04% 33 Arkose Mining Venture2 - - - - - - 1,667 0.10% 3,293 Wyoming ISR Total 951 0.11% 2,081 3,609 0.12% 8,616 3,384 0.11% 7,120
Alta Mesa ISR Project 123 0.15% 371 1,512 0.11% 3,246 6,964 0.12% 16,794
Henry Mountains Complex - - - 2,410 0.27% 12,805 1,615 0.25% 8,082
Sheep Mountain Project1 - - - 12,895 0.12% 30,285 - - -
Roca Honda Project 208 0.48% 1,984 1,303 0.48% 12,580 1,198 0.47% 11,206
Canyon 6 0.43% 56 132 0.90% 2,378 18 0.44% 134 Wate - - - - - - 71 0.79% 1,118 EZ Complex - - - - - - 224 0.47% 2,105 Arizona 1 - - - - - - 26 0.26% 134 Arizona Strip Total 6 0.43% 56 132 0.90% 2,378 339 0.51% 3,491
La Sal Complex 1,010 0.18% 3,732 132 0.14% 367 185 0.10% 361 Whirlwind - - - 169 0.30% 1,003 437 0.23% 2,000 Daneros - - - 20 0.36% 142 7 0.37% 52 Sage Plain 444 .18 1,540 31 0.11% 71 12 0.16% 37 Colorado Plateau Total 1,453 0.18% 5,272 352 0.22% 1,583 641 0.19% 2,450
Total Uranium 9,764 71,493 49,143
1 Sheep Mountain Project’s 30m lbs. of Indicated Resources includes Probable Mineral Reserves of 18.4 million lbs. of U3O8 contained in 7.4 million tons at a grade of 0.123% U3O8 in accordance with NI 43-101. 2 Figure includes only joint venture share of mineral resources applicable to Energy Fuels.
28
VANADIUM Tons (‘000) Grade (% V2O5) Lbs. V2O5 (‘000) Tons (‘000) Grade (% V2O5) Lbs. V2O5 (‘000) Tons (‘000) Grade (% V2O5) Lbs. V2O5 (‘000)
La Sal Complex 1,010 0.97% 19,596 132 0.73% 1,930 185 0.51% 1,902 Other 240 1.32% 6,350 198 0.96% 3,816 447 0.74% 6,600
COPPER Tons (‘000) Grade (% Cu) Lbs. Cu (‘000) Tons (‘000) Grade (% Cu) Lbs. Cu (‘000) Tons (‘000) Grade (% Cu) Lbs. Cu (‘000)
Canyon 6 9.29% 1,203 94 5.70% 10,736 5 5.90% 570
Cautionary Note to U.S. Investors: The Company is without known mineral reserves under SEC Industry Guide 7. Measured, Indicated, and Inferred Resources are estimated in accordance with NI 43-101 (Canada) and do not constitute SEC Industry Guide 7 compliant reserves. See the section heading “Cautionary Statements for U.S. investors Concerning Mineral Resources” herein.

UUUU | NYSE American EFR | TSX Energy Fuels Inc. 225 Union Blvd., Suite 600 Lakewood, Colorado 80228 USA www.energyfuels.com 303-974-2140 [email protected]


