Uranium Weekly – January 30, 2015 Colin Healey, MBA604-697-6089[email protected]Member of the Canadian Investor Protection Fund Please see page 11 for analyst certification, important information and legal disclaimers, page 13 for risk profile definitions, and pages 11 - 15 for rating structure, disclaimers, and notes. Company Target Price Producers Paladin (PDN-TSX): $0.50 Energy Fuels (EFR-TSX): RESTRICTED Uranium Energy (UEC-AMEX): US$1.70 Uranerz (URZ-AMEX): RESTRICTED Ur-Energy (URE-TSX): $1.80 N.A. Developers & Explorers Denison Mines (DML-TSX): $2.10 Uranium Inventory Fund Uranium Participation (U-TSX): $6.20 Company Performance Page 7-9 U Prices Trending Positively this Week (↑2%), Bodes Well for Spot Up-Tick Monday Uranium Market Synopsis and Pricing Data: January 29 th , 2015 BAP (Broker Average Price) US$37.50 (UxC U 3 O 8 -1 lb): ↑$0.87/lb to Thursday BAP is up +2.0% in last 7-days, and sits $0.75/lb above Monday’s spot Spot Price US$36.75 (UxC U 3 O 8 -1 lb): Up $0.25/lb (Monday, January 26 th ) 2014 High/Low: $44.00/$28.00; 2013 High/Low: $44.00/$34.00 Long-term (LT) Price US$49.00 (UxC U 3 O 8 -1 lb): (unchanged, adjusted monthly) LT – Spot spread decreases to $12.25/lb as spot price increases $0.25/lb on Monday Covered Uranium Companies: Haywood Securities (see pages 3-4) Source: Bloomberg, Capital IQ, Haywood Securities Haywood Commentary Throughout this week, we have watched the daily UxC Broker Average Price (BAP) of uranium trend positively from last Thursday’s close of $36.75/lb U 3 O 8 , to close Thursday night at $37.50/lb U 3 O 8 , now sitting $0.75/lb, or 2.0% above Monday’s (22 nd ) spot price of $36.75/lb. With the BAP well above last spot as we exit the week, the prospects for an upward adjustment in spot price Monday (2 nd ) increase substantially. We had seen seven consecutive week-over-declines in spot price before the trend reverse on Monday January 12 th , followed by two additional weekly upticks, as a distinct lack of interest prevailed as we approached year-end. Some interest appears to be trickling back into the spot market, providing some support for the uranium price this week, and we believe some speculative money is returning in anticipation of reactor restarts in Japan. Equities trended decidedly opposite the commodity over the last seven days, and 7 months, as shown in the grapghic above, with few exceptions, as broader markets retraced, uranium prices are up31% from last summer, while our mixed groupings of uranium equities are down an average of 22% over the same period. At a Haywood-estimated Fund-Implied-Price (FIP) of $32.65/lb U 3 O 8 Thursday night, Uranium Participation Corp. (U-TSX), the physical uranium holding fund, continues to maintain a significant discount to spot and BAP at >13%, as shown on page 4. In 2014, the FIP of uranium (in U-TSX) traded at an average premium to BAP of about 8%, reaching greater than 20% as it led the commodity higher. The current >13% discount certainly suggests the market’s unwillingness to speculate on a repeat performance of the commodity near-term. U 3 O 8 (USD per pound) LT (Last Δ Nov. 24 th ): $49.00 (+$4.00) BAP + (Jan.22 nd -29 th ): $37.50 (+$0.87) SPOT (Jan. 19 th -26 th ): $36.75 (+$0.25) U FIP # (Jan.22 nd -29 th ): $32.65 (+$0.45) + BAP (Broker Average Price, Daily Pricing) # Uranium Participation (U:TSX) Implied Inventory value (Haywood Estimate)
Member of the Canadian Investor Protection Fund Please see page 11 for analyst certification, important information and legal disclaimers, page 13 for risk profile definitions, and pages 11 - 15 for rating structure, disclaimers, and notes.
Company Target Price
Producers
Paladin (PDN-TSX): $0.50
Energy Fuels (EFR-TSX): RESTRICTED
Uranium Energy (UEC-AMEX): US$1.70
Uranerz (URZ-AMEX): RESTRICTED
Ur-Energy (URE-TSX): $1.80
N.A. Developers & Explorers
Denison Mines (DML-TSX): $2.10
Uranium Inventory Fund
Uranium Participation (U-TSX): $6.20
Company Performance Page 7-9
U Prices Trending Positively this Week (↑2%), Bodes Well for Spot Up-Tick Monday
Uranium Market Synopsis and Pricing Data: January 29th, 2015
BAP (Broker Average Price) US$37.50 (UxC U3O8-1 lb): ↑$0.87/lb to Thursday
BAP is up +2.0% in last 7-days, and sits $0.75/lb above Monday’s spot
Spot Price US$36.75 (UxC U3O8-1 lb): Up $0.25/lb (Monday, January 26th)
LT – Spot spread decreases to $12.25/lb as spot price increases $0.25/lb on Monday
Covered Uranium Companies: Haywood Securities (see pages 3-4)
Source: Bloomberg, Capital IQ, Haywood Securities
Haywood Commentary
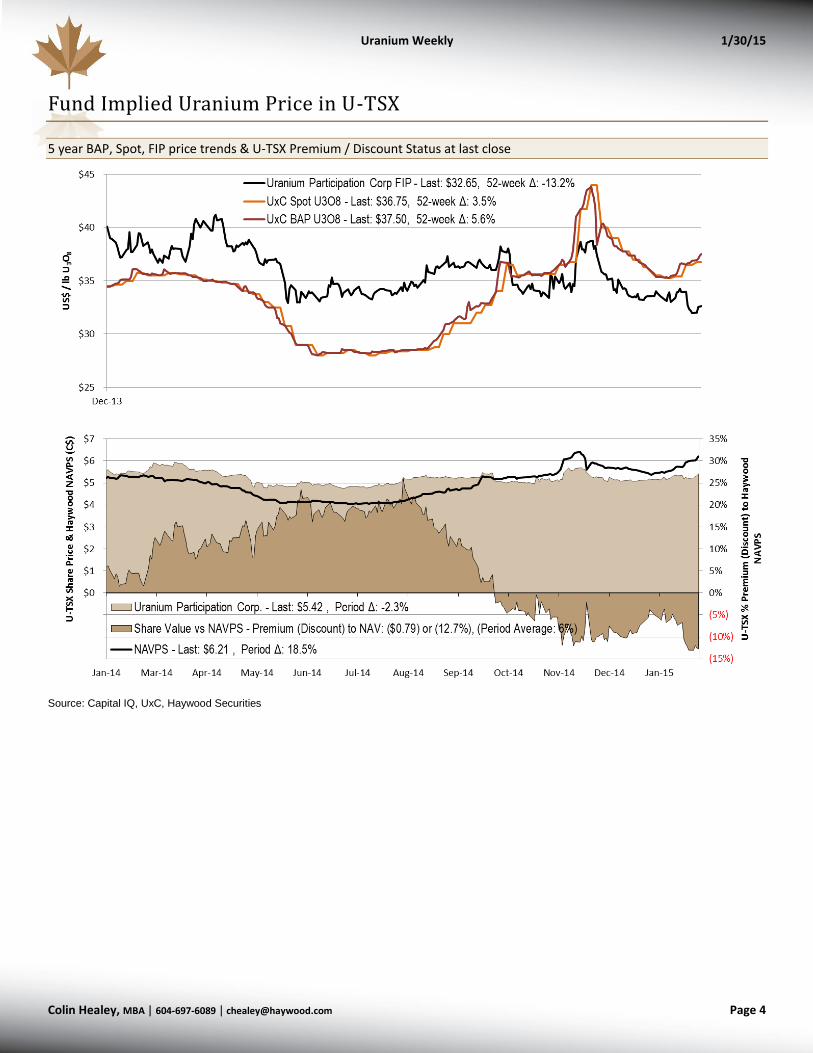
Throughout this week, we have watched the daily UxC Broker Average Price (BAP) of uranium trend positively from last Thursday’s close of $36.75/lb U3O8, to close Thursday night at $37.50/lb U3O8, now sitting $0.75/lb, or 2.0% above Monday’s (22nd) spot price of $36.75/lb. With the BAP well above last spot as we exit the week, the prospects for an upward adjustment in spot price Monday (2nd) increase substantially. We had seen seven consecutive week-over-declines in spot price before the trend reverse on Monday January 12th, followed by two additional weekly upticks, as a distinct lack of interest prevailed as we approached year-end. Some interest appears to be trickling back into the spot market, providing some support for the uranium price this week, and we believe some speculative money is returning in anticipation of reactor restarts in Japan. Equities trended decidedly opposite the commodity over the last seven days, and 7 months, as shown in the grapghic above, with few exceptions, as broader markets retraced, uranium prices are up31% from last summer, while our mixed groupings of uranium equities are down an average of 22% over the same period. At a Haywood-estimated Fund-Implied-Price (FIP) of $32.65/lb U3O8 Thursday night, Uranium Participation Corp. (U-TSX), the physical uranium holding fund, continues to maintain a significant discount to spot and BAP at >13%, as shown on page 4. In 2014, the FIP of uranium (in U-TSX) traded at an average premium to BAP of about 8%, reaching greater than 20% as it led the commodity higher. The current >13% discount certainly suggests the market’s unwillingness to speculate on a repeat performance of the commodity near-term.
U3O8 (USD per pound)
LT (Last Δ Nov. 24th): $49.00 (+$4.00)
BAP+
(Jan.22nd-29th): $37.50 (+$0.87)
SPOT (Jan. 19th-26th): $36.75 (+$0.25)
UFIP# (Jan.22nd-29th): $32.65 (+$0.45)
+ BAP (Broker Average Price, Daily Pricing) #Uranium Participation (U:TSX) Implied Inventory value
Weekly Performance: Selected Tabulated Companies (January 22nd to January 29th)
We saw negative average performance for our subgroups over the 7-day period ended January 29th. Average group performance was ↓1.0% over the past week. The average 8-week change for our 46-company group was ↓6.2%.
Our subgroups summarize for the week as follows: 11 of 46 (24%) posted a gain, while 23 (50%) lost ground, with 12 unchanged. On average our group (↓1.0%) under-performed the TSX (↑0.7%). Turnover was down for producers and explorers, but up for near-term producers/developers.
Best Performers (Top 5) Worst Performers (Top 5) Company Return Company Return
EUU-V 33.3 % No attributable news EME-AU (14.8)% No attributable news
PDN-AU 12.1 % No attributable news MTN-AU (12.5)% No attributable news
UEC 11.7 % No attributable news YEL-V (12.5)% No attributable news
KIV-V 11.1 % No attributable news GEM-V (12.5)% No attributable news
There was no new activity on the futures market over the past week. June 2017 is the largest open interest contract. Total open interest stands at 4,172 contracts representing 1,043,000 lb U3O8.
Futures settlement prices were adjusted upward across the curve this week in response to the upward trend in Broker Average Price this week, and the current futures strip still sits well above the strip at the beginning of 2014, a condition which has prevailed since October 2014. The spread between near-term (February 2015) and further out (June 2017) prices contracted this week to $6.15 (from $5.60), as the strip curve continues to flatten. Note: Only contracts out to June 2017 with open interest are shown below.
Uranium Financial Futures – Year-to-Date Change
Sources: Bloomberg and Haywood Securities
Demand Activity
Spot Market: In a slower week for the spot market, UxC reported five (5) new transactions since last week’s numbers.
This added ~0.6 million lb U3O8 to the year-to-date spot market volume, leaving the 2015 total at 13 deals for 1.5 Mlb
U3O8e. We note that the UxC recently indicated that over the Q3`14 quarter, of the 93 transactions booked (for 12.2
Mlb U3O8): only 11 transactions (for 1.7 Mlb) were carried out for utilities (14% of volume), with traders
accounting for 9 Mlb, or about 74% of trading volume.
o UxC Spot activity in:
2014: 42.1 million lb U3O8e (294 transactions)
2013: 50.4 million lb U3O8e
2012: 40.3 million lb U3O8e
2011: 41.7 million lb U3O8e
Long-Term Market YTD: Thus far in 2015 only a couple of non-utility mid-term purchases have been reported in the term
market. UxC reported that interest in the term market is “active”, with several utilities expected to enter the market over
the next couple months. No new demand was reported to have entered the market last week.
Important Information and Legal Disclaimers This report is neither a solicitation for the purchase of securities nor an offer of securities. Our ratings are intended only for clients of Haywood Securities Inc., and those of its wholly owned subsidiary, Haywood Securities (USA) Inc. and such clients are cautioned to consult the respective firm prior to purchasing or selling any security recommended or views contained in this report.
Estimates and projections contained herein, whether or not our own, are based on assumptions that we believe to be reasonable. The information presented, while obtained from sources we believe reliable, is checked but not guaranteed against errors or omissions. Changes in the rates of exchange between currencies may cause the value of your investment to fluctuate. Past performance should not be seen as an indication of future performance. The investments to which this report relates can fluctuate in value and accordingly you are not certain to make a profit on any investment: you could make a loss.
Haywood Securities, or certain of its affiliated companies, may from time to time receive a portion of commissions or other fees derived from the trading or financings conducted by other affiliated companies in the covered security. Haywood analysts are salaried employees who may receive a performance bonus that may be derived, in part, from corporate finance income.
Haywood Securities, Inc., and Haywood Securities (USA) Inc. do have officers in common however, none of those common officers affect or control the ratings given a specific issuer or which issuer will be the subject of Research coverage. In addition, the firm does maintain and enforce written policies and procedures reasonably designed to prevent influence on the activities of affiliated analysts.
Dissemination of Research Research reports are disseminated either through electronic medium or in printed copy. Clients may access reports on our website, or receive publications directly via email. Haywood strives to ensure all clients receive research in a timely manner and at the same time. It is against our policy for analysts to discuss or circulate their recommendations internally prior to public distribution. This policy applies equally to recommendation changes, target changes and/or forecast revisions.
For Canadian residents: Haywood Securities Inc. is a Canadian registered broker-dealer and a member of the Investment Industry Regulatory Organization of Canada, the Toronto Stock Exchange, the Toronto Venture Exchange and the Canadian Investor Protection Fund and accepts responsibility for the dissemination of this report. Any Canadian client that wishes further information on any securities discussed in this report should contact a qualified salesperson of Haywood Securities Inc.
For U.S. residents: This investment research is distributed in the United States, as third party research by Haywood Securities (USA) Inc. Haywood Securities (USA) Inc. is a wholly owned subsidiary of Haywood Securities Inc., registered with the U.S. Securities and Exchange Commission, and is a member of FINRA and the Securities Investor Protection Corporation (SIPC). Haywood Securities (USA) Inc. as a U.S. registered broker-dealer accepts responsibility for this Research Report and its dissemination in the United States. Any U.S. client that wishes further information on any securities discussed in this report or wish to effect a transaction in these securities should contact a qualified salesperson of Haywood Securities (USA) Inc. Haywood Securities Inc. Research Analysts are considered Foreign Research Analysts to the USA and are not registered/qualified as Research Analysts with FINRA. As these analysts are considered Foreign Research Analysts they may not be specifically subject to FINRA (formerly NASD) Rule 2711 and FINRA (formerly NYSE) Rule 472 restrictions on communications with a Subject Company, Public Appearances and trading securities held by a Research Analyst Account.
This report may be distributed in the following states: nil. Otherwise, this report may only be distributed into those states with an institutional buyer state securities registration exemption.
Analyst Certification I, Colin Healey, hereby certify that the views expressed in this report (which includes the rating assigned to the issuer’s shares as well as the analytical substance and tone of the report) accurately reflect my/our personal views about the subject securities and the issuer. No part of my/our compensation was, is, or will be directly or indirectly related to the specific recommendations.
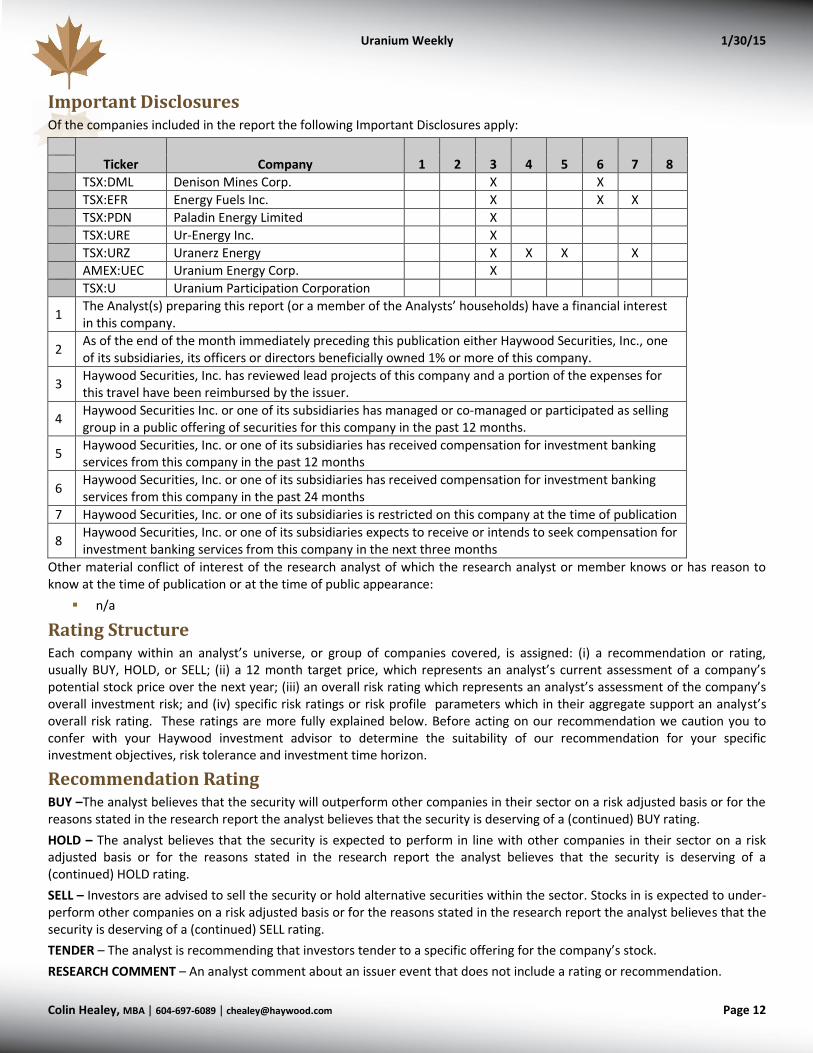
Important Disclosures Of the companies included in the report the following Important Disclosures apply:
Ticker Company 1 2 3 4 5 6 7 8
TSX:DML Denison Mines Corp. X X
TSX:EFR Energy Fuels Inc. X X X
TSX:PDN Paladin Energy Limited X
TSX:URE Ur-Energy Inc. X
TSX:URZ Uranerz Energy X X X X
AMEX:UEC Uranium Energy Corp. X
TSX:U Uranium Participation Corporation
1 The Analyst(s) preparing this report (or a member of the Analysts’ households) have a financial interest in this company.
2 As of the end of the month immediately preceding this publication either Haywood Securities, Inc., one of its subsidiaries, its officers or directors beneficially owned 1% or more of this company.
3 Haywood Securities, Inc. has reviewed lead projects of this company and a portion of the expenses for this travel have been reimbursed by the issuer.
4 Haywood Securities Inc. or one of its subsidiaries has managed or co-managed or participated as selling group in a public offering of securities for this company in the past 12 months.
5 Haywood Securities, Inc. or one of its subsidiaries has received compensation for investment banking services from this company in the past 12 months
6 Haywood Securities, Inc. or one of its subsidiaries has received compensation for investment banking services from this company in the past 24 months
7 Haywood Securities, Inc. or one of its subsidiaries is restricted on this company at the time of publication
8 Haywood Securities, Inc. or one of its subsidiaries expects to receive or intends to seek compensation for investment banking services from this company in the next three months
Other material conflict of interest of the research analyst of which the research analyst or member knows or has reason to know at the time of publication or at the time of public appearance:
n/a
Rating Structure Each company within an analyst’s universe, or group of companies covered, is assigned: (i) a recommendation or rating, usually BUY, HOLD, or SELL; (ii) a 12 month target price, which represents an analyst’s current assessment of a company’s potential stock price over the next year; (iii) an overall risk rating which represents an analyst’s assessment of the company’s overall investment risk; and (iv) specific risk ratings or risk profile parameters which in their aggregate support an analyst’s overall risk rating. These ratings are more fully explained below. Before acting on our recommendation we caution you to confer with your Haywood investment advisor to determine the suitability of our recommendation for your specific investment objectives, risk tolerance and investment time horizon.
Recommendation Rating BUY –The analyst believes that the security will outperform other companies in their sector on a risk adjusted basis or for the reasons stated in the research report the analyst believes that the security is deserving of a (continued) BUY rating.
HOLD – The analyst believes that the security is expected to perform in line with other companies in their sector on a risk adjusted basis or for the reasons stated in the research report the analyst believes that the security is deserving of a (continued) HOLD rating.
SELL – Investors are advised to sell the security or hold alternative securities within the sector. Stocks in is expected to under-perform other companies on a risk adjusted basis or for the reasons stated in the research report the analyst believes that the security is deserving of a (continued) SELL rating.
TENDER – The analyst is recommending that investors tender to a specific offering for the company’s stock.
RESEARCH COMMENT – An analyst comment about an issuer event that does not include a rating or recommendation.
UNDER REVIEW – Placing a stock Under Review does not revise the current rating or recommendation of the analyst. A stock will be placed Under Review when the relevant company has a significant material event with further information pending or to be announced. An analyst will place a stock Under Review while he/she awaits sufficient information to re-evaluate the company’s financial situation.
COVERAGE DROPPED – Haywood Securities will no longer cover the issuer. Haywood will provide notice to clients whenever coverage of an issuer is discontinued.
Haywood's focus is to search for undervalued companies which analysts believe may achieve attractive risk-adjusted returns. This research coverage on potentially undervalued companies may result in an outweighed percentage of companies rated as BUY. Management regularly reviews rating and targets in all sectors to ensure fairness and accuracy.
For further information on Haywood Securities’ research dissemination policies, please visit: http://www.haywood.com/research_dissemination.asp
Overall Risk Rating Very High Risk: Venture type companies or more established micro, small, mid or large cap companies whose risk profile parameters and/or lack of liquidity warrant such a designation. These companies are only appropriate for investors who have a very high tolerance for risk and volatility and who are capable of incurring temporary or permanent loss of a very significant portion of their investment capital.
High Risk: Typically micro or small cap companies which have an above average investment risk relative to more established or mid to large cap companies. These companies will generally not form part of the broad senior stock market indices and often will have less liquidity than more established mid and large cap companies. These companies are only appropriate for investors who have a high tolerance for risk and volatility and who are capable of incurring a temporary or permanent loss of a significant loss of their investment capital.
Medium-High Risk: Typically mid to large cap companies that have a medium to high investment risk. These companies will often form part of the broader senior stock market indices or sector specific indices. These companies are only appropriate for investors who have a medium to high tolerance for risk and volatility and who are prepared to accept general stock market risk including the risk of a temporary or permanent loss of some of their investment capital
Moderate Risk: Large to very large cap companies with established earnings who have a track record of lower volatility when compared against the broad senior stock market indices. These companies are only appropriate for investors who have a medium tolerance for risk and volatility and who are prepared to accept general stock market risk including the risk of a temporary or permanent loss of some of their investment capital.
Risk Profile Parameters – Mining and Minerals Sector Forecast Risk: High (7-10) – The Company's primary project(s) is at an earlier stage of exploration and/or resource delineation whereby grades, tonnages, capital and operating costs, and other economic/operational parameters are not yet reliably established. Moderate (4-6) – The Company has taken steps to de-risk its primary producing, or soon to be producing project(s) and has established reasonably reliable operational and economic parameters. Low (1-3) – The Company has de-risked the majority of its primary project(s) through operational history and established production profile(s).
Financial Risk: High (7-10) – The Company’s near- and medium-term (capital) expenditure considerations, including the current year or next forecast year, are not fully funded through a combination of established debt facilities, cash on hand, and/or anticipated cash flow from existing operations—successful project execution depends, in part, on future (equity) financing(s). Existing and/or forecast levels of leverage are above average relative to the Company's peer group. The risk of a significant capital cost overrun(s) is high given the early stage of project development. Moderate (4-6) – The Company's near-term (capital) expenditure program, in the current year or next forecast year, is fully funded through a combination of established debt facilities, cash on hand, and/or anticipated cash flow from existing operations. Medium-term funding requirements will likely require additional financing consideration, but should be achievable assuming no significant uncontrollable events impede access to capital. Existing and/or forecast levels of leverage are in-line with the Company's peer group. The risk of a significant capital cost overrun(s) is moderate given the advanced stage of project development. Low (1-3) – the Company's near- and medium-term (capital) expenditure program is fully funded through a combination of established debt facilities, cash on hand, and/or anticipated cash flow from existing operations. Existing and/or forecast levels of leverage are below average relative to the Company's peer group.
Valuation Risk: High (7-10) – The current valuation is at a premium to peers. The valuation reflects considerable future exploration success and/or commodity appreciation. Where applicable, the current capitalization exceeds the “DCF” evaluation by more than 50%. Moderate (4-6) – The current valuation is within historic ranges and generally consistent with peers. The valuation reflects reasonable exploration success and/or commodity appreciation. Where applicable, the current capitalization exceeds the DCF valuation by 15% to 50%. Low (1-3) – The current valuation is at the low end of historic ranges and at a discount to peer valuations. The valuation reflects limited new exploration success and no commodity appreciation. Where applicable, the current capitalization exceeds the DCF valuation by less than 15% or falls below the current market value.
Political Risk: High (7-10) –Obtaining permits is challenging. Properties are located in an area(s) with high geo-political uncertainty, limited access, and/or have significant new infrastructure requirements. Moderate (4-6) – Properties are located in an area(s) with moderate geo-political risk, reasonable or manageable access, and some established infrastructure. Low (1-3) – Properties are located in areas with a manageable geo-political risk profile and established access/infrastructure.
Distribution of Ratings (as of January 30, 2015)
Distribution of Ratings IB Clients
% # (TTM)
Buy 49.6% 70 86.4%
Hold 8.5% 12 9.1%
Sell 2.1% 3 4.5%
Tender 0.7% 1 0.0%
UR (Buy) 0.7% 1 0.0%
UR (Hold) 0.0% 0 0.0%
UR (Sell) 0.0% 0 0.0%
dropped (TTM) 38.3% 54 0.0%
Price Chart, Rating and Target Price History (as of January 30, 2015)