39
Leasing momentum boosting construction demand, but costs growing United States Construction Perspective Q4 2014
| Date post: | 15-Jul-2015 |
| Category: |
Economy & Finance |
| Upload: | jll |
| View: | 4,765 times |
| Download: | 4 times |

Leasing momentum boosting construction demand, but costs growing
United States Construction
Perspective
Q4 2014

Construction starts increased in 2014, driven by improved demand from the office and industrial sectors in energy producing markets, along with traditional office markets like New York City. Even as demand explodes, cost to build is higher than ever, thanks to the continued inflation of labor and materials costs.
Due to the recent decline in energy costs, construction will shrink in Texas, a reversal from 2014 trends. Interest rates are also projected to grow, creating a potential dip in construction activity. Still, this growth cycle should last another two to three years.

Did you know? U.S. construction metrics
3
2.0%
The construction industry remains 22 .0 percent below peak levels. According to
Gilbane, it may take seven to eight more years to retain previous levels.
Cost for material inputs in all construction in the last 12 months. Cost for materials
for non-residential construction increased 1.4 percent during that time. Prices are
projected to continued growth, though many inputs will decline in price after 2015.
22.0%
The construction industry has grown every month of 2014, gaining 48,000 jobs in
December to reach 290,000 total in 2014. However, overall construction
unemployment is still 1.5 million lower than the peak in 2007.
Spent in wages in Commercial Building in 2014, approximately 48.0 percent of
total revenue. Wages have continued to increase across the construction industry,
forcing up overall building costs. The industry average is approximately $42,000.
107.0M
$64.9B
Total nonresidential building completions exploded in Q2 2014, as 107.0 million
square feet of new space was completed, mostly in the industrial sector.
$982.0B Total construction spending in December 2014, up 2.2 percent
from December 2013.
Sources: JLL Research, Gilbane, Bureau of Labor Statistics, IBISWorld

National economic trends

Construction GDP is rebounding more quickly than overall GDP
5
Construction starts on backlogged projects across the United States spur sector growth
-15.0%
-10.0%
-5.0%
0.0%
5.0%
10.0%
1995 1996 1997 1998 1999 2000 2001 2002 2003 2004 2005 2006 2007 2008 2009 2010 2011 2012 2013 2014
Overall real GDP growth
Construction component growth
Construction GDP has
increased more quickly than
overall GDP since 2012.
Overall GDP growth in Q4 2014 2.6%
Source: JLL Research, Bureau of Labor Statistics

Construction employment is growing faster than overall
employment
6
-15.0%
-10.0%
-5.0%
0.0%
5.0%
10.0%
Non-farm employment Construction employment
Construction jobs added
in 2014. 233k
Percent increase in
construction jobs back to
pre-recession levels.
However, overall productivity has declined,
despite the growth in construction
employment, as many new workers are
under-trained for construction jobs.
(percent chg. year-over-year)
Source: JLL Research, Bureau of Labor Statistics

Construction employment was disproportionately affected by
the recession
7
Thanks to a rebound in construction opportunities, construction unemployment should drop below
overall unemployment by 2017; this decline is partially due to a reduction in available construction
workers in the workforce.
0.0%
5.0%
10.0%
15.0%
20.0%
25.0%
1998 2000 2002 2004 2006 2008 2010 2012 2014 2016 2018 2020
Construction
unemployment rate
December 2014
8.3%
Overall
unemployment rate
December 2014
5.6%
Source: JLL Research, Bureau of Labor Statistics

The Architectural Billings Index, a leading indicator, has started
to increase
8
This indicates an aggregate jump in construction activity
20
25
30
35
40
45
50
55
60
ABI has reached more
than the baseline, 50,
indicating a rebound in
billing. The ABI reports
on the change in billings
from the previous month.
Source: JLL Research, American Institute of Architects, McGraw-Hill Dodge

The Construction Backlog Index is growing
9
Due to the rebound of construction activity in communities previously stagnated by the financial
crisis; the South is behind in construction, but is positioned to expand
Source: JLL Research, Associated Builders and Contractors
9.42mos
8.98mos
CB
I
10.2mos CB
I
6.93mos CB
I
Arrows represent change from one year ago
CB
I
National average
construction backlog
8.88mos

Cost trends: Labor and materials

Overall construction spending increased each quarter in 2014,
driven by nonresidential spending.
11
This trend is expected to continue in 2015
Source: JLL Research, Gilbane
-25.0%
-20.0%
-15.0%
-10.0%
-5.0%
0.0%
5.0%
10.0%
15.0%
20.0%
25.0%
2007 2008 2009 2010 2011 2012 2013 2014 2015
Nonresidential construction spending (Percent chg. year- over- year)

Education construction is approximated to have had the highest
overall spend in 2014.
12
Source: JLL Research, U.S. Census
Total spend Percent change year-over-year
Education $77.7 billion 3.9 percent
Healthcare $38.7 billion - 2.1 percent*
Commercial $60.1 billion 10.7 percent
Office $48.6 billion 17.6 percent
Manufacturing $60.9 billion 18.1 percent
* Decline due to decrease in public sector spending
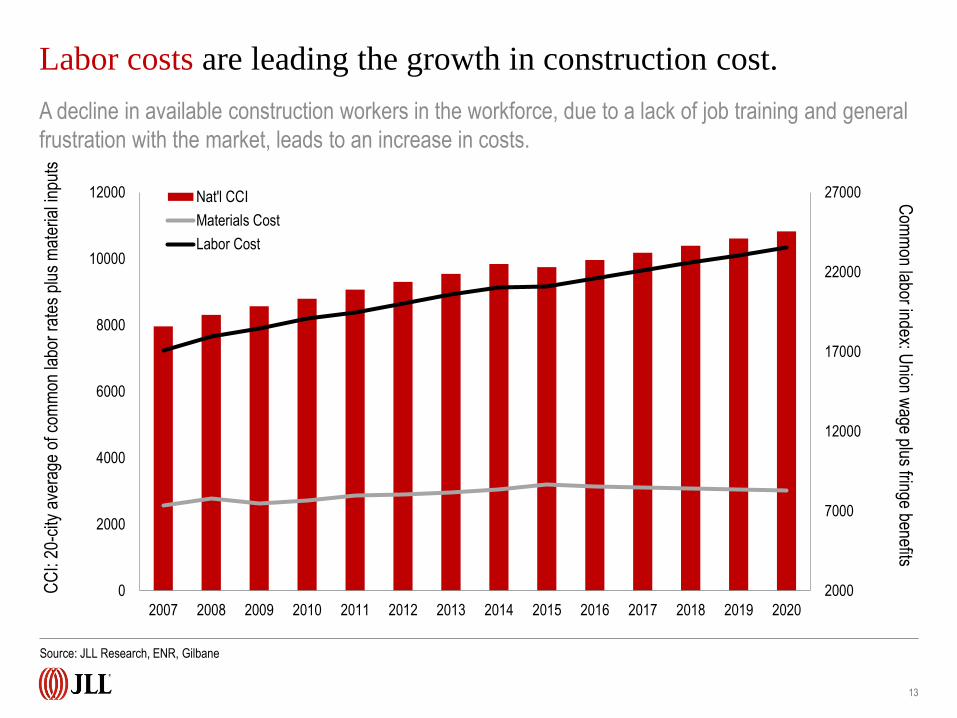
Labor costs are leading the growth in construction cost.
13
Source: JLL Research, ENR, Gilbane
A decline in available construction workers in the workforce, due to a lack of job training and general
frustration with the market, leads to an increase in costs.
2000
7000
12000
17000
22000
27000
0
2000
4000
6000
8000
10000
12000
2007 2008 2009 2010 2011 2012 2013 2014 2015 2016 2017 2018 2019 2020
Nat'l CCI
Materials Cost
Labor Cost
Com
mon labor index: U
nion wage plus fringe benefits
CC
I: 20
-city
ave
rage
of c
omm
on la
bor
rate
s pl
us m
ater
ial i
nput
s

New York City, Chicago, and Minneapolis lead the pack in terms
of high-cost construction.
14
Source: JLL Research, ENR
Cities with more land availability and lower labor costs maintain lower overall prices
Highest Cost
Lowest Cost
Dallas (Has not grown significantly)
Denver, CO
Atlanta (Increase for the first time
in 2014 since 2008)
Pittsburgh
New York City
Chicago
Minneapolis (Large spike in
cost in 2014)
Boston
Los Angeles
Philadelphia
San Francisco
Seattle

$0.0
$10.0
$20.0
$30.0
$40.0
$50.0
$60.0
$70.0
$80.0
$90.0
Atla
nta
Bal
timor
e
Bos
ton
Chi
cago
Cle
vela
nd
Dal
las
Den
ver
Det
roit
Los
Ang
eles
Min
neap
olis
New
Orle
ans
New
Yor
k
Phi
lade
lphi
a
Pitt
sbur
gh
San
Fra
ncis
co
Sea
ttle
Sai
nt L
ouis
Construction Costs- Major Cities
Union cities, such as New York, San Francisco, and Boston, have
higher labor cost than their “right to work” counterparts
15
Source: JLL Research, ENR
National
average:
51.67

Material price index shows high prices remain, though cost
growth slows
16
Source: JLL Research, ENR
2300
2400
2500
2600
2700
2800
2900
3000
3100
3200
2005 2006 2007 2008 2009 2010 2011 2012 2013 2014
Closer inspection of the Materials Cost Index (ENR) shows a recent history of
growth. Economists project a slight decline in materials cost after 2015.
ENR Materials Price Index tracks weight price movement of
structural steel, portland cement, and 2x4 lumber.
Wei
ghte
d pr
ice
mov
emen
t of s
teel
, cem
ent,
and
lum
ber

-8.0%
-6.0%
-4.0%
-2.0%
0.0%
2.0%
4.0%
6.0%
8.0%
% C
han
ge 2014
% C
han
ge 2015
% C
han
ge 2016
Steel
Rebar
Gypsum
Plywood
Softwood Lumber
Steel and rebar costs will decline after 2015
17
Source: JLL Research, ENR
Due to import pressures and decline in housing starts, lowering overall materials costs
Steel prices are forecast to decline
0.9 percent in 2014 and 1.8 percent
decline forecast through 2016.
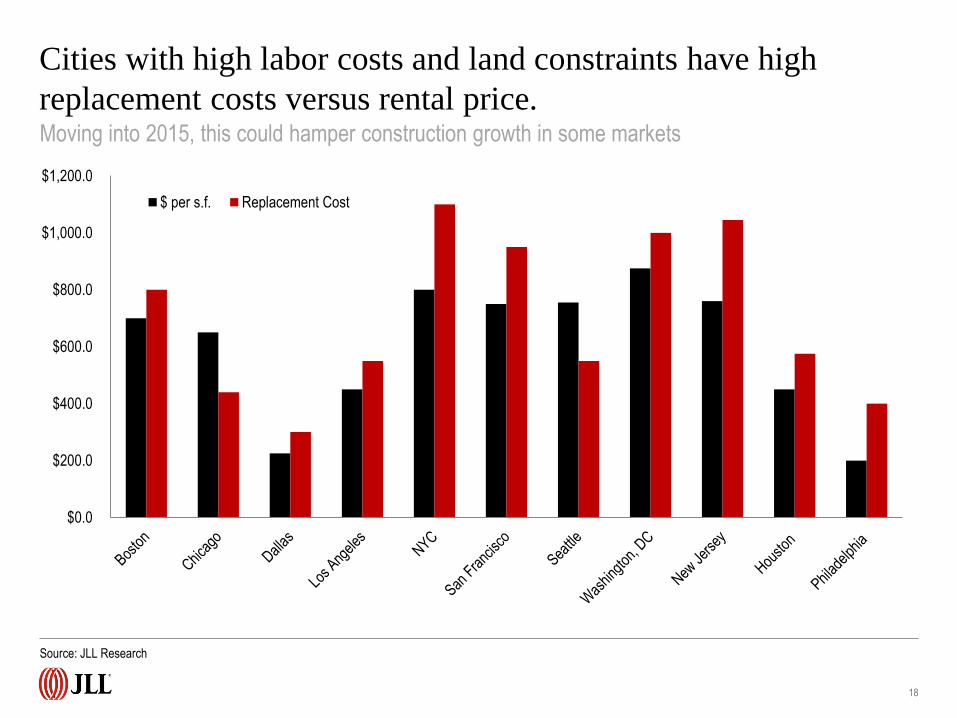
Cities with high labor costs and land constraints have high
replacement costs versus rental price.
18
Source: JLL Research
Moving into 2015, this could hamper construction growth in some markets
$0.0
$200.0
$400.0
$600.0
$800.0
$1,000.0
$1,200.0
$ per s.f. Replacement Cost

Construction starts and put-in place

2014 saw a spike in demand for both new and remodeled space.
20
Source: JLL Research, CoStar, McGraw Hill
Nonresidential construction starts are growing as vacancy declines
178k 190k 208k 2012
166k
2013 2014 2015
Nonresidential construction starts are increasing as vacancy levels decrease. For industrial properties, vacancy has declined
from 8.9 percent in 2012 to 7.2 percent in Q4 2014. Office vacancy rates dropped from 14.1 percent to 10.9 percent in that
same time.
Nonresidential starts flattened slightly in Q4 2014, but will see an upturn again in 2015.

The value of U.S. private construction put-in-place has grown.
21
Source: JLL Research, Moody’s Analytics, Census Bureau
Due to an increase in new, trophy office development
$0.0
$50,000.0
$100,000.0
$150,000.0
$200,000.0
$250,000.0
$300,000.0
$350,000.0
$400,000.0
$450,000.0
2000 2001 2002 2003 2004 2005 2006 2007 2008 2009 2010 2011 2012 2013 2014
($M) Total Construction put-in-place in
November 2014. Approximately 1/3 of
this was nonresidential spending.
$975.0 billion Value of public construction
in November 2014
$277.0 billion

Demand for office and industrial space has increased, impacting
the construction starts in these sectors.
22
Source: JLL Research, CoStar Group
Office construction Industrial construction
Retail construction
47.3 m.s.f. under
construction
77.8 m.s.f under
construction
111.5 m.s.f. under
construction
Q4 2013
Q4 2014
Q4 2013 Q4 2014 142.2
m.s.f . under
construction
48.2 m.s.f.
under
construction
49.4 m.s.f. under
construction
Q4 2013 Q4 2014
of businesses plan to increase space
density through 2016 72%
Leading organizations
pushing density to
According to a JLL/CoreNet survey:
150 s.f. per person or less

Office completions are on the rise, after bottoming out in 2012,
driven by demand from the energy sector.
23
Source: JLL Research
0
20,000,000
40,000,000
60,000,000
80,000,000
100,000,000
120,000,000
140,000,000
2000 2001 2002 2003 2004 2005 2006 2007 2008 2009 2010 2011 2012 2013 2014
Ann
ual c
ompl
etio
ns (
s.f.)

Prime office costs have grown across the board
24
Source: JLL Research, Rider Levett Bucknell
Demand increases for high-class, CBD buildings, and input costs spike
$0.0
$50.0
$100.0
$150.0
$200.0
$250.0
$300.0
$350.0
$400.0
Boston Chicago Los Angeles New York San Francisco Washington DC
($ p.s.f.)
San Francisco’s cost of
building increased the most
for both low and high cost
office space since 2014.
Range of office construction costs in major markets

5,369,595 s.f.
Boston
Office square feet under construction grew across the country
in 2014.
25
Source: JLL Research
Growth in the energy sector fueled construction
6,487,023 s.f.
Dallas
4,153,534 s.f
Seattle
438,935 s.f
Portland
5,847,556 s.f
San Francisco
1,039,772 s.f
San Diego
2,404,819 s.f.
Phoenix
1,860,932 s.f.
Denver
17,760,993 s.f.
Houston
4,189,935 s.f.
Chicago
379,587 s.f.
Charlotte
8,425,911 s.f.
New York City
5,928,933 s.f. DC
3,506,297 s.f.
Philadelphia

Thanks to the energy market boom, Houston became the hub of
office construction in 2014.
26
Source: JLL Research
However, as oil prices decline and energy companies curb spending, construction activity will slow.
Vacancy
Q4 2014:
10.8%
Under
construction
End of 2014:
16.0 m.s.f. Starts
Q4 2014:
2.1 m.s.f.
51% Energy tenants
occupying top-tier CBD
market
Of the over 16.0 m.s.f. of office space
currently under construction, 44.0
percent still un-leased, slowing
development.
Construction volumes in
Texas projected 2015
20%

Industrial completions are continuing to grow at a high rate,
eclipsing 2013 totals.
27
Source: JLL Research, CoStar
Ann
ual c
ompl
etio
ns (
s.f)
0
50,000,000
100,000,000
150,000,000
200,000,000
250,000,000
300,000,000
2000 2001 2002 2003 2004 2005 2006 2007 2008 2009 2010 2011 2012 2013 2014
The development of e-commerce and large scale development are
driving industrial demand growth.
28
Source: JLL Research, Urban Land Institute
• e-commerce has been the fastest-growing segment of the retail market, creating a need for
new types of industrial development
• These buildings need more office space and parking, as they need to house more onsite
employees than traditional industrial buildings
• The “guts” of these buildings need more automation- there will be increased demand for
build outs of existing space to fit these parameters
• Companies are working to enhance economies of scale post-recession, are developing larger
industrial spaces that can serve multiple markets
• Consolidation of services into one large warehouse key to industrial development
• More large-scale construction projects to come due to this trend

Industrial construction costs remain lower than office.
29
Source: JLL Research, Rider Levett Bucknell
Highest cost stock in Los Angeles and San Francisco
$0.0
$20.0
$40.0
$60.0
$80.0
$100.0
$120.0
$140.0
$160.0
$180.0
Boston Chicago Los Angeles New York San Francisco Seattle Washington DC
($ p.s.f.) Range of warehouse construction costs in major markets

13,090,582 s.f.
Inland Empire
220,000 s.f.
Boston 65,000
s.f. Long Island
Industrial centers like Inland Empire saw an increase in square
footage under construction in 2014
30
Source: JLL Research
17,517,455 s.f.
Dallas
2,932,970 s.f.
Seattle
2,866,426 s.f. Los
Angeles
895,646 s.f.
Northern NJ
7,273,541 s.f
Indianapolis
4,794,068 s.f.
Houston
13,393,047 s.f.
Chicago
1,745,130 s.f.
Baltimore
12,395,607 s.f.
Atlanta
2,234,134 s.f.
Charlotte
12,639,496 s.f.
Philadelphia

Demand for large retail space declines due to an increase in
digital retail.
31
Source: JLL Research, Rider Levett Bucknell
0
50,000,000
100,000,000
150,000,000
200,000,000
250,000,000
300,000,000
2000 2001 2002 2003 2004 2005 2006 2007 2008 2009 2010 2011 2012 2013 2014
Though overall retail construction has
declined, outlet mall demand has
skyrocketed. As a result, between
2013 and 2016, 21 million square feet
outlet space will have been delivered.
Ann
ual c
ompl
etio
ns (
s.f)
Overall retail construction slows, but demand for outlet
space flourishes.
32
Source: JLL Research
• Between 2013 and 2016, it is estimated that 21 million square feet of outlet center space will
have been delivered
• Consumers are motivated by discounts on name brand products
• Outlet development will continue to penetrate new markets as various submarkets begin
to emerge from the recession
• As a percentage of all space, malls and specialty centers are the most active in current
construction activity
• Retail is a rising market in many U.S. markets, with Miami and Dallas leading the pack-
indicating more development in these markets is to come
• Due to lifestyle changes, as more people move to urban core settings, mixed use retail is
becoming a more integral part of retail development

Retail construction costs remain low in Denver, and have reached
new post-recession heights in Los Angeles and San Francisco.
33
Source: JLL Research
$0.0
$50.0
$100.0
$150.0
$200.0
$250.0
$300.0
Boston Chicago Denver Los Angeles New York San Francisco Seattle WashingtonDC
($ p.s.f.) Range of retail construction costs in major markets

Major markets like New York City saw moderate retail square
footage under construction in 2014
34
Source: JLL Research
3,652,781 s.f.
Dallas
453,432 s.f.
Seattle
352,250 s.f.
Hawaii
83,635 s.f. San
Francisco
1,690,835 s.f. Los
Angeles 991,111
s.f. Orange County
385,058 s.f.
Atlanta
2,355,126 s.f.
Houston
1,534,800 s.f.
Chicago
427,148 s.f.
Tampa
895,404 s.f.
New York City
1,894,008 s.f. DC
762,131 s.f.
Philadelphia
2,801,056 s.f.
Boston

35
Source: JLL Research
Beverly Hills Hotel
Beverly Hills, CA
75,000 s.f.
AMC Theaters
Nationwide
4.8 m.s. f.
Lyft
San Francisco, CA
65,493 s.f.
JLL construction and renovation projects are following
the market demands for hospitality, education, technology,
and entertainment.
Roosevelt University
Chicago, IL
414,000 s.f.

Overview and outlook

37
Source: JLL Research
New York City and Northern New Jersey continue to develop. Part of this is due to post-Sandy redevelopment,
along with a general increase in demand for real estate space. Industrial stock may continue to grow as a result of
increased traffic due to the Panama Canal expansion.
The Southeast is catching up to overall trends. This region holds the largest concentration of commercial building
establishments and had an approximately 16.0 percent increase in construction starts.
Replacement costs are low in places like Chicago, West LA, and Seattle indicate future building growth potential
in those markets.
Previously slower moving markets, such as Minneapolis, have seen an increase in construction starts. Costs
for building jumped in 2014 in Minneapolis, as the city works on a massive downtown refurbishment. Midsized markets
are seeing a jump in construction activity, leading to cost growth.
Houston led in office development, but this may stagnate in 2015. It delivered 5.4 million square feet of new
space by the end of 2014; however prices are increasing, and the decline in oil prices imply a future decline in
construction in Houston.
1.
2.
3.
4.
5.
Key construction markets in 2014

38
Source: JLL Research, IBISWorld
Construction costs are growing, though growth in materials cost will drop during 2015.
Construction unemployment rates remain high, indicating a large potential employment pool for new
construction. Unemployment will drop quickly as building continues to grow; it is projected 1.1 million jobs will
be added in construction by 2020.
Construction put-in-place has continued to grow since bottoming-out in 2009/2010. Office construction in the
energy sector may see a decline in 2015, as oil prices have dropped substantially.
In some markets, replacement costs are lower than purchase prices, meaning constructing new space is
more cost-effective than renting existing space.
Construction Backlog Index is high in all but the Southeast Region, indicating 2015 will be a big year
for construction.
Construction is in the mature phase of the industry life cycle, meaning markets are volatile and
advancements in techniques and materials have little impact on demand.
1.
2.
3.
4.
5.
What’s next for construction?

© Copyright 2015 Jones Lang LaSalle
Thank you
Dana Westgren
Research Analyst- Industry, Project and Development Services
tel +1 312-228-2867


