US Economic Briefing: Consumer Confidence Yardeni Research, Inc. June 29, 2018 Dr. Edward Yardeni 516-972-7683 [email protected]Debbie Johnson 480-664-1333 [email protected]Mali Quintana 480-664-1333 [email protected]Please visit our sites at www.yardeni.com blog.yardeni.com thinking outside the box
Note: Shaded areas denote recessions according to the National Bureau of Economic Research.Source: The Conference Board and the University of Michigan Survey Research Center.
yardeni.com
Consumer Confidence & Sentiment
Page 1 / June 29, 2018 / Consumer Confidence www.yardeni.com
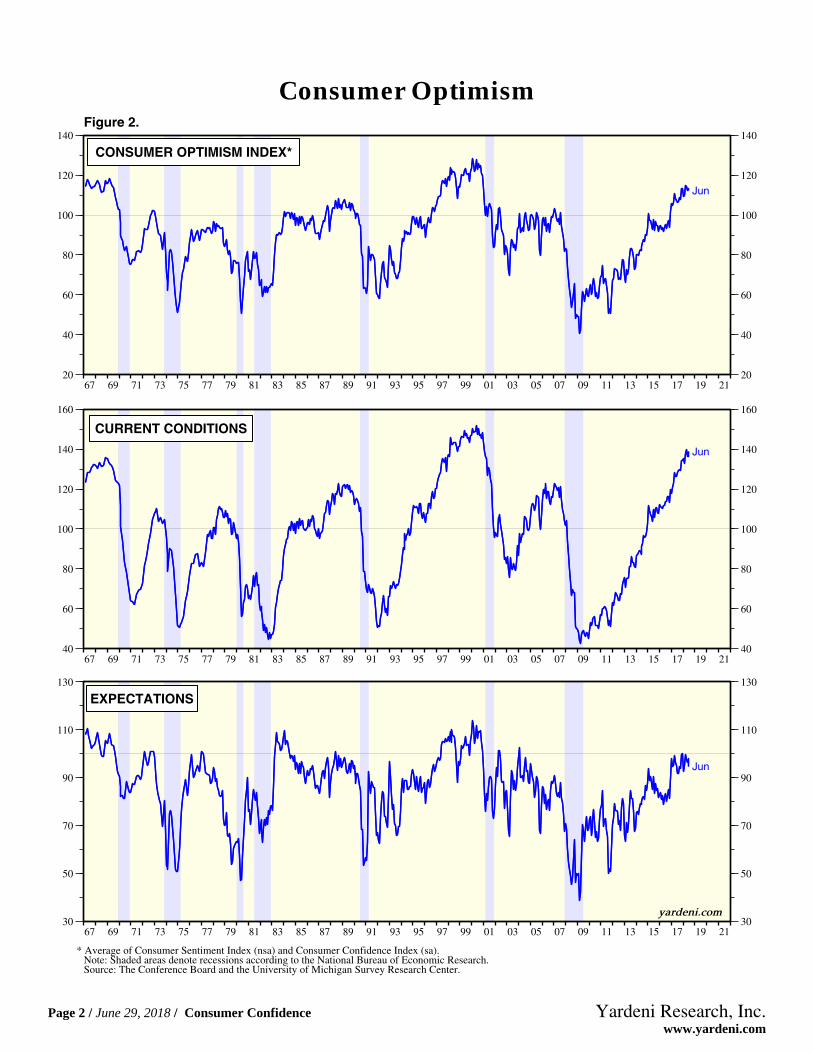
* Average of Consumer Sentiment Index (nsa) and Consumer Confidence Index (sa).Note: Shaded areas denote recessions according to the National Bureau of Economic Research.Source: The Conference Board and the University of Michigan Survey Research Center.
yardeni.com
Consumer Optimism
Page 2 / June 29, 2018 / Consumer Confidence www.yardeni.com
* Average of Consumer Sentiment Index and Consumer Confidence Index.Note: Shaded areas denote recessions according to the National Bureau of Economic Research.Source: The Conference Board and the University of Michigan Survey Research Center.
yardeni.com
Figure 8.
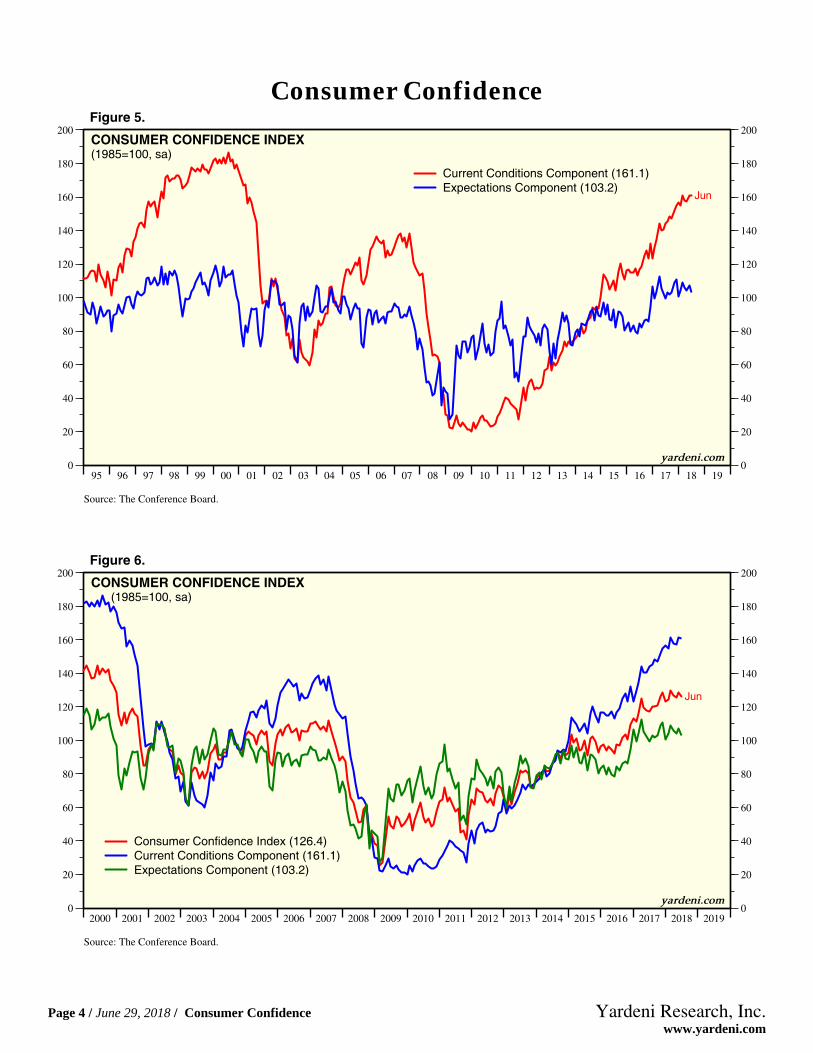
Consumer Confidence
Page 5 / June 29, 2018 / Consumer Confidence www.yardeni.com
CONSUMER CONFIDENCE SURVEY: JOBS AVAILABILITY(percent saying so)
Jun
Jun
Jobs HardTo Get* (14.9)
Jobs Plentiful* (40.0)
* Every other month from 1967 through mid-1977, then monthly since July 1977. Seasonally adjusted.Note: Shaded areas denote recessions according to the National Bureau of Economic Research.Source: The Conference Board.
Note: Shaded areas denote recessions according to the National Bureau of Economic Research.* Total unemployed plus all marginally attached workers plus total employed part time for economic reasons as percent of civilian labor force plus
all attached workers.Source: The Conference Board and US Department of Labor.
yardeni.com
Figure 12.
Consumer Confidence & Unemployment
Page 7 / June 29, 2018 / Consumer Confidence www.yardeni.com
CONSUMER CONFIDENCE SURVEY: UNEMPLOYMENT CLAIMS & JOBS AVAILABILITY(sa)
Initial Unemployment Claims(thousands, sa, 4-week ma)
Jobs Hard To Get*(percent saying so)
* Every other month from 1967 through mid-1977, then monthly since July 1977. Seasonally adjusted.Note: Shaded areas denote recessions according to the National Bureau of Economic Research.Source: The Conference Board and US Department of Labor.
yardeni.com
Figure 14.
Consumer Confidence & Unemployment
Page 8 / June 29, 2018 / Consumer Confidence www.yardeni.com
* Average of Consumer Sentiment Index (nsa) and Consumer Confidence Index (sa).Source: The Conference Board, University of Michigan Survey Research Center, and US Department of Labor.
yardeni.com
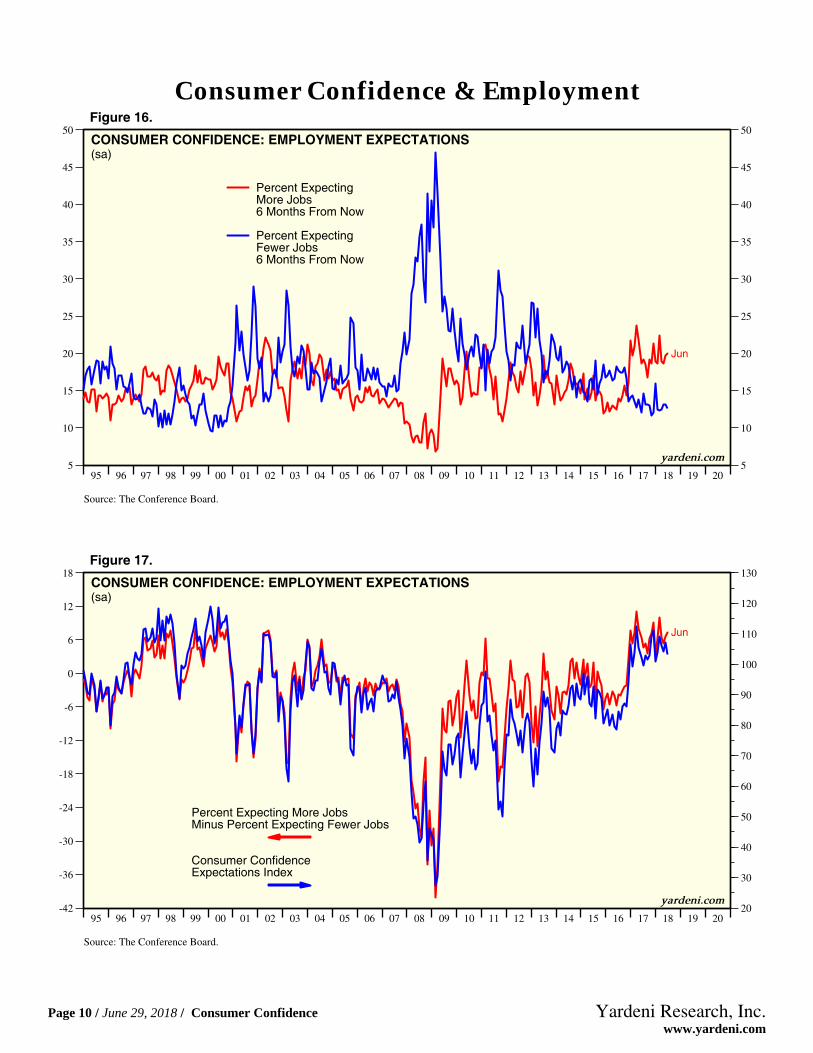
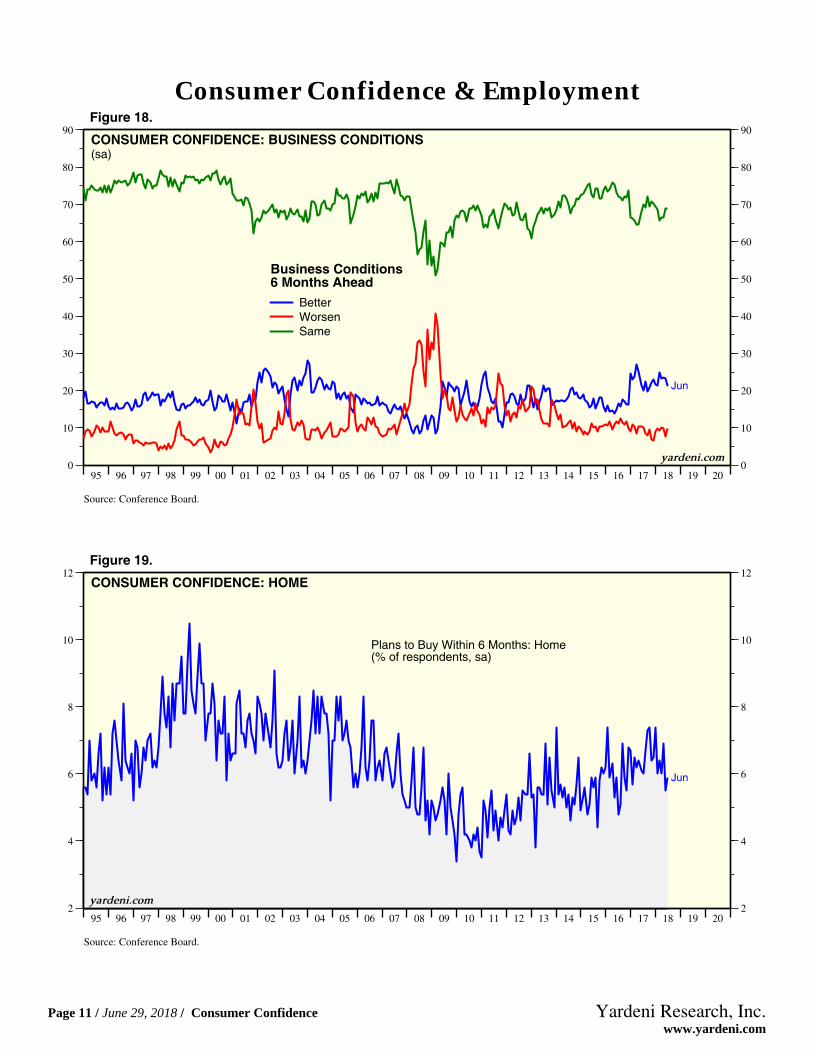
Consumer Confidence & Employment
Page 9 / June 29, 2018 / Consumer Confidence www.yardeni.com
Source: University of Michigan Survey Research Center.
yardeni.com
Figure 21.
Consumer Sentiment
Page 12 / June 29, 2018 / Consumer Confidence www.yardeni.com
Yardeni Research, Inc.
Figure 22.
97 99 01 03 05 07 09 11 13 15 17 19 210
20
40
60
80
100
120
140
160
180
Jun
CONSUMER CONFIDENCE INDEX(1985=100, sa)
New England*
97 99 01 03 05 07 09 11 13 15 17 19 210
25
50
75
100
125
150
175
200
225
250
Jun
New England*Current Conditions
Expectations
97 99 01 03 05 07 09 11 13 15 17 19 2115
30
45
60
75
90
105
120
135
150
JunMiddle Atlantic*
97 99 01 03 05 07 09 11 13 15 17 19 210
20
40
60
80
100
120
140
160
180
200
Jun
Middle Atlantic*Current Conditions
Expectations
97 99 01 03 05 07 09 11 13 15 17 19 2120
40
60
80
100
120
140
160
JunSouth Atlantic*
* New England (Connecticut, Massachusetts, Maine, New Hampshire, Rhode Island, Vermont); Middle Atlantic (New Jersey, New York,Pennsylvania); South Atlantic (Delaware, Maryland, Washington DC, Virginia, West Virginia, North Carolina, South Carolina, Georgia, Florida).Source: The Conference Board.
97 99 01 03 05 07 09 11 13 15 17 19 210
25
50
75
100
125
150
175
200
225
Jun
South Atlantic*Current Conditions
Expectations
yardeni.com
Consumer Confidence By Region
Page 13 / June 29, 2018 / Consumer Confidence www.yardeni.com
Yardeni Research, Inc.
Figure 23.
97 99 01 03 05 07 09 11 13 15 17 19 2120
40
60
80
100
120
140
160
180
Jun
CONSUMER CONFIDENCE INDEX(1985=100, sa)
East North Central*
97 99 01 03 05 07 09 11 13 15 17 19 210
20
40
60
80
100
120
140
160
180
200
220
Jun
East North Central*Current Conditions
Expectations
97 99 01 03 05 07 09 11 13 15 17 19 2120
40
60
80
100
120
140
160
JunEast South Central*
97 99 01 03 05 07 09 11 13 15 17 19 210
20
40
60
80
100
120
140
160
180
200
JunEast South Central*
Current Conditions
Expectations
97 99 01 03 05 07 09 11 13 15 17 19 2120
30
40
50
60
70
80
90
100
110
120
130
140
150
160
Jun
West North Central*
* East North Central (Ohio, Indiana, Illinois, Michigan, Wisconsin); East South Central (Kentucky, Tennessee, Alabama, Mississippi);West North Central (Minnesota, Iowa, Missouri, North Dakota, South Dakota, Nebraska, Kansas). Source: The Conference Board.
97 99 01 03 05 07 09 11 13 15 17 19 210
20
40
60
80
100
120
140
160
180
200
220
Jun
West North Central*Current Conditions
Expectations
yardeni.com
Consumer Confidence By Region
Page 14 / June 29, 2018 / Consumer Confidence www.yardeni.com
Yardeni Research, Inc.
Figure 24.
97 99 01 03 05 07 09 11 13 15 17 19 2140
60
80
100
120
140
160
180
Jun
CONSUMER CONFIDENCE INDEX(1985=100, sa)
West South Central*
97 99 01 03 05 07 09 11 13 15 17 19 2120
35
50
65
80
95
110
125
140
155
170
185
200
215
Jun
West South Central*Current Conditions
Expectations
97 99 01 03 05 07 09 11 13 15 17 19 2120
40
60
80
100
120
140
160
180
Jun
Mountain*
97 99 01 03 05 07 09 11 13 15 17 19 210
20
40
60
80
100
120
140
160
180
200
Jun
Mountain*Current Conditions
Expectations
97 99 01 03 05 07 09 11 13 15 17 19 2120
40
60
80
100
120
140
160
Jun
Pacific*
* West South Central (Arkansas, Louisiana, Oklahoma, Texas); Mountain (Montana, Idaho, Wyoming, Colorado, New Mexico, Arizona,Utah, Nevada); Pacific (Washington, Oregon, California, Alaska, Hawaii).Source: The Conference Board.
97 99 01 03 05 07 09 11 13 15 17 19 210
20
40
60
80
100
120
140
160
180
200
220
Jun
Pacific*Current Conditions
Expectations
yardeni.com
Consumer Confidence By Region
Page 15 / June 29, 2018 / Consumer Confidence www.yardeni.com
* Average of Consumer Sentiment Index (nsa) and Consumer Confidence Index (sa).Note: Shaded areas denote recessions according to the National Bureau of Economic Research.Source: The Conference Board and the University of Michigan Survey Research Center.
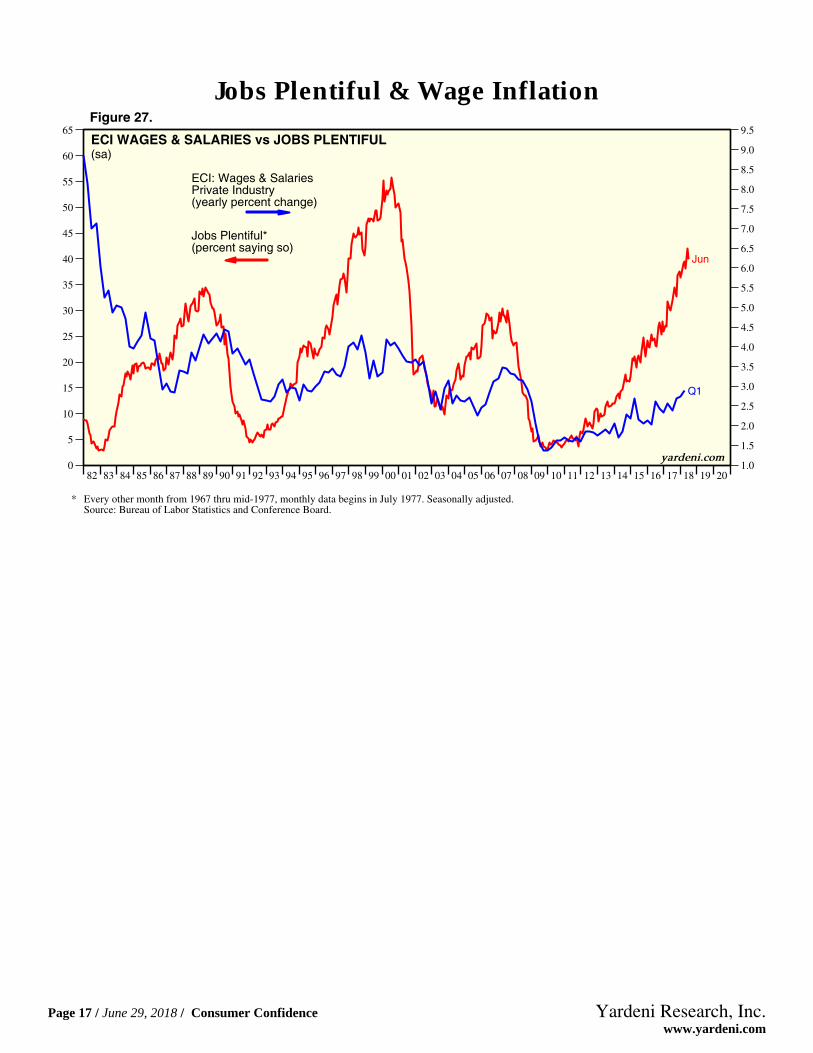
* Every other month from 1967 thru mid-1977, monthly data begins in July 1977. Seasonally adjusted.Source: Bureau of Labor Statistics and Conference Board.
yardeni.com
Figure 27.
Jobs Plentiful & Wage Inflation
Page 17 / June 29, 2018 / Consumer Confidence www.yardeni.com
Copyright (c) Yardeni Research, Inc. 2018. All rights reserved. The informationcontained herein has been obtained from sources believed to be reliable, but is notnecessarily complete and its accuracy cannot be guaranteed. No representation orwarranty, express or implied, is made as to the fairness, accuracy, completeness, orcorrectness of the information and opinions contained herein. The views and the otherinformation provided are subject to change without notice. All reports posted onwww.yardeni.com, blog.yardeni.com, and YRI’s Apps for iPads and iPhones are issuedwithout regard to the specific investment objectives, financial situation, or particular needsof any specific recipient and are not to be construed as a solicitation or an offer to buy or sellany securities or related financial instruments. Past performance is not necessarily a guideto future results. Company fundamentals and earnings may be mentioned occasionally, butshould not be construed as a recommendation to buy, sell, or hold the company’s stock.Predictions, forecasts, and estimates for any and all markets should not be construed asrecommendations to buy, sell, or hold any security--including mutual funds, futurescontracts, and exchange traded funds, or any similar instruments.
The text, images, and other materials contained or displayed on any Yardeni Research, Inc.product, service, report, email or website are proprietary to Yardeni Research, Inc. andconstitute valuable intellectual property. No material from any part of www.yardeni.com, blog.yardeni.com, and YRI’s Apps for iPads and iPhones may be downloaded, transmitted,broadcast, transferred, assigned, reproduced or in any other way used or otherwisedisseminated in any form to any person or entity, without the explicit written consent ofYardeni Research, Inc. All unauthorized reproduction or other use of material from YardeniResearch, Inc. shall be deemed willful infringement(s) of this copyright and other proprietaryand intellectual property rights, including but not limited to, rights of privacy. YardeniResearch, Inc. expressly reserves all rights in connection with its intellectual property,including without limitation the right to block the transfer of its products and services and/orto track usage thereof, through electronic tracking technology, and all other lawful means,now known or hereafter devised. Yardeni Research, Inc. reserves the right, without furthernotice, to pursue to the fullest extent allowed by the law any and all criminal and civilremedies for the violation of its rights.
The recipient should check any email and any attachments for the presence of viruses.Yardeni Research, Inc. accepts no liability for any damage caused by any virus transmittedby this company’s emails, website, blog and Apps. Additional information available onrequest.