17


•
•
•
•
•
•
•
•
•
•
•
•
•
•
•

3
Consumer sentiment and business confidence Consumer sentiment and retail salesZ-score Year-over-year change 3-month moving average
Source: FactSet, Westpac, J.P. Morgan Asset Management; (Left) National Australia Bank; (Right) Australian Bureau of Statistics.
Guide to the Markets – Australia. Data as of 7 May 2021.
Retail sales growth
Consumer sentiment
Business confidence
Consumer sentiment
-8
-6
-4
-2
0
2
4
'99 '01 '03 '05 '07 '09 '11 '13 '15 '17 '1980
85
90
95
100
105
110
115
-10%
-5%
0%
5%
10%
15%
'10 '11 '12 '13 '14 '15 '16 '17 '18 '19 '20

4
CPI and core CPI inflationYear-over-year change
Source: Australian Bureau of Statistics, FactSet, J.P. Morgan Asset Management. *CPI is the Consumer Price Index, core CPI is the average of the trimmed mean
and weighted median measures of inflation. Tradables represent approximately 35% of the CPI basket and non-tradables 65%. Core goods CPI is goods CPI
excluding volatile items.
Guide to the Markets – Australia. Data as of 30 April 2021.
Average 1Q21
Headline CPI* 3.5% 1.1%
Core CPI 3.6% 1.2%
Tradables 2.7% 0.7%
Non-tradables 4.2% 1.3%
RBA target band
-1%
0%
1%
2%
3%
4%
5%
6%
7%
8%
9%
10%
11%
12%
'83 '88 '93 '98 '03 '08 '13 '18
RBA target band

5
5%
6%
7%
8%
9%
10%
11%
12%
13%
14%0.0%
0.5%
1.0%
1.5%
2.0%
2.5%
3.0%
3.5%
4.0%
4.5%
5.0%
'99 '01 '03 '05 '07 '09 '11 '13 '15 '17 '19 '21
9%
11%
13%
15%
17%
19%
21%
3.0%
3.5%
4.0%
4.5%
5.0%
5.5%
6.0%
6.5%
7.0%
7.5%
8.0%
'98 '00 '02 '04 '06 '08 '10 '12 '14 '16 '18 '20
Unemployment and underutilisation rates Wage growthSeasonally adjusted Year-over-year change, excluding bonuses
Source: Australian Bureau of Statistics, FactSet, J.P. Morgan Asset Management.
Guide to the Markets – Australia. Data as of 7 May 2021.
Mar 2021:
5.6%
Mar 2021:
13.5%
Underutilisation rate
Unemployment rate Underemployment rate
(inverted)Wage growth
Mar 2021:
8.2%
4Q20:
1.4%
6
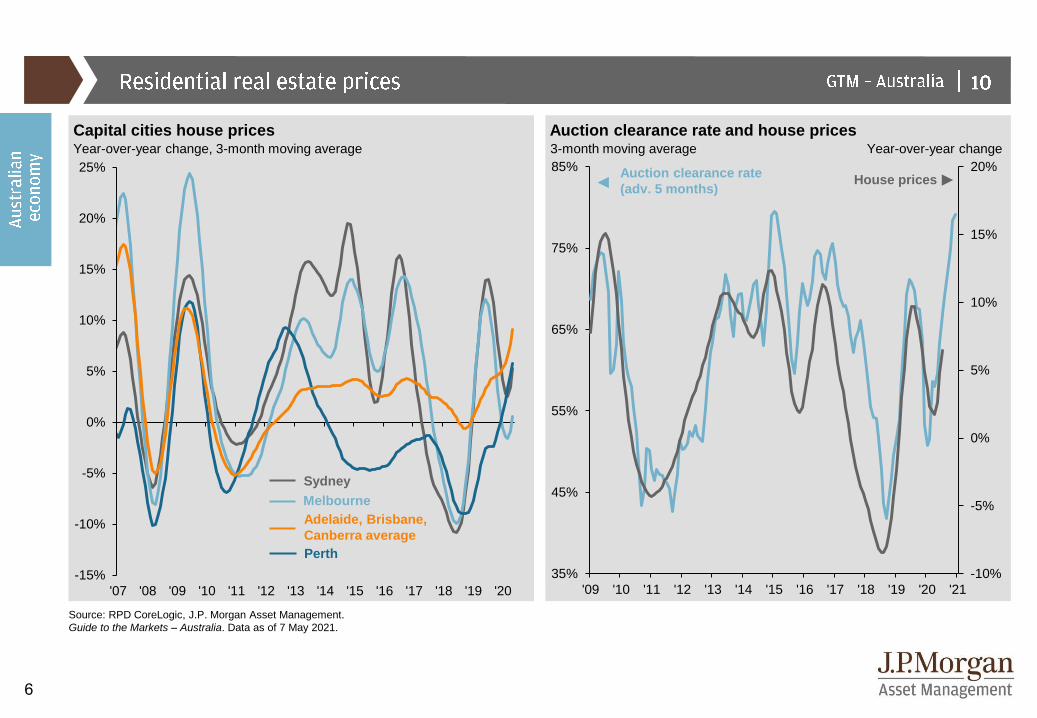
Capital cities house prices Auction clearance rate and house pricesYear-over-year change, 3-month moving average 3-month moving average Year-over-year change
Source: RPD CoreLogic, J.P. Morgan Asset Management.
Guide to the Markets – Australia. Data as of 7 May 2021.
Sydney
Perth
Melbourne
Adelaide, Brisbane,
Canberra average
House pricesAuction clearance rate
(adv. 5 months)
-15%
-10%
-5%
0%
5%
10%
15%
20%
25%
'07 '08 '09 '10 '11 '12 '13 '14 '15 '16 '17 '18 '19 '20
-10%
-5%
0%
5%
10%
15%
20%
35%
45%
55%
65%
75%
85%
'09 '10 '11 '12 '13 '14 '15 '16 '17 '18 '19 '20 '21

7
Mortgage lending Housing finance and house prices3-month annualised growth rate Year-over-year change
Source: Australian Bureau of Statistics, J.P. Morgan Asset Management; (Right) RPD CoreLogic.
House price is the year-over-year change in the hedonic index for national dwelling prices. Past performance is not a reliable indicator of current and future results.
Guide to the Markets – Australia. Data as of 7 May 2021.
Owner-occupier
Investor
Housing finance commitments
(adv. 6 months, 3MMA)House prices
-12%
-9%
-6%
-3%
0%
3%
6%
9%
12%
15%
18%
21%
-36%
-24%
-12%
0%
12%
24%
36%
48%
60%
'04 '06 '08 '10 '12 '14 '16 '18 '20
-4%
-2%
0%
2%
4%
6%
8%
10%
12%
14%
16%
'07 '08 '09 '10 '11 '12 '13 '14 '15 '16 '17 '18 '19 '20 '21

8
Global Composite Purchasing Managers’ Index, quarterly
Source: AIG, FactSet, Markit, J.P. Morgan Asset Management. Heatmap colours are based on PMI relative to the 50 level, which indicates acceleration or
deceleration of the sector, for the time period shown. Heatmap is based on quarterly averages, with the exception of the two most recent figures, which are single
month readings. Data for Canada, Indonesia and Mexico are back-tested and filled in from December 2008 to November 2010 for Canada and May 2011 for Indonesia
and Mexico due to lack of existing PMI figures for these countries. DM and EM represent developed markets and emerging markets, respectively.
Guide to the Markets – Australia. Data as of 7 May 2021.
Mar Apr
Global 55.0 55.8
DM 58.5 59.3
EM 51.3 52.2
Australia 59.9 61.7
U.S. 59.1 60.5
Canada 58.5 57.2
UK 58.9 60.9
Japan 52.7 53.6
Eurozone 62.5 62.9
Germany 66.6 66.2
France 59.3 58.9
Italy 59.8 60.7
Spain 56.9 57.7
China 50.6 51.9
Indonesia 53.2 54.6
Korea 55.3 54.6
Taiwan 60.8 62.4
India 55.4 55.5
Brazil 52.8 52.3
Mexico 45.6 48.4
Russia 51.1 50.4
De
ve
lop
ed
Em
erg
ing
2021202020192018201720162010 20152014201320122011

9
2011 2012 2013 2014 2015 2016 2017 2018 2019 2020 YTD Apr '21 Ann. Vol.
2.1%
U.S.
2.1%
21.2%
Asia ex JP
19.7%
53.6%
U.S.
32.4%
24.3%
U.S.
13.7%
25.6%
Japan
12.1%
13.2%
Small Cap
13.2%
31.5%
Asia ex JP
35.9%
6.2%
U.S.
-4.4%
31.7%
U.S.
31.5%
14.2%
Asia ex JP
22.7%
11.7%
U.S.
11.8%
5.0%
Small Cap
5.0%
17.2%
U.S.
13.9%
Japan
16.9%
-10.4%
Portfolio
-9.9%
20.3%
Australia
20.3%
47.4%
Japan
54.4%
14.9%
Asia ex JP
7.7%
14.0%
U.S.
1.4%
12.5%
U.S.
12.0%
27.5%
EM
31.0%
-2.3%
Portfolio
-7.3%
24.8%
Europe
24.6%
9.2%
Small Cap
9.2%
9.0%
Europe
10.4%
3.9%
U.S.
5.3%
10.1%
Japan
9.6%
Small Cap
16.8%
-10.5%
Europe
-8.8%
18.4%
Europe
16.4%
46.2%
Europe
22.3%
8.7%
Portfolio
6.8%
10.2%
Small Cap
10.2%
12.1%
EM
10.1%
20.0%
Small Cap
20.0%
-2.8%
Australia
-2.8%
24.0%
Portfolio
23.7%
8.1%
EM
19.5%
7.9%
Australia
7.9%
3.5%
Australia
3.5%
9.9%
Portfolio
8.8%
Asia ex JP
14.2%
-10.5%
Australia
-10.5%
17.1%
EM
17.4%
30.7%
Portfolio
21.9%
7.3%
EM
5.6%
9.8%
Europe
5.4%
11.8%
Australia
11.8%
17.2%
Japan
22.2%
-4.2%
Japan
-16.0%
23.4%
Australia
23.4%
7.9%
U.S.
18.4%
7.5%
Portfolio
8.5%
3.2%
Europe
2.5%
9.9%
Asia ex JP
7.4%
Australia
13.6%
-12.5%
Japan
-17.0%
15.8%
Portfolio
17.2%
20.2%
Australia
20.2%
5.7%
Japan
10.3%
8.4%
Portfolio
3.3%
9.4%
Portfolio
9.8%
16.9%
Europe
13.7%
-4.6%
Asia ex JP
-12.0%
21.4%
Small Cap
21.4%
4.2%
Portfolio
8.6%
7.2%
Small Cap
7.2%
2.6%
Portfolio
3.0%
9.0%
Europe
6.9%
U.S.
13.5%
-17.1%
Asia ex JP
-14.6%
14.6%
U.S.
16.0%
19.9%
Asia ex JP
6.2%
5.6%
Australia
5.6%
2.6%
Australia
2.6%
6.3%
Asia ex JP
6.4%
16.7%
Portfolio
19.1%
-4.7%
EM
-9.7%
19.4%
Japan
18.1%
3.0%
Japan
7.4%
5.2%
Asia ex JP
5.9%
1.1%
EM
1.6%
7.8%
Australia
7.8%
EM
13.1%
-18.2%
EM
-12.5%
6.6%
Small Cap
6.6%
13.4%
EM
3.8%
3.1%
Europe
5.2%
2.5%
Asia ex JP
-5.3%
4.0%
Japan
0.3%
12.8%
U.S.
21.8%
-4.8%
Europe
-10.0%
19.1%
EM
18.5%
1.4%
Australia
1.4%
4.8%
EM
5.7%
1.1%
Asia ex JP
1.8%
7.0%
EM
7.0%
Europe
13.0%
-21.4%
Small Cap
-21.4%
6.2%
Japan
20.9%
-0.8%
Small Cap
-0.8%
-3.8%
Small Cap
-3.8%
-3.9%
EM
-5.4%
0.7%
Europe
7.9%
11.8%
Australia
11.8%
-8.7%
Small Cap
-8.7%
18.7%
Asia ex JP
18.2%
-3.5%
Europe
-1.7%
0.2%
Japan
6.2%
-3.1%
Japan
-2.8%
3.8%
Small Cap
3.8%
Portfolio
9.0%
10-years '11 - '20
Source: FactSet, MSCI, Standard & Poor’s, TOPIX, J.P. Morgan Asset Management. Annualised return (Ann.) and volatility (Vol.) covers the period 2010 to 2019.
Volatility is based on local currency returns. Small Cap: S&P ASX Small Ordinaries; Asia ex JP: MSCI AC Asia ex Japan; EM: MSCI EM Index; Europe: MSCI Europe
Index; Japan: TOPIX first section; Australia: ASX 200 Index; U.S.: S&P 500 Index. Hypothetical portfolio (for illustrative purposes only and should not be taken as a
recommendation): 20% U.S.; 30% Australia; 15% EM; 15% Europe; 10% Japan; 10% small cap. All indices are total returns. Past performance is not a reliable
indicator of current and future results.
Guide to the Markets – Australia. Data as of 30 April 2021.
AUD
Local
10
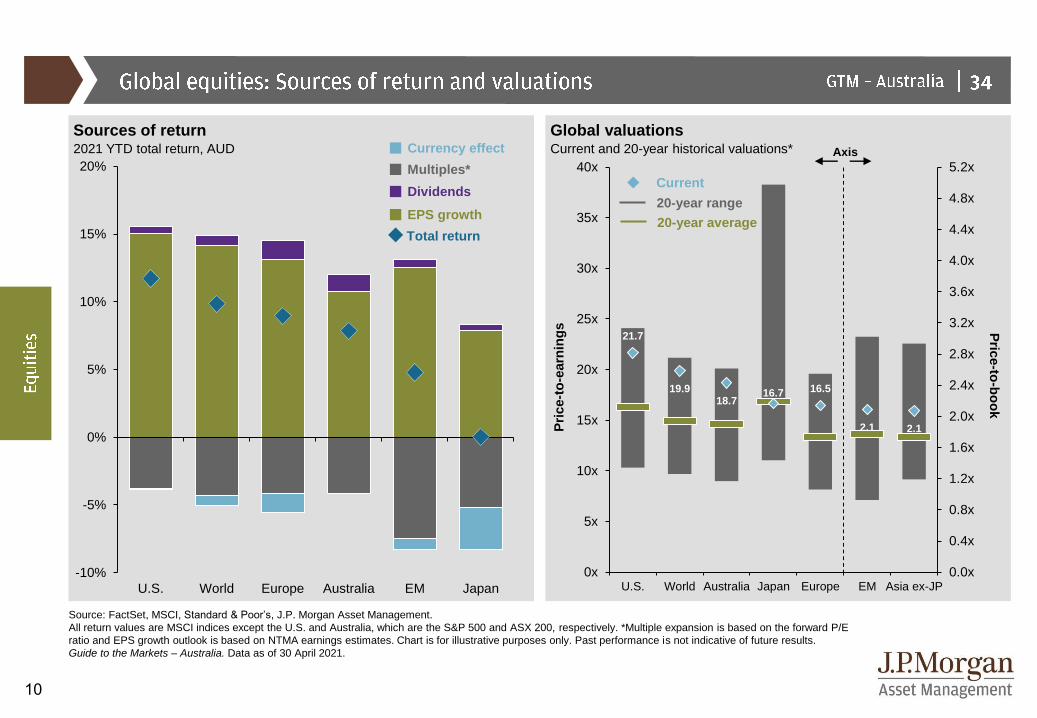
21.7
19.918.7
16.7 16.5
2.1 2.1
0.0x
0.4x
0.8x
1.2x
1.6x
2.0x
2.4x
2.8x
3.2x
3.6x
4.0x
4.4x
4.8x
5.2x
0x
5x
10x
15x
20x
25x
30x
35x
40x
U.S. World Australia Japan Europe EM Asia ex-JP
Pric
e-to
-bo
ok
Pri
ce-t
o-e
arn
ing
s-10%
-5%
0%
5%
10%
15%
20%
U.S. World Europe Australia EM Japan
Sources of return Global valuations2021 YTD total return, AUD Current and 20-year historical valuations*
Source: FactSet, MSCI, Standard & Poor’s, J.P. Morgan Asset Management.
All return values are MSCI indices except the U.S. and Australia, which are the S&P 500 and ASX 200, respectively. *Multiple expansion is based on the forward P/E
ratio and EPS growth outlook is based on NTMA earnings estimates. Chart is for illustrative purposes only. Past performance is not indicative of future results.
Guide to the Markets – Australia. Data as of 30 April 2021.
Currency effect
Multiples*
Dividends
EPS growth
Total return
Axis
20-year range
Current
20-year average

11
Earnings growth Earnings revisions ratiosEarnings per share, year-over-year change 13-week moving average
Source: J.P. Morgan Asset Management; (Left) Thomson Reuters Datastream; (Right) FactSet, MSCI, Standard & Poor’s.
Guide to the Markets – Australia. Data as of 30 April 2021.
U.S.
Australia
Japan
Europe
EM
202220212020
-13%
-3% -4%
-26%
29%32%
40%
35%
14% 15% 15% 14%
-30%
-20%
-10%
0%
10%
20%
30%
40%
50%
U.S. EM Asia Pacific ex-Japan
Europe -80%
-60%
-40%
-20%
0%
20%
40%
60%
'13 '14 '15 '16 '17 '18 '19 '20

12
Spreads across fixed income sub-sectorsBasis points
Source: iBoxx, ICE BofA, J.P. Morgan Economics Research, J.P. Morgan Asset Management. Based on J.P. Morgan Domestic High Yield Index (U.S. high yield), J.P.
Morgan U.S. Liquid Index (JULI) (U.S. investment grade), J.P. Morgan Euro High Yield Index (Euro high yield), iBoxx EUR corporates (Euro investment grade), J.P.
Morgan Asia Credit Index (JACI) (USD Asia credit), J.P. Morgan Asia Credit China Index (USD China offshore credit), J.P. Morgan Asia Credit High Yield Index (USD
Asia high yield), J.P. Morgan EMBI Global (EMD USD), J.P. Morgan Corporate Emerging Markets Bond Index – CEMBI (USD EMD corporates), J.P. Morgan GBI-EM
Global (Local EMD). Positive yield does not imply positive return. Past performance is not a reliable indicator of current and future results.
Guide to the Markets – Australia. Data as of 30 April 2021.
10-year range
Current
10-year average
394
117
354
63
215
266
610
312
242
406
0
200
400
600
800
1,000
1,200
U.S. highyield
U.S.investment…
Euro highyield
Euroinvestment…
USDAsia…
USD Chinaoffshore credit
USD Asiahigh yield
USD EMD USD EMDcorporates
Local EMD

13
Inflation expectations Fed average inflation targeting5-year 5-year inflation swap rate Personal consumption expenditure inflation
Source: FactSet, J.P. Morgan Asset Management; (Left) Bloomberg Finance L.P.; (Right) BEA.
U.S. Federal Reserve’s policy mandate seeks to achieve inflation that averages 2% over time. We have assumed a three year timeframe although the Federal
Reserve has not defined this period.
Guide to the Markets – Australia. Data as of 30 April 2021.
Eurozone
U.S.
Japan
Hypothetical 3-year
average: 2.4%
Prior 3-year
average: 1.6%
-2%
-1%
0%
1%
2%
3%
4%
'07 '08 '09 '10 '11 '12 '13 '14 '15 '16 '17 '18 '19 '20 '21
0.0%
0.5%
1.0%
1.5%
2.0%
2.5%
3.0%
'11 '13 '15 '17 '19 '21 '23

14
0
20
40
60
80
100
120
140
160
'90 '92 '94 '96 '98 '00 '02 '04 '06 '08 '10 '12 '14 '16 '18 '20
Price of oil U.S. crude oil inventories and rig countBrent crude, USD/barrel Millions barrels*
Source: FactSet, J.P. Morgan Asset Management; (Right) Baker Hughes, U.S. Department of Energy; *Weekly U.S. crude oil and petroleum ending inventory includes
strategic petroleum reserve, and active rig count represents both natural gas and oil rigs.
Guide to the Markets – Australia. Data as of 30 April 2021.
Inventories (incl. SPR) Active rigs (inverted)
30 Apr 2021:
$67.73
0
200
400
600
800
1,000
1,200
1,400
1,600
1,800
2,0001,000
1,050
1,100
1,150
1,200
1,250
'12 '13 '14 '15 '16 '17 '18 '19 '20

15
$0
$50
$100
$150
$200
$250
'11 '12 '13 '14 '15 '16 '17 '18 '19 '20 '21
Iron ore price Iron ore: Chinese port inventoriesUSD per MT, iron ore 62% Fe MT Days
Source: J.P. Morgan Asset Management; (Left) FactSet; (Top right) Bloomberg Finance L.P., National Bureau of Statistics of China.
Guide to the Markets – Australia. Data as of 7 May 2021.
Days of supplyInventories at port
7 May 2021:
$204
0
10
20
30
40
50
60
0
20
40
60
80
100
120
140
160
'10 '11 '12 '13 '14 '15 '16 '17 '18 '19 '20 '21
16
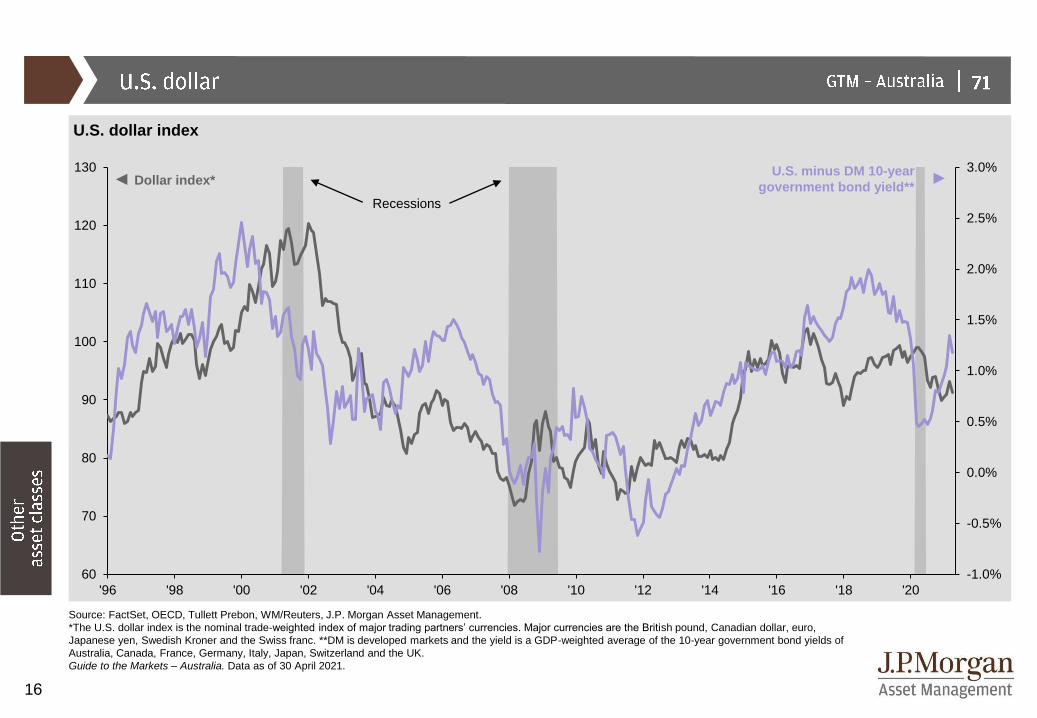
U.S. dollar index
Source: FactSet, OECD, Tullett Prebon, WM/Reuters, J.P. Morgan Asset Management.
*The U.S. dollar index is the nominal trade-weighted index of major trading partners’ currencies. Major currencies are the British pound, Canadian dollar, euro,
Japanese yen, Swedish Kroner and the Swiss franc. **DM is developed markets and the yield is a GDP-weighted average of the 10-year government bond yields of
Australia, Canada, France, Germany, Italy, Japan, Switzerland and the UK.
Guide to the Markets – Australia. Data as of 30 April 2021.
Recessions
U.S. minus DM 10-year
government bond yield**Dollar index*
-1.0%
-0.5%
0.0%
0.5%
1.0%
1.5%
2.0%
2.5%
3.0%
60
70
80
90
100
110
120
130
'96 '98 '00 '02 '04 '06 '08 '10 '12 '14 '16 '18 '20

The Market Insights program provides comprehensive data and commentary on global markets without reference to products. Designed as a tool to help clients understand the markets and support investment decision-making, the program explores the implications of current economic data and changing market conditions.
For the purposes of MiFID II, the JPM Market Insights and Portfolio Insights programs are marketing communications and are not in scope for any MiFID II / MiFIR requirements specifically
related to investment research. Furthermore, the J.P. Morgan Asset Management Market Insights and Portfolio Insights programs, as non-independent research, have not been prepared in
accordance with legal requirements designed to promote the independence of investment research, nor are they subject to any prohibition on dealing ahead of the dissemination of investment
research.
This document is a general communication being provided for informational purposes only. It is educational in nature and not designed to be taken as advice or a recommendation for any
specific investment product, strategy, plan feature or other purpose in any jurisdiction, nor is it a commitment from J.P. Morgan Asset Management or any of its subsidiaries to participate in any
of the transactions mentioned herein. Any examples used are generic, hypothetical and for illustration purposes only. This material does not contain sufficient information to support an
investment decision and it should not be relied upon by you in evaluating the merits of investing in any securities or products. In addition, users should make an independent assessment of the
legal, regulatory, tax, credit, and accounting implications and determine, together with their own financial professional, if any investment mentioned herein is believed to be appropriate to their
personal goals. Investors should ensure that they obtain all available relevant information before making any investment. Any forecasts, figures, opinions or investment techniques and strategies
set out are for information purposes only, based on certain assumptions and current market conditions and are subject to change without prior notice. All information presented herein is
considered to be accurate at the time of production, but no warranty of accuracy is given and no liability in respect of any error or omission is accepted. It should be noted that investment
involves risks, the value of investments and the income from them may fluctuate in accordance with market conditions and taxation agreements and investors may not get back the full amount
invested. Both past performance and yields are not reliable indicators of current and future results.
J.P. Morgan Asset Management is the brand for the asset management business of JPMorgan Chase & Co. and its affiliates worldwide.
To the extent permitted by applicable law, we may record telephone calls and monitor electronic communications to comply with our legal and regulatory obligations and internal policies.
Personal data will be collected, stored and processed by J.P. Morgan Asset Management in accordance with our privacy policies at https://am.jpmorgan.com/global/privacy.
This communication is issued by the following entities:
In the United States, by J.P. Morgan Investment Management Inc. or J.P. Morgan Alternative Asset Management, Inc., both regulated by the Securities and Exchange Commission; in Latin
America, for intended recipients’ use only, by local J.P. Morgan entities, as the case may be. In Canada, for institutional clients’ use only, by JPMorgan Asset Management (Canada) Inc., which
is a registered Portfolio Manager and Exempt Market Dealer in all Canadian provinces and territories except the Yukon and is also registered as an Investment Fund Manager in British Columbia,
Ontario, Quebec and Newfoundland and Labrador. In the United Kingdom, by JPMorgan Asset Management (UK) Limited, which is authorized and regulated by the Financial Conduct Authority;
in other European jurisdictions, by JPMorgan Asset Management (Europe) S.à r.l. In Asia Pacific (“APAC”), by the following issuing entities and in the respective jurisdictions in which they are
primarily regulated: JPMorgan Asset Management (Asia Pacific) Limited, or JPMorgan Funds (Asia) Limited, or JPMorgan Asset Management Real Assets (Asia) Limited, each of which is
regulated by the Securities and Futures Commission of Hong Kong; JPMorgan Asset Management (Singapore) Limited (Co. Reg. No. 197601586K), this advertisement or publication has not
been reviewed by the Monetary Authority of Singapore; JPMorgan Asset Management (Taiwan) Limited; JPMorgan Asset Management (Japan) Limited, which is a member of the Investment
Trusts Association, Japan, the Japan Investment Advisers Association, Type II Financial Instruments Firms Association and the Japan Securities Dealers Association and is regulated by the
Financial Services Agency (registration number “Kanto Local Finance Bureau (Financial Instruments Firm) No. 330”); in Australia, to wholesale clients only as defined in section 761A and 761G
of the Corporations Act 2001 (Commonwealth), by JPMorgan Asset Management (Australia) Limited (ABN 55143832080) (AFSL 376919). For all other markets in APAC, to intended recipients
only.
For U.S. only: If you are a person with a disability and need additional support in viewing the material, please call us at 1-800-343-1113 for assistance.
Copyright 2021 JPMorgan Chase & Co. All rights reserved.
Prepared by: Kerry Craig, Tai Hui, Jasslyn Yeo, Marcella Chow, Ian Hui, Agnes Li and Chaoping Zhu.
Unless otherwise stated, all data are as of 28 February 2021 or most recently available.
Material ID: 0903c02a82674e7f


