STATISTICS PAPER SERIES NO 5 / SEPTEMBER 2014 SOCIAL MEDIA SENTIMENT AND CONSUMER CONFIDENCE Piet J.H. Daas and Marco J.H. Puts In 2014 all ECB publications feature a motif taken from the €20 banknote. NOTE: This Statistics Paper should not be reported as representing the views of the European Central Bank (ECB). The views expressed are those of the authors and do not necessarily reflect those of the ECB.
Transcript
STAT I ST ICS PAPER SER IESNO 5 / SEPTEMBER 2014
SOCIAL MEDIA SENTIMENTAND CONSUMER CONFIDENCE
Piet J.H. Daas and Marco J.H. Puts
In 2014 all ECBpublications
feature a motiftaken from
the €20 banknote.
NOTE: This Statistics Paper should not be reported as representing the views of the European Central Bank (ECB). The views expressed are those of the authors and do not necessarily reflect those of the ECB.
All rights reserved. Any reproduction, publication and reprint in the form of a different publication, whether printed or produced electronically, in whole or in part, is permitted only with the explicit written authorisation of the ECB or the authors. Information on all of the papers published in the ECB Statistics Paper Series can be found on the ECB’s website: http://www.ecb.europa.eu/pub/scientifi c/stats/html/index.en.html
ISSN 2314-9248 (online)ISBN 978-92-899-1403-1 (online)EU Catalogue No QB-BF-14-001-EN-N (online)
AcknowledgementsThe views expressed in this paper are those of the authors and do not necessarily refl ect the policies of Statistics Netherlands. The authors gratefully acknowledge their Statistical Netherlands colleagues Bart Buelens, Jan van den Brakel, Floris van Ruth, Joep Burger, Barteld Braaksma and Peter Struijs for stimulating discussions and constructive remarks. Thierry Thijsen and Frank Scheelen from Coosto are gratefully acknowledged for their assistance during the studies described in this paper and subsequent feedback. This work would not have been possible without the support of those running the innovation programme at Statistics Netherlands.The paper was presented at the ECB’s workshop on using big data for forecasting and statistics, which was held in Frankfurt am Main on 7 and 8 April 2014.
Piet J.H. DaasCBS - Centraal Bureau voor de Statistiek; e-mail: [email protected]
Marco J.H. PutsCBS - Centraal Bureau voor de Statistiek; e-mail: [email protected]
Statistics Paper No 5 / September 2014
1
ABSTRACT Changes in the sentiment of Dutch public social media messages were compared with changes
in monthly consumer confidence over a period of three-and-a-half years, revealing that both
were highly correlated (up to r = 0.9) and that both series cointegrated. This phenomenon is
predominantly affected by changes in the sentiment of all Dutch public Facebook messages.
The inclusion of various selections of public Twitter messages improved this association and the
response to changes in sentiment. Granger causality studies revealed that it is more likely that
changes in consumer confidence precede those in social media sentiment than vice-versa. A
comparison of the development of various seven-day sentiment aggregates with the monthly
consumer confidence series confirmed this finding and revealed that the social media sentiment
lag is most likely in the order of seven days. This indicates that, because of the ease at which
social media sentiment-based data are available and can be processed, they can be published
before the official consumer confidence publication and certainly at a higher frequency. All
research findings are consistent with the notion that changes in consumer confidence and social
media sentiment are affected by an identical underlying phenomenon. An explanation for this
phenomenon can be found in the Appraisal-Tendency Framework (Han et al. 2007), which is
concerned with consumer decision-making. In this framework, it is claimed that a consumer
decision is influenced by two kinds of emotions, namely the incidental and the integral. In this
framework, the integral emotion is relevant for the decision at stake, whereas the incidental
emotion is not. Based on this theory, consumer confidence is likely to be influenced mainly by
the incidental emotion, as consumer confidence is also not measured in relation to an actual
decision to buy something. This suggests that the sentiment in social media messages might
reflect the incidental emotion in that part of the population that is active on social media.
Because of the general nature of the latter, one could denote this the “mood” of the nation
(Lansdall-Welfare et al., 2012) in the context of consumer decision-making. In the paper, the
relationship between social media sentiment and consumer confidence is discussed in depth.
JEL codes C55, O35
Keywords Social media, sentiment, big data, methodology, statistics
Statistics Paper No 5 / September 2014
2
NON-TECHNICAL SUMMARY The relationship between changes in Dutch consumer confidence and Dutch public social media
messages was studied. This revealed a strong association between consumer confidence and the
sentiment in public Facebook messages. More detailed investigations demonstrated that changes
in confidence always preceded changes in Facebook message sentiment. The inclusion of
Twitter message sentiment increased the association. The findings described in the paper are
consistent with the notion that changes in consumer confidence and social media sentiment are
affected by an identical underlying phenomenon. This suggests that the emotion influencing the
answers of respondents to the Dutch consumer confidence survey also affects the sentiment of
messages written by Dutch people who are active on social media.
Statistics Paper No 5 / September 2014
3
1 INTRODUCTION In our modern world, more and more data are generated on the web and produced by sensors in
the ever-growing number of electronic devices surrounding us. The amount of data and the
frequency at which they are produced have led to the concept of “big data”. These kind of data
are very interesting for many organisations, such as private companies, government, central
banks and national statistical institutes. Big data are potentially also very interesting for the
production of official statistics, either for use on their own or in combination with more
traditional data sources, such as sample surveys and administrative registers. However,
harvesting the information from big data and incorporating it into a statistical production
process is challenging. At Statistics Netherlands, big data are already successfully used for the
Consumer Price Index. Here, scanner data from supermarkets and product prices scraped from
the internet provide the majority of the input data. In addition, big data studies are being
conducted on the usability of road sensor data, mobile phone location data and social media
messages for official statistics (Daas et al., 2013). This paper focuses on the latter data source.
Social media are used more and more by increasing numbers of people worldwide. In June 2013
eMarketing (2013) estimated that nearly a quarter of the world population are active on one or
more social networks. However, this contribution varies per country and region. In its 2012
autumn report Eurostat (2012) estimated that 42% of people in the European Union over 12
years of age use social media at least once every week. But for some European countries, this
contribution is much higher and more frequent. In Iceland, a staggering 77% use social media
every day, followed by the Netherlands (60%; Stat. Neth., 2013b), Latvia (44%), Denmark and
Sweden (both 43%). This makes social media in these countries a very interesting source for
studies on social phenomena and other population-related topics (Miller, 2011).
In recent years, a number of studies have been performed on the usability of social media
messages. Although the majority seem to have had a marketing perspective (Kaplan and
Haenlien, 2010), some have looked at it from a more scientific point of view (Miller, 2011;
Groves, 2011). Since we focus on the sentiment in social media in this paper, several important
sentiment-related studies are mentioned here. Landsdall-Welfare et al. (2012) used the
sentiment in Twitter messages to nowcast the mood in the United Kingdom, whereas Bollen et
al. (2010) and Rao and Srivastava (2012) attempted to predict the US stock market with Twitter
sentiment. A considerable number of papers and reports have been written on this particular
topic, for instance one by O’Conner et al. (2010) that linked Twitter sentiment to the public
opinion measured in several polls. This study also includes references to comparable studies by
others. All studies claim to have succeeded fairly well in linking the overall sentiment in the
specific social media platform studied with changes in the time series with which they were
Statistics Paper No 5 / September 2014
4
compared. This has resulted in several companies creating “rapid” indicators based on social
media, usually Twitter, for specific areas. The company Downside Hedge (2013), for instance,
uses Twitter sentiment for stock market analysis as a replacement for weekly surveys.
In this paper, we focus on sentiment in Dutch social media. This includes all publicly accessible
messages on a considerable number of platforms, such as Twitter, Facebook and Linkedin, and
also includes Dutch messages produced on websites, forums and in blogs. The sentiment in
these messages is used as an indication of overall sentiment in the Dutch population, i.e. the
“mood” of the Dutch nation. An initial finding of this phenomenon was presented at the 2013
“New Techniques and Technologies for Statistics” conference (Daas et al., 2013). In this paper,
we describe in depth the relationship between Dutch social media sentiment and consumer
confidence and its potential use. If changes in social media sentiment are indeed related to
Dutch consumer confidence, they could be used as a readily available indicator for changes in
consumer confidence and, as such, may contribute to, or even provide an early indicator of, an
important official statistic. This provides important information on the state of the economy
from a consumer perspective to be used by, for instance, the government, central banks and
policy-makers. If a social media-based indicator can be produced in a methodologically sound
manner, these kind of big data-based statistics have the potential to be cheaper and faster than
official statistics known to date.
Statistics Paper No 5 / September 2014
5
2 DATA AND METHODS 2.1 DATA SOURCES
The study is based on two data sources. The first is consumer confidence data collected and
determined by Statistics Netherlands. Consumer confidence is an index figure that indicates the
extent to which households think that the economy is doing better or worse. The index is based
on the sentiments of households on the economic climate in general and on their own financial
situation (Stat. Neth., 2013a). During the first two weeks of each month Statistics Netherlands
conducts the consumer confidence survey among around 1,000 households. They are asked five
questions that can be answered positively, negatively or neutrally, i.e. the situation has remained
the same. The five questions are about the current and anticipated economic situation of the
Netherlands, the current and anticipated financial situation of the household and if the current
time is considered a good one to buy large goods. The indicator for each question is calculated
by subtracting the percentage of negative answers from the percentage of positive answers.
Consumer confidence is the average net result of all five indicators. Findings for a particular
month are reported in the week following the survey period, usually around the 20th of the
month. Consumer confidence data are available in the electronic databank of Statistics
Netherlands, which is located at: http://statline.cbs.nl/.
Social media messages are the second data source used. Since a large number of messages are
created on various platforms, routinely collecting large amounts of social media messages is a
tremendous effort. For our studies, huge amounts of social media messages were needed on as
many platforms as possible. We therefore purchased access to the collection of public social
media messages gathered by the Dutch company Coosto (2014). This company routinely
collects public social media messages written in the Dutch language on the most popular social
media platforms in the country, such as Twitter, Facebook, Linkedin, Google+ and Hyves. Their
data collection also includes Dutch messages and reaction posted on public blogs and forums, as
well as on many publicly available web pages, such as those of newspapers and news sites. A
total of 400,000 sources are continuously monitored. This has resulted in a collection composed
of more than 3 billion messages covering the period from 2009 to now. Around 2.5 million new
messages are added per day. The messages can be queried in a convenient fashion through a
secure online interface. Coosto also has a collection of social media messages produced in the
United Kingdom.
2.2 SENTIMENT DETERMINATION
Apart from the message’s content and some basic information on the user, the sentiment of the
messages collected is automatically determined by Coosto. This is done by checking whether a
Statistics Paper No 5 / September 2014
6
message expresses a positive or negative opinion. For this purpose, a proprietary variant of a
sentence level-based classification approach is used (for an overview, see Pang and Lee, 2008).
The approach strictly determines the overall sentiment of the combination of words included in
each message. The sentiment classification of the words in the Dutch lexicon is used in a
fashion similar to that described by van Assen et al. (2013), to which the sentiment of the
informal words and emoticons used in social media are added (Velikovich et al., 2010). The
overall sentiment of a message is essentially assigned as Esuli and Sebastiani (2006) describe.
This results in messages to which either a positive, negative or neutral label is assigned. Neutral
messages exhibit no apparent sentiment, e.g. objective sentences. At the level of individual
messages, such a classification will obviously contain errors. However, since we are only
interested in the aggregated sentiment of messages created during specific intervals (e.g. days,
weeks, months), such errors will generally cancel each other out because of the enormous
amounts of messages produced (see O’Conner et al., 2010, for more details). However, they
may still be potentially biased. Our studies usually included aggregates of 2 million-75 million
messages per time interval studied. At the beginning of January 2013, Coosto adjusted its
sentiment determination method by additionally assigning sentiment to messages containing
smileys. This affected the average sentiment values of aggregates; they became more positive.
To correct for this methodological change, the sentiment of daily aggregates in the two months
before and after January 2013 were visually compared and aligned. Usually, the difference was
around 5%. Particularly for Facebook and Twitter messages, routine checks were performed to
verify whether and, if so, how this correction affected our findings by comparing the results
obtained before and after January 2013.
2.3 DATA SELECTION AND ANALYSIS
Coosto’s database of the public Dutch social media messages that were collected was accessed
via a secure web interface. In the interface keywords, a time period and the various social media
platforms to include were specified. Query results in the period studied, such as the total number
of messages and the number of messages for which positive and negative sentiment were
assigned, were exported at an aggregated level. Results were routinely exported as daily
aggregates in CSV format for more rigorous analysis. For this, the open source statistical
software environment R was used (R Development Core Team, 2012). In R, the CSV files were
loaded and the total number of messages for which positive and negative sentiment were
assigned were aggregated at selected time intervals, e.g. 7, 14, 21 or 28 days. The average
sentiment for each interval was calculated by subtracting the percentage of messages classified
as negative from that of those classified as positive. Next, the social media sentiment findings
were aligned with monthly consumer confidence data covering the same period.
Statistics Paper No 5 / September 2014
7
The relationship between series of individual and multiple social media messages produced on
various platforms and consumer confidence was compared with standard linear regression
models. Models with and without interaction effects were considered. All messages produced
during a specific time interval were aggregated and the development of the average sentiment
was compared with consumer confidence. To determine the quality of the linear model for each
series, leave-out-one cross validation studies (Arlot and Celisse, 2010) were performed.
Average correlation and cointegration values were determined (see below) and the average
residual sum of squares was used as an additional measure of fit.
Pearson’s product-moment correlation coefficients (r) of sentiment and consumer confidence
were determined with the base cor function of R. Series were routinely checked by visual
inspection, e.g. the creation of scatter plots. The concept of cointegration was used to check for
stationary linear combinations of sentiment and consumer confidence (Murray, 1994).
Cointegration was calculated according to the Engle-Granger two-step method (Engle and
Granger, 1987), i.e. after fitting a linear model, an augmented Dickey–Fuller (adf) test was
performed on the residuals. For this, the adf-test function in the tseries package was used
(Trapletti and Hornik, 2013). Series with a p-value below 0.05 were considered to cointegrate.
Auto- and cross-covariance and -correlation of the residuals, to check for seasonality and trends,
were studied with the appropriate functions in the astsa package (Stoffer, 2012). Independence
of the residuals was also checked with the Durbin-Watson test in the lmtest package (Zeileis and
Hothorn, 2002). Granger causality was used to study the predictive relationship between social
media sentiment and consumer confidence and vice-versa. These analyses rest on the
assumption that if one particular variable affects another, changes in the first will systematically
occur before changes in the other. If this is the case, lagged values of the first will exhibit a
statistically significant correlation with the other variable. For these analyses, the granger.test
function in the lmtest package was used (Zeileis and Hothorn, 2002). Forecast skills scores were
calculated as described by Murphy (1988) with 50% chance as the standard of reference and
increase or decrease as possible outcomes.
Statistics Paper No 5 / September 2014
8
3 RESULTS 3.1 EXPLORATORY ANALYSIS
Our initial studies revealed a sharp increase in the number of social media messages in the data
set from June 2010 onwards. The latter corresponded to the starting period at which the
collection of public Dutch Twitter messages was initiated at a large scale. After that around 75
million messages were added each month, corresponding to an average of 2.4 million messages
a day. Because of this our studies focused on the period June 2010 until November 2013; a
period of 42 months. Note that this is a relatively short period for time series analysis. An
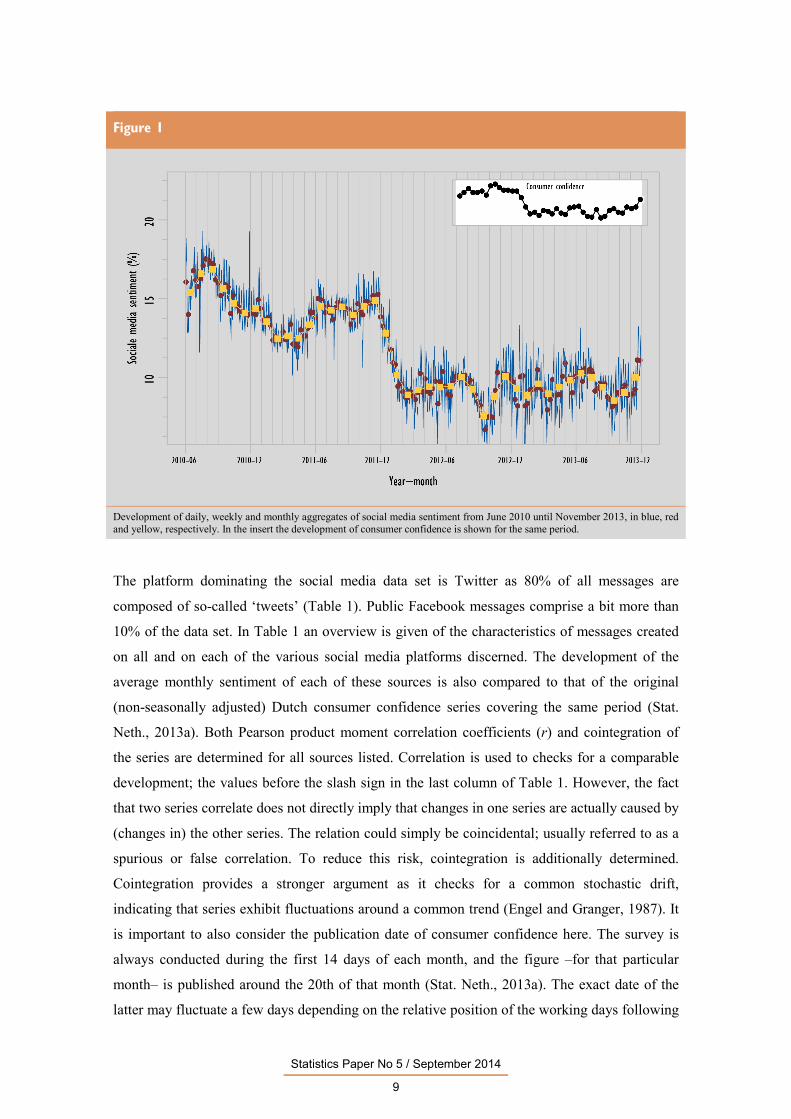
overview of the sentiment data, aggregated at a daily, weekly and monthly level, including an
insert of the development of consumer confidence for the same period is shown in Figure 1. A
visual comparison of the data in this figure suggests that consumer confidence and monthly
aggregated social media sentiment display a similar development. The figure also reveals that
daily sentiment fluctuated tremendously while weekly and monthly aggregates behaved much
less volatile. Particularly prominent are the positive daily and weekly sentiment peaks near the
end of December for 2010 and 2011. A similar situation has been reported for the UK
(Lansdall–Welfare et al., 2012) and was due to an increase of more positive messages related to
Christmas and New Year during that period. This was also the case here, but over the years the
sentiment in the Dutch data set gradually decreased because of the increase in the number of
negative messages complaining about firework nuisance. Studies focused on the identification
of other patterns in the daily sentiment data suggested a weekly pattern, with a somewhat higher
sentiment on Fridays and during the weekend. No clear other seasonal patterns became
apparent. Hence, in subsequent studies it was decided to use aggregated sentiment data of one
and more 7-day periods.
Statistics Paper No 5 / September 2014
9
Figure 1
Development of daily, weekly and monthly aggregates of social media sentiment from June 2010 until November 2013, in blue, red and yellow, respectively. In the insert the development of consumer confidence is shown for the same period.
The platform dominating the social media data set is Twitter as 80% of all messages are
composed of so-called ‘tweets’ (Table 1). Public Facebook messages comprise a bit more than
10% of the data set. In Table 1 an overview is given of the characteristics of messages created
on all and on each of the various social media platforms discerned. The development of the
average monthly sentiment of each of these sources is also compared to that of the original
(non-seasonally adjusted) Dutch consumer confidence series covering the same period (Stat.
Neth., 2013a). Both Pearson product moment correlation coefficients (r) and cointegration of
the series are determined for all sources listed. Correlation is used to checks for a comparable
development; the values before the slash sign in the last column of Table 1. However, the fact
that two series correlate does not directly imply that changes in one series are actually caused by
(changes in) the other series. The relation could simply be coincidental; usually referred to as a
spurious or false correlation. To reduce this risk, cointegration is additionally determined.
Cointegration provides a stronger argument as it checks for a common stochastic drift,
indicating that series exhibit fluctuations around a common trend (Engel and Granger, 1987). It
is important to also consider the publication date of consumer confidence here. The survey is
always conducted during the first 14 days of each month, and the figure –for that particular
month– is published around the 20th of that month (Stat. Neth., 2013a). The exact date of the
latter may fluctuate a few days depending on the relative position of the working days following
Statistics Paper No 5 / September 2014
10
the survey period. Monthly sentiment aggregates will therefore also include days in which
consumer confidence –for that particular month– is already publically known. We therefore also
compared the ‘monthly’ sentiment of the combination of social media messages produced in the
second half of the previous month (after the survey period for that month) combined with those
produced in the first half of the current month (during the survey period for that month and,
certainly, before the moment of publication). The messages produced during such periods make
maximum use of the sentiment-related information available and are expected to be less likely
influenced by the consumer confidence findings for the month to which they are compared. The
results for this adjusted time interval are shown in the last column of Table 1 (after the slash
sign).
These studies reveal that changes in the sentiment of public Facebook messages not only highly
correlate with consumer confidence, r = 0.81 and 0.85 depending on the time interval, but that
these series also cointegrate. This clearly demonstrates a good association between both series,
but says nothing about an underlying cause. Sentiment data of the other platforms and of the
combination of all messages display various degrees of correlations that do not cointegrate,
suggesting none or a much poorer association. To test whether changes in Facebook sentiment
preceded changes in consumer confidence or vice-versa, Granger causality analysis were
performed. These analysis rest on the assumption that if a particular variable affects another
variable, changes in the first will systematically occur before changes in the other. If this is the
case, lagged values of the first will exhibit a statistically significant correlation with the other
variable. Lagging the period for Facebook on consumer confidence by one or more months did
not reveal an additional effect. Lagging the period for consumer confidence data by one month,
however, did reveal a significant effect on Facebook sentiment; p < 0.001 for the series in which
the days in each month completely coincided and p < 0.05 for the series with an adjusted time
interval. This and the difference between those p-values suggest that Facebook sentiment is very
likely affected by consumer confidence. Since this is even the case for the series with the
adjusted time interval, which did not include messages produced during the time consumer
confidence is published for that particular month, this suggests that both might be affected by a
common underlying cause.
Statistics Paper No 5 / September 2014
11
Table 1 Social media message properties for various platforms and their correlation with consumer confidence
Social media
platform
Number of social media messages1
Number of messages
as percentage of total (%)
Number of messages in which sentiment
was assigned
(%)
Average sentiment
(%)
Correlation coefficient of monthly sentiment index and
consumer confidence (r)2
All platform combined
3,161,538,534 100 36.8 13.0 0.75 / 0.78
Facebook 334,894,060 10.6 34.1 20.5 0.81* / 0.85*
Twitter 2,531,627,287 80.1 35.7 11.6 0.68 / 0.70
Hyves 45,288,698 1.4 45.2 22.8 0.50 / 0.58
News sites 56,598,982 1.8 46.1 -1.5 0.37 / 0.26
Blogs 49,366,962 1.6 64.4 39.4 0.25 / 0.22
Google+ 644,042 0.02 39.8 19.6 -0.04 / -0.09
Linkedin 565,811 0.02 47.9 25.7 -0.23 / -0.25
Youtube 5,665,644 0.2 43.6 16.7 -0.37 / -0.41
Forums 136,887,048 4.3 47.3 15.9 -0.45 / -0.49 1 period covered June 2010 to November 2013 2 values after the slash cover messages produced in second half of previous month and first half of current month (see text) * Integration of order 1 and cointegration
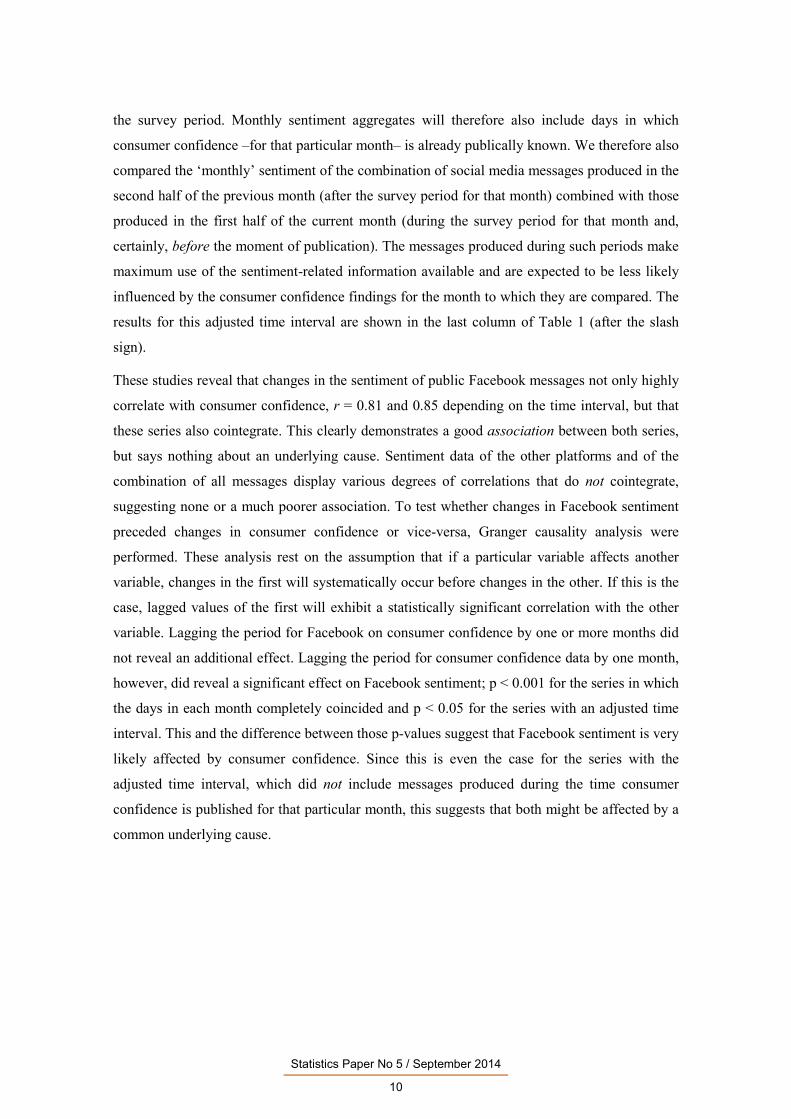
Visual plots of the relative development of daily aggregated sentiment on each of the social
media platforms provided additional insights. In Figure 2, the development of the sentiment for
Twitter clearly demonstrates a decrease around the period consumer confidence dropped
(compare this with the insert in Figure 1) and it is the only platform with a clear increase in
sentiment at the end of the series, i.e. November 2013. This was also the onset of a steady
increase in consumer confidence in the Netherlands (Stat. Neth., 2013a). This prompted us to
investigate if any combination or subset(s) of social media messages were able to capture these
phenomena.
Statistics Paper No 5 / September 2014
12
Figure 2
Relative development of daily aggregates of social media sentiment on the various platforms during the period studied. Facebook and Twitter account for 10 and 80% respectively of all messages collected.
3.2 EFFECT OF FACEBOOK AND TWITTER MESSAGES
Since Twitter and Facebook clearly dominated the social media dataset, the messages collected
on these platforms were investigated thoroughly. Messages produced on the other platforms
were also included in our studies, but these provided no additional information and are therefore
no longer discussed. This is not unexpected considering there were few of them (see Table 1).
Many combinations of messages produced on Facebook and/or Twitter were tested with and
without specific words being used as selection criteria. The latter approach was inspired by an
earlier study performed at our office that revealed that nearly 50% of all Twitter messages
produced in the Netherlands can be considered “pointless babble” (Daas et al. 2012), which
made them potentially less interesting. Perhaps selecting messages that only contained specific
words could positively affect the association between social media sentiment and consumer
confidence. The relationship between series of individual and combined Facebook and Twitter
messages – with and without specific words being used as selection criteria – and consumer
confidence was compared with standard linear regression models. Models with and without
interaction effects were considered.
Statistics Paper No 5 / September 2014
13
Messages were aggregated and assigned to months according to the adjusted time interval
described above. All messages produced during a specific time interval were aggregated and the
development of the average sentiment was compared with consumer confidence. Leave-out-one
cross-validation studies (Arlot and Celisse, 2010) were used to determine the quality of the
model. Average correlation and cointegration values were determined and the average residual
sum of squares was used as an additional measure of fit. Granger causality of the effect of the
sentiment on consumer confidence and vice-versa was also determined. This work revealed that
a considerable number of the combination of all public Facebook messages and selected Twitter
messages containing specific words displayed high correlation coefficients with consumer
confidence. Many of these series also cointegrated. Combinations in which selected Facebook
messages were included performed worse than the combination of all Facebook messages. The
effect of including interaction effects in the models when using combinations of sources varied.
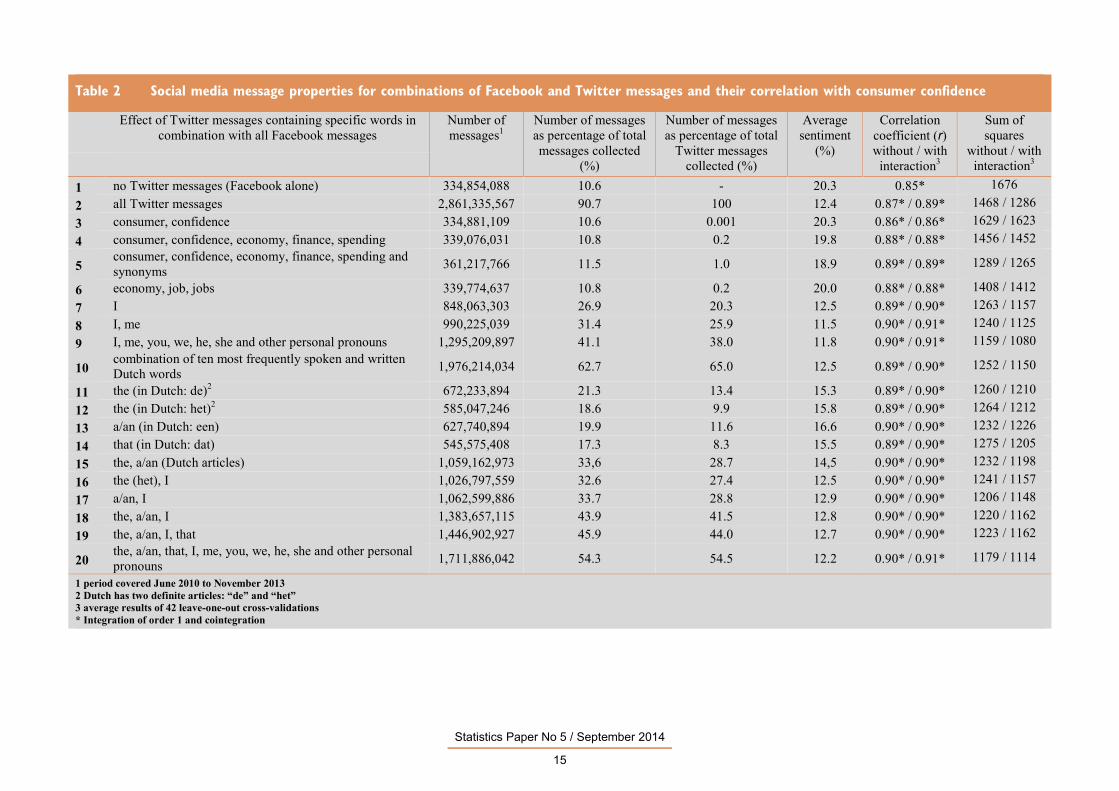
Table 2 shows the results of the best-performing combinations of all Facebook and selected
Twitter messages. They all display high correlation coefficients (at least r = 0.86) and they all
cointegrate. The findings for Facebook alone are listed at the top of the table, followed by those
for the combination of Facebook and all Twitter messages. Table 2 shows three distinct types of
selection criteria. The first is the use of words equal or related to consumer confidence or to
those used in the questions asked to determine it (Nos 3-6 in Table 2). The second approach
focuses on messages containing personal pronouns, such as ‘I’, ‘me’, ‘you’ and ‘us’, reflecting
personal or group experiences (Nos 7-9). The third group contains the words or combinations of
words used most often in the Dutch language, both written and spoken (Nos 10-14). Examples
of this are the Dutch articles and the words “this” and “that”. In addition, combinations of words
included in the second and third groups are also considered (Nos 15-20).
The regression models without interaction indicated that, in all cases shown in Table 2, the
inclusion of both Facebook and Twitter messages significantly contributed to the model (p <
0.001) and that the β-coefficients (slopes) of both sources were positive. With sentiment on the
x-axis and confidence on the y-axis, the β0-coefficient (intercept) was negative in all cases,
reflecting the fact that average social media sentiment was much more positive than average
consumer confidence over the period studied (see also Table 1). Visual inspection and checks
for autocorrelation of the residuals of the models revealed no apparent trend. The results of
Granger causality analysis, to specifically check if the sentiment in any of the combinations of
sources preceded consumer confidence, differed somewhat for the various combinations shown
and for the models with and without interaction. The p-values were usually lower for the models
that included an interaction component. Some of the combinations listed in Table 2 suggested
that sentiment potentially had an effect on consumer confidence (p < 0.01; not shown). The
latter suggests a probability for a preceding effect on consumer confidence from social media
Statistics Paper No 5 / September 2014
14
sentiment. These findings support the idea that some of these combinations could be able to
detect “upcoming” changes in consumer confidence. What Table 2 also reveals is that each of
the different types of selection criteria tested works. Using words specifically related to
consumer confidence or the economy provides positive results (Nos 5 and 6 in Table 2), as does
using all the personal pronouns (Nos 7-9) or including words in the Dutch language that are
used with a high frequency (Nos 10-13). The most intriguing result in Table 2 is the fact that,
when the combined top ten most frequently written and spoken Dutch words are used as
selection criteria for Twitter messages (No 10 in Table 2), a mere 65% of the total number of
messages are included. Inspecting the excluded messages revealed that more than 90% of them
can be designated pointless babble.
Statistics Paper No 5 / September 2014
15
Table 2 Social media message properties for combinations of Facebook and Twitter messages and their correlation with consumer confidence
Effect of Twitter messages containing specific words in
combination with all Facebook messages Number of messages1
Number of messages as percentage of total messages collected
20 the, a/an, that, I, me, you, we, he, she and other personal pronouns 1,711,886,042 54.3 54.5 12.2 0.90* / 0.91* 1179 / 1114
1 period covered June 2010 to November 2013 2 Dutch has two definite articles: “de” and “het” 3 average results of 42 leave-one-out cross-validations * Integration of order 1 and cointegration
Statistics Paper No 5 / September 2014
16
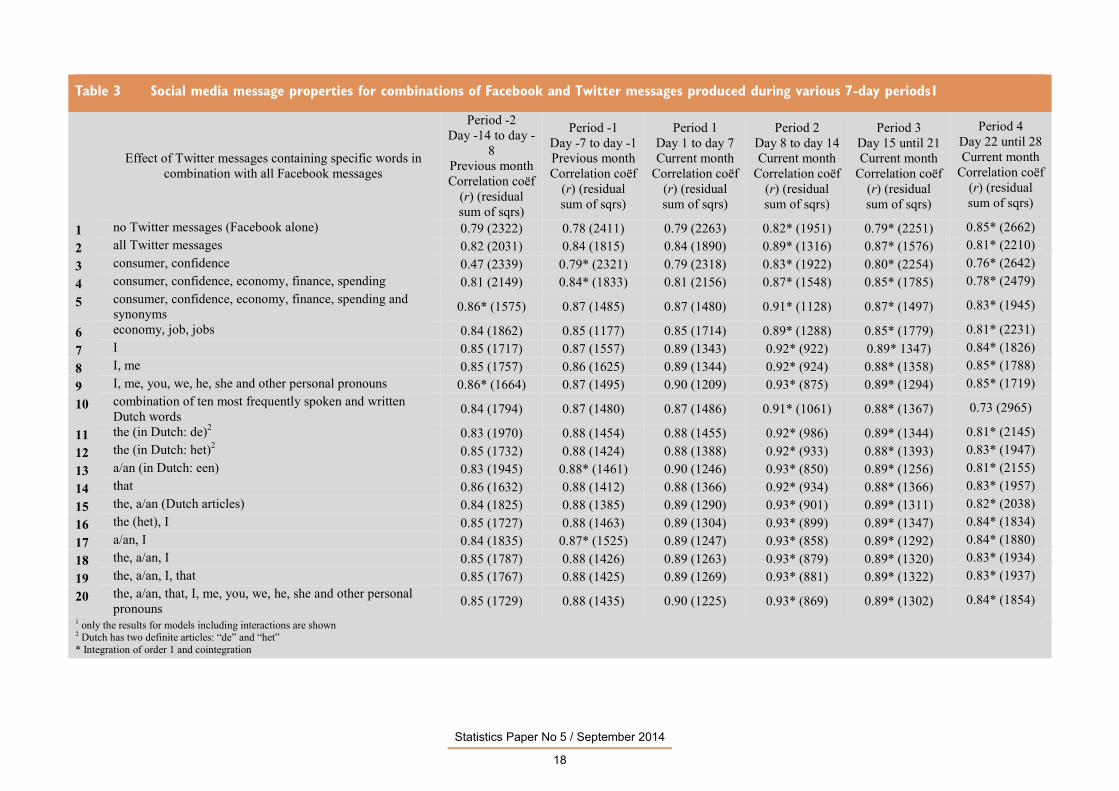
3.3 EFFECT OF DIFFERENT SEVEN-DAY PERIODS AND FORECASTING PROPERTIES
Since the consumer confidence survey is conducted during the first half of the month, attention
was also focused on comparing the average social media sentiment for various seven-day
periods before, during and after the survey period. These periods started 14 days before and
ended 28 days after the beginning of the month. All combinations listed in Table 2 were tested.
For each series, leave-out-one cross-validation studies were performed. These revealed that very
high correlation coefficients, up to r = 0.93, were found for the period coinciding with the
second half of the survey period, i.e. day 8 to day 14 (see Table 3). Every combination in this
and the subsequent two seven-day periods cointegrated. Correlations for the first seven days of
the week, i.e. the first part of the survey period, were somewhat lower and did not cointegrate
for any combination, which suggests a clear distinction between the development of the
sentiment of social media messages produced during the first and second half of the survey
period. In this respect, it is important to note that the response to the survey is routinely highest
during the first seven days, in which around 70% of the total response is usually obtained. These
findings are clearly not reflected in the sentiment of the social media messages produced during
that period. The best-performing model overall for any of the seven-day periods listed in Table
3 based on correlation, cointegration and the residual sum of squares was the combination of all
Facebook and Twitter messages containing any of the Dutch articles, “that” or personal
pronouns (No 20). When aggregates of longer periods were compared, e.g. 14, 21 and 28 days,
all 28-day aggregates and any aggregate covering day 8 to day 21 or day 15 to day 28
cointegrated with consumer confidence. The best 28-day period was the combinations of
messages produced in the last 14 days of the previous month and the first 14 days of the current
month. These results are shown in Table 2. Here, the best results were again obtained for the
combination of all Facebook and Twitter messages containing any of the Dutch articles, “that”
or personal pronouns (No 20).
The combinations were also checked for their ability to pick up the increase in consumer
confidence observed in November 2013 (Figure 1). Sentiment combinations were fitted to
consumer confidence data with the exception of the last month. Messages produced during
various seven-day intervals, as shown in Table 3, or combinations thereof were tested and the
predicted value of month 42 was compared with the actual increase measured. Linear models
with and without interaction were used. The best-performing models used the sentiment of
messages produced between the 22nd and 28th days of the month; all other periods performed
much worse. Models without interaction usually performed somewhat better, as did
combinations that included large amounts of Twitter messages. The combination of all
Facebook and all Twitter messages performed best here: 93% of the increase was picked up.
Next was the combination of Facebook and Twitter messages containing the Dutch articles,
Statistics Paper No 5 / September 2014
17
“that” and personal pronouns (No 20) with an increase of 88%. Attempts to use changes in
social media sentiment to predict changes in consumer confidence with any of the combinations
and periods listed in Table 3 were unsuccessful. Here, an increase or decrease in consumer
confidence was predicted for each month and 50% chance was used as the reference forecast,
i.e. a forecast skill score of zero. A maximum score (Murphy, 1988) of 0.12 was found for a
number of the combination shown in Table 3 for messages produced between the 22nd and 28th
days of the month, where a value of one identifies the perfect score.
3.4 COMPARISON WITH UK-DATA
At the end of the study, the relationship between the sentiment in social media messages and
consumer confidence was checked for UK data. The Dutch firm that provided access to Dutch
messages also routinely collects public social media messages produced on various platforms in
the United Kingdom. Again, data were available from June 2010 onwards. Results were
compared with GfK’s monthly consumer confidence barometer (2014), which showed more
volatile behaviour, reflecting the somewhat poorer quality compared with the Statistics
Netherlands survey results. Even with this in mind, it was found that social media sentiment in
publicly available social media messages in the United Kingdom correlated highly (r = 0.8) with
UK consumer confidence. However, these results were only achieved if one specific month
(August 2012) was removed from the sentiment series. This period roughly covered the
Olympic Games that were held in London from 27 July to 12 August. Social media was used
very actively by athletes, journalists, the Olympic committee and the public during the
Olympics to inform and cheer on the Olympic athletes (see SportLaw, 2012 and references
therein). Positive sentiment peaked tremendously, especially when an athlete won a gold medal.
This change in the routine use of social media by both UK residents and visitors clearly had a
negative effect on the more common relationship observed before and after the Olympic Games
between social media sentiment and consumer confidence. With the understandable exception
of August 2012, the UK results corroborate the Dutch findings.
Statistics Paper No 5 / September 2014
18
Table 3 Social media message properties for combinations of Facebook and Twitter messages produced during various 7-day periods1
Effect of Twitter messages containing specific words in
combination with all Facebook messages
Period -2 Day -14 to day -
8 Previous month Correlation coëf
(r) (residual sum of sqrs)
Period -1 Day -7 to day -1 Previous month Correlation coëf
11 the (in Dutch: de)2 0.83 (1970) 0.88 (1454) 0.88 (1455) 0.92* (986) 0.89* (1344) 0.81* (2145) 12 the (in Dutch: het)2 0.85 (1732) 0.88 (1424) 0.88 (1388) 0.92* (933) 0.88* (1393) 0.83* (1947) 13 a/an (in Dutch: een) 0.83 (1945) 0.88* (1461) 0.90 (1246) 0.93* (850) 0.89* (1256) 0.81* (2155) 14 that 0.86 (1632) 0.88 (1412) 0.88 (1366) 0.92* (934) 0.88* (1366) 0.83* (1957) 15 the, a/an (Dutch articles) 0.84 (1825) 0.88 (1385) 0.89 (1290) 0.93* (901) 0.89* (1311) 0.82* (2038) 16 the (het), I 0.85 (1727) 0.88 (1463) 0.89 (1304) 0.93* (899) 0.89* (1347) 0.84* (1834) 17 a/an, I 0.84 (1835) 0.87* (1525) 0.89 (1247) 0.93* (858) 0.89* (1292) 0.84* (1880) 18 the, a/an, I 0.85 (1787) 0.88 (1426) 0.89 (1263) 0.93* (879) 0.89* (1320) 0.83* (1934) 19 the, a/an, I, that 0.85 (1767) 0.88 (1425) 0.89 (1269) 0.93* (881) 0.89* (1322) 0.83* (1937) 20 the, a/an, that, I, me, you, we, he, she and other personal
pronouns 0.85 (1729) 0.88 (1435) 0.90 (1225) 0.93* (869) 0.89* (1302) 0.84* (1854) 1 only the results for models including interactions are shown 2 Dutch has two definite articles: “de” and “het” * Integration of order 1 and cointegration
Statistics Paper No 5 / September 2014
19
4 DISCUSSION The results described above confirm that there is an association between (changes in) social
media sentiment and consumer confidence for both the Netherlands and the United Kingdom.
This relationship remained stable during the period investigated in our studies, with the
exception of August 2012 in the United Kingdom. This indicated that major changes in the
behaviour of the public on social media, such as those caused by important events (like the
Olympic Games), can have a disturbing effect. Studies of Dutch social media indicated that
public Facebook messages alone are already capable of capturing this phenomenon. This is
interesting, as the majority of those in the Dutch population who are active on social media,
about 70%, report that they use Facebook (Stat. Neth., 2013b). Granger causality studies for
Facebook demonstrated that it is very likely that the changes in the sentiment in the public
messages produced on this platform are affected after consumer confidence changes. The
combination of public Facebook and Twitter messages containing any of the Dutch articles,
“that” or personal pronouns (No 20 in Tables 2 and 3) are best at capturing this relationship and
responded better to changes in sentiment. The fact that Twitter messages containing such
generally used words are – in combination with Facebook – most effective suggests that a
general “mood” is (indirectly) measured. Since models including an interaction component had
a tendency to perform somewhat better, this also supports the idea that a generally occurring
“mood” is measured, as this suggests that sentiment changes occurring on both platforms are
also considered important. An explanation for the phenomenon observed can be found in the
Appraisal-Tendency Framework (Han et al. 2007), which is concerned with consumer decision-
making. In this framework, it is claimed that a consumer’s decision is influenced by two kinds
of emotions: the incidental emotion and the integral emotion. In this framework, the incidental
emotion is irrelevant for a decision at stake, whereas the integral emotion is relevant. Based on
this theory, consumer confidence is likely to be influenced mainly by the incidental emotion, as
consumer confidence is not measured in relation to an actual decision to buy something. With
this in mind, our research findings suggest that the sentiment in social media messages might
reflect the incidental emotion in that part of the population active on social media. Because of
the general nature of the latter, it would not surprise us if someone were to denote it the “mood”
of the nation (Lansdall-Welfare et al., 2012).
Comparing messages produced during different seven-day periods revealed that the sentiment in
messages produced on days 8 to 14 of each month correlated best with consumer confidence; r
= 0.93 were the highest correlations found. Since series that correlate highly do not have to
result from a common underlying cause, i.e. the relationship could simply be coincidental,
additional checks were performed. Cointegration indicated that both series share a common
Statistics Paper No 5 / September 2014
20
stochastic drift, supporting the idea of long-term stability. Since the response to the consumer
confidence survey is predominantly obtained in the first seven days of the 14-day survey period,
which starts at the beginning of the month, this supports the idea of a (short) delay between
changes in consumer confidence and social media sentiment. A delay was also observed when
only Facebook messages were compared. This, combined with the fact that attempts to predict
consumer confidence with social media sentiment performed very poorly, also supports the
notion of a lag between both. All our results are consistent with the notion that changes in an
apparent “mood” of the Dutch population both affect that part of the population responding to
the consumer confidence survey and that part of the population creating public Facebook and
Twitter messages in the same direction and, for social media, with a lag of around seven days.
As such, developing a real-time indicator of the “mood” of the nation based on social media
only seems possible if one accepts a short, possibly seven-day, lag. Because of this lag, the
claim of Lansdall-Welfare et al. (2012) that social media could be used to ”nowcast” the mood
of the nation is not fully supported by our findings. However, it is still a bit faster and can
certainly be determined more frequently than the survey that probably also reflects this “mood”
best: the consumer confidence survey. Combining both would be ideal.
It was also found that the sentiment in social media is biased, as it is much more positive than
consumer confidence, assuming that the latter is closer to the truth. Based on the notion that a
similar “mood” affects both, the public active on social media clearly has a tendency to respond
in a much more positive way. Perhaps this is a reflection of the tendency of people active on
social media to report the positive things occurring in their life. It could also result from a
difference in the age composition of the persons included in these sources, as younger and
elderly people have a tendency to respond more and in a less positive way respectively (Stat.
Neth., 2013c). This was observed in the consumer confidence survey. The bias observed could
also be an indication that two – apparently cointegrated – non-identical phenomena are
compared. Quantifying the contributing effect of social media sentiment on consumer
confidence, for various age groups, could be a way to determine which of these options is more
likely to be correct.
Comparing the people responding to the survey and those active on social media brings us to a
very intriguing part of this study: the relationship between consumer confidence and social
media sentiment from a population point of view. Even though our study revealed that there
clearly is an association between both, the units used to determine confidence and sentiment are
obviously different. The units of the consumer confidence survey are households, from which a
representative (the “head”; a person) is contacted and interviewed (Stat. Neth., 2013a). Usually,
around 1,000 persons respond to the survey each month. For social media, the public messages
Statistics Paper No 5 / September 2014
21
written in Dutch are collected and treated as if they are the units. Of these, millions to tens of
millions are produced per month. Such messages were included in our analysis. Since
confidence and sentiment are calculated in exactly the same way, i.e. the percentage of positives
minus that of negatives, their development can be easily compared. Based on this and the fact
that the population involved in the consumer confidence survey is a representative part of the
Dutch population (Stat. Neth., 2013b), one is tempted to conclude that (the changes in) both
variables (sentiment and confidence) must also be representative (Buelens et al., 2013). Is this,
in the case of social media, an example of the law of large numbers in action? One is tempted to
conclude this, as the collection of social media messages is clearly an example of observational
data – data collected without a design. From a big data perspective (Daas and Puts, 2014), it is
good in such cases to strive to cover such a dataset completely. And this is exactly what the
Dutch company Coosto does – it attempts to collect as many public social media messages on as
many publicly accessible platforms as possible. Another explanation could be that the
underlying phenomenon studied is simply less affected by differences in the composition of the
population from which each variable is derived. As a result, even despite these differences the
changes observed for both sentiment and confidence are expected to behave quite similar. This
might be the case for monthly and weekly aggregated sentiment data, but obviously not for
daily sentiment data (see Figure 1). In addition, the fact that younger people are more active on
social media (Eurostat, 2012; Stat. Neth., 2013b) and respond more positively in the consumer
confidence survey (Stat. Neth., 2013c) could explain the bias observed, but it does not support
the idea of a phenomenon badly affected by variations in the composition of the population
included. A recent Facebook study supports the idea of the occurrence of a general “mood” in a
network. Kramer et al. (2014) found that the emotions expressed by others on Facebook
influenced the emotional state of messages created by the individuals reading them. To be sure
of what is going on, it is essential to study the changes in social media sentiment from a
population perspective. It will be interesting to see whether this approach affects the relationship
with the consumer confidence survey findings and, if so, how. It will also be interesting to start
by studying the selectivity of the population active on Dutch social media. This is a challenge,
as not all users provide easily identifiable information in their user profile (Daas et al., 2012),
some accounts are clearly managed by companies rather than by individuals and not everybody
in the Netherlands posts messages on social media platforms (Buelens et al., 2014). Clearly,
more scientific research is needed to fully comprehend the phenomenon described in this study.
Providing no major events occur in the Netherlands that affect behaviour on social media and
assuming that the bias between both series remains constant, our findings support the idea that
social media could be used to enhance official statistics, e.g. by producing a weekly indicator
based on social media sentiment. Initial results reveal that this is a much more volatile figure. In
Statistics Paper No 5 / September 2014
22
this respect, it is also interesting to investigate the relationship with the five individual
indicators on which consumer confidence is based. In addition, one could also attempt to
“extract” opinions on other topics from social media, providing enough messages are available
that capture the topic of interest. Future studies will focus on all of the above.
Statistics Paper No 5 / September 2014
23
5 CONCLUSION The studies described in this report reveal a clear association between changes in the sentiment
of Dutch social media messages and consumer confidence. It is primarily Facebook messages
that affect this relationship, followed by Twitter messages. It was also revealed that changes in
the sentiment of social media routinely preceded changes in consumer confidence. This lag is in
the order of seven days. Provided that the relationship between both series remains stable, our
studies indicate that figures based on social media sentiment can be published before the
monthly official consumer confidence publication and certainly at a higher frequency. Because
of the ease at which social media are available and at which the data were able to be processed,
a weekly indicator is a very interesting option.
Statistics Paper No 5 / September 2014
24
REFERENCES Arlot, S. and Celisse, A. (2010), “A survey of cross-validation procedures for model selection”, Statistics Surveys, Vol. 4, pp. 40-79.
Bollen J., Mao H. and Zeng, X-J. (2011), “Twitter mood predicts the stock market”, Journal of Computational Science 2 (1), pp. 1-8.
Buelens, B., Daas, P., Burger, J., Puts, M. and van den Brakel, J. (2013), “Selectivity of big data”, Internal report, Statistics Netherlands, Heerlen, The Netherlands.
Coosto (2014), “Online radar” website, available at: http://www.coosto.com/
Daas, P.J.H. and Puts, M.J.H. (2014), “Big data as a source of statistical information”, The Survey Statistician, No 69, pp. 22-31.
Daas, P.J.H., Puts, M.J., Buelens, B. and van den Hurk, P.A.M. (2013), “Big data and official statistics”, Paper for the 2013 “New techniques and technologies for statistics” conference, Brussels, Belgium.
Daas, P.J.H., Roos, M., van de Ven, M. and Neroni, J. (2012), “Twitter as a potential data source for statistics”, Discussion paper, No 201221, Statistics Netherlands, The Hague/Heerlen, The Netherlands.
Downside Hedge (2013), “Twitter indicators for stock market analysis”, available at http://www.downsidehedge.com/twitter-indicators/
eMarketeers (2013), “Social networking reaches nearly one in four around the world”, available at http://www.emarketer.com/Article/Social-Networking-Reaches-Nearly-One-Four-Around-World/1009976
Engle, R.F. and Granger, C.W.J. (1987), “Co-integration and error correction: representation, estimation and testing”, Econometrica, Vol. 55, No 2, pp. 251-276.
Esuli, A. and Sebastiani, F. (2006), “Senti WordNet 3.0: an enhanced lexical resource for sentiment analysis and opinion mining, Proceedings of Language Resources and Evaluation (LREC), pp. 2200-2004, available at: http://www.lrec-conf.org/proceedings/lrec2010/pdf/769_Paper.pdf
Eurostat (2012), “Media use in the European Union”, Standard Eurobarometer report 78, autumn, available at http://ec.europa.eu/public_opinion/archives/eb/eb78/eb78_media_en.pdf
GfK (2014), “Consumer confidence barometer data”, available at http://www.gfk.com/uk/Documents/Press-Releases/Charts%20%28December%202013%29%20 %282%29.pdf
Groves, R.M. (2011), “Three eras of survey research”, Public Opinion Quarterly, Vol. 75, No 5, pp. 861-871.
Han, S., Lerner, J.S. and Keltner, D. (2007), “Feelings and consumer decision making: the appraisal-tendency framework”, Journal of Consumer Psychology, Vol. 17, No 3, pp. 158–168.
Kaplan A.M. and Haenlien, M. (2010), “Users of the world, unite! The challenges and opportunities of social media”, Business Horizons, Vol. 53, No 1, pp. 59–68.
Statistics Paper No 5 / September 2014
25
Kramer, A.D.I., Guillory, J.E. and Hancock, J.T. (2014), “Experimental evidence of massive-scale emotional contagion through social networks”, PNAS, Vol. 111, No 24, pp. 8788-8790.
Lansdall-Welfare, T., Lampos, V. and Cristianini, N. (2012), “Nowcasting the mood of the nation”, Significance, Vol. 9, No 4, pp. 26-28.
Miller, G. (2011), “Social scientists wade into the tweet stream”, Science, Vol. 333, No 6051, pp. 1814-1815.
Murphy, A.H. (1988), “Skill scores based on the mean square error and their relationships to the correlation coefficient”, Monthly Weather Review, Vol. 116, No 12, pp. 2417–2424.
Murray, M.P. (1994), “A drunk and her dog: an illustration of cointegration and error correction”, The American Statistician, Vol. 48, No 1, pp. 37-39.
O’Connor, B., Balasubramanyan, R., Routledge, B.R. and Smith, N.A. (2010), “From tweets to polls: linking text sentiment to public opinion time series”, Proceedings of the Fourth International AAAI Conference on Weblogs and Social Media, 23-26 May, Washington DC, USA.
Pang, B. and Lee, L. (2008), “Opinion and sentiment mining”. Foundations and Trends in Information Retrieval, Vol. 2, Nos 1-2, pp. 1-135.
R Development Core Team (2009), “R: a language and environment for statistical computing”, R Foundation for Statistical Computing, Vienna, Austria, available at http://www.R-project.org
Rao, T. and Srivastava, S. (2012), “Twitter sentiment analysis: how to hedge your bets in the stock markets”, available at http://arxiv.org/pdf/1212.1107.pdf
SportLaw (2012), “Socialympics: how sports organizations and athletes used social media at London 2012”, available at http://www.sportlaw.ca/wp-content/uploads/2013/01/Social-Media-and-the-Games.pdf
Stat. Neth. (2013a) “Consumer confidence”, Statistics Netherlands web page, available at http://www.cbs.nl/en-GB/menu/themas/dossiers/conjunctuur/publicaties/conjunctuurbericht/inhoud/ conjunctuurklok/toelichtingen/ck-03.htm
Stat. Neth. (2013b), “Seven in ten internet users active on social media”, Statistics Netherlands web magazine, 4 October, available at http://www.cbs.nl/en-GB/menu/themas/vrije-tijd-cultuur/publicaties/artikelen/archief/2013/2013-3907-wm.htm
Stat. Neth. (2013c), “Consumer confidence according to age groups” (in Dutch), Statline pages of Statistics Netherlands, available at http://statline.cbs.nl/StatWeb/publication/?DM=SLNL& PA=71698ned &D1=0-5&D2=a&D3=0,3-5 &D4=54-59&HDR=T,G1&STB=G3,G2&VW=T
Stoffer, D. (2012), “astsa: Applied statistical time series analysis”, R package version 1.1.
Trapletti, A. and Hornik, K. (2013), “tseries: Time series analysis and computational finance”, R package version 0.10-32.
Van Assem, M., Isaac, A. and van Ossenbruggen, J. (2013), Wordnet 3.0, available at http://datahub.io/nl/dataset/vu-wordnet
Velikovich, L., Blair-Goldensohn, S., Hannan, K. and McDonald, R. (2010), “The viability of web-dervied polarity lexicons”, Proceedings of Human Language Technologies: The 2010 Annual Conference of the North American Chapter of the Association for Computational Linguistics, pp. 777–785.
Zeileis, A. and Hothorn, T. (2002), “Diagnostic Checking in Regression Relationships”, R News, Vol. 2, No 3, pp. 7-10.