www.honfleurllc.com HONFLEUR LLC June 2016 1
The Economics Behind
Monetizing Cost-Advantaged
U.S. Ethane Reserves
by CLAY JONES, TERREL LAROCHE,
and CHERYL GINYARD-JONES
U.S. Ethane Crackers
and Ethylene Derivative
Capacity Additions
Part 1
www.honfleurllc.com HONFLEUR LLC June 2016 2
U.S. Ethane Crackers and
Ethylene Derivative Capacity
Additions - Part 1
With its modest beginnings in 2005,
the U.S. shale revolution has
undoubtedly transformed the oil and gas industry for
generations. Through the investment of tens of billions of
dollars of capital in upstream exploration and
development, midstream cryogenic processing,
fractionation facilities, storage terminals and pipelines, and
downstream refinery modifications to take advantage of
lighter crude feedstocks, the past 10 years has truly been a
renaissance for the U.S. oil and gas industry. As supply-
demand markets for oil and gas commodities strive to
reach a mass balance or equilibrium, U.S. oil and gas
storage and reserves have gained valuable physical,
commercial, and political elasticity. Long-held global
import and export trading patterns and markets have been
disrupted and historical views of Americas’ natural
resource reserves supporting energy independence now
seem within reach, especially for natural gas and natural
gas liquids (NGL’s).
This White Paper represents Part 1 of a three-part Series
on this topic.
Honfleur LLC Managing Partners Clay Jones and
Terrel LaRoche, in conjunction with Cheryl Ginyard-Jones, a
chemicals subject matter expert, analyze the commercial
opportunities and economic drivers underpinning one
significant commodity produced from the shale revolution
– Ethane – and its ability as a cost-advantaged, abundant
feedstock to produce ethylene. In its own right, ethane
production from U.S. natural gas liquids-rich shale resource
basins will have the ability to disrupt and replace naphtha
as a cracker feedstock of choice in the production of
ethylene. Additionally it will potentially modify supply /
demand trade patterns globally, and will see tens of billions
of dollars invested in new greenfield ethane cracker
facilities and ethylene derivatives plants during the next six
(6) years. At the time of this writing, several dozen new
ethane cracker projects, and as many ethylene derivatives
plants, are in various stages of development in the U.S.,
with approximately ninety five (95%) percent of these
projects slated for the Texas / Louisiana Gulf Coast.
Honfleur’s analysis of this market highlights several key
elements for success. They include:
Ethane cracker Stakeholders must directly source
and contract long-term ethane feedstock supplies
for their specific capital projects;
Monetization of ethane will be in ethylene
derivative products, sold domestically or through
strategic partnering arrangements allowing access
to global offtake markets;
Some projects will be financed through corporate
balance sheets, however, many will be project
financed requiring careful consideration of all
elements required by equity and debt participants;
and
In order to achieve anticipated project IRR’s as
approved by Boards and Credit Committees, it is
imperative that Stakeholders enhance their
company’s operational expertise with project
expertise able to successfully manage multi-billion
dollar capital project budgets.
As a global provider of Independent Technical Consulting
services to operators, equity sponsors, and debt providers
of capital projects, Honfleur appreciates the opportunity to
bring to you, our Customers, this three-part series.
U.S. Ethane Crackers and Ethylene Derivative
Capacity Additions The Economics Behind Monetizing Cost-Advantaged U.S.
Ethane Reserves.
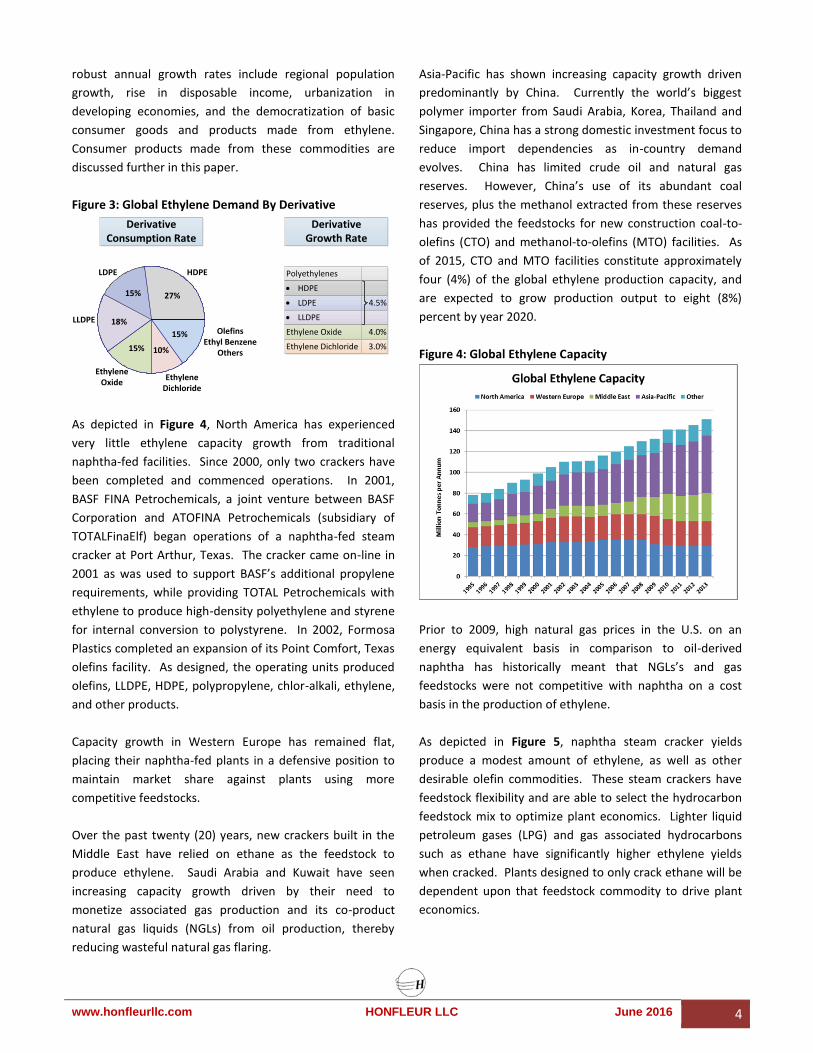
Brief History of the Ethylene Industry
Globally, approximately ninety six (96%) percent of all
manufactured goods are touched by the chemicals
industry. Distinguished more for their chemical properties
than for their physical or mechanical properties, raw
materials such as oil, natural gas, air, water, metals, and
minerals, are converted into more than 70,000 different
higher value chemical products.
In the U.S., the chemicals business is an $800 billion
industry serving domestic demand, while globally supplying
approximately fifteen (15%) percent of the worlds
chemicals (fourteen (14%) percent of all U.S. exports). In
specific countries located within Europe, the Middle East,
www.honfleurllc.com HONFLEUR LLC June 2016 3
Asia-Pacific, and emerging economies, the chemicals
industry represents a significant percentage of their
respective economies all tied to satisfying domestic,
regional and/or global supply and demand economics.
Basic chemicals such as bulk petrochemicals and
intermediates, petrochemical derivatives and other
industrial chemicals (hereafter referenced as
“Petrochemicals”) are derived from petroleum, natural gas,
coal, or renewable resources such as corn or sugar cane.
Petrochemicals are divided into three main groups:
Olefins, such as ethylene, propylene and
butadiene,
Aromatics, such as benzene, toluene and xylenes,
and
Synthesis gases, such as carbon monoxide and
hydrogen.
Ethylene is one of the most important chemicals in the
global manufacturing supply chain. Because of its
usefulness throughout the petrochemical value chain,
ethylene is manufactured in greater amounts than any
other commodity. The most common feedstocks for
ethylene production are:
Naphtha and light gas oils, which are derived from
the oil refining process via steam crackers and
other processing units, or;
Individual gases such as ethane, propane, and
butane, which come from the complex mixture of
hydrocarbons within natural gas liquids – NGLs.
Globally, approximately fifty seven (57%) percent of
petrochemical plants produce ethylene from naphtha-fed
steam crackers by using high-pressure steam to break
down, or crack, the molecular bonds in simple single
bonded carbon-hydrogen hydrocarbons, such as ethane, to
produce the valuable double bonded carbon-hydrogen
molecules called olefins. Petrochemical steam crackers
have traditionally been integrated units within crude oil
refineries. Naphtha, a derivative easily extracted from
crude oil or condensate, has always been the
petrochemical benchmark feedstock for steam crackers
around the world. As such, olefin commodity prices and
naphtha cracker plant margins have historically tightly
correlated to crude oil prices.
Figure 1: Global Ethylene Production Capacity By
Feedstock
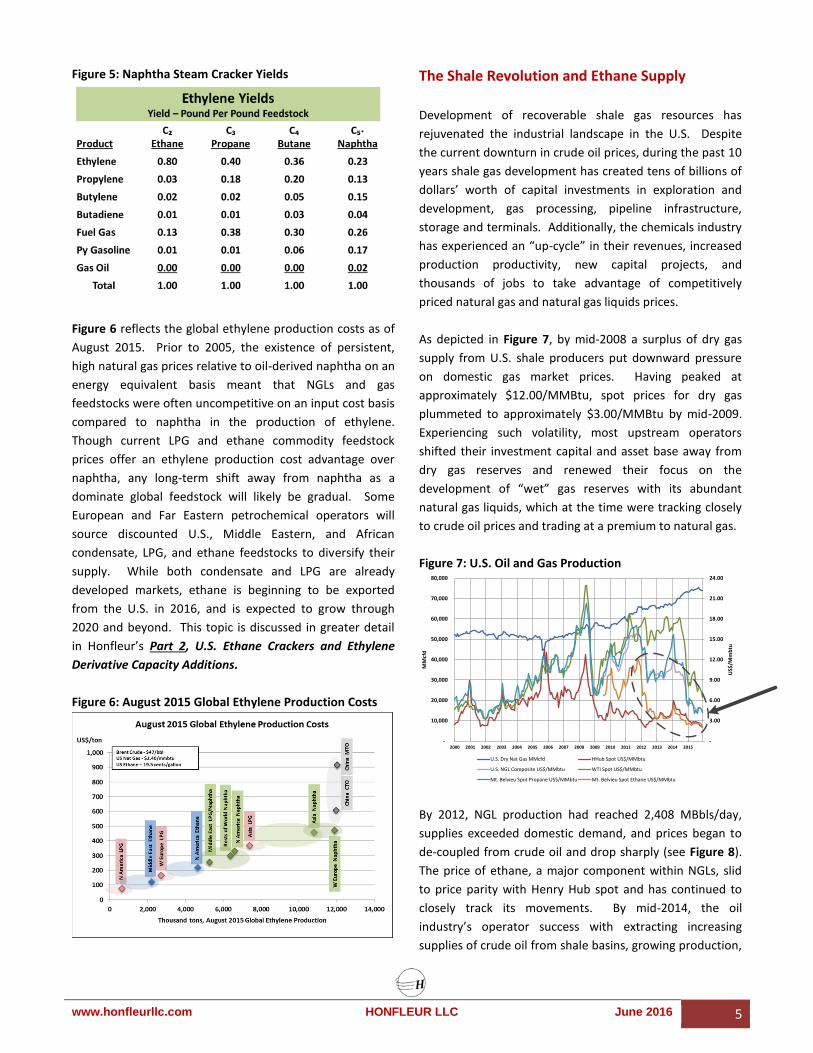
As depicted in Figure 1, many of the naphtha cracker
petrochemical plants can also accept liquefied petroleum
gas (LPG) as a feedstock, which is a mixed chemical stream
that includes propane, butane and gas oils. The LPG
feedstock makes up roughly nineteen (19%) percent of
global ethylene production capacity. Twenty (20%) percent
of the remaining dedicated cracker feedstocks are purity
ethane, which are dominant in the Middle East and North
America. Coal-to-olefins (CTO) and methanol-to-olefins
(MTO) crackers make up approximately four (4%) percent
of the global ethylene production capacity and are located
in the Far East – China.
Ethylene is the most abundantly traded chemical globally
by volume. Its annual demand growth rate typically
surpasses global GDP (gross domestic product) rates. As
depicted in Figure 2 below, global ethylene demand rates
for most regions are accelerating and will outpace their
domestic supply capacity requiring increased exports
and/or the development of capital projects.
Figure 2: Global Ethylene Demand By Region
As depicted in Figure 3, ethylene derivatives such as
polyethylene constitute approximately sixty (60%) percent
of the global demand. Primary economic drivers for this
17%
14%
3%38%
7%
21%
14%
16%
7%39%
4%
20%
North America
North America
Asia Asia
MiddleEast
MiddleEast
SouthAmerica
SouthAmerica
Europe Europe
Other Other
Year 2013
Year 2023
www.honfleurllc.com HONFLEUR LLC June 2016 4
robust annual growth rates include regional population
growth, rise in disposable income, urbanization in
developing economies, and the democratization of basic
consumer goods and products made from ethylene.
Consumer products made from these commodities are
discussed further in this paper.
Figure 3: Global Ethylene Demand By Derivative
As depicted in Figure 4, North America has experienced
very little ethylene capacity growth from traditional
naphtha-fed facilities. Since 2000, only two crackers have
been completed and commenced operations. In 2001,
BASF FINA Petrochemicals, a joint venture between BASF
Corporation and ATOFINA Petrochemicals (subsidiary of
TOTALFinaElf) began operations of a naphtha-fed steam
cracker at Port Arthur, Texas. The cracker came on-line in
2001 as was used to support BASF’s additional propylene
requirements, while providing TOTAL Petrochemicals with
ethylene to produce high-density polyethylene and styrene
for internal conversion to polystyrene. In 2002, Formosa
Plastics completed an expansion of its Point Comfort, Texas
olefins facility. As designed, the operating units produced
olefins, LLDPE, HDPE, polypropylene, chlor-alkali, ethylene,
and other products.
Capacity growth in Western Europe has remained flat,
placing their naphtha-fed plants in a defensive position to
maintain market share against plants using more
competitive feedstocks.
Over the past twenty (20) years, new crackers built in the
Middle East have relied on ethane as the feedstock to
produce ethylene. Saudi Arabia and Kuwait have seen
increasing capacity growth driven by their need to
monetize associated gas production and its co-product
natural gas liquids (NGLs) from oil production, thereby
reducing wasteful natural gas flaring.
Asia-Pacific has shown increasing capacity growth driven
predominantly by China. Currently the world’s biggest
polymer importer from Saudi Arabia, Korea, Thailand and
Singapore, China has a strong domestic investment focus to
reduce import dependencies as in-country demand
evolves. China has limited crude oil and natural gas
reserves. However, China’s use of its abundant coal
reserves, plus the methanol extracted from these reserves
has provided the feedstocks for new construction coal-to-
olefins (CTO) and methanol-to-olefins (MTO) facilities. As
of 2015, CTO and MTO facilities constitute approximately
four (4%) of the global ethylene production capacity, and
are expected to grow production output to eight (8%)
percent by year 2020.
Figure 4: Global Ethylene Capacity
Prior to 2009, high natural gas prices in the U.S. on an
energy equivalent basis in comparison to oil-derived
naphtha has historically meant that NGLs’s and gas
feedstocks were not competitive with naphtha on a cost
basis in the production of ethylene.
As depicted in Figure 5, naphtha steam cracker yields
produce a modest amount of ethylene, as well as other
desirable olefin commodities. These steam crackers have
feedstock flexibility and are able to select the hydrocarbon
feedstock mix to optimize plant economics. Lighter liquid
petroleum gases (LPG) and gas associated hydrocarbons
such as ethane have significantly higher ethylene yields
when cracked. Plants designed to only crack ethane will be
dependent upon that feedstock commodity to drive plant
economics.
LLDPE
15%
18%
15% 27%
10%
15%
HDPELDPE
EthyleneOxide
EthyleneDichloride
OlefinsEthyl Benzene
Others
DerivativeConsumption Rate
DerivativeGrowth Rate
Polyethylenes
HDPE
LDPE
LLDPE
Ethylene Oxide
Ethylene Dichloride
4.0%
3.0%
4.5%
www.honfleurllc.com HONFLEUR LLC June 2016 5
Figure 5: Naphtha Steam Cracker Yields
Figure 6 reflects the global ethylene production costs as of
August 2015. Prior to 2005, the existence of persistent,
high natural gas prices relative to oil-derived naphtha on an
energy equivalent basis meant that NGLs and gas
feedstocks were often uncompetitive on an input cost basis
compared to naphtha in the production of ethylene.
Though current LPG and ethane commodity feedstock
prices offer an ethylene production cost advantage over
naphtha, any long-term shift away from naphtha as a
dominate global feedstock will likely be gradual. Some
European and Far Eastern petrochemical operators will
source discounted U.S., Middle Eastern, and African
condensate, LPG, and ethane feedstocks to diversify their
supply. While both condensate and LPG are already
developed markets, ethane is beginning to be exported
from the U.S. in 2016, and is expected to grow through
2020 and beyond. This topic is discussed in greater detail
in Honfleur’s Part 2, U.S. Ethane Crackers and Ethylene
Derivative Capacity Additions.
Figure 6: August 2015 Global Ethylene Production Costs
The Shale Revolution and Ethane Supply
Development of recoverable shale gas resources has
rejuvenated the industrial landscape in the U.S. Despite
the current downturn in crude oil prices, during the past 10
years shale gas development has created tens of billions of
dollars’ worth of capital investments in exploration and
development, gas processing, pipeline infrastructure,
storage and terminals. Additionally, the chemicals industry
has experienced an “up-cycle” in their revenues, increased
production productivity, new capital projects, and
thousands of jobs to take advantage of competitively
priced natural gas and natural gas liquids prices.
As depicted in Figure 7, by mid-2008 a surplus of dry gas
supply from U.S. shale producers put downward pressure
on domestic gas market prices. Having peaked at
approximately $12.00/MMBtu, spot prices for dry gas
plummeted to approximately $3.00/MMBtu by mid-2009.
Experiencing such volatility, most upstream operators
shifted their investment capital and asset base away from
dry gas reserves and renewed their focus on the
development of “wet” gas reserves with its abundant
natural gas liquids, which at the time were tracking closely
to crude oil prices and trading at a premium to natural gas.
Figure 7: U.S. Oil and Gas Production
By 2012, NGL production had reached 2,408 MBbls/day,
supplies exceeded domestic demand, and prices began to
de-coupled from crude oil and drop sharply (see Figure 8).
The price of ethane, a major component within NGLs, slid
to price parity with Henry Hub spot and has continued to
closely track its movements. By mid-2014, the oil
industry’s operator success with extracting increasing
supplies of crude oil from shale basins, growing production,
-
3.00
6.00
9.00
12.00
15.00
18.00
21.00
24.00
-
10,000
20,000
30,000
40,000
50,000
60,000
70,000
80,000
2000 2001 2002 2003 2004 2005 2006 2007 2008 2009 2010 2011 2012 2013 2014 2015
US$
/Mm
btu
MM
cfd
U.S. Nat Gas and NGL's Price History
U.S. Dry Nat Gas MMcfd HHub Spot US$/MMbtu
U.S. NGL Composite US$/MMbtu WTI Spot US$/MMbtu
Mt. Belvieu Spot Propane US$/MMbtu Mt. Belvieu Spot Ethane US$/MMbtu
www.honfleurllc.com HONFLEUR LLC June 2016 6
efficiency improvements, a continued slow economic
recovery in the U.S., in conjunction with multiple geo-
political drivers all contributed to a downward correction in
crude oil prices.
Figure 8: U.S. Natural Gas Liquid Production
Approximately forty (40%) percent of an NGL barrel is
made up of ethane – C2. Since ethane is more difficult and
expensive to ship long distance, it can be considered a
regional commodity. Essentially, ethane produced from
natural gas liquids will be cracked and turned into ethylene
domestically. The U.S. petrochemicals industry represents
the majority source of demand for locally-sourced ethane.
However, the incentive to extract more ethane from the
gas stream is only as strong as the U.S. petrochemical
industry’s demand for this feedstock.
Gas plant operators operate their cryogenic gas processing
plants in different discretionary modes, in order to
maximize or minimize the recovery of ethane and other
NGLs from the natural gas stream. Contractual obligations
between producer and gas plant owners, commodity
market prices, and netback pricing are key considerations
for ethane recovery or rejection. Running a plant in an
ethane recovery mode may allow up to eighty (80%)
percent of the ethane to be recovered during gas
processing.
Likewise, gas plants operating in an ethane rejection mode
may be recovering only thirty (30%) percent of the ethane
(blended with the residue, or methane-C1 gas stream) and
rejecting seventy (70%) percent of the ethane into the NGL
y-grade stream. The sourcing of purity ethane is discussed
in greater detail in Honfleur’s Part 2, U.S. Ethane Crackers
and Ethylene Derivative Capacity Additions.
As depicted in Figure 9, the green line is the total reported
ethane-ethylene from fractionation and refiners as
provided by the EIA. Ethane supplies reached slightly over
1.2 million barrels per day by year end 2015. The blue line
is a projection of ethane supplies using the 2006 to 2011
ethane-C2 to propane-C3 split relationship to forecast the
period from 2006 to year-end 2015. While the overall
composition of NGL’s may change slightly over time, the
blue line projection suggests that ethane rejection has
been dominate since around 2012, which ties closely to the
drop in NGL prices relative to oil, and ethane’s price
correlation to natural gas price levels on a Btu energy basis
(see Figure 7).
Figure 9: U.S. Ethane Supply
The analysis suggests that existing natural gas processing
can likely support up to at least 1.6 million barrels per day
of ethane given the right price economics to support
ethane recovery. As we will see later in this presentation,
the 1.6 million barrels per day of ethane will be needed to
support the ethane crackers currently under development.
Cost advantaged ethane from U.S. shales basins will
continue to benefit domestic petrochemical producers, and
in the process revitalize the global competitiveness of the
petrochemicals industry.
www.honfleurllc.com HONFLEUR LLC June 2016 7
Conclusions
Feedstock U.S. petrochemical operators developing ethane
crackers must directly source and contract long-term
ethane feedstock supplies for their specific capital projects.
This entrepreneurial feedstock sourcing effort will entail
possible relationships with a) other petrochemical
operators, b) marketing companies providing trading
services tied to company-owned ethane pipelines, c)
fractionation plant operators, and/or d) cryogenic plant
operators (ethane recovery focus).
Strategic Partnerships Unless the petrochemical operator
is selling all ethylene output from their ethane cracker to
third parties (marketers, other petrochemical operators),
monetization of ethylene will be through ethylene
derivative products, sold domestically or through strategic
partnering arrangements allowing access to global offtake
markets. In most cases, strategic partnerships will offer
petrochemical operators with greater economic flexibility
over those competitors without partnerships.
Capital Costs In order to achieve anticipated project IRR’s
as approved by Corporate Boards and Financial Credit
Committees, it is imperative that petrochemical operators
enhance their company’s operational expertise with capital
project expertise able to successfully manage multi-billion
dollar capital project budgets. Expertise will have a keen
understanding of the comprehensive project scope (both
operators scope versus EPC contractors scope), detailed
capital project costs (so that peer-to-peer communications
can occur between petrochemical operator and EPC
contractor), and project schedule (tied to productivity, with
best practice processes and control to drive efforts). The
importance of controlling capital costs is discussed in
greater detail in Honfleur’s Part 3, U.S. Ethane Crackers
and Ethylene Derivative Capacity Additions.
Project Financing Some ethane cracker projects and
ethylene derivative facilities will be financed through
corporate balance sheets. However, many will be project
financed requiring careful consideration of all elements
required by equity and debt participants, with particular
focus on the three items noted above. A structured project
financing may be required to facilitate a strategic
partnership that is satisfactory to the partners involved.
Next in the Series
Part 2
U.S. Ethane Crackers and Ethylene Derivative
Capacity Additions
Discussion of the U.S. petrochemical industry’s use
of ethane to produce ethylene
Discussion of planned ethane crackers and
ethylene derivative facilities.
Part 3
U.S. Ethane Crackers and Ethylene Derivative
Capacity Additions
Discussion of U.S. ethane cracker capital costs,
economic modeling, sensitivities, Honfleur’s
“Strawman” ethane cracker economics.
Authors Clay Jones is a Managing Partner at Honfleur LLC. Contact
him at [email protected] or (832) 282-1164.
Terrel LaRoche is a Managing Partner of Honfleur LLC.
Contact him at [email protected] or
(832) 527-9002.
Cheryl Ginyard-Jones is a petrochemicals subject matter
expert at Honfleur LLC. Contact her at
[email protected] or (703) 576-7847.
About Honfleur Honfleur LLC is a global provider of Independent Technical
Consulting services to operators, equity sponsors, and debt
providers of capital projects, acquisitions, divestitures and
privatizations. Visit Honfleur LLC at www.honfleurllc.com