16
2016 United States National Postconsumer Plastic Bottle Recycling Report www.plasticsrecycling.org www.americanchemistry.com

2016 United States NationalPostconsumer Plastic Bottle
Recycling Report
www.plasticsrecycling.org
www.americanchemistry.com
2Copyright © 2017 American Chemistry Council andAssociation of Plastic Recyclers. All rights reserved.
2016 US National Postconsumer Plastic BottleRecycling Rate Report
INTRODUCTION
The 2016 edition of the United States National Postconsumer Plastics Bottle Recycling Report is the 27th
annual report on plastic bottle recycling. This study is a cooperative effort between the Plastics Divisionof the American Chemistry Council (ACC) and the Association of Plastic Recyclers (APR), the goal ofwhich is to quantify the amount of high density polyethylene (HDPE) and polypropylene (PP) bottlescollected for recycling, as well as the rate of recycling of those bottles. This study includespostconsumer recycling values and comments for polyethylene terephthalate (PET) developed by theNational Association for PET Container Resources (NAPCOR) and APR. The reclaimer survey portionof the study, other than for PET, was conducted by More Recycling, formerly Moore RecyclingAssociates, Inc.
HIGHLIGHTS/SUMMARY FOR 2016
Plastic Bottle Pounds Collected for Recycling in the United States The total pounds of plastic bottles collected for recycling reached 2,906 million pounds in an
economically difficult year. The total plastic bottle recycling collection rate was 29.7%, a decrease of 1.4 percentage points
compared to 2015. The total pounds of plastic bottles collected decreased by 71 million pounds for 2016 compared
to 2015, with decreases for PET and HDPE and an increase for PP bottle resins. The annualizedchange in pounds of plastic bottles collected for recycling was -2.4%
The five year compounded annual growth rate for plastic bottle recycling was 2.1%. PET bottles collected decreased by 44 million pounds for a total of 1,753 million pounds in
2016. The recycling collection rate dropped from 30.1% in 2015 to 28.4% in 2016. Thenumerator dropped while the denominator rose.
Compared to 2015, HDPE bottles collected fell by 31.7 million pounds to 1,112.1 millionpounds. The HDPE bottle recycling collection rate dropped to 33.3% in 2016 compared to the2015 rate of 34.4%. The numerator dropped while the denominator rose.
PP bottle recycling collection totaled 36.6 million pounds, an increase of 15.3% over the 2015total of 31.8 million pounds. The collection rate rose to 20.2% in 2016 compared to 17.9% in2015 with the numerator and the denominator rising in 2016 compared to 2015.
Exports of USA-collected HDPE bottle material rose from 184 million pounds in 2015 to 193million pounds in 2016. The 193 million pounds represented 17.4% of the domesticallycollected material with approximately 68% of the exports leaving North America.
Compared to 2015, imports of postconsumer HDPE to the United States held steady at 65.4million pounds in 2016, which combined with lower domestic collection and increased exportsresulted in decreased purchases for United States HDPE bottle reclamation plants, down 41.6million pounds since last year, to 984.1 million pounds.
Plastic Bottle Recycling Overview for 2016The postconsumer plastic bottle recycling industry experienced a difficult year in 2016 with lower baleprices for bale sellers and lower competing virgin polymer prices for reclaimers. Margins were tightboth for bale sellers and for plastic bottle reclaimers.

3Copyright © 2017 American Chemistry Council andAssociation of Plastic Recyclers. All rights reserved.
2016 US National Postconsumer Plastic BottleRecycling Rate Report
Recycled natural HDPE bottle bale prices gained very slightly in 2016 while pigmented HDPE bottlebale prices fell compared to 2015 with prices higher in the first half of the year than in the second half.PET bottle bale prices fell throughout 2016 compared to 2015 with some price recovery in the secondhalf of the year. The average price for baled postconsumer plastic bottles fell by 17% for baled bottleplastic (a composite of separate HDPE and PET bales, not a mixed bale) in 2016 compared to 2015 ascrude oil fell by 16% with resulting lower virgin plastics prices.
The numerator of pounds of all bottles collected fell 71 million pounds or -2.4%, well below the threeyear running average bottle collection growth rate of 0.0% per year. Considering the denominator, light-weighting and ‘right-sizing’ of PET and HDPE bottles continued as has been the case for several years.More of the light-weighted containers were lost into the postconsumer paper stream at the sorting plants.Many consumer products are being sold in smaller bottles as household demographics change. Thesales of PET for bottles increased over 2015 while sales of HDPE for bottles increased very slightly.The total for all bottles in the marketplace increased by 202 million pounds, or 2.1% which comparesfavorably the three year running average bottle marketplace growth rate of 1.3%. Almost all the growthin bottles on store shelves was for PET bottles. 2016 was a positive year for total bottle usage, with aslight increase on a per capita basis.
Sales of virgin HDPE resin for bottles rose by 0.81% and sales of recycled HDPE resin for bottles fellby 5.3% compared to 2015 results. Sales of virgin PET resin for bottles rose by 3.2% and sales ofrecycled PET resin for bottles and for fiber uses and strapping rose while sales for film uses fell in thesame time frame.
Exports of all postconsumer plastic bottle bales continued the long-term trend downward with a decreaseof 37.6 million pounds compared to 2015 and a fall to the lowest percentage for total exports in at leastnine years. In 2016 20.1% of overall collected postconsumer bottles were exported from the UnitedStates. HDPE exports rose slightly in 2016 compared to 2015, to 17.4% of collected material. PETexports fell in both absolute tonnage and percentage of material collected, 21.6%, compared to 2015,and were below values since at least 2005. The export of recycled PP bottles fell in 2016 to 20.6% ofthat collected. The PP bottle exports were in mixed rigids bales, not discrete bales of PP bottles. Theprogram in China that increases inspections and has seized some recycled material going into China,National Sword 2017, began in February 2017. The previous enhanced inspection program, OperationGreen Fence, began in 2013.
The processing of recycled PET bottle material, sourced domestically and imported, fell in 2016 over2015 by 11 million pounds. The processing of recycled HDPE, sourced domestically and imported, fellby 42 million pounds in 2016 compared to 2015. The processing of recycled PP bottles, sourceddomestically and imported, increased by 6.0 million pounds in 2016 over 2015.
Bottle resin use per capita gained 1.4% in 2016. The high growth rate seen before the recession hasbeen replaced by a slower growth rate due to continual lightweighting.
Bale prices for recycled bottles moved down in the first quarter of 2016 for PET and rose later in theyear, but the annual average was still below that for 2015. HDPE natural prices were weak in thefirst and fourth quarters and higher in the second and third quarters with weakness in the second halfof the year resulting in a very slight gain for the year. HDPE copolymer bale prices were strong in

4Copyright © 2017 American Chemistry Council andAssociation of Plastic Recyclers. All rights reserved.
2016 US National Postconsumer Plastic BottleRecycling Rate Report
the second quarter, weak otherwise with the second half of the year weaker than the first halfresulting in a lower annual price than for the year before.
Single stream collection of household recyclables continued growth as it has for many years,generally resulting in higher overall household participation rates and more challenges fromcontaminated bales of bottles with bale yields as dismal as in recent years. Materials recoveryfacility, MRF, operations were hurt by falling product prices and no commensurate drop in costs aswas seen in 2015. Tension in the reclamation industry continued with increased share of materialfrom single stream collection and more challenging processing requirements. As a continuingexample, sleeve labels on PET bottles added to poor bale yields. Conversely, PET thermoformscontinued to represent a growing opportunity for additional raw material for recycling processing.
California Container Redemption Value redemption centers collected not only PET, but also HDPE,PP, PVC, LDPE bottles and “OTHER” bottles.
Plastic bottle recycling continues to be an international business with US-based reclaimerscompeting effectively in 2016 as they did in 2015, keeping more domestically-generated material inthe United States at least on a percentage basis.
Active “all bottle” collection, which takes all bottles regardless of resin identification number,continued the collection of LDPE and PVC bottles, although the tonnage continues to be small. Wesee a small amount of “#7, OTHER”, bottles collected, but we do not have data for the denominatorsof those bottles. The LDPE and PVC bottles were often exported as part of mixed bales.
The plastic bottle resins, as identified by their ASTM resin identification codes, are:
Source: More Recycling 2017
PET and HDPE bottles comprise 97.1% of the United States plastic bottle market with PP at 1.8% ofplastic bottles produced and with LDPE at 0.7% of plastic bottles and PVC at 0.3% of plastic bottles.Together, PET and HDPE are 98.6% of the bottles recycled with PP bottles constituting 1.3% of plasticbottles recycled. Some PP bottles are included with pigmented HDPE bottles for recycling, about 26%of all PP collected. An allowance, based on buyer reports and bale audits, has been included to accountfor those PP bottles in this report to more properly represent the PP bottles recycled, although notavailable as discrete PP bottles for recycling.
Although bottles made with the #3 through #7 resins are recyclable, and to varying degrees are recycled,the actual level of recycling is limited by the continuing challenge to reach a critical mass of readilyrecognizable bottles for economical collection and processing. However, it should be noted that bottlesmade from resins #3 through #7 make up just 2.9% of the plastic bottle market.

5Copyright © 2017 American Chemistry Council andAssociation of Plastic Recyclers. All rights reserved.
2016 US National Postconsumer Plastic BottleRecycling Rate Report
Finally, bottles coded with “#7, OTHER” are included in this report as a discrete category, but are notincluded in the total for TOTAL BOTTLES shown on Table 1. Bottles coded #7 may include, amongothers, HDPE or PET or PP resins with barrier layer materials. These bottles are often recycled with theprimary resins used in each container. Bottles coded #7 may also be made from resins other than thoselisted above, such as polycarbonate. No information is available for the denominator for “#7, OTHER”.
Plastic Bottle Type Plastic Resin Recycling Plastic Resin RecyclingRecycled [2] Sales [3,4] Rate Recycled [2] Sales [3,4] Rate
PET [4] 1797 5971 30.1% 1753 6172 28.4%HDPE Natural 465.5 1527 30.5% 462.1 1533 30.1%HDPE Pigmented 678.3 1795 37.8% 650.0 1795 36.2%Total HDPE Bottles 1144 3322 34.4% 1112.1 3328 33.4%PVC [5] 1.1 33 3.3% 1.4 33 4.3%LDPE [5] 3.3 80 4.1% 2.6 72 3.7%PP [6] 31.8 177 17.9% 36.6 181 20.2%Other [7] 5.2 4.9TOTAL BOTTLES 2977 9583 31.1% 2906 9786 29.7%
(in millions of pounds per year)
Calendar Year 2015 Calendar Year 2016
Table 1Postconsumer Plastics Bottles Recycled in
Calendar Year 2016 Compared to Calendar Year 2015 Results [1,2,3,4,5,6,7]
[1] These data provide a snapshot of plastic bottle recycling collection trends from the national perspective. The data are useful inidentifying national trends and highlighting changes that have occurred from year to year, and may be a useful tool for planning purposes.While national data may be useful as a comparison with local waste characterization and recycling data, significant differences will likelyexist from locality to locality, and from state to state. If communities or states are making decisions where precise knowledge of theamount, composition and disposition of MSW is crucial, e.g., where a solid waste management facility is being designed, or for local orstate regulatory enforcement, etc., then local characterization of the quantities of individual components generated, recycled and disposed isessential.[2] Data are based on surveys performed by More Recycling and include bale composition data provided by More Recycling and others.[3] Based on data provided by the American Chemistry Council’s Plastics Industry Producers Statistics Group. HDPE resin sales includeboth the virgin and recycled plastic pounds used to produce new bottles. Imports from non-ACC members are not included.[4] Source: 2016 Report of Postconsumer PET Container Recycling Activity, National Association of PET Container Resources, Sonoma,California[5] The majority of PVC and LDPE recycled were as part of commingled bottle and container bales[6] About 4% of polypropylene bottles were deliberately collected for recycling as polypropylene bottles and not mixed material.[7] Limited data for bottles of other resins are shown. Such material was sold as part of mixed export bale. No denominator values areavailable. Because of the lack of denominator, the bottles in the “OTHER” category are not included in the TOTAL BOTTLE sum..
The 2016 PET bottle denominator increased by 201 million pounds to 6,172 million pounds compared tothe 2015 value. The 2016 PET bottle numerator, not including thermoforms, decreased by 44 millionpounds to 1,753 million pounds collected. Many natural homopolymer HDPE milk bottles arepigmented, the usual visual indicator of the use of copolymer, and those bottles are included in theusually pigmented copolymer bottles. The split for recycled HDPE between natural HDPE (presumed toall be homopolymer) and pigmented HDPE (usually presumed to be copolymer) was based on buyerestimates. The “Total HDPE Bottles” values on Table 1 are likely more accurate numbers. Incomparison with 2015, the 2016 HDPE denominator (i.e. bottles in the market place) rose by 5 millionpounds, or 1.6%. In a tough economic environment, even slight gains are appreciated as more pounds of

6Copyright © 2017 American Chemistry Council andAssociation of Plastic Recyclers. All rights reserved.
2016 US National Postconsumer Plastic BottleRecycling Rate Report
plastic used mean more opportunity to gain economies of scale. The HDPE numerator (i.e. bottlescollected for recycling) decreased by 31.7 million pounds, or -2.8%. The collection rate for HDPEbottle recycling fell in 2016 to 33.4% versus 2015 at 34.4% with fewer pounds recycled and thedenominator rising slightly. Both natural HDPE and pigmented HDPE recycling rates, as defined, fell in2016 versus 2015. Overall, HDPE bottle recycling saw a decrease in pounds collected for recycling.
About 5.2% of the total #2 through #7 bottles collected was part of commingled bottles bales. ForHDPE bottles the contribution from commingled bottles bales and mixed rigids bales was about 2.3% ofthe total HDPE bottles collected in 2016. For PP bottles the contribution from commingled bottles balesand mixed rigids bales was about 70% of the total bottles collected. For PVC bottles the contributionfrom commingled bottles bales and mixed rigids bales was about 100% of the total bottles collected.For LDPE bottles the contribution from commingled bottles bales and mixed rigids bales was about100% of the total bottles collected.
Domestic processing of postconsumer PP bottles totaled 29.7 million pounds, a 6.0 million pound or25% increase from 2015. PP recycling collection saw a 4.9 million pound increase in collected materialand an increase usage of PP for initial bottles, resulting in an increase in the collection rate for recyclingto 20.2% from the 2015 collection rate of 17.9%. Exports of PP bottles as part of mixed bales decreasedin 2016 compared to 2015.
In addition to bottles, PP from injection molded closures was also recycled, but that amount is not partof this report on bottles. For information on PP from injection molded closures, please refer to MoreRecycling’s Non-Bottle Rigid Plastic Recycling Annual Reports.
SOURCE: NAPCOR, all years, for PET. For other bottle resins, R.W. Beck, Inc., 1990-2006; Moore Recycling Associates, Inc., 2007-2015; More Recycling, 2016
0
500
1,000
1,500
2,000
2,500
3,000
3,500
Milli
on P
ound
s Co
llect
ed
Years
Figure 1Growth in Postconsumer Plastic Bottle Recycling
Collection

7Copyright © 2017 American Chemistry Council andAssociation of Plastic Recyclers. All rights reserved.
2016 US National Postconsumer Plastic BottleRecycling Rate Report
As shown in Figure 1 the total pounds of postconsumer bottles collected for recycling in 2016 was 2,906million pounds for #1 through #6 plastic bottles. The change from 2015 was a decrease of 71 millionpounds of recycled bottles, or a decrease of 2.4%. This happened with modest increase in plastic bottleresin usage and the low real GDP growth of 1.6% for 2016.
Bottle Resin SalesThe denominator used to calculate the recycling rate is composed of both virgin resin and recycled resinused for bottle making.
Plastic bottle light-weighting continued to occur for all bottle resins. Light-weighting helps companiesto meet economic and sustainability goals and is a relentless force in bottle making. Many HDPE bottleapplications are using product concentrates which means an increasing number of smaller bottles orfewer bottles made for the total number of uses, such as laundry loads. Recycling is denominated byweight and reduced weight per container adversely affects recycling economics.
The change in total resins used to make bottles resulted in an increase of 202 million pounds, or anincrease in bottle polymer production of 2.1%. Use of HDPE to make bottles increased by 5 millionpounds, or 0.2%, up from the amount used in 2015. Use of PET to make bottles increased by 201million pounds, or 3.4%, to an all-time high. The 2016 use of 9,786 million pounds of #1-#6 resins forbottles is an all-time high.
SOURCE: National Postconsumer Plastic Bottle Report, 2001-2016
0
2,000
4,000
6,000
8,000
10,000
12,000
Milli
on P
ound
s
Years
Figure 2Resin Used for Plastic Bottles in USA

8Copyright © 2017 American Chemistry Council andAssociation of Plastic Recyclers. All rights reserved.
2016 US National Postconsumer Plastic BottleRecycling Rate Report
It is vital for the growth of plastic bottle recycling that bottles are present in the marketplace andconsumers appropriately recycle used bottles. The pounds of material in bottles used by consumersshown in Figure 2 include recycled content. Without available pounds of recycled material to beindustrial feedstock, plastics recycling may grow in recycling rate, but not in the tons needed for arobust industry. Inability to secure wanted feedstocks has increased reclaimer interest in additionalresins and non-bottle items such as PET thermoforms.
Figure 3 shows the United States per capita consumption for plastic bottles since 2000. In 2016 the percapita consumption of bottle resins, virgin and recycled plastic, rose 1.4% compared to 2015 butcontinued well below the pre–2008/2009 recession levels. This chart shows that use of plastic bottlesfor more applications is offset by the continuing lightweighting and use of product concentrates withsmaller, lighter bottles. The very slow growth in per capita consumption of plastics for bottles signalsthat growth in supply of bottles must come from more effective collection, not just simple growth in thepool of bottles created.
SOURCE: National Postconsumer Plastic Bottle Report, 2001-2016; US Census
0
5
10
15
20
25
30
35
Poun
ds p
er p
erso
n pe
r yea
r
Years
Figure 3USA Per Capita Consumption of Plastic Bottles
Figure 4 displays the annual quantities of PET, HDPE, and combined PET and HDPE bottle resinprocessed for recycling in the United States. Other, non-bottle, rigid plastic packaging is not included inthe figure.

9Copyright © 2017 American Chemistry Council andAssociation of Plastic Recyclers. All rights reserved.
2016 US National Postconsumer Plastic BottleRecycling Rate Report
SOURCE: National Postconsumer Plastic Bottle Report, 2001-2016
0
500
1,000
1,500
2,000
2,500
3,000M
illion
pou
nds
of p
last
ic b
ottle
s pr
oces
sed
Years
Figure 4USA Reclaimer Processing of Plastic Bottles
PET HDPE TOTAL
Figure 5 shows PET and HDPE continued to dominate as selected resins to produce plastic bottles:97.1% by weight of produced bottles were made of PET or HDPE. PET and HDPE bottles alsocontinued to dominate the bottles collected for recycling, collectively at 98.6% and PP at 1.3% of thetotal bottles recycled.
10Copyright © 2017 American Chemistry Council andAssociation of Plastic Recyclers. All rights reserved.
2016 US National Postconsumer Plastic BottleRecycling Rate Report
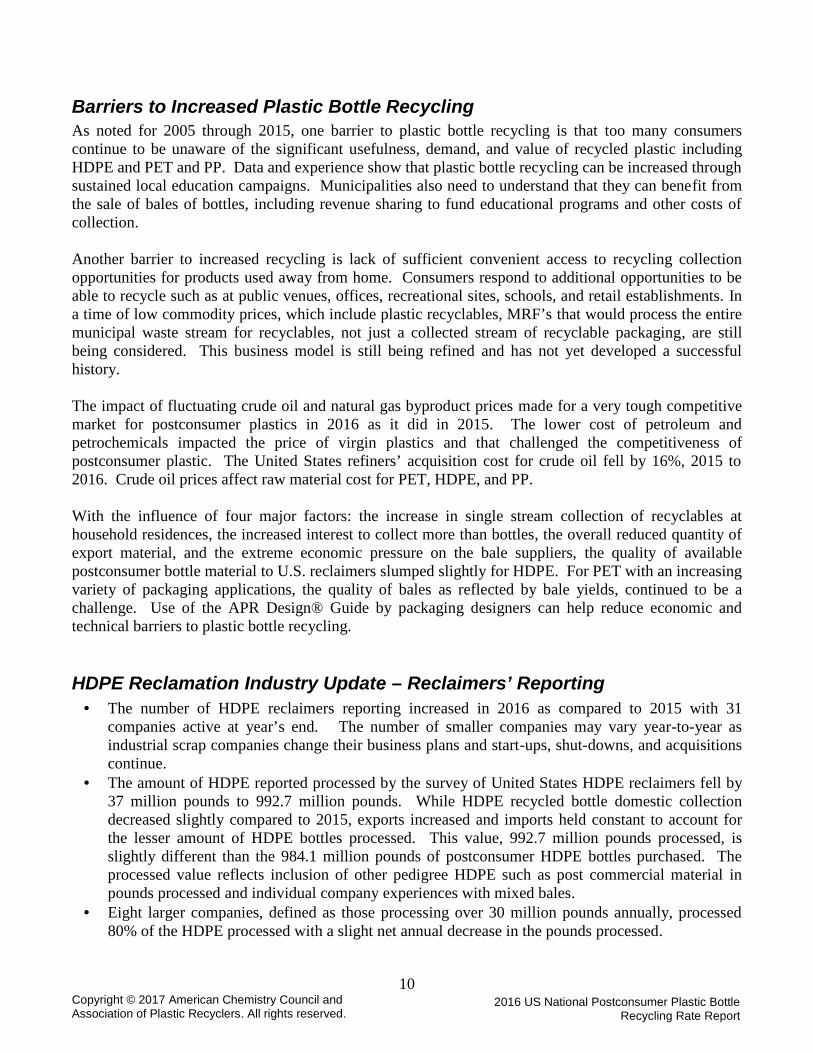
Barriers to Increased Plastic Bottle RecyclingAs noted for 2005 through 2015, one barrier to plastic bottle recycling is that too many consumerscontinue to be unaware of the significant usefulness, demand, and value of recycled plastic includingHDPE and PET and PP. Data and experience show that plastic bottle recycling can be increased throughsustained local education campaigns. Municipalities also need to understand that they can benefit fromthe sale of bales of bottles, including revenue sharing to fund educational programs and other costs ofcollection.
Another barrier to increased recycling is lack of sufficient convenient access to recycling collectionopportunities for products used away from home. Consumers respond to additional opportunities to beable to recycle such as at public venues, offices, recreational sites, schools, and retail establishments. Ina time of low commodity prices, which include plastic recyclables, MRF’s that would process the entiremunicipal waste stream for recyclables, not just a collected stream of recyclable packaging, are stillbeing considered. This business model is still being refined and has not yet developed a successfulhistory.
The impact of fluctuating crude oil and natural gas byproduct prices made for a very tough competitivemarket for postconsumer plastics in 2016 as it did in 2015. The lower cost of petroleum andpetrochemicals impacted the price of virgin plastics and that challenged the competitiveness ofpostconsumer plastic. The United States refiners’ acquisition cost for crude oil fell by 16%, 2015 to2016. Crude oil prices affect raw material cost for PET, HDPE, and PP.
With the influence of four major factors: the increase in single stream collection of recyclables athousehold residences, the increased interest to collect more than bottles, the overall reduced quantity ofexport material, and the extreme economic pressure on the bale suppliers, the quality of availablepostconsumer bottle material to U.S. reclaimers slumped slightly for HDPE. For PET with an increasingvariety of packaging applications, the quality of bales as reflected by bale yields, continued to be achallenge. Use of the APR Design® Guide by packaging designers can help reduce economic andtechnical barriers to plastic bottle recycling.
HDPE Reclamation Industry Update – Reclaimers’ Reporting The number of HDPE reclaimers reporting increased in 2016 as compared to 2015 with 31
companies active at year’s end. The number of smaller companies may vary year-to-year asindustrial scrap companies change their business plans and start-ups, shut-downs, and acquisitionscontinue.
The amount of HDPE reported processed by the survey of United States HDPE reclaimers fell by37 million pounds to 992.7 million pounds. While HDPE recycled bottle domestic collectiondecreased slightly compared to 2015, exports increased and imports held constant to account forthe lesser amount of HDPE bottles processed. This value, 992.7 million pounds processed, isslightly different than the 984.1 million pounds of postconsumer HDPE bottles purchased. Theprocessed value reflects inclusion of other pedigree HDPE such as post commercial material inpounds processed and individual company experiences with mixed bales.
Eight larger companies, defined as those processing over 30 million pounds annually, processed80% of the HDPE processed with a slight net annual decrease in the pounds processed.
11Copyright © 2017 American Chemistry Council andAssociation of Plastic Recyclers. All rights reserved.
2016 US National Postconsumer Plastic BottleRecycling Rate Report
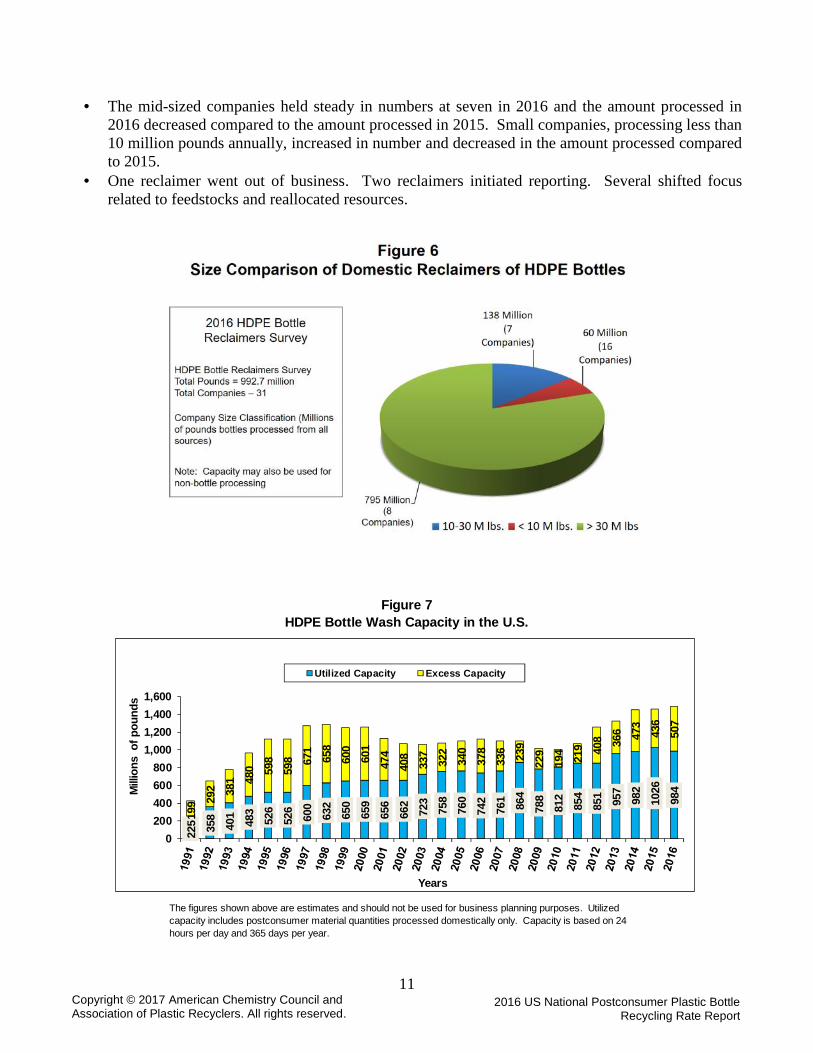
The mid-sized companies held steady in numbers at seven in 2016 and the amount processed in2016 decreased compared to the amount processed in 2015. Small companies, processing less than10 million pounds annually, increased in number and decreased in the amount processed comparedto 2015.
One reclaimer went out of business. Two reclaimers initiated reporting. Several shifted focusrelated to feedstocks and reallocated resources.
Figure 7
The figures shown above are estimates and should not be used for business planning purposes. Utilizedcapacity includes postconsumer material quantities processed domestically only. Capacity is based on 24hours per day and 365 days per year.
HDPE Bottle Wash Capacity in the U.S.
225 358
401
483
526
526
600
632
650
659
656
662
723
758
760
742
761 864
788
812
854
851 957
982
1026
984
199 29
2 381 48
0 598
598 67
165
860
060
147
440
833
732
234
037
833
6 239
229
194 219 40
8 366 47
343
650
7
0200400600800
1,0001,2001,4001,600
Milli
ons
of p
ound
s
Years
Utilized Capacity Excess Capacity

12Copyright © 2017 American Chemistry Council andAssociation of Plastic Recyclers. All rights reserved.
2016 US National Postconsumer Plastic BottleRecycling Rate Report
The capacity utilization is shown for the given conditions of hours worked. The capacity utilization forHDPE bottle reclamation, as calculated, slumped to 66% for 2016 as compared to 70% in 2015.Production capacity increased and less production occurred with a net decrease in utilization. TheHDPE reclaimers continue to use assets to process non-bottle postconsumer HDPE and PP from varyingsources. The total utilized capacity for HDPE bottles fell in 2016 to 984 million pounds, compared to1,026 million pounds in 2015. The overall USA industry capacity, as calculated, increased to 1,491million pounds of HDPE postconsumer reclamation capacity.
As reported, USA PET reclamation capacity utilization was about 73%, up from 2015. While somewhatless recycled material being processed, operating capacity was lower than in 2015.
Export and Import MarketsPostconsumer bottles are a valuable commodity and are traded globally. Purchases of USApostconsumer bottles for export continued in 2016. Postconsumer plastic was exported out of the UnitedStates as bales of PET, PP, and HDPE bottles; bales of commingled bottles and containers; mixed rigidcontainer bales; and unwashed flake material. A total of 20.1% of collected plastic bottle material of alltypes was exported in 2016, 582.8 million pounds, compared to 20.8% or 620.4 million pounds in 2015.For context, the exports exceeded 28% of bottles collected in 2012 and before.
2016
Figure 8Exports of Postconsumer Bottles From the United States
0%
10%
20%
30%
40%
50%
2009 2010 2011 2012 2013 2014
Perc
enta
ge o
f Col
lect
ed B
ottle
s Ex
port
ed
Years
0%
10%
20%
30%
40%
50%
2008 2009 2010 2011 2012 2013 2014 2015 2016
Perc
enta
ge o
f Col
lect
ed B
ottle
s Ex
port
ed
Years
For United States-collected HDPE bottle material, 193 million pounds were exported. This amountrepresented 17.4% of the total HDPE bottle material collected domestically, an increase of 9 million

13Copyright © 2017 American Chemistry Council andAssociation of Plastic Recyclers. All rights reserved.
2016 US National Postconsumer Plastic BottleRecycling Rate Report
pounds since 2015. Of those exported pounds, 32% went to Canada. The trade in bales is not one-sided. USA HDPE reclaimers imported 65 million pounds in 2016, down 1% from 66 million pounds ofpostconsumer HDPE bottle bales imported in 2015. The imported pounds of postconsumer resin are notincluded in the totals of pounds collected in the USA and are not part of the totals on Table 1.
2016 PET exports totaled 21.6% of the total PET bottles collected with most exports going to China andHong Kong. This percentage is less than the experience in 2015, when 23.6% of the United States-collected PET was exported. The Chinese “Green Fence” initiative continued to slow imports into Chinaof postconsumer baled bottles in 2016 as the flow to Hong Kong stayed steady. World exports of PETfrom the United States were down 10.6% in 2016 compared to 2015.
The exports for PP bottles fell in 2016 from 8.9 in 2015 to 7.6 million pounds, most as part of mixedbales. The PP exports fell from 28% in 2015 to 21% in 2016 for bottle material. 45% of PVC bottleswere exported, a total of 0.64 million pounds. 88% of LDPE bottles were exported, a total of 2.3 millionpounds, mostly in bales of rigid containers. These quantity values reflect updated bale content analyses.48% of OTHER bottle collected materials was exported.
End Use Markets for Recycled Plastics in 2016Per the annual survey of postconsumer reclaimers: Natural HDPE postconsumer recycled resin’s primary markets continued to be for non-food
application bottles, such as for detergent, motor oil, household cleaners, etc. and for film. Pigmented HDPE postconsumer recycled resin’s markets continued to include pipe, lawn products,
and non-food application bottles. Plastic lumber continued to consume a broad range of materials including recycled HDPE, LDPE,
mixed rigid containers, and wide-specification virgin resin. PET postconsumer resin retained its traditional markets for fiber, film and sheet, and food bottles.
Bottle, fiber, and strapping uses for recycled PET rose in 2016. Sheet & film applications forrecycled PET fell in 2016. Competitive economics was a driving force for decreased recycled PETsheet and film usage in 2016.
Postconsumer polypropylene bottles uses were not reported for 2016. Anecdotal reports suggest theuses were the same as reported in 2014: pallets, crates, and buckets.

14Copyright © 2017 American Chemistry Council andAssociation of Plastic Recyclers. All rights reserved.
2016 US National Postconsumer Plastic BottleRecycling Rate Report
There was some change in the recycled postconsumer HDPE end use markets in 2016 compared to2015, with new bottles still a major use but declining slightly and pipe applications also decliningslightly in tons and percentage. On a percentage basis and tons basis automotive uses along with plasticlumber, decking, and railroad ties and lawn and garden uses increased. The tons for bottles, pipe, andcrates/buckets fell compared to 2015. End use markets and usage of material in those markets are asreported by the survey of reclaimers.
The reported yield of postconsumer HDPE bottles to clean product ranged from low-70s to 90 %,depending on raw material and end use. The average of reported yield values of bales to clean HDPEpellets in 2016 was 79.1%, compared to 80.0% in 2015 and 80.8% long term. For PET, the bale yieldsvaried from mid- 60s to mid-70s % depending on source of bottles. The yield situation is different forrecycling HDPE and PET bottles. For PET bottles, the labels are not recovered as PET while for HDPEbottles labels may be recovered as HDPE. Contamination in bales of HDPE bottles and PET bottlescontinued to present an ongoing challenge to reclaimers.
Economic ImpactThe estimated value of purchased bales of postconsumer bottles of PET and of HDPE in 2016 wasapproximately 423 million dollars compared to 508 million dollars in 2015 due primarily to low pricesfor bales and also to less HDPE and PET reclaimed.

15Copyright © 2017 American Chemistry Council andAssociation of Plastic Recyclers. All rights reserved.
2016 US National Postconsumer Plastic BottleRecycling Rate Report
Additional InformationACC’s Plastics Division represents the leading U.S. manufacturers of plastic resins. ACC offersresources to communities that wish to increase postconsumer plastic collection, including some targetedspecifically at bottles and rigid plastics, as well as others focusing on plastic films, bags and wraps, andapplications such as mattresses that are outside the scope of this Report. A database for the recycling ofclean plastic film and grocery/retail bags is provided at www.plasticfilmrecycling.org. Additionalresources on plastic recycling can be found at www.recycleyourplastics.org.
The APR develops a wide range of resources available online including lists of buyers and sellers ofrecycled plastic, model bale specifications and bale gradings, resources to support recycling rigidplastics beyond bottles, a plastics recycling blog, programs to increase demand for recycled plastics,reports, news and highlights, and yearly educational plastics recycling webinar series. The APRDesign® Guide for Plastics Recyclability is the most comprehensive industry tool to evaluate thecompatibility of plastic packaging features with the current recycling infrastructure and capabilities.Beyond the design guidelines a variety of resources are available to supplement the informationincluding testing protocols and recognition programs. The APR Design® Guide for PlasticsRecyclability Training Program brings these resources directly to brand owners and their packagingprofessionals through customized sessions designed to meet the specific needs of each company. Visitwww.plasticsrecycling.org for more information.
More Recycling, formerly Moore Recycling Associates Inc., supported by ACC, APR, and ResourceRecycling, manages www.plasticsmarkets.org, a database of buyers and sellers of recycled plastic, opento all market participants. The website also provides other useful information, such as historical scrapprices.
The Association of Plastic Recyclers, with support provided from the plastics industry through theAmerican Chemistry Council, conducted programs for municipal recycling coordinators to educate themon the existing markets for baled bottles, the strong demand for goods, quality considerations, andsuggestions for householder education.
NAPCOR provides additional information about PET at its website, www.NAPCOR.com.
Legal NoticeThe 2016 United States National Post Consumer Plastics Bottle Recycling Report has been prepared toprovide helpful ideas and information for parties interested in recycling plastics. Facilities developing arecycling process and all entities involved in the chain of collection, processing, distribution, and sale ofrecycled products have an independent obligation to ascertain that their plans, actions, and practicesmeet all relevant laws and represent sound business practices for their particular operations. Facilitiesmay vary their approach with respect to particular operations, products, or locations based on specificfactual circumstances, the practicality and effectiveness of particular actions and economic andtechnological feasibilities. This report is not designed or intended to define or create legal rights orobligations. Although the information contained in this document has been produced and processedfrom sources believed to be reliable, no warranty expressed or implied is made regarding the accuracy,adequacy, completeness, legality, reliability or usefulness of any information, and this information is

16Copyright © 2017 American Chemistry Council andAssociation of Plastic Recyclers. All rights reserved.
2016 US National Postconsumer Plastic BottleRecycling Rate Report
provided on an "as is" basis. NO WARRANTIES ARE GIVEN; ALL IMPLIED WARRANTIESOF MERCHANTABILITY OR FITNESS FOR A PARTICULAR PURPOSE ARE EXPRESSLYEXCLUDED. Neither ACC nor APR assumes any liability of any kind whatsoever resulting from theuse of or reliance upon any information, conclusions, or options contained herein.
The Association of Plastic Recyclers and the Plastics Division of the American Chemistry Councilprovided funding for this report.
The United States National Postconsumer Plastics Bottle Recycling Report is published by theAssociation of Plastic Recyclers and the Plastics Division of the American Chemistry Council.


