42
U.S. Primary Energy Consumption by Source and Sector, 2008 (Quadrillion Btu) 99.2 Quadrillion BTU Source: DOE/EIA
| Date post: | 02-Jan-2016 |
| Category: |
Documents |
| Upload: | carol-melton |
| View: | 217 times |
| Download: | 1 times |

U.S. Primary Energy Consumption by Source
and Sector, 2008 (Quadrillion Btu)
99.2 Quadrillion BTUSource: DOE/EIA
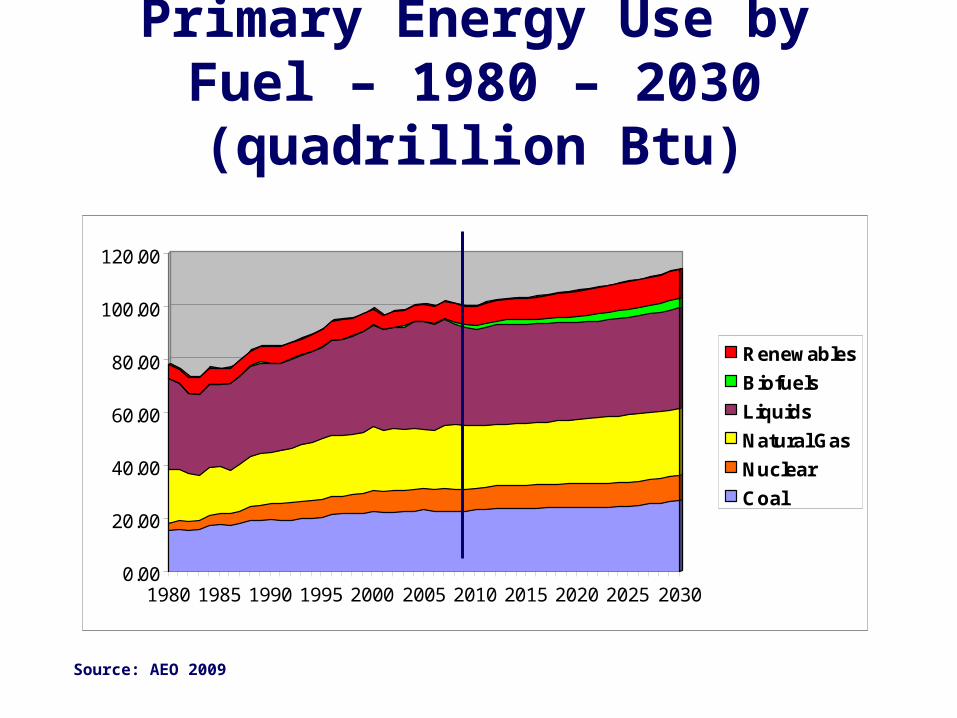
Primary Energy Use by Fuel – 1980 – 2030 (quadrillion Btu)
0.00
20.00
40.00
60.00
80.00
100.00
120.00
1980 1985 1990 1995 2000 2005 2010 2015 2020 2025 2030
Renewables
Biofuels
Liquids
Natural Gas
Nuclear
Coal
Source: AEO 2009

0
5
10
15
20
25
1970 1980 1990 2000 2010 2020 2030
Industrial
Transportation
Residential and Commercial
Electric Power
Petroleum-based liquids consumption is projected to be flat as biofuels use grows
Biofuels
million barrels per day
History Projections
Source: Annual Energy Outlook 2009 (ER)

0
50
100
150
200
250
300
350
400
450
500
1990 2000 2010 2020 2030
Biomass
Wind
Solar
Waste
Geothermal
Nonhydropower renewable power meets 33% of total generation growth between
2007 and 2030
billion kilowatthoursbillion kilowatthours
History Projections
Source: Annual Energy Outlook 2009 (ER)

How Power PlantsHow Power Plants Produce ElectricityProduce Electricity

Source: NAS 2009

Renewable Energy Sources
Oceans
Geotech
Biomass
Hydro
Wind
Solar
Storage

Renewable Energy Characteristics
► Abundant and available everywhere
► Inherently does not deplete the earth’s natural resources
► Causes little, if any, environmental damage

The Role of Renewable Energy Consumption in the
Nation’s Energy Supply, 2007
Source: EIA May 2008

Hydro Power

Source: TVA

Drag
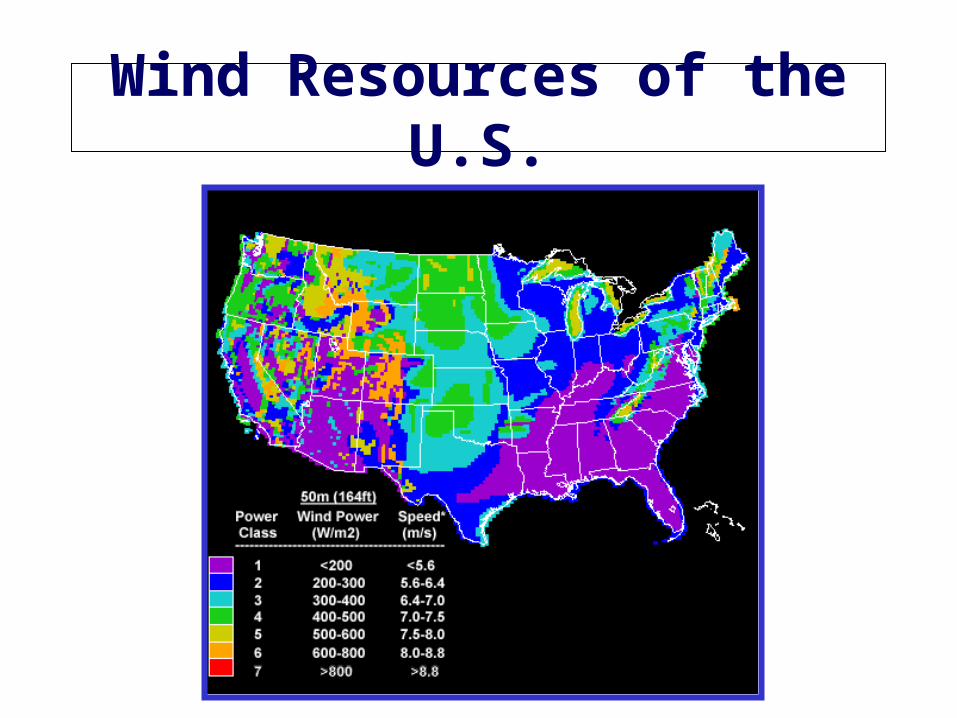
Wind Resources of the U.S.


Current technology: 5 MW turbines and 60 m blades (120 m diameter)


Passive Solar


Solar Earth at sea level – 1,000 W/m2
NC solar radiation – averages 4.5 hrs/day
NC – 4.5 kWh/m2
PV efficiency ~ 15% (Polycrystalline) Capacity Factor – 4.5/24 = 18.7%


Air Infiltration Sites
Plumbing penetrations through insulated floors and ceilings Chimney penetrations through insulated ceilings and exterior walls Fireplace dampers Attic access hatches Recessed lights and fans in insulated ceilings Wiring penetrations through insulated floors, ceilings, and walls Missing plaster Electrical outlets and switches, especially on exterior walls Window, door, and baseboard moldings Dropped ceilings above bathtubs and cabinets

Biomass and Biofuels Resource Potential


Dependency on Nuclear Power
79%
60%
42%39% 37%
34%
21% 20%
0%
10%
20%
30%
40%
50%
60%
70%
80%
90%
1
France
Belgium
Sweden
Switzerland
Spain
Japan
UK
USA
~440 Reactors worldwide with 104 in the US, 58 in France and 31 in the Russian Federation

• Brunswick 1 & 2 (Southport)
• Sharon Harris 1 (New Hill)
• McGuire 1 & 2 (Cornelius)
NPPs in the Southeastern U.S.

Isotopes of Hydrogen
hydrogen deuterium tritium

Each fuel pellet has the same amount of energy as:
One ton of coal
oror
149 gallons 149 gallons of oilof oil
OILOIL
OIL
2 1/2 tons of wood2 1/2 tons of wood

Pressurized Water Reactor

Excess Energy per Nucleon
H U, Pu
Fe
Atomic Number
En
erg
y
fusion fission
1 90+

Principal Nuclear Reactions(in a Reactor)
n
n
+ 2-3 n
& 200 MeV
fp2
fp1fission reaction
capture reaction
U235
U238
U236
U239Np239
Pu239
β
β

SAFETY
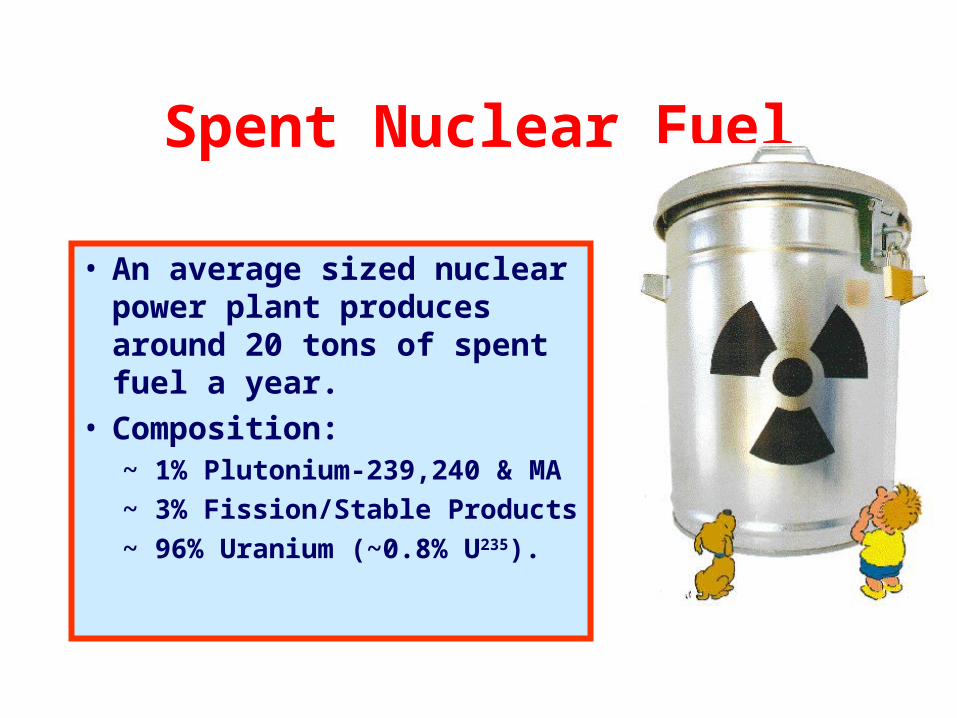
Spent Nuclear Fuel
• An average sized nuclear power plant produces around 20 tons of spent fuel a year.
• Composition:~ 1% Plutonium-239,240 & MA
~ 3% Fission/Stable Products
~ 96% Uranium (~0.8% U235).

Economics
U.S. Electricity Production Costs
0.00
5.00
10.00
15.00
20.00
1995 2008
2008
cen
ts/k
Wh
Coal
Gas
Nuclear
Petroleum
O&M + Fuel
2008 Fuel Costs: Coal 2.57 Gas 8.09 Nuclear 1.87 Petroleum 17.26
W h
Source: NEI
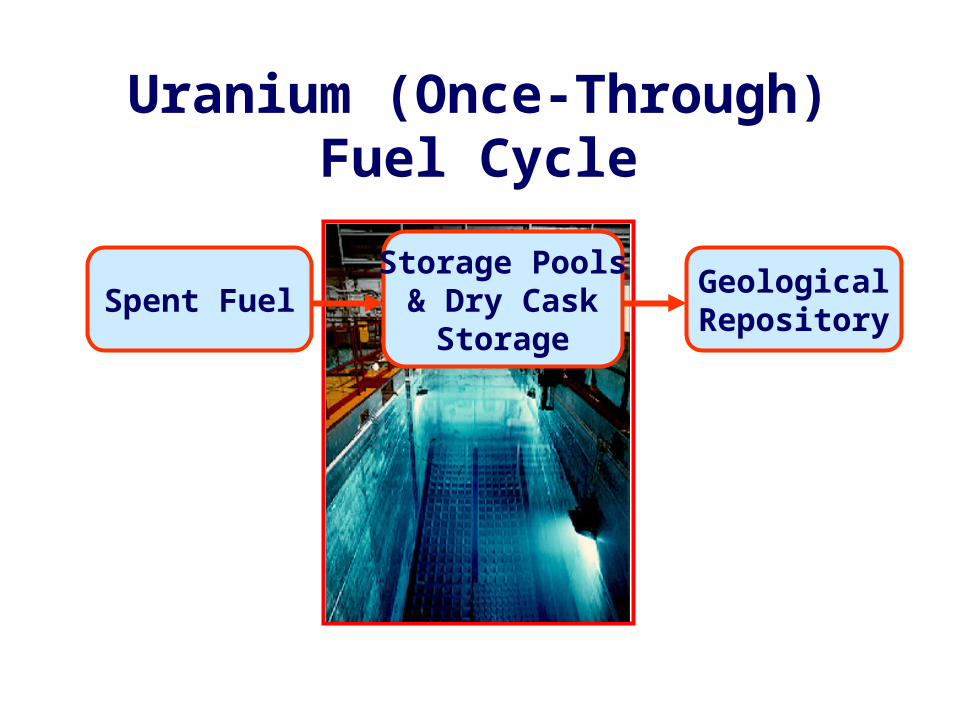
Uranium (Once-Through) Fuel Cycle
Spent FuelGeologicalRepository
Storage Pools & Dry Cask
Storage


Uranium Fuel Cycle with Reprocessing
SPENT
FUEL
Uranium
Plutonium
MinorActinides
LLFP
SLFP & Stable
Recycle or Class C Waste
Transmute or MOX
Transmute or FBR Fuel
Repository
Transmute or Repository

Composition After 10 Years of Decay
■ Uranium 95.6%■ Plutonium 0.9% ■ Minor Actinides 0.1%■ Iodine & Technicium 0.1%■ Stable & SLFP 3.0%■ Cesium & Strontium 0.3%
1.1%

Relevant Half Lives
Isotopes T-1/2
U-235 7.1 x 10⁸ y U-238 4.51 x 10⁹ y Pu-239 24,390 y Am-241 432.2 y Np-237 2.14 x 10⁶ y Cm-244 18.1 y Tc-99 2.12 x 10⁵ y I-129 1.7 x 10⁷ y CS-137 30 y Sr-90 28.1 y


![Abstract - 東京工業大学 · in the near future has been forecast [1]. The world’s energy consumption has been predicted to increase from 524 quadrillion Btu (British thermal](https://static.documents.pub/doc/80x56/5f0d557c7e708231d439d52d/abstract-in-the-near-future-has-been-forecast-1-the-worldas.jpg)


