40
U.S. TOURISM QUALITY INDEX A ranking of the experiential quality of U.S. destinations DESTINATION RANKINGS BY CATEGORY P. 08 INDEX RANKINGS P. 30 ResonanceCo.com OVERALL RANKINGS P. 20

U.S. TOURISM QUALITY INDEXA ranking of the experiential quality of U.S. destinations
D EST I N AT I O N R A N K I N G S
BY CAT EG O RY
P. 0 8
I N D E X
R A N K I N G S
P. 3 0
ResonanceCo.com
OV ER A L L
R A N K I N G S
P. 20

P A G E 2 U . S . T O U R I S M Q U A L I T Y I N D E X 2 0 17
As leading advisors in real estate, tourism and economic development for three decades, Resonance combines business strategy and marketing creativity to shape the future of destinations and developments around the world.
Our services span development strategy, place branding, place marketing and placemaking. To date, our team has completed more than 100 visioning, strategy, planning, and branding projects for destinations and developers in more than 70 countries.
To learn more about us and our services, please visit ResonanceCo.com.
VANCOUVER | NEW YORK | CALIFORNIA
HI. WE’RE RESONANCE.

R E S O N A N C E C O . C O M P A G E 3R E S O N A N C E C O . C O M P A G E 3
“We’ve identified how many quality experiences cities offer from one product and experience category to the next as rated by locals and visitors themselves.”
CHR IS FA IR,
R ESONA NCE CONSULTA NCY
Welcome to the 2017 U.S. Tourism Quality Index
R esonance Consultancy has undertaken Destination Assessments and Development Strategies for a wide range of destinations, cities, states and countries.
Through our work, we’ve learned that traditional performance indicators—economic output, spending and visitor counts—don’t tell destinations and their tourism and economic development agencies the whole story.
In our experience, Destination Marketing Organizations focus primarily on growing visitor numbers, but relatively scant attention is paid to the product development and programming required to maintain and improve the quality of the visitor experience.
Chris Fair, President & CEOResonance Consultancy [email protected]
R E S O N A N C E C O N S U LTA N CY P R E S I D E N T & C E O C H R I S FA I R
With more than 500 million reviews on TripAdvisor alone, these sites are powerful marketing channels for destinations, and they can provide new insight and intelligence into their experiential quality and differentiating characteristics.
We think you’ll find this approach to examining the quality of destinations from visitors’ points of view both effective and efficient in measuring supply-side performance from one destination to the next, and a valuable tool for better understanding the competitive advantages—and weaknesses—of your destination.
As a growing number of visitors base their judgments about destinations on overall experiential quality rather than just the number of must-see attractions, growth in demand must be matched by expansion and improvement in supply to ensure the viability and sustainability of a destination’s tourism industry over the long term.
From a demand perspective, it’s generally straightforward to assess a destination’s performance using standardized measures of visitor traffic, spending or hotel occupancy rates. But when it comes to evaluating the supply side of a destination, no standardized measures exist to benchmark the experiential quality of one destination to the next. Traditional visitor intercept surveys provide destinations with insight into what visitors find appealing or lacking, but there has been no efficient or standardized way to compare and benchmark these results with those of other destinations.
To solve this problem, Resonance Consultancy has analyzed social media channels from increasingly influential websites such as TripAdvisor. We’ve identified how many quality experiences cities offer from one product and experience category to the next as rated by locals and visitors themselves.

P A G E 4 U . S . T O U R I S M Q U A L I T Y I N D E X 2 0 17
METHODOLOGY
1. TripAdvisor.com2. Quality experiences are those with an average overall rating of ‘Very Good’ or “Excellent’
ReferencesKantar TNS – Visitor Survey for Domestic VisitorsU.S. Department of Commerce National Travel and Tourism Office – Survey of International Air Travelers
What really makes one destination ‘better’ than another? We all have opinions based on personal preferences and tastes. Our approach to benchmarking and measuring the quality of one destination to the next is rooted in our analysis of social media channels from increasingly influential websites such as TripAdvisor. This evaluates the supply side of a destination.
T he 2017 U.S. Tourism Quality Index measures tourism’s supply-side performance and competitiveness in destinations that attract more than 3 million visitors
per year across the United States. Destination rankings are based on both absolute and indexed scales: the absolute scale measures the total number of quality experiences2; the indexed scale evaluates performance in terms of how many quality experiences are delivered per visitor (i.e. the number of quality experiences per 100,000 visitors).
To formulate visitor estimates for each destination and create the indexed scoring, we utilized a combination of data from Kantar TNS’ visitor survey for domestic visitor counts and the U.S. Department of Commerce National Travel and Tourism Office Survey of International Air Travelers to create estimates for total visitors to each destination.
The rankings that follow are based on an analysis of the number of products or experiences rated as ‘Very Good’ or ‘Excellent’ in 17 different areas. We grouped these factors together into six categories: Culture, Entertainment, Sightseeing, Sports & Adventure, Culinary and Lodging. The six categories in this report are treated with equal importance and, as such, are weighted equally. In sum, a destination’s performance across these six categories reflects the “experiential quality” of one destination to the next.
Et
Cl
Ss
Lg
SA
CtCultureThe arts and culture in a destination
• Museums1
• Concerts & Shows1
• Arts & Events1
EntertainmentFun attractions and experiences
• Shopping1
• Nightlife1
• Amusement Parks1
• Zoos & Aquariums1
• Casinos & Gambling1
• Fun & Games1
SightseeingThe natural and built environment of a destination
• Sights & Landmarks1
• Nature & Parks1
• Tours & Activities1
Sports & AdventureA destinations outdoor activities and adventures
• Outdoor Activities1
• Boat Tours & Water Sports1
CulinaryThe food experiences in a destination
• Food & Drink1
• Restaurants1
LodgingAccommodation in a destination
• Hotels1

R E S O N A N C E C O . C O M
N E W YO R K C IT Y ’ S D R E A M - L I K E S K Y L I N E
P A G E 5

P A G E 6 U . S . T O U R I S M Q U A L I T Y I N D E X 2 0 17
DESTINATION RANKINGS BY CATEGORY

P A G E 7P A G E 7R E S O N A N C E C O . C O M
Page 08 | Culture // The arts and culture in a destination
Page 10 | Entertainment // Fun attractions and experiences
Page 12 | Sightseeing // The natural and built environment of a destination
Page 14 | Sports & Adventure // A destination’s outdoor activities and adventures
Page 16 | Culinary // The food experiences in a destination
Page 18 | Lodging // Accommodation in a destination

P A G E 8 U . S . T O U R I S M Q U A L I T Y I N D E X 2 0 17
The arts and culture in a destination
T o measure culture in a destination, Resonance analyzes the number of Very Good and
Excellent recommendations in the TripAdvisor categories of Museums, Concerts & Shows, and Arts & Events. The cultural champion—ranked #1 overall—is New York City.
The city’s prosperity has always fueled its creative endeavours—both through eagerly paying crowds from near and far and through corporate endowments—and the results are everywhere today.
This year, 40 new Broadway shows are launching—the most in three decades. New York storytellers Billy Joel and Jerry
Seinfeld are doing residencies all year, the former at Madison Square Garden, the latter at the Beacon Theater, just because they can.
Long an encyclopedia of both massive museums and niche collections, New York is in full cultural buildout mode. Leading the way this year is the Whitney Museum of American Art’s first Biennial in its dramatic new location. The iconic venue doubled its exhibition space two years ago when it relocated to Chelsea, ballooning its visitation numbers as well.
For a perspective of the sheer scale of planned cultural investment, one need only look at the ambition in one borough, Brooklyn, in the past year alone. Brooklyn Historical Society opened its second location on Water Street in Brooklyn’s iconic DUMBO neighborhood, telling the
story of the historic waterfronts across 3,200 square feet of space—and some of the most breathtaking views of the New York skyline. Just to the north, Brooklyn’s largest general admission music venue, Brooklyn Steel, opened to the public, with room for 1,800 music lovers and a full dance card of year-round performances from local and international bands. This being New York, inclusivity is always front and center, so local and visiting kids now have SPARK by Brooklyn Children’s Museum in Crown Heights.
The next five years will be equally kinetic. The Shed, in the new Hudson Yards neighborhood on the city’s West Side, will boast more cultural square footage than most towns. The five-story building, scheduled to open in early 2019, will
Culture
T H E W H IT N E Y M U S E U M O F A M E R I CA N A RT

R E S O N A N C E C O . C O M P A G E 9R E S O N A N C E C O . C O M P A G E 9
Ct
Top 20 Cities for Culture
1. NEW YORK
2. CHICAGO
3. LAS VEGAS
4. LOS ANGELES
5. BRANSON
6. SAN FRANCISCO
7. PHILADELPHIA
8. NEW ORLEANS
9. WASHINGTON
10. SAN DIEGO
11. SEATTLE
12. HOUSTON
13. ORANGE COUNTY
14. OAHU ISLAND
15. BOSTON
16. ATLANTA
17. BALTIMORE
18. PORTLAND, OR
19. SAINT LOUIS
20. CHARLESTON
feature two column-free galleries, a theater, event and rehearsal space, an artist lab, a 120-foot-high temperature-controlled hall and a 17,000-sq.-ft. plaza for outdoor programming.
And in the category of ‘How Did This Not Exist Earlier?’, the Statue of Liberty Museum will open in 2019. It’s no wonder that NYC swept all three sub-categories (Museums, Concerts & Shows, and Arts & Events) that compose our Culture category.
B ROA DWAY I S A B O U T TO H AV E IT S B U S I E ST S E AS O N I N 4 0 Y E A R S
New York’s prosperity has always fueled its creative endeavours—both through eagerly paying crowds from near and far and through corporate endowments—and the results are everywhere today.

P A G E 1 0 U . S . T O U R I S M Q U A L I T Y I N D E X 2 0 17
Fun attractions and experiences
T o measure entertainment in a destination, Resonance analyzed the number of Very
Good and Excellent recommendations on TripAdvisor in the categories of Amusement Parks, Zoos & Aquariums, Casinos & Gambling, Fun & Games, Shopping, and Nightlife.
You’d expect the “City That Never Sleeps” to rule the nation’s Entertainment category, and New York City doesn’t disappoint.
In addition to a month’s worth of must-see bucket list items that torment most visitors upon arrival, the Big Apple keeps upping the ante.
Yes, there’s the Empire State Center (or for our money—The Top of the Rock), but now there’s One World Observatory, complete with a time machine-like ascent up the Freedom Tower that displays the buildout of the city over four centuries.
Then there are audacious new icons on the horizon, like the New York Wheel in Staten Island—a 630-foot-tall observation wheel that will be (not surprisingly given its provenance) the tallest of its kind in the world. Fortunately for the overwhelmed tourist, it doesn’t open for another year (in June 2018).
New York’s top spot in the Entertainment category was driven by its #1 overall ranking in the Shopping and Nightlife sub-categories, and there are plenty of reinforcements in the pipeline—from the high-end pedestrian-accessed boutiques
Entertainment
If there’s one place that can take on NYC in the Entertainment metric, it’s Las Vegas. Sin City comes in a close second behind the Big Apple.
E N T R A N C E TO T H E B E AT L E S LOV E BY C I R Q U E D U S O L E I L I N L AS V EGAS
FL
ICK
R: P
ER
RY
QU
AN

R E S O N A N C E C O . C O M P A G E 11R E S O N A N C E C O . C O M P A G E 11
Top 20 Cities for Entertainment
1. NEW YORK
2. LAS VEGAS
3. CHICAGO
4. SAN FRANCISCO
5. NEW ORLEANS
6. LOS ANGELES
7. SEATTLE
8. SAN DIEGO
9. ORANGE COUNTY
10. OAHU ISLAND
11. AUSTIN
12. PORTLAND, OR
13. HOUSTON
14. TAMPA/ST. PETERSBURG
15. PHILADELPHIA
16. ORLANDO
17. NASHVILLE
18. HAWAII ISLAND
19. BOSTON
20. SAN ANTONIO
of the aforementioned Hudson Yards mini-city to the much-anticipated 2019 opening of the three-level, 100,000-sq.-ft. Hermès temple in Manhattan’s Meatpacking District.
If there’s one place that can take on NYC in the Entertainment metric, it’s Las Vegas. Sin City comes in a close second for Entertainment, topping three sub-categories: Zoos & Aquariums, Casinos & Gambling, and Fun & Games. Nightlife, not surprisingly, ranked #3.
N E W YO R K ’ S WO R L D T R A D E C E N T E R S H O P P I N G M A L L AT T H E O C U L U S
Et

P A G E 1 2 U . S . T O U R I S M Q U A L I T Y I N D E X 2 0 17
The natural and built environment of a city
T o rank sightseeing and evaluate the natural and built environment of a destination, Resonance
analyzed the number of Very Good and Excellent rankings in TripAdvisor’s Sights & Landmarks, Nature & Parks, and Tours & Activities categories.
The top-ranked destinations for sightseeing reflect the appeal of an eclectic range of sightseeing options from the environmental to the engineered. It’s interesting to note the sheer incongruity between the top finishers: New York’s cityscape that worked the land into centuries of human ambition in sharp contrast to the isolated and extreme topography of Oahu (#2 in Sightseeing), the Island of Hawaii (#3) and Maui (#4), shaped by active seismic forces over millennia, with city planning that succumbed to playing by Mother Nature’s rules a long time ago.
No wonder Oahu gets the most favorable Nature & Parks ranking on TripAdvisor out of any U.S. destination. As the gateway
Sightseeing
T H E 9 / 11 M E M O R I A L I N N E W YO R K
OA H U R A N K S H I G H F O R S I G H T S E E I N G A N D N AT U R E - BAS E D A DV E N T U R E

R E S O N A N C E C O . C O M P A G E 1 3R E S O N A N C E C O . C O M P A G E 1 3
to the Islands, the city draws the most tourists while prioritizing access and connectivity to its dramatic natural wonders.
Oahu’s #2 overall ranking in the Tours & Activities sub-category is the result of relentlessly growing tourism volumes, most of it from returning visitors demanding iterative experiences. It’s why the International Market Place in Waikiki keeps getting renovated and why the ever-expanding Ala Moana is today the world’s largest open-air shopping center.
Then there’s the increasing demand for ‘the real Hawaii’ from visitors. Not surprisingly, tours and activities are evolving and growing like never before, cranking up authentic Aloha while building out capacity for record visitor numbers.
Top 20 Cities for Sightseeing
1. NEW YORK
2. OAHU ISLAND
3. HAWAII ISLAND
4. MAUI ISLAND
5. SAN FRANCISCO
6. SAN DIEGO
7. CHICAGO
8. LOS ANGELES
9. ORANGE COUNTY
10. NEW ORLEANS
11. LAS VEGAS
12. WASHINGTON
13. CHARLESTON
14. BOSTON
15. SEATTLE
16. PORTLAND, OR
17. MIAMI
18. TAMPA/ST. PETERSBURG
19. SAVANNAH
20. PHILADELPHIA
As the gateway to the Islands, Oahu draws the most tourists while prioritizing access and connectivity to its dramatic natural wonders.
Ss

P A G E 1 4 U . S . T O U R I S M Q U A L I T Y I N D E X 2 0 17
A destination’s outdoor activities and adventures
W e determine the Sports & Adventure ranking for each destination
by evaluating its performance in TripAdvisor’s Outdoor Activities, and Boat Tours & Water Sports categories.
TripAdvisor’s Outdoor Activities category reflects a grab bag of pursuits that vary from destination to destination. It can include everything from fishing charters and tours to kayaking, canoeing and stand-up paddleboarding to biking trails, golf courses, adrenaline and extreme tours, safaris and scenic drives.
Yet most destinations seem popular for specialized outdoor activities: #8 ranked Tampa/St. Petersburg is heavy on boating-related activities, while #6 Miami’s most popular adventures are all about the Everglades.
Top Sports & Adventure finisher Oahu enjoys the enviable balance of seemingly infinite coastline, exploding topography and the tourism infrastructure—as the gateway and largest urban center in this paradise—to convince many Hawaii visitors to not bother island hopping.
It’s why the Big Island of Hawaii is so notable. Its rank just behind Oahu for Sports & Adventure (#3 for both Boat Tours & Water Sports and Outdoor Activities) has everything to do with its designation as one of the most climatically diverse places on the planet. Visitors can experience (read: play in) four out of the world’s five major climate zones.
As you’d expect from a place that (almost) gives you the world in a day, the few visitors who venture to this youngest (and most geologically active) of the
Sports & Adventure
Hawaiian Islands, can’t wait to share their discovery. And the Big Island is making access to this staggering diversity easier, with new surf schools (now with SUPs!), diving adventures (snuba is just like it sounds—snorkelling with an on-boat air supply), and that most beguiling (and awesome) of bucket list items: lava anything!
Such direct, uncrowded interaction with the elements—to say nothing of the blooming cultural renaissance—triggers adrenaline rushes in the retelling alone.
A DV E N T U R I N G I N T H E E V E R G L A D E S
T H E H AWA I I A N I S L A N D S F O C U S O N T H E I R U N M AT C H E D N AT U R A L AT T R I B U T E S

R E S O N A N C E C O . C O M P A G E 1 5R E S O N A N C E C O . C O M P A G E 1 5
Top 20 Cities for Sports & Adventure
1. OAHU ISLAND
2. MAUI ISLAND
3. HAWAII ISLAND
4. SAN DIEGO
5. DESTIN
6. MIAMI
7. ORANGE COUNTY
8. TAMPA/ST. PETERSBURG
9. NAPLES
10. CHARLESTON
11. FORT LAUDERDALE
12. LAS VEGAS
13. NEW YORK
14. SAN FRANCISCO
15. SARASOTA
16. FORT MYERS
17. VIRGINIA BEACH
18. SEATTLE
19. CHICAGO
20. MONTEREY
Top Sports & Adventure finisher Oahu enjoys the enviable balance of seemingly infinite coastline, exploding topography and tourism infrastructure.
SA

P A G E 1 6 U . S . T O U R I S M Q U A L I T Y I N D E X 2 0 17
The food experiences in a destination
T o get a sense of the culinary experiences in a destination, we analyzed the number of
Very Good and Excellent reviews in TripAdvisor’s Food & Drink and Restaurants categories.
While the Restaurants category measures pure popularity, TripAdvisor’s Food & Drink reviews demonstrate how many different ways there are to explore the culinary landscape of place: in #2 Los Angeles, for instance, we find suddenly spiking categories like Breweries,
Seattle now rivals any city for craft breweries (although San Diegans and Chicagoans would dispute this vehemently).
Culinary
S E AT T L E ’ S C U L I N A RY S C E N E R I VA LS M O ST U. S . C IT I E S
Distilleries, and Wine Bars. That this is happening in a place that for decades deferred the culinary crown to places like New York, Chicago, and even Portland just adds to the enlightened visitor’s itinerary. All of which likely leads to enthusiastic, pioneering reviews and highly Instagrammable moments.
The diversity of dining experiences that visitors have reviewed illustrates how food tourism has become paramount to a destination’s sense of place. Seeking and reveling in a place’s culinary bounty allows visitors to experience—and remember—a destination with more senses: they see the neighborhoods that are the source of the food, feel the
ambiance of a historic distillery, taste a chef’s inspiration or try their hand at frying up the catch of the day themselves.

R E S O N A N C E C O . C O M P A G E 17R E S O N A N C E C O . C O M P A G E 17
Cl
Top 20 Cities for Culinary
1. NEW YORK
2. LOS ANGELES
3. ORANGE COUNTY
4. CHICAGO
5. HOUSTON
6. SAN FRANCISCO
7. SAN DIEGO
8. LAS VEGAS
9. SEATTLE
10. PORTLAND, OR
11. SAN ANTONIO
12. OAHU ISLAND
13. ORLANDO
14. PHILADELPHIA
15. AUSTIN
16. MIAMI
17. ATLANTA
18. WASHINGTON
19. DALLAS
20. TAMPA/ST. PETERSBURG
This multi-sensory experience—which demands that visitors come equipped with nothing more than curiosity—is tourism at its most impactful.
Other once-culinary outliers are forcing their way into the Top 10. Vegas, ranked #8 in our Culinary category, was once a wasteland of chains and questionable buffets. Today, food is reinventing its downtown. Chef Natalie Young’s EAT, on the street level of a nondescript apartment building, became legendary for Mexican-French breakfast and lunch magic. And other concepts followed—from hot vegan spot VegeNation to Cajun mastery at Zydeco Po-Boys. Chef Young has kept up, with the Chinese-and-chicken lure of Chow, her latest initiative, drawing crowds and training the next generation of local chefs since late 2015.
Seattle, one spot lower at #9, now rivals any city for craft breweries (although San Diegans and Chicagoans would dispute this vehemently) as well as innovative Pacific Northwest (they call it ‘Cascadian’) locavorism that imbues everything from fine dining hotel spots to Mariners home games.
Of course the top culinary destination in the country is still New York City, indicated by the fact that 77 of its restaurants boast one, two or three Michelin stars. Earlier this year, Eleven Madison Park was named best restaurant in the world by the global authority on such matters, becoming the first U.S. room to grab the honor since 2004. The difference between culinary lineage of old and today? Starred restaurants are tucked relatively off the map, in Bushwick (Faro), Harlem (Sushi Inoue) and Williamsburg (Aska).
E D I B L E A RT AT ‘ R E S TA U R A N T O F T H E Y E A R ’ E L E V E N M A D I S O N PA R K
PA
UL
WA
GT
OU
ICZ
P A G E 1 8 U . S . T O U R I S M Q U A L I T Y I N D E X 2 0 17
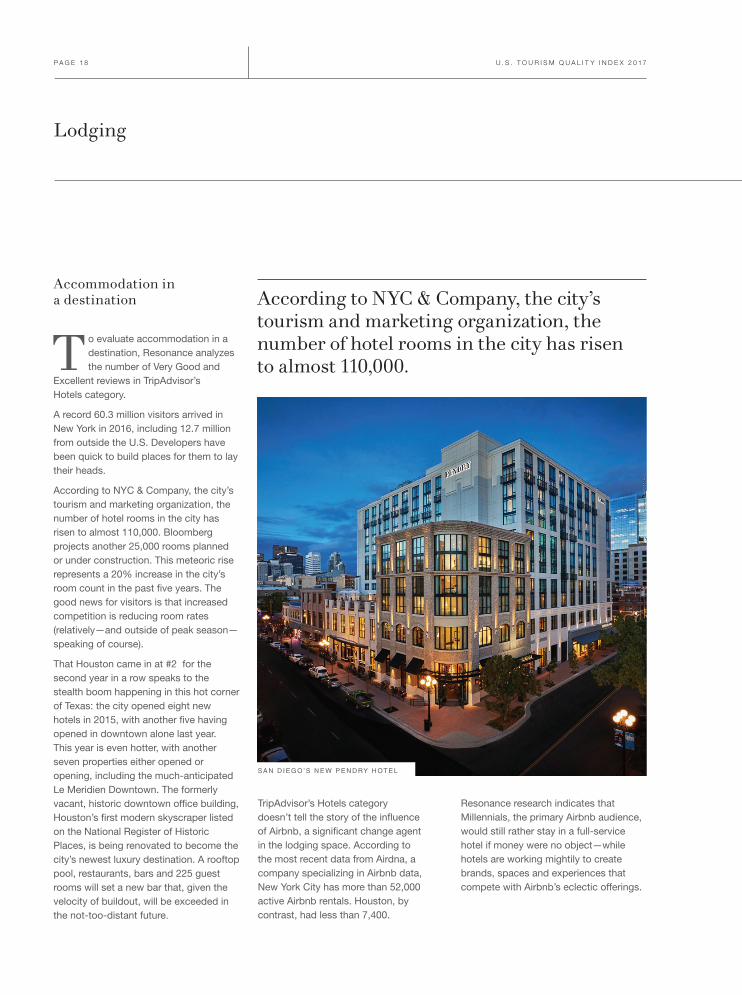
Accommodation in a destination
T o evaluate accommodation in a destination, Resonance analyzes the number of Very Good and
Excellent reviews in TripAdvisor’s Hotels category.
A record 60.3 million visitors arrived in New York in 2016, including 12.7 million from outside the U.S. Developers have been quick to build places for them to lay their heads.
According to NYC & Company, the city’s tourism and marketing organization, the number of hotel rooms in the city has risen to almost 110,000. Bloomberg projects another 25,000 rooms planned or under construction. This meteoric rise represents a 20% increase in the city’s room count in the past five years. The good news for visitors is that increased competition is reducing room rates (relatively—and outside of peak season—speaking of course).
That Houston came in at #2 for the second year in a row speaks to the stealth boom happening in this hot corner of Texas: the city opened eight new hotels in 2015, with another five having opened in downtown alone last year. This year is even hotter, with another seven properties either opened or opening, including the much-anticipated Le Meridien Downtown. The formerly vacant, historic downtown office building, Houston’s first modern skyscraper listed on the National Register of Historic Places, is being renovated to become the city’s newest luxury destination. A rooftop pool, restaurants, bars and 225 guest rooms will set a new bar that, given the velocity of buildout, will be exceeded in the not-too-distant future.
Lodging
According to NYC & Company, the city’s tourism and marketing organization, the number of hotel rooms in the city has risen to almost 110,000.
SA N D I EG O ’ S N E W P E N D RY H OT E L
TripAdvisor’s Hotels category doesn’t tell the story of the influence of Airbnb, a significant change agent in the lodging space. According to the most recent data from Airdna, a company specializing in Airbnb data, New York City has more than 52,000 active Airbnb rentals. Houston, by contrast, had less than 7,400.
Resonance research indicates that Millennials, the primary Airbnb audience, would still rather stay in a full-service hotel if money were no object—while hotels are working mightily to create brands, spaces and experiences that compete with Airbnb’s eclectic offerings.

R E S O N A N C E C O . C O M P A G E 1 9R E S O N A N C E C O . C O M P A G E 1 9
Top 20 Cities for Lodging
1. NEW YORK
2. HOUSTON
3. ORLANDO
4. ORANGE COUNTY
5. SAN ANTONIO
6. SAN DIEGO
7. CHICAGO
8. LAS VEGAS
9. LOS ANGELES
10. WASHINGTON
11. NEW ORLEANS
12. SAN FRANCISCO
13. AUSTIN
14. TAMPA/ST. PETERSBURG
15. ATLANTA
16. MYRTLE BEACH
17. BRANSON
18. DALLAS
19. CHARLOTTE
20. PHOENIX
H OT E L Z A Z A H O U STO N
Lg
VIS
IT H
OU
ST
ON
(HU
GH
HA
RG
RA
VE
) / JO
HN
EV
ER
ET
T

P A G E 2 0 U . S . T O U R I S M Q U A L I T Y I N D E X 2 0 17
OVERALLRANKINGS

P A G E 2 1P A G E 2 1R E S O N A N C E C O . C O M
Page 22 | Overall Rankings
Page 23 | Large Destinations
Page 24 | Medium Destinations
Page 26 | Small Destinations
Page 29 | Tourism Regions

P A G E 2 2 U . S . T O U R I S M Q U A L I T Y I N D E X 2 0 17
OVERALL RANKINGS
We base overall rankings on how many Very Good or Excellent reviews a destination receives regardless of its size or its number of visitors. While this ranking favors larger cities, which have more experiences to review, it also provides a few surprises.
R elatively small but focused destinations like #9 overall Oahu double down in delivering just one or two visitor experiences better than anywhere
else. In Oahu’s case, it’s Sports & Adventure (#1) and Sightseeing (#2)—the result of impossible-to-duplicate location and topography that Oahu is owning year after year, by layering access and cultural significance on some of Mother Nature’s finest work. Have you been surfing? Well now try it with a traditional Hawaiian outrigger! Already had a Mai Tai? Now enjoy this one made with nothing but Island-grown ingredients! It’s authentic and educational and, most important, it celebrates what’s been there all along.
Some smaller, less defined tourism destinations like booming Seattle are really firing on all cylinders of late. The Emerald City just made it into the final slot of our Top 10, and it’s riding an economic and construction wave that has residents and tourists arriving in record numbers. Its strong (and seemingly surprising) #7 Entertainment ranking and #9 Culinary finish position it as a place that will increasingly find itself on the radar of both cultural and family visitors. And speaking of culture, at #11 overall, Seattle scored well in our Culture category for a relatively small city, beating out top finisher Houston and Orange County in that vital category.
The performance of these smaller destinations is particularly impressive considering the massive scale of diverse experiences offered by the reigning Top 3 tourism centers—New York, L.A., and Chicago (with Orange County and San Francisco rounding out the Top 5).
Top 20 Overall Cities
1. NEW YORK
2. LOS ANGELES
3. CHICAGO
4. ORANGE COUNTY
5. SAN FRANCISCO
6. LAS VEGAS
7. HOUSTON
8. SAN DIEGO
9. OAHU ISLAND
10. SEATTLE
11. PORTLAND, OR
12. MIAMI
13. ORLANDO
14. AUSTIN
15. SAN ANTONIO
16. PHILADELPHIA
17. WASHINGTON
18. TAMPA/ST. PETERSBURG
19. ATLANTA
20. BOSTON

R E S O N A N C E C O . C O M P A G E 2 3R E S O N A N C E C O . C O M P A G E 2 3
LARGE DESTINATION RANKINGS
Rank Destination State Culture Entertainment SightseeingSports &
Adventure Culinary Lodging
1 New York NY 1 1 1 7 1 1
2 Los Angeles CA 4 6 5 13 2 9
3 Chicago IL 2 3 4 10 4 7
4 Orange County CA 12 9 6 3 3 4
5 San Francisco CA 5 4 2 8 6 12
6 Las Vegas NV 3 2 8 6 8 8
7 Houston TX 11 11 23 21 5 2
8 San Diego CA 9 8 3 1 7 6
9 Seattle WA 10 7 11 9 9 21
10 Miami FL 19 19 12 2 14 24
11 Orlando FL 21 13 20 11 11 3
12 Austin TX 15 10 15 12 13 13
13 San Antonio TX 18 16 16 20 10 5
14 Philadelphia PA 6 13 14 23 12 26
15 Washington DC 8 18 9 17 16 10
16 Tampa/St. Petersburg FL 23 12 13 4 18 14
17 Atlanta GA 14 21 17 23 15 15
18 Boston MA 13 16 10 15 20 22
19 New Orleans LA 7 5 7 14 24 10
20 Dallas TX 21 22 24 25 17 16
21 Denver CO 16 20 20 19 19 20
22 Phoenix AZ 26 27 22 16 21 17
23 Kansas City KS-MO 20 25 25 28 22 25
24 Nashville TN 17 15 19 18 26 22
25 Indianapolis IN 24 24 26 26 23 18
26 Columbus OH 27 23 27 27 25 19
27 Sacramento CA 25 28 28 22 27 28
28 Fort Lauderdale FL 28 26 17 5 28 26
Destinations that attract more than 10 million visitors per year

P A G E 2 4 U . S . T O U R I S M Q U A L I T Y I N D E X 2 0 17
MEDIUM DESTINATION RANKINGS
Rank Destination State Culture Entertainment SightseeingSports &
Adventure Culinary Lodging
1 Oahu Island HI 2 1 1 1 2 5
2 Portland OR OR 4 2 3 8 1 4
3 St. Louis MO 4 4 7 28 3 8
4 Charlotte NC 25 12 35 31 4 3
5 Pittsburgh PA 9 20 22 22 5 15
6 Jacksonville FL 30 27 19 15 7 7
7 Minneapolis MN 7 7 12 26 8 34
8 Baltimore MD 3 6 9 24 11 26
9 Charleston SC SC 4 9 2 3 25 17
10 Cincinnati OH 15 17 20 33 6 36
11 Louisville KY 18 17 29 36 10 13
12 San Jose CA 25 24 33 43 9 35
13 Fort Worth TX 10 15 28 30 13 11
14Boca Raton/ West Palm Beach
FL 19 21 16 10 16 27
15 Oklahoma City OK 22 25 40 41 12 6
16 Milwaukee WI 13 10 16 21 17 32
17 Virginia Beach VA 45 27 11 5 20 16
18 Cleveland OH 16 19 23 43 14 38
19 Richmond VA 14 37 13 35 15 24
20 Raleigh NC 28 16 31 38 18 20
21 Salt Lake City UT 16 37 23 23 19 18
22 Savannah GA 11 10 4 12 31 8
23 Colorado Springs CO 19 23 25 19 22 13
24 Destin FL 48 33 5 2 39 18
25 Tulsa OK 34 31 37 45 21 10
26 Asheville NC 7 3 10 16 29 27

R E S O N A N C E C O . C O M P A G E 2 5R E S O N A N C E C O . C O M P A G E 2 5
Rank Destination State Culture Entertainment SightseeingSports &
Adventure Culinary Lodging
27 Myrtle Beach SC 30 8 36 7 28 1
28 Knoxville TN 40 22 25 31 24 20
29 Fort Myers FL 37 30 14 4 32 40
30 Monterey CA 22 35 8 6 37 11
31 Oakland CA 34 44 37 36 23 48
32 Santa Barbara CA 28 36 6 9 36 39
33 Branson MO 1 13 25 11 42 2
34 Buffalo NY 19 41 16 27 27 45
35 Madison WI 37 40 39 33 26 24
36 Chattanooga TN 27 25 21 19 35 27
37 Detroit MI 12 33 15 38 33 45
38 Birmingham AL 30 31 44 47 34 32
39 Fresno CA 49 50 51 45 29 40
40 Little Rock AR 37 46 40 48 38 31
41 Daytona Beach FL 45 29 33 13 43 22
42 Pigeon Forge TN 22 14 46 41 45 22
42 Albany NY 42 47 47 50 40 42
44 Lancaster PA 41 42 50 51 41 43
45 Palm Springs CA 34 42 30 25 48 30
46 Flagstaff AZ 43 45 32 17 46 44
47 Gatlinburg TN 30 5 42 29 50 36
48 Atlantic City NJ 45 39 48 38 46 50
49 Waco TX 43 47 49 48 44 47
50 Panama City FL 50 49 43 13 49 49
51 Cape Canaveral FL 51 51 44 18 51 51
Destinations that attract between 5-10 million visitors per year

P A G E 2 6 U . S . T O U R I S M Q U A L I T Y I N D E X 2 0 17
SMALL DESTINATION RANKINGS
Rank Destination State Culture Entertainment SightseeingSports &
Adventure Culinary Lodging
1 Tallahassee FL 3 1 1 4 2 1
2 Lake Charles LA 14 12 6 20 3 9
3 Bend OR 1 7 31 52 1 2
4 Dothan AL 1 2 3 7 9 4
5 Augusta GA 3 2 2 2 12 15
6 Greenville SC 6 15 9 30 7 15
7 Greensboro NC 9 9 3 7 19 15
8 Mesa AZ 15 2 12 4 16 9
9 Pensacola FL 5 18 28 53 5 30
10 Hot Springs AR 15 5 7 20 15 37
11 Estes Park CO 23 5 14 1 20 6
12 Gainesville FL 6 7 35 27 13 39
13 Columbia SC 9 15 3 7 21 20
14 Traverse City MI 46 50 41 49 4 34
15 Fort Smith AR 6 20 34 57 14 9
16 El Paso TX 20 57 37 45 10 6
17 Portland ME ME 30 50 31 39 18 27
18 Aspen CO 37 25 14 17 25 15
19 St. Augustine FL 9 9 20 19 27 57
20 Biloxi MS 27 11 58 60 10 34
21 Lexington KY 33 25 48 48 16 32
22 Sioux Falls SD 30 52 22 34 23 6
23 Albuquerque NM 23 31 22 14 28 64
24 Amarillo TX 20 13 11 2 31 57
25 Anniston AL 23 32 14 23 30 43

R E S O N A N C E C O . C O M P A G E 2 7R E S O N A N C E C O . C O M P A G E 2 7
Rank Destination State Culture Entertainment SightseeingSports &
Adventure Culinary Lodging
26 Sandusky OH 33 15 9 7 32 49
27 Ocean City MD 15 32 66 67 6 2
28 Williamsburg VA 57 69 36 41 8 53
29 Syracuse NY 37 35 54 53 23 27
30 Jackson MS 43 20 25 37 35 9
31 Tucson AZ 43 59 46 37 28 64
32 Reno NV 20 29 37 23 36 30
33 Springfield MO 37 30 14 17 40 20
33 Scottsdale AZ 33 40 29 23 38 25
35 Auburn AL 47 43 12 7 39 34
36 Wichita KS 37 46 59 66 22 27
37 Dayton OH 43 25 25 14 43 39
38 Niagara Falls NY 52 20 20 7 46 46
39 Boulder CO 27 41 25 20 41 57
40 Naples FL 12 43 61 65 26 43
41 Omaha NE 47 36 31 31 47 37
42 Duluth MN 52 25 19 4 49 20
43 Huntsville AL 37 48 44 58 33 57
43 Memphis TN 37 48 44 58 33 57
45 Sarasota FL 12 20 55 60 37 43
46 Hawaii Island HI 27 32 43 49 45 57
47 Arlington VA 60 45 57 56 42 15
48 Grand Rapids MI 33 18 37 31 50 55
49 Charleston WV WV 56 61 53 53 44 14
50 Corpus Christi TX 15 36 40 14 54 64
Destinations that attract between 3-5 million visitors per year
P A G E 2 8 U . S . T O U R I S M Q U A L I T Y I N D E X 2 0 17
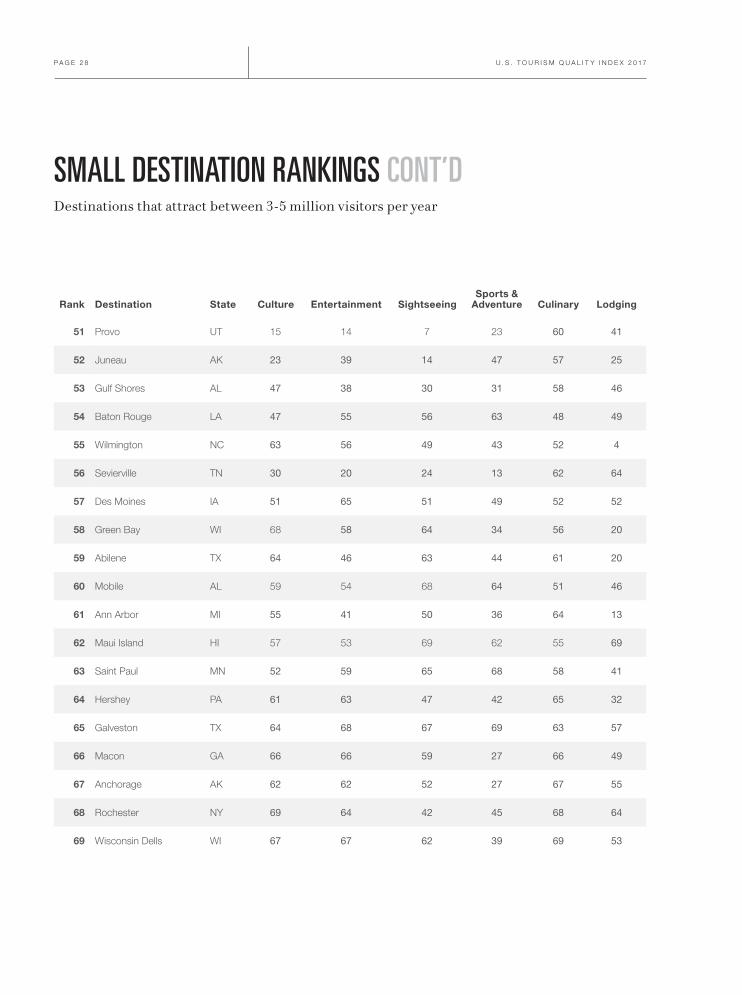
SMALL DESTINATION RANKINGS CONT’D
Rank Destination State Culture Entertainment SightseeingSports &
Adventure Culinary Lodging
51 Provo UT 15 14 7 23 60 41
52 Juneau AK 23 39 14 47 57 25
53 Gulf Shores AL 47 38 30 31 58 46
54 Baton Rouge LA 47 55 56 63 48 49
55 Wilmington NC 63 56 49 43 52 4
56 Sevierville TN 30 20 24 13 62 64
57 Des Moines IA 51 65 51 49 52 52
58 Green Bay WI 68 58 64 34 56 20
59 Abilene TX 64 46 63 44 61 20
60 Mobile AL 59 54 68 64 51 46
61 Ann Arbor MI 55 41 50 36 64 13
62 Maui Island HI 57 53 69 62 55 69
63 Saint Paul MN 52 59 65 68 58 41
64 Hershey PA 61 63 47 42 65 32
65 Galveston TX 64 68 67 69 63 57
66 Macon GA 66 66 59 27 66 49
67 Anchorage AK 62 62 52 27 67 55
68 Rochester NY 69 64 42 45 68 64
69 Wisconsin Dells WI 67 67 62 39 69 53
Destinations that attract between 3-5 million visitors per year

R E S O N A N C E C O . C O M P A G E 2 9R E S O N A N C E C O . C O M P A G E 2 9
Rank Destination State Culture Entertainment SightseeingSports &
Adventure Culinary Lodging
1 Long Island NY 2 3 3 5 1 4
2 Upper Peninsula MI 3 6 4 7 2 3
3 Florida Keys FL 4 2 1 1 6 6
4 Jersey Shore NJ 5 1 5 4 3 1
5 Cape Cod MA 1 4 2 2 5 2
6 Poconos PA 6 5 9 9 4 7
7 Outer Banks NC 8 7 7 3 9 9
8 White Mountains NH 7 8 6 8 8 5
9 Lake Tahoe CA 10 10 8 6 10 8
10 Catskills NY 9 9 11 11 7 11
11 Adirondacks NY 11 11 12 10 11 9
12 Grand Canyon AZ 12 12 10 12 12 12
The 2017 data includes domestic visitor counts for major tourism regions in the U.S. Tourism Regions were ranked separately in order to account for their scale relative to cities. These multi-county regions (versus the single-county
destinations and cities that appear throughout this report) offer additional insights into U.S. destination perception, but on a regional, out-of-metropolitan area basis. Although not directly tied to nearby cities, tourism regions are
directly affected by them. Long Island, for example, benefits from a surge in New York City visitors, especially those returning in search of new itineraries and experiences still within a day’s travel of the gateway city.
Although not directly tied to nearby cities, tourism regions are directly affected by them.
TOURISM REGIONSFor the first time ever, we decided to also rank the quality of Tourism Regions, focusing on areas that attract more than 3 million visitors per year.

P A G E 3 0 U . S . T O U R I S M Q U A L I T Y I N D E X 2 0 17

P A G E 3 1P A G E 3 1R E S O N A N C E C O . C O M
INDEXRANKINGS

P A G E 3 2 U . S . T O U R I S M Q U A L I T Y I N D E X 2 0 17
INDEX RANKINGS
We’ve created indexed rankings to provide a clearer picture of how smaller destinations perform. They reflect how many Very Good or Excellent experiences each destination offers per 100,000 visitors rather than just the total number of high-quality experiences. This levels the playing field between destinations that are large in both size and tourism volume and those that aren’t.
B y a per-visitor measurement, smaller destinations—Portland and the Hawaiian Islands in particular—shine. We discussed Oahu’s
domination extensively in this report, but it’s important to focus on Maui’s performance per 100,000 visitors because with just a few adjustments, it could future-proof its tourism experience. Maui is tops in Sports & Adventure and #2 in both Culture and Sightseeing. In the vital but difficult Entertainment category, it ranks #4.
But it’s Maui’s disappointing #57 Culinary finish and relatively low #26 Lodging ranking that prevented it from ruling the Indexed rankings. Still, given how food tourism is sweeping the rest of the Islands, Maui can quickly improve its Culinary ranking in the years ahead with some strategic thinking.
Several cities also score in or near the Top 5. Portland, ranked #4 overall here, tops the Culinary ranking and also scores well in Entertainment and Sightseeing (#7 in both). Portlandia, riding its pioneering Left Coast-ness, is quickly maturing as a must-see American city.
Another well-balanced smaller city of note is Tucson, Arizona. It ranked #6 overall in the Indexed categories, with an impressive #3 ranking for Culture (thanks to its proximity to Mexico and its university-fueled infrastructure) and an intriguing sixth-best Culinary ranking. This vital metric is bound to improve in the coming years as a result of its UNESCO’s Creative Cities Network designation for gastronomy, designed to prioritize food as part of cultural heritage worth protecting. The reason? Tucson is the oldest continually farmed city in North America (extending back more than 4,000 years). Plus the mole poblano is some of the best you’ll find anywhere—on both sides of the border.
Top 20 Index Cities
1. OAHU ISLAND
2. MAUI ISLAND
3. HAWAII ISLAND
4. PORTLAND, OR
5. SCOTTSDALE
6. TUCSON
7. SEATTLE
8. NAPLES
9. ALBUQUERQUE
10. EL PASO
11. ST. LOUIS
12. PHILADELPHIA
13. CHICAGO
14. GREENVILLE
15. SARASOTA
16. OMAHA
17. NEW YORK
18. ORANGE COUNTY
19. HOUSTON
20. LOUISVILLE

R E S O N A N C E C O . C O M P A G E 3 3R E S O N A N C E C O . C O M P A G E 3 3
INDEX RANKINGS
Rank Destination State Culture Entertainment SightseeingSports &
Adventure Culinary Lodging
1 Oahu Island HI 13 6 3 3 2 37
2 Maui Island HI 2 4 2 1 57 26
3 Hawaii Island HI 4 1 1 2 55 55
4 Portland OR OR 21 7 7 37 1 29
5 Scottsdale AZ 18 3 11 13 4 1
6 Tucson AZ 3 5 16 30 6 2
7 Seattle WA 15 9 15 34 5 70
8 Naples FL 28 31 5 4 25 14
9 Albuquerque NM 6 11 26 40 8 6
10 El Paso TX 38 81 73 77 3 7
11 Saint Louis MO 14 23 34 87 7 30
12 Philadelphia PA 5 22 19 98 9 86
13 Chicago IL 11 16 33 65 10 77
14 Greenville SC 16 15 67 93 11 5
15 Sarasota FL 20 8 8 6 33 53
16 Omaha NE 34 17 60 57 13 13
17 New York NY 7 13 22 75 16 46
18 Orange County CA 87 76 53 33 14 39
19 Houston TX 59 63 121 120 12 8
20 Louisville KY 31 26 56 94 15 23
21 Wilmington NC 30 10 23 26 34 33
22 Memphis TN 8 39 28 92 19 35
23 Virginia Beach VA 118 58 25 12 32 21
24 Springfield MO 27 18 51 69 20 15
25 Raleigh NC 52 21 52 90 18 31
26 Austin TX 57 25 57 46 21 38
27 San Antonio TX 66 48 68 85 17 11
28 Charleston SC SC 9 27 4 8 83 58
29 New Orleans LA 12 2 14 42 62 20
30 Columbia SC 32 56 45 129 24 10
Destinations that attract more than 3 million visitors per year
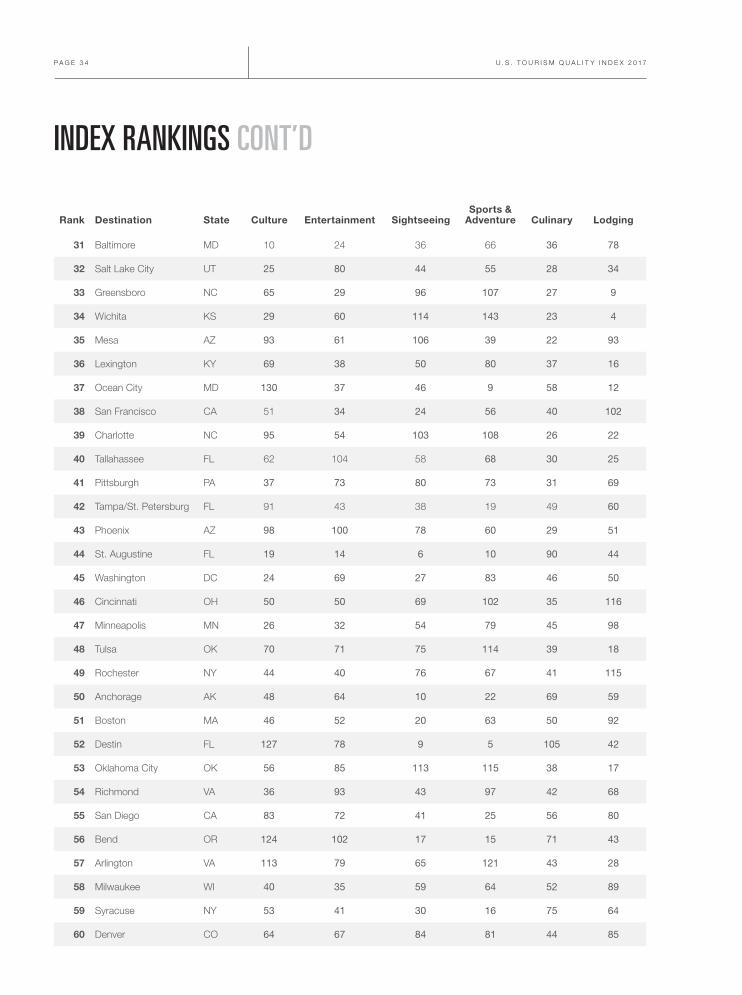
P A G E 3 4 U . S . T O U R I S M Q U A L I T Y I N D E X 2 0 17
INDEX RANKINGS CONT’D
Rank Destination State Culture Entertainment SightseeingSports &
Adventure Culinary Lodging
31 Baltimore MD 10 24 36 66 36 78
32 Salt Lake City UT 25 80 44 55 28 34
33 Greensboro NC 65 29 96 107 27 9
34 Wichita KS 29 60 114 143 23 4
35 Mesa AZ 93 61 106 39 22 93
36 Lexington KY 69 38 50 80 37 16
37 Ocean City MD 130 37 46 9 58 12
38 San Francisco CA 51 34 24 56 40 102
39 Charlotte NC 95 54 103 108 26 22
40 Tallahassee FL 62 104 58 68 30 25
41 Pittsburgh PA 37 73 80 73 31 69
42 Tampa/St. Petersburg FL 91 43 38 19 49 60
43 Phoenix AZ 98 100 78 60 29 51
44 St. Augustine FL 19 14 6 10 90 44
45 Washington DC 24 69 27 83 46 50
46 Cincinnati OH 50 50 69 102 35 116
47 Minneapolis MN 26 32 54 79 45 98
48 Tulsa OK 70 71 75 114 39 18
49 Rochester NY 44 40 76 67 41 115
50 Anchorage AK 48 64 10 22 69 59
51 Boston MA 46 52 20 63 50 92
52 Destin FL 127 78 9 5 105 42
53 Oklahoma City OK 56 85 113 115 38 17
54 Richmond VA 36 93 43 97 42 68
55 San Diego CA 83 72 41 25 56 80
56 Bend OR 124 102 17 15 71 43
57 Arlington VA 113 79 65 121 43 28
58 Milwaukee WI 40 35 59 64 52 89
59 Syracuse NY 53 41 30 16 75 64
60 Denver CO 64 67 84 81 44 85
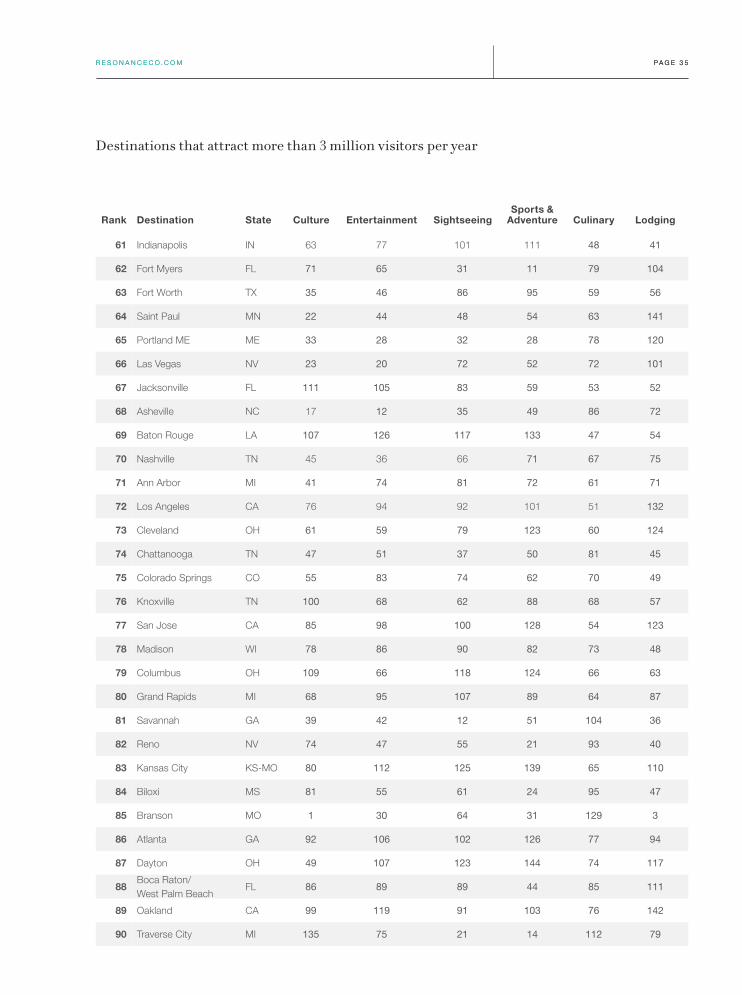
R E S O N A N C E C O . C O M P A G E 3 5R E S O N A N C E C O . C O M P A G E 3 5
Rank Destination State Culture Entertainment SightseeingSports &
Adventure Culinary Lodging
61 Indianapolis IN 63 77 101 111 48 41
62 Fort Myers FL 71 65 31 11 79 104
63 Fort Worth TX 35 46 86 95 59 56
64 Saint Paul MN 22 44 48 54 63 141
65 Portland ME ME 33 28 32 28 78 120
66 Las Vegas NV 23 20 72 52 72 101
67 Jacksonville FL 111 105 83 59 53 52
68 Asheville NC 17 12 35 49 86 72
69 Baton Rouge LA 107 126 117 133 47 54
70 Nashville TN 45 36 66 71 67 75
71 Ann Arbor MI 41 74 81 72 61 71
72 Los Angeles CA 76 94 92 101 51 132
73 Cleveland OH 61 59 79 123 60 124
74 Chattanooga TN 47 51 37 50 81 45
75 Colorado Springs CO 55 83 74 62 70 49
76 Knoxville TN 100 68 62 88 68 57
77 San Jose CA 85 98 100 128 54 123
78 Madison WI 78 86 90 82 73 48
79 Columbus OH 109 66 118 124 66 63
80 Grand Rapids MI 68 95 107 89 64 87
81 Savannah GA 39 42 12 51 104 36
82 Reno NV 74 47 55 21 93 40
83 Kansas City KS-MO 80 112 125 139 65 110
84 Biloxi MS 81 55 61 24 95 47
85 Branson MO 1 30 64 31 129 3
86 Atlanta GA 92 106 102 126 77 94
87 Dayton OH 49 107 123 144 74 117
88Boca Raton/ West Palm Beach
FL 86 89 89 44 85 111
89 Oakland CA 99 119 91 103 76 142
90 Traverse City MI 135 75 21 14 112 79
Destinations that attract more than 3 million visitors per year

P A G E 3 6 U . S . T O U R I S M Q U A L I T Y I N D E X 2 0 17
INDEX RANKINGS CONT’D
Rank Destination State Culture Entertainment SightseeingSports &
Adventure Culinary Lodging
91 Boulder CO 43 87 42 38 100 130
92 Sacramento CA 79 108 132 99 80 131
93 Miami FL 125 121 88 32 88 137
94 Pensacola FL 73 96 122 119 84 113
95 Santa Barbara CA 84 99 29 29 106 119
96 Dallas TX 117 118 130 134 82 108
97 Sioux Falls SD 89 82 98 118 97 19
98 Buffalo NY 58 115 63 78 92 138
99 Mobile AL 54 125 124 137 87 82
100 Corpus Christi TX 121 117 82 47 98 74
101 Gainesville FL 116 103 85 105 91 100
102 Augusta GA 106 127 128 147 89 27
103 Juneau AK 120 90 13 7 137 145
104 Green Bay WI 102 88 115 96 101 65
105 Monterey CA 77 110 47 23 115 66
106 Huntsville AL 114 92 120 113 96 67
107 Provo UT 67 123 108 74 94 135
108 Myrtle Beach SC 119 57 112 41 113 24
109 Fort Lauderdale FL 134 111 71 20 110 105
110 Des Moines IA 103 91 111 110 102 121
111 Little Rock AR 90 124 104 130 103 76
112 Williamsburg VA 82 45 70 76 119 62
113 Aspen CO 88 133 18 17 130 83
114 Galveston TX 104 84 39 18 128 122
115 Duluth MN 72 97 40 35 122 88
116 Detroit MI 60 109 77 116 111 144
117 Fresno CA 139 145 146 125 99 127
118 Estes Park CO 42 33 49 27 144 73
119 Amarillo TX 105 132 139 140 107 84
120 Lancaster PA 94 101 137 142 108 118

R E S O N A N C E C O . C O M P A G E 3 7R E S O N A N C E C O . C O M P A G E 3 7
Rank Destination State Culture Entertainment SightseeingSports &
Adventure Culinary Lodging
121 Hot Springs AR 101 49 95 70 127 107
122 Lake Charles LA 132 120 143 131 109 95
123 Birmingham AL 112 114 135 135 114 112
124 Macon GA 138 142 127 117 116 61
125 Jackson MS 97 139 109 148 117 129
126 Wisconsin Dells WI 131 70 93 45 134 32
127 Fort Smith AR 133 134 144 132 118 103
128 Charleston WV WV 110 143 119 141 121 125
129 Albany NY 123 136 134 138 120 128
130 Abilene TX 115 141 133 104 125 81
131 Waco TX 108 122 131 127 123 134
132 Orlando FL 142 135 141 106 124 96
133 Flagstaff AZ 126 129 87 53 132 136
134 Sevierville TN 129 62 97 58 139 139
135 Pigeon Forge TN 75 53 136 122 138 90
136 Gatlinburg TN 96 19 129 86 145 114
137 Niagara Falls NY 140 144 94 100 131 91
138 Dothan AL 143 140 147 146 126 99
139 Daytona Beach FL 137 113 105 61 140 97
140 Gulf Shores AL 144 128 110 36 143 109
141 Palm Springs CA 122 130 99 84 142 106
142 Panama City FL 145 138 126 43 141 143
143 Sandusky OH 141 131 138 91 136 126
144 Atlantic City NJ 136 116 140 112 135 146
145 Auburn AL 147 146 145 136 133 140
146 Hershey PA 128 137 142 109 146 133
147 Cape Canaveral FL 148 147 116 48 148 147
148 Anniston AL 146 148 148 145 147 148
Destinations that attract more than 3 million visitors per year

P A G E 3 8 U . S . T O U R I S M Q U A L I T Y I N D E X 2 0 17
We hope you enjoyed this sample of our insight and expertise.
HERE’S HOW RESONANCE CAN HELP SHAPE THE FUTURE OF YOUR COUNTRY, CITY OR COMMUNITY
Development Strategy
Resonance development strategies help destinations and developers plan for the future, understand consumers and trends, engage their communities, influence policy, and market their strengths.
For both developments and destinations, our Development Strategy documents offer a roadmap that connects economic development, tourism and planning—and by doing so, we connect projects, communities and cities with current and future residents, visitors, talent and investors. Smart and comprehensive, development strategies identify target audiences, competitive differentiators and strategic positioning, and articulate sense and personality of place, creating unique language designed to communicate future programming, products, amenities and experience.
The Development Strategy process and its result can rally disparate organizations, ensure internal buy-in, inform and direct marketing and sales, and create a competitive identity that helps move the needle.
Place Branding
Our approach to place branding combines analytics with storytelling techniques and award-winning design to define and communicate a destination or development’s essence of place.
If infrastructure is the hardware of place, experience is the software—and place branding tells the story of those experiences. To do it, we first benchmark against competitors, analyze consumer research, audit existing tourism assets, and forecast future trends.
Then we engage stakeholders with story-seeking exercises that articulate the essence of place: what does a destination or development stand for? What are its differentiators and the unique stories it can tell? What are its aspirations for the future? The result is a brand proposition and brand story that positions a place so compellingly that all the audiences you seek to engage will tell your story with pride, clarity and consistency.

R E S O N A N C E C O . C O M P A G E 3 9R E S O N A N C E C O . C O M P A G E 3 9
Place Marketing
Resonance strategic and creative teams write and execute marketing and public relations plans that bring the story of place to life and engage audiences in communities, cities and countries all over the world.
Marketing strategies for destinations and developments are based on our Development Strategies & Storylines, which benchmark against the competitive set, decipher lifestyle trends and the aspirations of current and prospective consumers, imagine a preferred future, and create market-leading positioning strategies.
From there, our team of award-winning content creators, designers, filmmakers, photographers and digital specialists create strategic and successful branding, imagery, measurable advertising and content in every medium, along with communications and public relations that put the story into the right hands.
Placemaking
Resonance placemaking strategies seek to leverage the power of art, culture and creativity to improve the quality of public places and the lives of the communities around them.
From the foundation of the Development Strategy, we develop and create placemaking recommendations that align with the ambitions of our clients and the needs of the community.
Our placemaking and programming practices rally artists, designers, urban planners and community leaders to make cities, communities and resort destinations more successful, resilient, sustainable and vibrant. They help bring the ideas and values of communities to life, particularly in early days of development or rejuvenation, and give prospective residents a taste of the future.

P A G E 4 0 U . S . T O U R I S M Q U A L I T Y I N D E X 2 0 17
ResonanceCo.com
@ResonanceCo
We hope you enjoyed this U.S. Tourism Quality Index Report. For detailed results and insights from this study, please contact us.
You can download a free copy of this report at ResonanceCo.com/Our-Reports
The Resonance Report is produced for general interest only; it is not definitive. It must not be relied upon in any way. Although high standards have been used in preparing the information and analysis presented in this report, no responsibility or liability whatsoever can be accepted by Resonance Consultancy Ltd. for any loss or damage resultant from any use of, reliance on, or reference to the contents of this document. We make no express or implied guarantee of its accuracy. Please be advised that your use of The Resonance Report document constitutes your agreement to (i) use the content under a limited license only for your own internal purposes, and (ii) not disclose, publish or otherwise make public or provide the content, in whole or in part, to any third person or entity without the prior written consent of Resonance Consultancy Ltd. The content is and remains at all times the exclusive intellectual property of Resonance Consultancy Ltd. Copyright © 2017 Resonance Consultancy Ltd.
New York6 East 43rd St - Floor 25New York, NY 10017 P +1.347.817.7916E [email protected]
California120 Newport Center Dr.Newport Beach, CA 92660P +1.949.887.4476E [email protected]
Vancouver801 - 602 W Hastings StVancouver, B.C. V6B 1P2P +1.604.681.0804E [email protected]


