Use of High Pressure Processing to Reduce Foodborne Pathogens in Coconut Water Anthony R. Lukas Thesis submitted to the faculty of the Virginia Polytechnic Institute and State University in partial fulfillment of the requirements for the degree of Master of Science in Life Sciences in Food Science and Technology Renee Boyer Sean O’Keefe Robert Williams December 9, 2013 Blacksbug, Virginia Keywords: E. coli, Salmonella, Listeria, Coconut Water, High Pressure Processing
Transcript
Use of High Pressure Processing to Reduce Foodborne Pathogens in Coconut Water
Anthony R. Lukas
Thesis submitted to the faculty of the Virginia Polytechnic Institute and State University in partial fulfillment of the requirements for the degree of
Master of Science in Life Sciences in Food Science and Technology
Renee Boyer Sean O’Keefe
Robert Williams
December 9, 2013
Blacksbug, Virginia
Keywords: E. coli, Salmonella, Listeria, Coconut Water, High Pressure Processing
Use of High Pressure Processing to Reduce Foodborne Pathogens in Coconut Water
Anthony R Lukas
ABSTRACT Juices have been implicated in numerous foodborne outbreaks over the last couple
of decades. The FDA requires a 5-log10 reduction in juice products, which is most
commonly achieved through pasteurization. However, pasteurization deteriorates some
sensorial properties and nutritive value. Coconut water (CW; classified as a juice), is
rapidly gaining popularity increasing over 300% since 2005. CW has not been
implicated in a microbial outbreak, but is thermally processed to achieve the required 5-
log10 CFU/ml reduction, which results in negative organoleptic properties. The objectives
of this study are to determine whether E. coli O157:H7, Salmonella enterica serovar
Typhimurium, and Listeria monocytogenes can grow in CW, and evaluate the use of
High Pressure Processing (HPP) to reduce populations of these bacteria in CW. The three
pathogens were inoculated separately into CW and bacterial populations were
enumerated over 24 hours. All three bacteria reached at least 8-log10 CFU/ml after 24
hours, which was not significantly different from the control (TSB). CW was then
inoculated with each pathogen and processed using HPP (400, 5000, or 600 MPa) for 120
seconds. The D-glucose, D-fructose, sucrose, and phenol oxidase levels in the CW were
assessed before and after treatments. Following processing, the pathogens were
enumerated from the CW. All three pathogens were reduced by more than 6-log10
CFU/ml following treatments of 500 and 600 MPa, enough to achieve the mandatory 5-
log CFu/m reduction. There were no significant changes in the D-glucose, D-fructose,
sucrose, and phenol oxidase activity after any of the treatments.
iii
ACKNOWLEDGEMENTS:
I would like to thank my graduate advisor, Dr. Renee Boyer, for everything she
has done for me over the last couple years. Her encouragement, patience, and
suggestions made this experiment called Graduate School a much more fulfilling time in
my life than I was expecting when entering. I am really going to miss our daily talks and
comparing how big Addie and my Nephew are slowly getting. I would also like to thank
my other graduate advisors, Dr. Sean O’Keefe and Dr. Robert Williams for all their
suggestions. Dr. O’Keefe’s knowledge about anything chemistry and everything else in
life made every talk a fun one. Dr. Williams, I thank you for your sense of humor and
suggestions when the experiments were taking their toll on my stress levels.
I would like to thank my best friend, Molly McCormick for all of her support,
encouragement, and ability to calm me down after a trying day. Without you, Graduate
School would have been impossible. Thank you to my family for allowing me to leave
Wisconsin and chase after my degree. I miss you all.
I would like to thank my undergradute researchers, Laura Gotthardt and Taylor
Jones, for their help with the late hours in the lab. Also, I would like to thank my fellow
gradute students for help with experiments and helping me keep my sanity throughout the
process, especially Ellen Ewell, Jason Levy, Stephanie Pollard, Matthew Schroeder, and
Lily Yang.
Finally I would like to thank staff members Ken Hurley, Laura Lawson, and Kim
Waterman for all their help with running equipment and helping me find everything I
needed to run my experiments.
iv
TABLE OF CONTENTS:
PAGE Acknowledgements…………………………………………………................................iii Table of Contents…………………………………………………………………….…..iv
List of Figures………………………………………………………….............................vi Introduction/Justification………………………………………………………………….1 Chapter 1: Literature Review…………………………………………………………….3 Juice Outbreaks……………………………………………………………………3 Common Foodborne Pathogens Associated with Fruit Juice...…………………..4 Salmonella enterica.………………………………………………………4 Escherichia coli O157:H7………………………………...........................5 Listeria monocytogenes..………….………………....................................7 Coconut Water…………………………………………………...………………..9 Fundamental Coconut…………………………...………………………...9 Coconut Water Composition…………………………………………….10 Commercial Coconut Water……………………………………………..11 Current Juice Processing…………………………...…………………………….12 Thermal Processing………………………………………………………12 Negative Consequences……………….…………………………………13 Thermal Processing of Coconut Water…...……………………………...14 High Pressure Processing………………………………………………………...14 Theory………………………………...………………………………….14 Advantages to High Pressure Processing……………………….………..15 Disadvantages to High Pressure Processing…………………...………...17
Phenol Oxidase…………………………………………………………..………18 Browning Enzyme………………………………..……………………...18 Deactivation of Phenol Oxidase………………………………………….19 High Pressure Processing on Phenol Oxidase….……..............................20 References………………………….……………………………………………22
Chapter 2: Survival and Growth of Escherichia coli O157:H7, Salmonella Typhimurium, and Listeria monocytogenes in Coconut Water…………………….…....27 Abstract…………………………………………………………………………..28 Introduction………………………………………………….…….……………29 Materials and Methods………………………………………..………………….31 Results……………………………………………………………………………34 Discussion…………………………………………………………….………….36 References……..…………………………………………………………………38 Figures……………………………………………………………………………39
v
Chapter 3: High Hydrostatic Pressure Processing Reduces Foodborne Pathogens in Coconut Water….……………………………………...………………………………...42
Materials and Methods………………………………………………..………….46 Results……………………………………………………………………………51 Discussion……………………………………………………….……………….52 Future Directions………………………………………………..……………….54 References……………………………………..…………………………………55 Figures…………………………………………………………………………....57
Appendix A: Methods for Bioscreen analysis……………………………………..……62
vi
LIST OF FIGURES CHAPTER 2: 1. Figure 1. Growth E. coli O157:H7 in Coconut Water and Tryptic Soy Broth for
24 hours at 37°C…………………………………………………………..…..…39 2. Figure 2. Growth of Salmonella enterica Typhimurium in Coconut Water and
Tryptic Soy Broth for 24 hours at 37°C………………………………………….40 3. Figure 3. Growth curve of Listeria monocytogenes in Coconut Water and Tryptic
Soy Broth with 0.6% Yeast Extract for 24 hours at 37°C…………..…………..41 CHAPTER 3: 1. Figure 1. Average log10 reduction of E. coli O157:H7 Cider, Salmonella
Typhimurium, and Listeria monocytogenes in Coconut Water at 400, 500, and 600 MPa for 120 seconds at starting temperature of 4°C……………………..…57
2. Figure 2. Level of D-glucose in untreated Coconut Water and after High Pressure
treatments of 400, 500, and 600 MPa for 120 seconds starting at 4°C…………..58 3. Figure 3. Level of D-fructose in untreated Coconut Water and after High Pressure
treatments of 400, 500, and 600 MPa for 120 seconds starting at 4°C………..…59 4. Figure 4. Level of Sucrose in untreated Coconut Water and after High Pressure
treatments of 400, 500, and 600 MPa for 120 seconds starting at 4°C………..…60 5. Figure 5. Change in phenol oxidase levels in coconut water after treatments of
400, 500, or 600 MPa or untreated………………………………………………61
1
INTRODUCTION AND JUSTIFICATION
Numerous foodborne outbreaks have been associated with juices over the last
couple decades. Between the years 1995 and 2001, there were 15 outbreaks, which led to
the FDA forming regulations for juice processing (Vojdani et al., 2008). Juice processors
now must follow the juice HACCP rule, which mandates that fresh juice must be
processed using a method to achieve a 5-log10 CFU/ml reduction in the pertinent
pathogen for each specific juice (FDA, 2001). The primary method the juice industry
uses to achieve this reduction is through thermal processing, which can alter natural
flavors and nutrients in the juice. Researchers are trying to develop alternative methods
for processing juice that do not alter its sensory properties.
High pressure processing (HPP) is an alternative to thermal treatment of high
water content foods (Jordan et al., 2001). Jordan et al. suggested that in order to have a
realistic chance on the market, the alternative process should last less than 5 minutes to
get a high enough level of production for the day. HPP could achieve this goal. A
growing number of items on the food market are being treated with HPP. Some of the
most common HPP treated foods are guacamole, deli meats, ready-to-eat meals, salsa,
and fruit juices (Ramaswamy et al., No Year). One of most successful HPP treated food
in the USA is guacamole (Patterson et al., 2005).
Coconut water (CW) is a fruit juice that is growing in popularity in the US.
Companies like Vita Coco®, Zico®, and O.N.E.® have embraced CW as their number
one product and sales have increased over 300% to 30 million dollars over recent years
(Burkitt, 2009). Forbes estimates that the top selling CW company, Vita Coco®, had over
20 million dollars in CW sales in 2008, and had reported to have increased to almost
2
$100 million in 2011 (Esterl, 2012). Since CW is classified as a juice, it falls under the
Juice HACCP regulation and must receive a process verified to achieve a 5-log10 CFU/ml
reduction. Currently, industry achieves this reduction through acidification thermal
processing, however, CW is very thermosensitive (Damar et al., 2009) and its properties
can be quickly changed by exposure to air. Thermal processing of CW has a fouling
effect, similar to milk. This fouling effect produces greasy, white deposits that do not
dissolve back into the CW (Narataruksa et al., 2010). Thermal processing also destroys
many flavors and odors in the juice (Wolbang et al., 2008). In order to get better taste,
flavors, and higher nutrient retention, an alternative to thermal processing, such as HPP,
could be used.
Although there have not been any foodborne outbreaks in the United States linked
to CW, the nutritional composition of the juice is one that could theoretically support
growth of microorganisms. CW is composed of fats, proteins, carbohydrates, and many
minerals. Some of the minerals in CW are iron, magnesium, potassium and sodium
(Seow and Gwee, 1997; Prades et al., 2012). CW native pH ranges between 4.2-6.0 and
has a water activity of greater than 0.95 (Damar et al., 2009; Gabriel et al., 2009; Campos
et al., 1996). The objective of this research is to determine if CW supports the growth of
common foodborne pathogens such as E. coli O157:H7, Salmonella spp., and Listeria
monocytogenes, and to evaluate if processing of CW using HPP will achieve a 5-log10
CFU/ml reduction of those pathogens.
3
LITERATURE REVIEW
JUICE OUTBREAKS
Juices have been implicated in several outbreaks over the past couple of decades.
A reported 21 US outbreaks associated with juices occurred between 1995 and 2005
(Vojdani et al., 2008). In 1998, legislation was passed requiring that all unpasteurized
juices be labeled as raw, in an FDA attempt to lower outbreaks in ciders (FDA, 1998). A
continuation of juice-associated outbreaks resulted in legislation requiring all juice
processors write and follow a Hazard Analysis Critical Control Point (HACCP) plan,
requiring a 5-log10 CFU/ml reduction in the most resistant pathogen (FDA, 2001). For
example, orange juice requires a process to reduce Salmonella enterica, and apple juice
requires a process to reduce Escherichia coli O157:H7.
Most juices are acidic (pH<4.6), however low acid juices (pH > 4.6) are
considered the most risky, with characteristics to support greater pathogen growth
(Pilavtepe-Çelik, 2012). The FDA considers these juices as well as their original fruits to
be hazardous because of their association with foodborne outbreaks. One low acid juice
that is gaining popularity is coconut water (CW). Even juices with low acid have had
aciduric microorganisms such as yeasts, molds, and some bacteria such as Lactobacillus
spp. growing in them (Ray and Bhunia, 2008). Some strains of acid tolerant Salmonella
spp. and E. coli O157:H7 have been found to be able to survive in low acid juices for
over a month (Ray and Bhunia, 2008).
Many of these foodborne outbreaks have identified similar bacteria as the cause.
Some of these bacteria include Salmonella spp, Escherichia coli O157:H7, and Listeria
monocytogenes. All three of these species are known to cause foodborne infections (Ray
4
and Bhunia, 2008). A foodborne infection can occur when the pathogen can survive in
the food product, is consumed and then thrives in the human gut. When they multiply in
the gastrointestinal tract they cause the host to become ill (Ray and Bhunia, 2008).
Symptoms of foodborne infections typically happen at least a full day after consumption
of the pathogen. Depending on the species of pathogen, infectious doses can range from
as little as ten, all the way up to 105 cells, or more, to cause an infection.
COMMON FOODBORNE PATHOGENS ASSOCIATED WITH JUICE
OUTBREAKS
SALMONELLA ENTERICA
Salmonella enterica is a Gram-negative, rod-shaped bacterium that is non-spore
forming (Montville and Matthews, 2008). It cannot ferment lactose and is mesophilic.
Most ssp. can grow anywhere from 5-46°C with its optimum temperature being around
37°C (Ray and Bhunia, 2008). Salmonella typically does not grow below a pH of 4.5 or
Aw of 0.94. The cells are easily recovered after being frozen (Ray and Bhunia, 2008).
Salmonella can be spread by fecal-oral route, water, and in foods (Doyle and Beuchat,
2007). The organism is typically found in many wild animals, insects, and can even live
in humans without incident. The cells are often found in water, soil, and fecal matter
(Ray and Bhunia, 2008).
Salmonella belongs to the family of Enterobacteriaceae. There are only two
species, S. enterica and S. bongori. The S. enterica species is broken up into six
subspecies, enterica, salamae, arizonae, diarizonae, houtenae, and indica (Doyle and
Beuchat, 2007). These subspecies are further classified into serovars. There are over
2,500 serovars of Salmonella. Two of these serovars, Typhimurium and Enteritidis are
5
the most commonly found serovars in Salmonellosis oubreaks (Ray and Bhunia, 2008).
Salmonella spp. are responsible for causing Salmonellosis (Montville and Matthews,
2008). Salmonellosis is a sickness that causes enteric symptoms, which are local to where
the bacteria live in the host (Ray and Bhunia, 2008). It causes diarrhea, abdominal
cramping, nausea, chills, and fevers in as little as eight hours after consumption
(Montville and Matthews, 2008). At least 105 cells must be eaten to cause an infection.
The infection is typically isolated to your small and large intestines. It produces an
enterotoxin that causes inflammation and tissue damage at the site (Ray and Bhunia,
2008). The infectious does can be much lower and even fatal in the eldery,
immunocompromised, and the young (Doyle and Beuchat, 2007).
Salmonella is responsible for approximately 42,000 reported cases and over 1
million suspected cases of foodborne Salmonellosis in the US every year (Scallan et al.,
2011). Foodborne infections can be lethal, causing an average of 378 deaths a year
(Scallan et al., 2011). Traditional outbreaks are associated with chicken, pork, turkey,
eggs, cantelope, tomatoes, nuts, and seafood (Ray and Bhunia, 2008). Recent outbreaks
associated with S. enterica serovars have been linked to a variety of products including
peanut butter, fresh produce, and juices (CDC, 2013). Many cross contaminations in the
kitchen result in cases of Salmonelosis every year. Salmonellosis is recognized as the
major cause of all foodborne illnesses by any pathogen in outbreaks and invididual cases
since the 1950s in the United States and other developed countries (Ray and Bhunia,
2008).
ESCHERICHIA COLI O157:H7
6
Escherichia coli is a Gram-negative, rod-shaped bacterium. It is a facultative
anaerobe and is motile by means of flagella. E. coli is non-spore forming (Doyle and
Beuchat, 2007). It can grow well between 11-42°C with its optimum temperature being
30-42°C (Ray and Bhunia, 2008). E. coli typically doesn’t grow under 10°C and most
strains cannot grow below a pH of 4.5 (Ray and Bhunia, 2008). The bacterial cells can
easily survive after being frozen. E. coli is typically found as a harmless member of the
intestinal tract in humans and many other animals. It is typically used as a test bacterium
to see whether or not a food or water supply is contaminated. Typically, it is spread
through the fecal-oral route (Ray and Bhunia, 2008).
E. coli is a member of the Enterobacteriaceae family. It is broken up into six groups
based on their adherence to cells and the type of toxins that they produce:
Enteroaggregative, and Diffuse-adhering (Ray and Bhunia, 2008). This study will be
using a serogroup strain from the group Enterohemorrhagic E. coli (EHEC) called
Escherichia coli O157:H7. Escherichia coli O157:H7 is a member of a group of E. coli
species called Shiga toxin producing Escherichia coli (STEC). Shiga toxin, the toxin
produced by E. coli O157:H7, adds to the virulence of the pathogen (Montville and
Matthews, 2008). E. coli serogroups are broken up according to three of their major
surface antigens present. These three are the O antigen (somatic), the H antigen
(flagella), and the K antigen (capsule). There are over 100 O and K antigens and over 50
H antigens, which make an enormous number of possible combinations (Doyle and
Beuchat, 2007).
7
E. coli O157:H7 is the most commonly found shiga toxin-producing bacteria in
North America (Montville and Matthews, 2008). It takes as little as 100 cells to cause
symptoms of the infection (Ray and Bhunia, 2008). The bacteria can cause severe
diarrhea and cramping. The cells start their growth in the intestine and start to spread
their toxin into the bloodstream and all around the body. This can cause damage all over
the body including other organs and the brain. The most severe cases can lead to
hemolytic uremic syndrome (HUS) and thrombocytopenic purpura (TTP) (Montville and
Matthews, 2008; Ray and Bhunia, 2008). HUS is an extremely dangerous progression of
the sickness, which produces bloody diarrhea and can lead to kidney damage or failure,
and TTP can cause blood clotting in the brain (Ray and Bhunia, 2008). Symptoms
typically occur 3-9 days after being consumed. All of these symptoms can be fatal,
especially in the elderly, the young, and the immunocompromised (Doyle and Beuchat,
2007).
E. coli O157:H7 causes an estimated 63,000 foodborne infections and 20 deaths a
year in the US (Scallan et al., 2011). Recent studies have also found there to be an
increase in antibiotic resistant strains of EHEC (Doyle and Beuchat, 2007). Outbreaks
associated with the bacterium have been linked to contamination of meat products, juices,
ciders, water supplies, and even cheeses (Montville and Matthews, 2008). The largest
outbreaks have occurred in spinach and in ground beef (Ray and Bhunia, 2008). Since
the bacterium has been identified in the 1980’s, the number of outbreaks of E. coli
O157:H7 has drastically gone up in the United States (Doyle and Beuchat, 2007).
LISTERIA MONOCYTOGENES
8
Listeria monocytogenes is a Gram-positive, rod-shaped bacteria that is
facultatively anaerobic (Montville and Matthews, 2008). It is non-spore forming, and is
motile by means of flagella in a tumbling motion (Ray and Bhunia, 2008). The
bacterium is psychrotrophic and has adapted to growing and thriving in colder,
refridgerated temperatures that food is often stored in (Ray and Bhunia, 2008). Its
growth range is 1-44°C with its optimum temperature at around 37°C. Due to its
psychrotrophic nature, L. monocytogenes grows extremely well compared to other
bacteria from 7-10°C (Ray and Bhunia, 2008). It is a glucose fermenter and is hemolytic.
L. monocytogenes is resistant to high salt contents, low pH levels, and is acid tolerant,
which helps survival in the gut (Ray and Bhunia, 2008). It can be found in animals,
sewage, water, plants, and is found in the soil. Humans are often carriers without side
effects (Doyle and Beuchat, 2007).
There are six species of Listeria: monocytogenes, ivanovii, seeligeri, innocua,
welshimeri, and grayi (Doyle and Beuchat, 2007). L. monocytogenes is the only one that
is pathogenic to humans and some animals. L. ivanovii is pathogenic to animals,
especially cattle and sheep (Ray and Bhunia, 2008). The other species are
nonpathogenic. L. monocytogenes is divided into 13 serogroups, all of which have been
isolated in different regions around the world.
L. monocytogenes causes Listeriosis. This bacterial infection caused by L.
monocytogenes was not recognized until the 1980s (Ray and Bhunia, 2008). Listeriosis
is a sickness that causes non-enteric symptoms and spreads rapidly. It is typically
isolated to the small intestine during initial growth, and then can spread to other organs
via the bloodstream (Ray and Bhunia, 2008). Listeriosis causes severe fever, cramps, and
9
muscle aching (Montville and Matthews, 2008). The bacterium can cause septicemia in
the non-pregnant and abort fetuses in pregnant women (Montville and Matthews, 2008).
The infectious dose of L. monocytogenes is unknown, but is estimated to be fairly low
(100 cells) (Ray and Bhunia, 2008).
L. monocytogenes causes almost 1,600 foodborne infections and is responsible for
an estimated 255 deaths a year in the US (Scallan et al., 2011). The most at-risk groups
are those who are immunocompromised, the elderly, pregnant women, and fetuses
(Montville and Matthews, 2008; Doyle and Beuchat, 2007). Outbreaks associated with
the bacterium have been linked to contamination of meats, ready-to-eat foods, cheeses,
seafood, vegetables, juices, and fruit in recent years (Doyle and Beuchat, 2007; Montville
and Matthews, 2008). Many of the outbreaks can be isolated to improperly sanitized
storage areas and food processing equipment (Doyle and Beuchat, 2007). L.
monocytogenes has a fatality rate of over 25%. Because of the high fatality rate, there is a
zero tolerance policy for foods in the United States (Ray and Bhunia, 2008).
COCONUT WATER
FUNDAMENTAL COCONUT
The coconut tree is a perennial plant that flowers year round. Typically it flowers
every month. The tree can survive over 70 years and produces coconuts up to 13 times a
year (Jackson et al., 2004). A coconut tree (Cocos nucifera) produces fruit, which are
hard, cantaloupe-sized drupes. Inside each coconut’s outer shells is a white meaty layer,
and inside that is the central cavity Gabriel, 2009). This central cavity is coated with a
jelly-like substance. This jelly is translucent and very soft when the coconut is young
10
(Jackson et al., 2004). The cavity is filled up with a liquid endosperm, which is
cytoplasmic in origin (Chowdhury et al., 2005; Yong et al., 2009). This cavity can be
filled with up to 600ml of liquid (Chowdhury et al., 2005). Yong et al. stated that the
liquid part of the coconut’s endosperm is the coconut water (CW), and the coconut milk
is the product gathered by squeezing or cutting up the pulp and adding water. Coconut
milk is typically used as an ingredient in cooking or baking and not consumed as a drink,
whereas coconut water is served as a refreshing beverage. Coconut milk is used for the
production of coconut oil and cooking products because of its high levels of lipids and
protein. CW is mainly composed of water (Yong et al., 2009).
COCONUT COMPOSITION
CW is considered a low acid (>4.6) and high water activity (~0.995) beverage
(Walter et al., 2009). CW contains fats, proteins, carbohydrates, and minerals
(Narataruksa et al., 2010; Prades et al., 2012). Some of these minerals include calcium,
iron, magnesium, phosphorus, potassium, and sodium (Prades et al., 2012). Other types
of nutrients found in CW include zinc, copper, manganese, selenium, chlorine, sulphur,
aluminum, and boron. Vitamin content includes C, B1, B2, B3, B5, B6, B7, and B9 (Yong
et al., 2009). The mineral and vitamin amounts of the CW can vary due to variety and
geography (Seow and Gwee, 1997). The main carbohydrates found in CW are glucose,
fructose, and sucrose (Jackson et al., 2004).
Many studies have been done to understand the nutritional content changes of the
coconuts during their stages of maturity. Fat and protein content were found to increase
month to month until about nine months, which is believed to be due to the development
of the endosperm (Jackson et al., 2004). This is also when the soft jelly coating
11
disappears and begins to harden to become more of the white, meaty part of the coconut.
As an immature green coconut, the sugar levels are low (1.5%) and increase as it matures
(5%). Also, at immature stages, the CW is almost entirely reducing sugars such as
glucose and fructose. When the nut matures, non-reducing sugars such as sucrose
appeared and content increased until maturity (Jackson et al., 2004; Yong et al., 2009).
The CW pH levels also seemed to become more basic as the coconut matured until about
10 months. The pH went from ~4.5 up to almost 6 (Jackson et al., 2004; Murasaki-
Aliberti et al., 2009; Damar et al., 2009; Gabriel et al., 2009; Campos et al., 1996).). The
soluble solids and total solids increased as the nut matured as well. The volume of CW in
the central cavity increases until about the ninth month, and then it starts to decrease
(Jackson et al., 2004). Coconut water also contains enzymes that cause browning in both
the water and the coconut meat, one of which is phenol oxidase (PPO) (Matsui et al.,
2008). Because of the changes over time and the presence of enzymes, the CW producer
must select the perfect month to harvest the coconuts and generally allow for no longer
than one week on the shelf at refrigeration temperatures if the CW has not been processed
or treated at all (Jackson et al., 2004; Walter et al., 2009).
COMMERCIAL COCONUT WATER
CW is mostly consumed and commercially produced in Indonesia, Philippines,
Thailand, and Brazil (Damar et al., 2009). Production of CW for human consumption
typically includes acidification, sweetening, and processed thermally with Ultra High
Temperature (UHT) (Damar et al., 2009; Gabriel et al., 2009). The CW must be acidified
down to a pH of at least 4.6 to prevent the possible growth of Clostridium botulinum, and
then thermally processed to avoid other pathogenic growth (Damar et al., 2009). The risk
12
of bacterial contamination is increased due to the coconuts typically being placed on the
ground during harvest, as well as its high pH, and high water activity (Walter et al.,
2009). The typical coconut is harvested at about nine months of maturity (Jackson et al.,
2004).
Traditionally, CW has been used for other sources than just a refreshing beverage.
In remote locations where there are few hospitals, CW be used as a replacement for
intravenous fluid bags. The saline content and pH allow the CW to safely replenish ions
and liquid in the body (Campbell-Falck et al., 2000). CW is currently used in laboratory
settings to help encourage plant tissue culturing. CW makes a good growth-promoting
component (Yong et al., 2009). CW is also being tested out as an antimicrobial
ingredient. Wang and Ng (2005) have found an antifungal peptide within the coconut
fibers. There have also been three antimicrobial peptides found in CW that appear to be
inhibitory to Gram-positive and negative human pathogens (Mandal et al., 2009).
CURRENT JUICE PROCESSING
REASONS FOR THERMAL PROCESSING
Most juice on the market is processed thermally. This process is thorough in
destroying pathogens, spoilage microbes, and is every effective in inactivating enzymes
like pectin methylesterase and phenol oxidase (Rawson et al., 2011). These enzymes
cause browning or reduce cloud formation in the drink, which is problematic for
consumers (Farnworth et al., 2001). Processes like pasteurization, blanching, and retort
sterilization are very common because they are recognized by the FDA as approved
methods to treat the product, and prevent spoilage. Because thermal processing prevents
13
spoilage microorganisms from surviving, the juices treated thermally often have extended
shelf lives, even at room temperature (Ferrari et al., 2011). Blanching is often considered
the most effective method to control enzymatic browning (Weemaes et al., 1998).
NEGATIVE CONSEQUENCES
Thermal treatments can negatively affect the sensorial and nutritional qualities of
the juices (Wolbang et al., 2008). Juices that are often harmed the most by the thermal
treatment are low acid and thermosensitive juices. Some of these noted changes in
specific drinks include a loss of lycopene in watermelon juice, odor and ascorbic acid
loss in cantaloupe juice, loss of beta-carotene, color, carotenoids, ascorbic acid and free
radical scavenging activity in carrot juice, and a rapid decrease in ascorbic acid content in
tomato juice following thermal treatment (Ma et al., 2010; Dede et al., 2007; Patterson et
al., 2012).
Many of the bioactive compounds found in the juice are affected by thermal
treatments (Ferrari et al., 2011). In fruit beverages, one of the biggest losses comes from
ascorbic acid, which is very thermosensitive (Keenan et al., 2012). This ascorbic acid is
used as an antioxidant to prevent the enzymatic browning in fruits. If the ascorbic acid is
gone, and not all of the enzymes have been inactivated, browning can occur. Keenan et
al. also found that the color in thermally treated fruit smoothies appeared significantly
darker than the color of fresh fruit smoothies. Temperature increases were also found to
change the color of guacamole when given a treatment (Palou et al., 2000). Many
producers consider thermal processing to be unacceptable in anthocyanin containing
juices. The high temperatures that are so effective in inactivating the PPO enzymes also
cause anthocyanin degredation (Weemaes et al., 1998). Many customers and sensory
14
panels have indicated a clear preference for fresh beverage compared to thermally treated
beverages (Walter et al., 2009).
THERMAL PROCESSING OF COCONUT WATER
Thermal processing of CW is shown to cause a fouling effect. This fouling is
shown by a formation of white, greasy deposits (Narataruksa et al., 2010). The deposits
are composed of proteins (albumins and globulins), fats, and minerals. These deposits
can begin to form at 50°C in coconut milk and as the treatment temperature increases, so
does the mass of the deposit formation (Narataruksa et al., 2010). Narataruksa et al.
found that many of the deposits were responsible for the loss in many of the minerals in
the remaining coconut milk. These detrimental sensory effects are why CW is often sold
without being thermally treated in regions where coconuts are grown, such as Indonesia
and the Philippines (Gabriel et al., 2009). Since thermal treatments destroy much of what
consumers want in their juice, exploration of other non-thermal processing techniques is
essential. One treatment that shows promise is high hydrostatic pressure processing
(HPP) (Patterson et al., 2005).
HIGH PRESSURE PROCESSING
THEORY
High Pressure Processing (HPP) is a non-thermal processing treatment that
exposes the product to isostatic pressure so that all parts of the product are exposed to
equal pressure all at the same time (Patterson, 2005). Rawson et al. (2005) defines the
parameters of HPP used in the food production industry as using 100-800 MPa with the
temperature being from (0 - 100)°C from a few seconds to 20 minutes. HPP can break
the hydrophobic and electrostatic bonds of proteins, including enzymes, which can have
15
activity enhanced or destroyed following these conformational changes (Barba et al.,
2011). The isostatic pressure does not affect hydrogen or covalent bonds (Patterson,
2005). Low-molecular mass compounds like vitamins, flavor compounds, and color
compounds are not affected following treatment (Patterson, 2005; Oey et al., 2008). The
DNA helix (hydrogen bonds) is typically unharmed during HPP, but replication and
transcription are disrupted (Patterson, 2005). HPP can also cause chemical and
enzymatic reactions, such as browning to accelerate, slow down, or stop (Butz et al.,
2003; Oey et al., 2008).
HPP can destroy bacteria, yeasts, molds, and viruses (Michiels et al., 2008).
Destruction of these organisms helps prevent food spoilage and can reduce pathogens if
they are present in the product (Bull et al., 2004). Gram-positive bacteria seem to be
more resistant to pressure than Gram-negative; and cocci-shaped cells seem to be more
resistant than rod-shaped (Patterson, 2005). The food product, which is normally
susceptible to bacterial growth, may have chemical changes under different pressure
situations that help prevent bacterial growth (Pilavtepe-Çelik, 2012). Bull et al. (2004)
suggests that a HPP compounded with a slight thermal treatment would completely
deactivate all microorganisms while providing a minimally changed product.
ADVANTAGES TO HIGH PRESSURE PROCESSING
High pressure processed food show many benefits. Some of these include
retention of flavors, nutrients, colors, reduced need for additives to retain original flavors,
reduced need of preservatives, and the process require less energy (Gomes and Ledward,
1996). Many researchers have found HPP juices and whole fruits to be of better quality
than similar products that have been thermally treated (Oey et al., 2008). Many of the
16
quality tests run on juices are judged by their ability to retain their original nutrition
content, like ascorbic acid levels. HPP treated juices have been found to have better
microbial stability, ascorbic acid retention, and antioxidant retention over a period of 30
days than thermal treatments (Dede et al., 2007). For example, HPP led to a better anti-
radical scavenging capacity, color, and pH retention of tomato and carrot juices compared
to thermally treated (Dede et al., 2007). Patterson et al. (2012) suggested that HPP may
turn on anti-bacterial properties in juices that would otherwise be inactive.
There were no significant changes in the aromatics or brix of melon juice,
ascorbic acid in blueberries, or carotenoids, anthocyanins, chlorophyll, and viscosity of
most juices as a result of HPP (Barba et al., 2011; Oey et al., 2008; Ma et al., 2010;
Wolbang et al., 2008; Liu et al., 2012). Pigments have been shown to have a great
resistance to pressure (Oey et al., 2008) and blueberry juice actually had an increase in
phenolic content as shown by a higher extraction of antioxidant components following
HPP (Barba et al., 2011). Sometimes there is actually an increase of polyphenol content
after HPP treatments due to the pressure breaking up suspended particles in the food
system and allowing for these particles to leak out and cause a raise in these antioxidants
(Ferrari et al., 2011).
Sensory panel studies have confirmed that HPP low acid juices retain their flavors
and freshness better than thermally treated (Pilavtepe- Çelik, 2012). In a study using
CW, panelists liked HPP samples of CW more than thermally treated samples of CW
initially after treatments (Damar et al.; 2009). Thermally treated samples of CW had
significantly higher off-flavor sensory scores. A significantly higher number of panelists
said they would prefer to purchase the HPP treated CW over the heat-treated (Damar et
17
al., 2009). The study evaluated sensory characteristics and not a reduction in pathogens in
the juice.
DISADVANTAGES TO HIGH PRESSURE PROCESSING
High pressure processing has many positive qualities when using it to process
food items. However, it does have some shortfalls when using it compared to thermal
processing. High pressure processing is very expensive. Equipment can cost upwards of
a million dollars, whereas a UHT machine may cost only in the hundreds of thousands.
These capital costs alone can dissuade any company from attempting to use this
technology.
The HPP equipment is equipped for only batch style of processing rather than a
continuous line. This is a problem when it comes to volume production. Companies are
trying to put out as much safe product as they can, but if it is taking longer to process,
load, and unload each batch, the company will not be able to keep up with a thermal
processing unit. Many HPP runs can take upwards of five minutes (Murasaki-Aliberti et
al., 2009). To have a realistic chance on the market, a product processed by an
alternative processing method should take no longer than five minutes in order to be
successful according to Jordan et al (2001).
HPP products may also not have as good shelf stability over time compared to
thermally treated products (Ferrari et al., 2011). One of the reasons for this is because
HPP does not always have the ability to inactivate many of the enzymes that cause
browning or other degredative effects (Keenan et al., 2012). One of the most notorious
enzymes that causes these effects is phenol oxidase (Martinez and Whitaker, 1995).
PHENOL OXIDASE
18
BROWNING ENZYME
Phenol oxidase (PPO), or 1,2 benzenediol oxidase is an enzyme found in most
fruits. It is one of the major enzymes that causes the browning of fruits and vegetables
after they are opened up or damaged and exposed to oxygen (Murasaki-Aliberti et al.,
2009). The fruits contain o-diphenols, which are oxidized by PPO in the presence of
oxygen. This produces o-quinones. The o-quinones self-polymerize with each other.
These polymers cause brown pigments to form. These brown pigments are referred to
melanins, and are the browning that is seen when fruits are injured (Murasaki-Aliberti et
al., 2009; Correa Garcia and Buzaleh, 1994; Weemaes et al., 1998; Buckow et al., 2009;
Martinez and Whitaker, 1995). PPO is found in most higher plants, some insects, and all
mammals (Martinez and Whitaker, 1995; Gomes and Ledward, 1996). PPO is rarely ever
found in bacteria or fungi. Most researchers believe it has a protective function and is
unlikely to affect metabolism rates within the organism (Martinez and Whitaker, 1995).
PPO is used as a biological indicator of thermal processing due to its resistance to
heat (Matsui et al., 2008). PPO from different sources may have different thermal
resistance, optimum pH, molecular sizes, and conformations (Gomes and Ledward,
1996). PPO has an optimum pH of around 6.0 - 7.0 at which it is able to function at its
highest rate (Correa Garcia and Buzaleh, 1994; Weemaes et al., 1998). Among its ability
to degrade the food, the PPO also causes other problems in food systems. Since PPO
uses polyphenols as its substrate, this leads to an overall drop in antioxidant and
polyphenol content in the food system (Keenan et al., 2012). PPO was found to cause
severe changes in both color and turbidity in grapes and grape musts being used to create
wines (Castellari et al., 1997).
19
DEACTIVATION OF PHENOL OXIDASE
PPO can be deactivated and controlled by a few different methods employed by
various food producers. Thermal processing is the most commonly used process and
works well most of the time when thermal processing is allowed (Chutintrasri and
Noomhorm, 2006). A decline in pH to levels around 4.0 or below helps to deactivate the
PPO in many foods (Palou et al., 2000; Martinez and Whitaker, 1995). Lowering
dissolved oxygen in food systems may help lower activity (Gomes and Ledward, 1996;
Martinez and Whitaker, 1995). Increased salt levels help lower PPO activity (Buckow et
al., 2009). Sulphites had been traditionally used to inhibit PPO in wines and various
foods. The FDA has banned sulfites from certain food products. Sulphites have been
phased out of many products due to customer allergies and overall health issues with
them (Castellari et al., 1997; Martinez and Whitaker, 1995). The most effective way to
diminish the activity of PPO is to use reducing compounds like ascorbate, bisulfites, and
thiol compounds (Martinez and Whitaker, 1995). These compounds are not always
approved in food systems, however, so they are not as useful as they seem. High
pressure is another method that is used to control PPO (Keenan et al., 2012). Most HPP
can reduce PPO levels a little bit, but requires an extremely high amount of pressure for a
long time to reduce activity enough (Gomes and Ledward, 1996). HPP has actually been
shown to increase PPO activity in some instances (Palou et al., 2000). It is believed that
HPP caused an increase in hydrophobic interactions and improved hydrogen bonding of
certain enzymes, causing an increase in enzyme activity (Buckow et al., 2009).
HIGH PRESSURE PROCESSING ON PHENOL OXIDASE
20
PPO enzymes can vary drastically in how they react to different treatments.
Thermal resistance to the PPO in CW was much higher than the resistance in PPO from
another fruit (Murasaki-Aliberti et al., 2009). In a study by Matsui et al., the PPO in CW
was found to be more thermally resistant than PPO found in mushrooms or grapes, but
less thermally resistant than PPO found in apples. PPO in mushrooms was found to
completely inactivate after a treatment with HPP and this inactivation was irreversible.
The same treatment with potato PPO allowed for some PPO activity to be retained
(Gomes and Ledward, 1996). The HPP is believed to have inactivated these enzymes by
inducing conformational changes in the protein structure, such as the breaking of many
α-helix structures (Gomes and Ledward, 1996; Keenan et al., 2012). Gomes and
Ledward found differences in PPO activity with the same HPP treatments between
mushrooms, apples, and potatoes. The protein structure alterations caused by the HPP
were observed to be mostly reversible if treated with less than 200 MPa. Changes in
protein structure were shown when eggs were treated with HPP. The HPP treated egg’s
ovalbumin did not have the same structure as its untreated form (Hayakawa et al., 1992).
The slow renaturation process produced conformational drift and the food system showed
hysteresis (Gomes and Ledward, 1996). HPP may also help with lowering the amount of
dissolved oxygen in the product (Keenan et al., 2012). Another finding was that when
the pressure treatments increased in pressure, the less active the PPO. Studies have
shown HPP treatments with higher pressures or longer times showed a greater decrease in
PPO activity (Keenan et al., 2012; Castellari et al., 1997; Chutintrasri and Noomhorm,
2006; Rawson et al., 2011). Buckow et al. (2009) believes that in order to lower PPO
21
activity in foods, the PPO from different food sources must be studied rather than
thinking PPO from every product all react the same to every treatment.
22
REFERENCES
Barba, F. J., Esteve, M. J., & Frigola, A. (2013). Physicochemical and nutritional characteristics of blueberry juice after high pressure processing. Food Research International, 50(2), 545-549.
Buckow, R., Weiss, U., & Knorr, D. (2009). Inactivation kinetics of apple polyphenol oxidase in
different pressure-temperature domains. Innovative Food Science and Emerging Technologies, 10, 441-448.
Bull, M. K., Zerdin, K., Howe, E., Goicoechea, D., Paramanandhan, P., Stockman, R.,
Sellahewa, J., Szabo, E. A., Johnson, R. L., & Stewart, C. M. (2004). The effect of high pressure processing on the microbial, physical and chemical properties of Valencia and Navel orange juice. Innovative Food Science & Emerging Technologies, 5(2), 135-149.
Burkitt, L. (2009). Coconut Water: A Hard Nut to Crack. Forbes. Available at:
http://www.forbes.com/2009/06/04/vita-coco-zico-one-leadership-cmo-network-coconutwater.html. Accessed 21 January 2013
Butz, P., Garc!ıa, A. F. a., Lindauer, R., Dieterich, S., Bogn!ar, A., & Tauscher, B. (2003).
Influence of Ultra High Pressure Processing on Fruit and Vegetable Products. Journal of Food Engineering, 56, 233-236.
Campbell-Falck, D., Thomas, T., Falck, T. M., Tutuo, N., & Clem, K. (2000). The
Intravenous Use of Coconut Water. American Journal of Emergency Medicine, 18(1), 108-111.
Campos, C. F., Souza, P. E. A., Coelho, J. V., & Gloria, M. B. A. (1996). Chemical Composition, Enzyme Activity and Effect of Enzyme Inactivation on Flavor Quality of Green Coconut Water. Journal of Food Processing and Preservation, 20, 487-500.
Castellari, M., Matricardi, L., Arfelli, G., Rovere, P., & Amati, A. (1997). Effects of high
pressure processing on polyphenoloxidase enzyme activity of grape musts. Food Chemistry, 60(4), 647-649.
Centers for Disease Control and Prevention. (2013). Reports of Selected Salmonella Outbreak Investigations. Available at: http://www.cdc.gov/salmonella/outbreaks.html. Accessed 21 January 2013.
Chowdhury, M. M., Aziz, M. G., & Uddin, M. B. (2005). Development of Shelf-stable Ready-to-
serve Green Coconut Water. Biotechnology, 4(2), 121-125. Chutintrasri, B., & Noomhorm, A. (2006). Thermal inactivation of polyphenoloxidase in
pineapple puree. LWT, 39, 492-495.
23
Damar, S., Balaban, M. O., & Sims, C. A. (2009). Continuous dense-phase CO2processing of a
coconut water beverage. International Journal of Food Science & Technology, 44(4), 666-673.
Dede, S., Alpas, H., & Bayındırlı, A. (2007). High hydrostatic pressure treatment and storage of
carrot and tomato juices: Antioxidant activity and microbial safety. Journal of the Science of Food and Agriculture, 87(5), 773-782.
Doyle, M. P. & Beuchat L. R. (2007). Food Microbiology: Fundamentals and Frontiers, Third
Edition. ASM Press. Washington, DC. Esterl, M. (2012). The Beverage Wars Move to Coconuts. The Wall Street Journal. Available at:
http://online.wsj.com/news/articles/SB10001424052970203315804577207313086829188. Accessed 8 December 2013.
Farnworth, E. R., Lagace, M., Couture, R., Yaylayan, V., & Stewart, B. (2001). Thermal processing, storage conditions, and the composition and physical properties of orange juice. Food Research International, 34, 25-30.
Ferrari, G., Maresca, P., & Ciccarone, R. (2011). The effects of high hydrostatic pressure on the
polyphenols and anthocyanins in red fruit products. Procedia Food Science, 1, 847-853.
Gabriel, A. A., Cruz, K. G. S., & De Guzman, J. A. D. (2009). Thermal Death Times Ofescherichia Coliin Young Coconut Endosperm Beverage. Journal of Food Processing and Preservation, 33, 136-144.
Garcia, S. C. & Buzaleh, A. M. (1994). Polyphenoloxidase: An Enzyme Widespread in Fruits. Biochemical Education, 22(3), 152-153.
Gomes, M. R. A. & Ledward, D. A. (1996). Effect of high-pressure treatment on the activity of
some polyphenoloxidases. Food Chemistry, 56, 1-5. Hayakawa, I., Kajihara, J., Morikawa, K., Oda, M., & Fujio, Y. (1992). Denaturation of Bovine
Serium Albumin (BSA) and Ovalbumin by High Pressure, Heat and Chemicals. Journal of Food Science, 57(2), 288-292.
Jackson, J. C., Gordon, A., Wizzard, G., McCook, K., & Rolle, R. (2004). Changes in chemical composition of coconut (Cocos nucifera) water during maturation of the fruit. J Sci Food Agric, 84, 1049-1052.
Jordan, S. L., Pascual, C., Bracey, E., & Mackey, B. M. (2001). Inactivation and Injury of Pressure-Resistant Strains of Escherichia coli O157 and Listeria monocytogenes in Fruit Juices. Journal of Applied Microbiology, 91, 463-469.
24
Keenan, D. F., Rößle, C., Gormley, R., Butler, F., & Brunton, N. P. (2012). Effect of high hydrostatic pressure and thermal processing on the nutritional quality and enzyme activity of fruit smoothies. Food Science and Technology, 45, 50-57.
Liu, Y., Hu, X., Zhao, X., & Song, H. (2012). Combined effect of high pressure carbon dioxide
and mild heat treatment on overall quality parameters of watermelon juice. Innovative Food Science & Emerging Technologies, 13, 112-119.
Ma, Y., Hu, X., Chen, J., Zhao, G., Liao, X., Chen, F., Wu, J., & Wang, Z. (2009). Effect of
UHP on Enzyme, Microorganism and Flavor in Cantaloupe (Cucumis Melo L.) Juice. Journal of Food Process Engineering, 33(3), 540-553.
Mandal, S. M., Dey, S., Mandal, M., Sarkar, S., Maria-Neto, S., & Franco, O. (2009).
Identification and structural insights of three novel antimicrobial peptides isolated from green coconut water. Peptides, 30, 633-637.
Martinez, M. V. & Whitaker, J. R. (1995). The biochemistry and control of enzymatic browning.
Trends in Food Science & Technology, 6, 195-200. Matsui, K. N., Gut, J. A. W., Oliveira, P. V., & Tadini, C. C. (2008). Inactivation kinetics of
polyphenol oxidase and peroxidase in green coconut water by microwave processing. Journal of Food Engineering, 88, 169-176.
Michiels, C., Bartlett, D. H., & Aertsen, A. (2008). High-Pressure Microbiology. ASM Press. Washington, DC.
Montville, T. J., & Matthews, K. R. (2008). Food Microbiology: An Introduction (Second ed.).
Washington, DC: ASM Press. Murasaki-Aliberti, N. C., Silva, R. M. S., Gut, J. A. W., & Tadini, C. C. (2009). Thermal
inactivation of polyphenoloxidase and peroxidase in green coconut (Cocos nucifera) water. International Journal of Food Science and Technology, 44, 2662-2668.
Narataruksa, P., Pichitvittayakarn, W., Heggs, P. J., & Tia, S. (2010). Fouling behavior of
coconut milk at pasteurization temperatures. Applied Thermal Engineering, 30(11-12), 1387-1395.
Oey, I., Lille, M., Van Loey, A., & Hendrickx, M. (2008). Effect of high-pressure processing on
colour, texture and flavour of fruit- and vegetable-based food products: a review. Trends in Food Science & Technology, 19(6), 320-328.
Palou, E., Hern ́andez-Salgado, C., L ́opez-Malo, A., Barbosa-C ́anovas, G. V., Swanson, B.
G., & Welti-Chanes, J. (2000). High pressure-processed guacamole. Innovative Food Science & Emerging Technologies, 1, 69-75.
25
Patterson, M. F. (2005). Microbiology of pressure-treated foods. Journal of Applied Microbiology, 98(6), 1400-1409.
Patterson, M. F., McKay, A. M., Connolly, M., & Linton, M. (2012). The effect of high
hydrostatic pressure on the microbiological quality and safety of carrot juice during refrigerated storage. Food Microbiology, 30(1), 205-212.
Pilavtepe-Çelik, M. (2012). High hydrostatic pressure (HHP) inactivation of foodborne
pathogens in low-acid juices. International Journal of Food Science & Technology, 1-5. Prades, A., Dornier, M., Diop, N., & Pain, J.-P. (2012). Coconut water uses, composition and
properties: a review. Fruits, 67(2), 87-107. Ramaswamy, R., Balasubramaniam, V. M., & Kaletun, G. High Pressure Processing. Ohio State
University. Available at: http://ohioline.osu.edu/fse-fact/0001.html. Accessed 18 November 2012.
Rawson, A., Patras, A., Tiwari, B. K., Noci, F., Koutchma, T., & Brunton, N. (2011). Effect of
thermal and non thermal processing technologies on the bioactive content of exotic fruits and their products: Review of recent advances. Food Research International, 44, 1875-1887.
Ray, B. & Bhunia, A. (2008). Fundamental Food Microbiology. Fourth Edition. Taylor &
Francis Group, LLC. Boca Raton, FL. Scallan, E., Hoekstra, R. M., Angulo, F. J., Tauxe, R. V., Widdowson, M.-A., Roy, S. L., Jones,
J. L., & Griffin, P. M. (2011). Foodborne Illness Acquired in the United States—Major Pathogens. Emerging Infectious Diseases, 17(1), 7-15.
Seow, C. C., & Gwee, C. N. (1997). Review: Coconut Milk: Chemistry and Technology.
International Journal of Science and Technology, 32, 189–201. U.S. Food and Drug Administration. 1998. Food Labeling: Warning and Notice Statement;
Labeling of Juice Products. Fed. Regist. 63: 37029-37056 U.S. Food and Drug Administration. 2001. Hazard Analysis and Critical Control Point
(HACCP); Procedures For the Safe and Sanitary Processing and Importing of Juice Fed. Regist. 66: 6137– 6202.
Vojdani, J. D., Beuchat, L. R., & Tauxe, R. V. (2007). Juice-Associated Outbreaks of Human
Illness in the United States, 1995 through 2005. Journal of Food Protection, 71(2), 356-364.
Walter, E. H. M., Nascimento, M. S., & Kuaye, A. Y. (2009). Efficacy of sodium hypochlorite
and paracetic acid in sanitizing green coconuts. Letters in Applied Microbiology, 49, 366-371.
26
Walter, E. H. M., Kabuki, D. Y., Esper, L. M. R., Sant’Ana, A. S., & Kuaye, A. Y. (2009).
Modelling the growth of Listeria monocytogenes in fresh green coconut (Cocos nucifera L.) water. Food Microbiology, 26, 653-657.
Wang, H. X. & Ng, T. B. (2005). An antifungal peptide from the coconut. Peptides, 26, 2392-
2396.
Weemaes, C. A., Ludikhuyze, L. R., Van den Broeck, I., Hendrick, M. E., & Tobback, P. P. (1998). Activity, Electrophoretic Characteristics and Heat Inactivation of Polyphenoloxidases from Apples, Avocados, Grapes, Pears and Plums. LWT, 31(1), 44-49.
Whitney, B. M., Williams, R. C., Eifert, J., & Marcy, J. (2008). High Pressures in Combination
with Antimicrobials to Reduce Escherichia coli O157:H7 and Salmonella Agona in Apple Juice and Orange Juice. Journal of Food Protection, 71(4), 820-824.
Wolbang, C. M., Fitos, J. L., & Treeby, M. T. (2008). The effect of high pressure processing on
nutritional value and quality attributes of Cucumis melo L. Innovative Food Science & Emerging Technologies, 9(2), 196-200.
Yong, J. W. H., Ge, L., Ng, Y. F., & Tan, S. N. (2009). The Chemical Composition and
Biological Properties of Coconut (Cocos nucifera L.) Water. Molecules, 14, 5144-5164.
27
Survival and Growth of Escherichia coli O157:H7, Salmonella Typhimurium, and
Listeria monocytogenes in Coconut Water
28
ABSTRACT
Juices have been implicated in numerous foodborne microbial outbreaks over the
last couple decades. Coconut water (CW) is a juice that is gaining popularity in the
United States, with some estimates indicating that sales of CW have increased over 300%
in recent years. CW has yet to be implicated in a foodborne outbreak but parameters of
the juice (nutrients, minerals, high pH, and high Aw) would likely aid in survival and
growth of foodborne pathogens if contamination were to occur. This study examines the
survival and growth of Escherichia coli O157:H7, Salmonella Typhimurium, and Listeria
monocytogenes in CW. CW and trypic soy broth (TSB, control) were inoculated with
each pathogen separately to achieve an initial inoculum level of approximately 2-log10
CFU/ml, and incubated for 24 hours at 37°C. Inoculated CW and TSB were sampled for
each pathogen at 0, 3, 4, 5, 6, 7, 8, 12, and 24 hours. All three pathogens reached a level
of at least 8-log10 CFU/ml in CW after 24 hours. L. monocytogenes showed a lag in
initial growth, but eventually grew to similar levels as S. Typhimurium and E. coli.
Growth of the pathogens in CW was significantly less (about 1-log10 CFU/ml less), on
average, than the growth in TSB. This study showed that select foodborne pathogens
were able to grow in CW under these conditions.
29
INTRODUCTION
A reported 21 US outbreaks associated with juices occurred between 1995 and
2005 (Vojdani et al., 2008). Some of these outbreaks have been caused by Escherichia
coli O157:H7, Salmonella enterica spp., and Listeria monocytogenes (Vojdani et al.,
2008). Fresh fruits and vegetables can become contaminated with foodborne pathogens
during growth, harvest, and even in the processing plant. After being extracted from the
fruits or vegetables, the juices are processed, which is most often done thermally
(Rawson et al., 2011). Juice processors must follow the FDA’s Juice HACCP regulation
and achieve a 5-log10 CFU/ml reduction in the pathogen pertinent to each specific juice
(FDA, 2001).
Relatively new to the US markets, coconut water (CW) is gaining popularity. The
industry has seen a growth rate of over 300% and sales of over 30 million dollars a year
in recent years (Burkitt, 2009). CW is classified as a juice and its producers must follow
the juice HACCP guidelines implemented by the FDA (FDA, 2001). CW is typically
processed thermally, through Ultra-High Temperature - >100°C for up to 5 seconds
(UHT) and then is often acidified with citric acid to achieve a pH below 4.6 and
sweetened (Damar et al., 2009; Gabriel et al., 2009). It is known to be a healthy drink
with B and C vitamins, minerals, and is excellent for rehydrating after a taxing workout
(Prades et al., 2012).
CW has a pH of 4.2-6.0 and Aw of .995, (Walter et al., 2009). Due to its nutrient
composition, CW could make an excellent growth medium for foodborne pathogens.
CW is currently used in laboratory settings to help encourage plant tissue culturing and is
known as a good growth-promoting component for plant cells (Yong et al., 2009). The
30
CW while inside the coconut is thought to be sterile (Walter et al., 2009). However, once
the coconut is cracked and the juice is extracted, contamination could occur during
processing. To our knowledge no known outbreaks have been linked to CW, and no
studies have investigated and quantified the survival and/or growth of these foodborne
pathogens in CW.
The objective of this study was to determine if CW would support the growth of
three foodborne pathogens (E. coli O157:H7, Salmonella spp., and Listeria
monocytogenes).
31
MATERIALS AND METHODS
INOCULUM PREPARATION
Escherichia coli O157:H7 Cider (strain isolated from cider outbreak and obtained
from Dr. Larry Beuchat, University of Georgia); Salmonella Typhimurium (ATCC
14028); and Listeria monocytogenes Scott A (strain isolated from milk outbreak and
obtained from Dr. Larry Beuchat, University of Georgia) were used in this study.
Cultures were stored at -80°C in a 20% Glycerol solution prior to use. To activate,
cultures were obtained from the -80°C freezer and transferred to 10mL Tryptic Soy Broth
(TSB; Difco, Detroit, MI), or 10ml TSB with a 0.6% Yeast Extract (L. monocytogenes ;
TSBYE; Difco, Detroit, MI) and incubated for 24h at 37°C. Following incubation, one
loopful of each culture was transferred to fresh TSB and TSBYE (10 ml) and two
successive 24 hr transfers were completed.
Activated cultures of each pathogen, E. coli, S. Typhimurium and L.
monocytogenes were streaked onto selective media: Sorbitol MacConkey Agar (SMAC),
Xylose lysine deoxycholate agar (XLD), and Modified Oxford Agar (MOX), respectively
(all from Difco, Detroit, MI). Presumptively positive colonies from each medium were
then confirmed using biochemical testing. Colonies from the MOX plates were then used
to inoculate an API Listeria Test Kit (bioMérieux, Inc., Durham, NC). Colonies from
SMAC and XLD plates were used to inoculate an API 20E Test Kit (bioMérieux, Inc.,
Durham, NC). Colonies from SMAC and XLD were also used for a RIM E. coli
O157:H7 Latex Agglutination Kit (Remel, Lanexa, KS) and Salmonella Latex Test
(Oxoid Ltd, Hants, UK), respectively. Following confirmation procedures, cultures were
kept stored at 4°C prior to each experiment.
32
COCONUT WATER PREPARATION
Coconuts (Florida Coconuts, Davie, FL) were freshly picked and shipped to
Virginia. They were stored at 4°C for no more than two weeks before use. The coconuts
were sprayed with a 70% w/v aqueous ethanol solution until completely covered by the
ethanol in a biological safety cabinet (Type A/B3, NuAire, Plymouth, MN) and allowed
to dry for two minutes. A hole was bored into the center of the stem scar of the coconut
with a sterile metal coconut opener (Florida Coconuts, Davie, FL). The CW was drained
into a sterile beaker and poured into a Stericup® 0.45 µm 250ml filter unit (EMD
Millipore, Darmstadt, Germany) and vacuum filtered. Portions (99ml) of CW were then
pipetted into 12 sterilized glass 100 ml dilution bottles each and stored no longer than an
hour until use.
GROWTH CURVE
Two 10 ml test tubes of each 24h culture were spun at 6000 rpm for 10 minutes.
Supernatant was discarded and cells were re-suspended in 10 ml of sterile peptone water
(SPW). Cells were washed twice more and finally re-suspended in SPW. The cultures
were then serially diluted in SPW. One ml of each diluted culture was then added to three
different flasks containing 99ml of sterile CW to achieve approximately 2-log10 CFU/ml
concentration in each flask. Each flask was sampled and plated onto trypic soy agar at 0,
3, 4, 5, 6, 7, 8, 12, and 24 hours. This experiment was run in triplicate (n=9). As a
positive control, the process was repeated using TSB/TSBYE as the growth medium, and
measured at hours 0, 4, 8, 12, and 24 hrs. As a negative control, filter sterilized,
uninoculated CW was enumerated on TSB to ensure that there was no background
growth on TSB to interfere with the plate counts.
33
STATISTICAL ANALYSIS
The growth of E. coli, S. Typhimurium, and L. monocytogenes in both CW and
TSB/TSBYE was performed in triplicate on three different days. Each hourly plate count
on TSA/TSAYE was averaged. Error bars were created using α = 0.05 and significant
differences were analyzed with ANOVA and Tukey-Kramer HSD method on JMP Pro 10
(SAS Institute Inc, Cary, NC).
34
RESULTS
CONFRIMATION OF BACTERIAL CULTURES:
Growth on the Sorbitol MacConkey agar plates indicated a positive result
(colorless colony growth) for the presence of E. coli O157:H7. Results for the RIM E.
coli latex agglutination test resulted in positive agglutinations for the presence of the
O157 antigen, and the H7 antigen. Growth on the XLD agar plates indicated a positive
result (black colonies indicating H2S production) for the presence of Salmonella. Results
for the Salmonella Latex Tests showed a positive agglutination for the presence of
Salmonella. Results for the API 20E test was positive for the presence of Salmonella
enterica species. Growth on the Modified Oxford agar plates indicated a positive result
(media became black with colony growth) for the presence of Listeria monocytogenes.
Results for the API Listeria test showed the presences of Listeria monocytogenes as well.
GROWTH IN CW:
Throughout the experiment, the negative control plates (undiluted CW plated on
TSB) had no apparent bacterial growth. The pH of the coconut water ranged from 5.5 to
6.1.
The starting populations of E. coli O157:H7, S. Typhimurium and L.
monocytogenes in CW were between 2.1 and 2.2-log10 CFU/ml, and the starting
populations in TSB were 2.4, 2.3 and 2.1-log10 CFU/ml, respectively. After 12 hours, the
populations of E. coli O157:H7 and S. Typhimurium in CW were significantly less than
the population in the TSB (p ≤ 0.01), and remained significantly less than the population
in TSB after 24 hours (p ≤ 0.01;Figures 1,2).
35
L. monocytogenes had a growth curve that showed a lower bacterial count at the
early hours of growth in CW, but after 12 hours, the population of L. monocytogenes in
CW was not significantly different than the population in TSB (p= 0.065). However,
after the full 24 hours of growth, the Listeria monocytogenes population in CW was
significantly less than the growth in TSB (p= 0.045) (Figure 3). After 12 hours of growth
in CW, the population of L.monocytogenes was significantly less than the populations of
E. coli and S. Typhimurium (p ≤ 0.01), but was not significantly different after 24 hours
of growth (p=0.60; Figures 1,2,3).
Significantly higher populations in E. coli, S. Typhimurium, and L. monocytogenes were
all recovered in the nutrient broths of TSB or TSBYE after 24 hours. The highest
population growth in both CW and TSB after 24 hours was reached by E. coli O157:H7.
36
DISCUSSION
Untreated coconut water was a good medium for L. monocytogenes, S.
Typhimurium, and E. coli O157:H7 to grow in. Various constituents such as proteins,
lipids, carbohydrates and a pH of over 5.5 make CW an acceptable medium for bacteria
to grow (Narataruksa et al., 2010). This was not unexpected because CW is used as an
ingredient in growth media for plant tissue cultures (Yong et al., 2009). The abundance
of vitamins and minerals was expected help growth of bacteria as well (Narataruksa et
al., 2010; Yong et al., 2009). The final 24 hour populations of all three species in CW
were significantly less than the same species in TSB, but still high (> 108 CFU/ml after
24 hours).
L. monocytogenes had a greater initial lag time in the first four hours of growth
when compared to E. coli and S. Typhimurium in both media (TSBYE and CW). L.
monocytogenes is a psychrotrophic bacterium (Ray and Bhunia, 2008). After 12 hours,
the growth of the L. monocytogenes was still significantly less than the other two
cultures’ bacterial load. After a full 24 hours of growth, all three species had reached
their stationary phase in growth.
The pH of the coconut water ranged from 5.5 to 6.1. These conditions are above
the range all three bacteria are able to grow well in (> pH 4.5). The shell around the
coconuts may be one reason that there have been no foodborne outbreaks linked to
coconuts (Mandal et al., 2009; Jackson et al., 2004). The sheer thickness of the shell
makes it extremely unlikely for bacteria just to penetrate into the coconut. Recent
discoveries into antifungal properties of the coconut fibers (Wang and Ng, 2005) and
antimicrobial peptides in the coconut pulp against human pathogens (Mandal et al., 2009)
37
may help explain why no outbreaks have occurred. The inside of the coconut is filled
with vitamins, minerals, carbohydrates, and proteins, which make the coconut an
excellent growth source for bacteria, but the thick outer shell may help prevent
internalization.
Coconut water is a fast-growing commodity on the consumer market (Burkitt,
2009). This study shows CW has the ability to become a dangerous vehicle for outbreak
if it is handled improperly or exposed to pathogens at the wrong time. Because of its
vulnerability to host foodborne pathogens, the FDA’s regulations for a mandatory 5-log10
CFU/ml reduction for juices are necessary for the production of CW.
38
REFERENCES
Burkitt, L. (2009). Coconut Water: A Hard Nut to Crack. In, vol. 2013): Forbes. Available at: http://www.forbes.com/2009/06/04/vita-coco-zico-one-leadership-cmo-network-coconutwater.html. Accessed 21 January 2013
Jackson, J. C., Gordon, A., Wizzard, G., McCook, K., & Rolle, R. (2004). Changes in chemical composition of coconut (Cocos nucifera) water during maturation of the fruit. Journal of Science & Food Agriculture, 84, 1049-1052.
Mandal, S. M., Dey, S., Mandal, M., Sarkar, S., Maria-Neto, S., & Franco, O. (2009). Identification and structural insights of three novel antimicrobial peptides isolated from green coconut water. Peptides, 30, 633-637.
Narataruksa, P., Pichitvittayakarn, W., Heggs, P. J., & Tia, S. (2010). Fouling behavior of coconut milk at pasteurization temperatures. Applied Thermal Engineering, 30(11-12), 1387-1395.
Prades, A., Dornier, M., Diop, N., & Pain, J.-P. (2012). Coconut water uses, composition and properties: a review. Fruits, 67(2), 87-107.
Rawson, A., Patras, A., Tiwari, B. K., Noci, F., Koutchma, T., & Brunton, N. (2011). Effect of thermal and non thermal processing technologies on the bioactive content of exotic fruits and their products: Review of recent advances. Food Research International, 44, 1875-1887.
Ray, B. & Bhunia, A. (2008). Fundamental Food Microbiology. Fourth Edition. Taylor & Francis Group, LLC. Boca Raton, FL.
Vojdani, J. D., Beuchat, L. R., & Tauxe, R. V. (2007). Juice-Associated Outbreaks of Human Illness in the United States, 1995 through 2005. Journal of Food Protection, 71(2), 356-364.
Walter, E. H. M., Kabuki, D. Y., Esper, L. M. R., Sant’Ana, A. S., & Kuaye, A. Y. (2009).
Modelling the growth of Listeria monocytogenes in fresh green coconut (Cocos nucifera L.) water. Food Microbiology, 26, 653-657.
Wang, H. X. & Ng, T. B. (2005). An antifungal peptide from the coconut. Peptides, 26, 2392-2396.
Yong, J. W. H., Ge, L., Ng, Y. F., & Tan, S. N. (2009). The Chemical Composition and
Biological Properties of Coconut (Cocos nucifera L.) Water. Molecules, 14, 5144-5164.
39
Figure 1. Growth E. coli O157:H7 in Coconut Water and Tryptic Soy Broth for 24 hours at 37°C.
1
10
100
1000
10000
100000
1000000
10000000
100000000
1E+09
1E+10
0 3 4 5 6 7 8 12 24
Growth (CFU/m
l)
Time (Hour)
CW
TSB
40
Figure 2. Growth of Salmonella enterica Typhimurium in Coconut Water and Tryptic Soy Broth for 24 hours at 37°C.
10
100
1000
10000
100000
1000000
10000000
100000000
1E+09
1E+10
0 3 4 5 6 7 8 12 24
Growth (CFU/m
l)
Time (Hours)
CW
TSB
41
Figure 3. Growth curve of Listeria monocytogenes in Coconut Water and Tryptic Soy Broth with 0.6% Yeast Extract for 24 hours at 37°C.
10
100
1000
10000
100000
1000000
10000000
100000000
1E+09
0 3 4 5 6 7 8 12 24
Growth (CFU/m
l)
Time (Hours)
CW
TSBYE
42
High Hydrostatic Pressure Processing Reduces
Foodborne Pathogens in Coconut Water
43
ABSTRACT
Juices have been implicated in numerous foodborne outbreaks over the last
several decades. Coconut water (CW) is a juice that is gaining popularity in the United
States, and while it has not been implicated in foodborne outbreaks, it contains nutrients,
minerals, and has conditions (pH of 4.2-6 and high Aw) that could support bacterial
growth. CW is classified as a juice and must receive a process verified to achieve a 5-
log10 CFU/ml reduction in foodborne pathogens. Thermal processing is the most common
method for achieving this 5-log10 CFU/ml reduction; however, this method changes
flavors, nutrient contents and colors of CW. This study examines the ability of high
pressure processing to reduce bacterial populations of E. coli O157:H7, Salmonella
Typhimurium, and Listeria monocytogenes in CW after treatments of 400, 500, and 600
MPa for 120 seconds at 4°C. Untreated and treated samples were enumerated on Tryptic
Soy Agar (L. monocytogenes on agar supplemented with 0.6% yeast extract).
Uninoculated samples of CW were tested for D-glucose, D-fructose, sucrose, and phenol
oxidase levels before and after treatments. All three pathogens were reduced over 6-log10
CFU/ml after treatments of 500 and 600 MPa. There were no significant changes in D-
glucose, D-fructose, sucrose, and phenol oxidase after any treatments. The study
confirmed that the treatments of 500 and 600 MPa for 120 seconds was enough to reach
the FDA’s mandatory 5-log10 CFU/ml reduction in these pathogens. However, the failure
of HPP to reduce phenol oxidase could shorten shelf life of the product.
44
INTRODUCTION
Numerous outbreaks have been associated with juices over the last several
decades. Between 1995 and 2005, 21 outbreaks in the U.S. were linked to juices
(Vojdani et al., 2008). Some of these outbreaks were caused by Escherichia coli
O157:H7, Salmonella enterica spp., and Listeria monocytogenes (Vojdani et al., 2008).
Juice processors must follow the Juice HACCP rule and fresh juice must be processed
using a method to achieve a 5-log10 CFU/ml reduction in the pertinent pathogen for each
specific juice (FDA, 2001). This 5-log10 reduction is typically achieved using thermal
processing (FDA, 2001; Rawson et al., 2011). Coconut water (CW), a new product
gaining popularity, is classified as a juice and typically receives a thermal process prior to
sale (Damar et al., 2009).
However, many problems arise from the thermal processing. These problems
include sensory degredation and the loss of nutrients (Wolbang et al., 2008). The most
well known problem with thermal processing is that is causes the loss of ascorbic acid
and changes color in many products (Ma et al., 2010; Patterson et al., 2012). When the
consumer demands a product that tastes similar to the fresh product, an alternative
method must be used if thermal processing is causing negative sensory changes. One of
these alternative processing methods being used more and more in the market is High
Pressure Processing (HPP) (Patterson, 2005). High pressure processing uses isostatic
pressure to reduce or eliminate pathogens that could cause an outbreak in the product
(Patterson, 2005). This method uses between 100-800 MPa of pressure, typically at
temperatures below 40°C. The exposure of the food to the pressure can last anywhere
from a few seconds up to 20 minutes (Rawson et al., 2011). This process should reduce
45
the pathogens without causing the detrimental effects on nutrient or sensorial content that
thermal processing does (Oey et al., 2008).
The objectives of this experiment was to determine whether HPP would
significantly reduce E. coli O157:H7, S. Typhimurium and L. monocytogenes in CW and
ultimately to determine whether the process successfully achieves the 5-log10 CFU/ml
reduction as required by the FDA (FDA, 2001). Additionally, the effect of HPP on
nutrient levels (D-glucose, D-fructose, sucrose, and phenol oxidase) in the CW was
evaluated.
46
MATERIALS AND METHODS
INOCULUM PREPARATION
Escherichia coli O157:H7 Cider (strain isolated from cider outbreak and obtained
from Dr. Larry Beuchat, University of Georgia) Salmonella Typhimurium (ATCC
14028), and Listeria monocytogenes Scott A (strain isolated from milk outbreak and
obtained from Dr. Larry Beuchat, University of Georgia) were used in this experiment.
Cultures were stored at -80°C in a 20% Glycerol solution until use. To activate, cultures
were obtained from -80°C storage and transferred to 10mL Tryptic Soy Broth (TSB;
Difco, Detroit, MI), or 10ml TSB with a 0.6% Yeast Extract (L. monocytogenes ;
TSBYE; Difco, Detroit, MI) and incubated for 24h at 37°C. Following incubation, one
loopful of each culture was transferred to new 10ml TSB and TSBYE and successive
transfers were done twice more.
Activated cultures of each pathogen, E. coli, S. Typhimurium and L.
monocytogenes were streaked onto selective media: Sorbitol MacConkey Agar (SMAC),
Xylose lysine deoxycholate agar XLD Agar, and Modified Oxford Agar (MOX),
respectively (all from Difco, Detroit, MI). Presumptively positive colonies from each
medium were then confirmed using biochemical testing. Colonies from the MOX plates
were then used for an API Listeria Test Kit (bioMérieux, Inc., Durham, NC). Colonies
from SMAC and XLD plates were used for an API 20E Test Kit (bioMérieux, Inc.,
Durham, NC). Colonies from SMAC and XLD were also used for a RIM E. coli
O157:H7 Latex Agglutination Kit (Remel, Lanexa, KS) and Salmonella Latex Test
(Oxoid Ltd, Hants, UK), respectively. Following confirmation procedures, cultures were
kept stored at 4°C prior to each experiment.
47
COCONUT WATER PREPARATION
Coconuts (Florida Coconuts, Davie, FL) were freshly picked and shipped to
Virginia. They were stored at 4°C for no more than two weeks before use. The coconuts
were sprayed with a 70% w/v aqueous ethanol solution until completely covered by the
ethanol in a biological safety cabinet (Type A/B3, NuAire, Plymouth, MN) and allowed
to dry for two minutes. A hole was bored into the center of the stem scar of the coconut
with a sterile metal coconut opener (Florida Coconuts, Davie, FL). The CW was drained
into a sterile beaker and poured into a Stericup® 0.45 µm 250ml filter unit (EMD
Millipore, Darmstadt, Germany) and vacuum filtered. Portions (99ml) of CW were then
pipetted into 12 sterilized glass 100 ml dilution bottles each and stored no longer than an
hour until use.
HIGH PRESSURE MICROBRIAL PREPARATION
Activated, 24h cultures of each pathogen were centrifuged at 6000 rpm for 10
minutes. The supernatant was discarded and cells were resuspended in 10ml of sterile
peptone water (SPW). Cells were washed twice more and finally resuspended in SPW.
One ml of each culture was added to three different sterile flasks, to result in each flask
containing 99 ml of sterile CW. At the start of each replication, three flasks contained
approximately 7-log10 CFU/ml of E. coli O157:H7, S. Typhimurium, and L.
monocytogenes inoculum respectively (9 flasks); and three were uninoculated (total = 12
flasks). From each flask, 20 ml was pipetted into three separate 5”X7” Prime Source® 4-
Mil Vacuum Pouches (Prime Source International LLC, Westerville, OH) (n=9). Three
extra bags were filled (one for each bacteria) from one of their respective flasks. All 39
bags were vacuum sealed with a 70-mbar vacuum (Multivac, model A300/16, Kansas
48
City, MO), and then double bagged with another 5”X7” Prime Source® 4-Mil Vacuum
Pouches. Then double-bagged samples were placed in a third, 8”x12” vacuum pouch
containing ~2ml of quaternary ammonium compound.
HIGH PRESSURE TREATMENT
The three bags from each flask/bacterium combination (27 bags) were treated at
400, 500 or 600 MPa for 120 seconds in a 35L pressure chamber (Quintus QFP 35L-600,
Flow International, Kent, WA). Three of the nine bags for each bacterium were treated
at 400 MPa, three at 500 MPa, and three at 600 MPa. Uninoculated bags were plated
without being treated at any press. The three bags inoculated, but not treated, were
opened and plated for original counts to serve as a positive control, and the uninoculated
bags were plated and counted to serve as a negative control. All samples were kept on
ice before and after treatment for no longer than one hour. This process was run in
triplicate, on separate days, with separate coconuts (n=9).
Microbiological analysis:
All treated and untreated bags were opened and serially diluted in SPW. Some of
the bags were plated without dilution by pipetting 0.25ml on four plates to get a 100
dilution. Each bag was plated in duplicate on TSA/TSAYE and plates, incubated in 37°C
for 24 hours and then counted. Plates within the range of 25-250 colonies per plate were
counted.
PHENOL OXIDASE TESTING
To assess CW enzymes, bags were filled with uninoculated CW similar to the
filling process used for microbiological experiments and triple bagged. Bags were
treated with either 400, 500, or 600 MPa for 120 seconds. The bags were opened and
49
0.6ml from each bag was placed into three wells each on a 96 well plate. 0.4ml of a
0.03M catechol solution (Sigma-Aldrich, St. Louis, MO) was added to the wells and the
absorbance was read on an Epoch Microplate Spectrophotometer (BioTek, Winooski,
VT) every minute for eight minutes at 480nm. This process was done in triplicate.
CARBOHYDRATE TESTING
Bags were filled with uninoculated CW similar to the filling process used for
microbiological experiments. The bags were filled and triple bagged in the same process.
Bags were treated with either 400, 500, or 600 MPa for 120 seconds. All samples were
then tested in the sucrose/D-glucose/D-fructose test kit (R-biopharm AG, Darmstadt,
Germany). Samples, in triplicate, from each of the bags were put into one well each.
First, .20 ml of solution 1 was added to each well and incubated at 37°C for 5 minutes.
Then, 1 ml of solution 2 was added to each well and allowed to sit for three minutes at
room temperature. Readings were taken at this time. Next 0.020 ml of solution 3 was
added to each well and allowed to sit for 10 minutes at room temperature. The second
readings were taken at this time. Finally 0.020 ml of solution 4 was added to each well
and allowed to sit for 10 minutes. The third readings were taken at this time. Readings
were taken with the Epoch Microplate Spectrophotometer at 340 nm.
STATISTICAL ANALYSIS
All log reductions from the HPP treatments were recorded and plotted on
Microsoft Office Excel 2008 (Microsoft, Redmond, WA). Significant differences were
analyzed with ANOVAs and means were separated using Tukey-Kramer HSD method on
JMP Pro 10 (SAS Institute Inc, Cary, NC). All phenol oxidase test results and
50
carbohydrate test kit results were analyzed with ANOVA and means were separated
using Tukey-Kramer HSD method on JMP Pro 10.
51
RESULTS
All plates from uninoculated bags had no growth. The plates from inoculated but
untreated plates resulted in counts of 1.84*107, 1.29*107, and 1.79*107 CFU/ml for E.
coli, S. Typhimurium and L. monocytogenes, respectively. The results of the high
pressure treatments revealed that there were significant differences in log reduction of L.
monocytogenes (p= 0.006), S. Typhimurium (p= 0.004), and E. coli O157:H7 (p= 0.01)
between 400 MPa and 500 MPa for 120s (Figure 1).
The L. monocytogenes treated with 400 MPa had the lowest reduction in bacterial
population (3.2-log10 CFU/ml). There was a significantly greater reduction in all
pathogens when processed at pressures 500 and 600 MPa compared to 400 MPa (p<
0.001; Figure 1). All pathogens tested had at least a 6.1-log10 CFU/ml reduction in the
500 and 600 MPa for 120-second treatments. There were no significant differences (α =
0.05) between E. coli, S. Typhimurium, and L. monocytogenes’ log reduction value with
D-Glucose levels in untreated, 400 MPa, 500 MPa, and 600 MPa for 120s were
not significantly different (P=0.49) (Figure 2). D-Fructose levels in untreated, 400 MPa,
500 MPa, and 600 MPa for 120s were not significantly different (P=0.051) (Figure 3).
Sucrose levels in untreated, 400 MPa, 500 MPa, and 600 MPa for 120s were not
significantly different (p=0.32) (Figure 4). None of the major sugars found in CW had
significant differences between any of the pressure treatments compared to the untreated
CW.
Phenol oxidase levels untreated, 400 MPa, 500 MPa, and 600 MPa for 120s were
not significantly different (p=0.38) (Figure 5).
52
DISCUSSION
The 400 MPa treatments had the lowest log reduction, and the 500 MPa and the
600 MPa treatments had roughly the same log reduction for all of the bacteria. Different
pressures can have different effects on the same species of bacteria. This difference in
reduction between pressures has been found in other studies (Keenan et al., 2012;
Rawson et al., 2011). The higher log reductions, with the higher pressures was seen in
experiments by Jordan et al. (2001) as well. Most of the 500 MPa and 600 MPa
treatments made the bacterial populations starting at a level of 7-log10 CFU/ml fall below
the detectable limit. No visible changes were seen with the color of the CW following
any of the treatments.
The FDA juice guidelines state that a 5-log10 CFU/ml reduction must be achieved
for a process to be approved (FDA, 2001). This means that none of the treatments at 400
MPa for 120s would be approved for treatment of CW. Both 500 MPa and 600 MPa for
120s achieved at least 6-log10 CFU/ml reductions for all bacterial species tested. These
processes would pass under the FDA juice production guidelines. Not all of the
pathogens had the same reductions. This is because bacteria have different levels of
resistance to pressure (Doyle and Beuchat, 2007). This experiment suggests that this
strain of Listeria is more resistant to high pressure than the serovars of S. Typhimuruim
and E. coli O157:H7 used in this experiment because it saw the lowest reduction in
bacterial load. This follows the trend that Gram-positive bacteria tend to be more
piezotolerant than Gram-negative bacteria (Michiels et al., 2008).
D-glucose, D-fructose, and sucrose levels found in the original CW did not
change after any of the pressure treatments. Since HPP is not known to affect covalent
53
bonds, like glycosidic bonds (Patterson, 2005), it does not affect carbohydrate structure
or function. If the structure or functions were uninterrupted, the levels of carbohydrates
were not expected to differ. This was consistent in these experiments.
Phenol oxidase (PPO) levels in the CW did not significantly change after any of
the treatments with the high pressure. Normally, this would be an undesired effect
because the PPO enzyme causes browning within the coconut, as well as many other
fruits (Weemaes et al., 1998). Most juice processing is done to alter or destroy these
enzymes and prevent them from causing browning within the juice (Murasaki-Aliberti et
al., 2009). The untreated CW did not contain much of this enzyme to begin with. This
could be because as the coconut matures, there is a higher level of total solids (Jackson et
al., 2004). These total solids include ions and proteins. Since PPO is an enzyme, this
could be when the PPO levels rise significantly. Since the coconuts used were not turbid,
the total solids could have still been extremely low. The coconuts were less than nine
months old, which is when turbidity is still supposed to be low (Jackson et al., 2004).
Overall, HPP is an appropriate method for achieving the mandatory 5-log10
reduction required by the FDA. Since different juices require different pressures to
achieve this 5-log10 CFU/ml reduction, research is needed for each juice and its changes
in formula. When deciding between two pressures to use, the higher pressure would
always be recommended. No further damage of flavor, tastes, or colors happens at a
higher pressure (Keenan et al., 2012), but there seems to be a higher reduction in both
pathogens and activity of enzymes (Gomes and Ledward, 1996). Another reduction
method, (such as acidification or a minimal thermal treatment) along with HPP, is
recommended if producer is trying to achieve an extended shelf life of CW.
54
FUTURE DIRECTIONS
For future research, there needs to be more testing in between the large gaps of
pressures. There needs to be a test of 425, 450, and 475 MPa when trying to achieve the
desired log reduction. This will save time and money if the machine can do the same log
reductions and not have to get all the way up to 500 MPa and just use 450 MPa. More
time selections need to be tested. This study focused on changing the pressures. Could a
producer use 600 MPa for only 60s and still get a 5-log10 CFU/ml reduction? There
needs to be more studies about these varying pressures and times along with some added
antimicrobials, slight heat, or changes in pH. More tests need to be done with some other
families of bacteria. There could be tests done on Staphylococcus or Camphylobacter
species. More juices need to be tested as well to see if these log reductions are seen with
just CW or if they generally work for most juices. Testing should also be considered for
viruses like Hepatitis A. There is a lot of research to be done in HPP, and benefits could
be had for both the producers and the consumers when it comes to new HPP products
coming out on the market.
55
REFERENCES
Gomes, M. R. A. & Ledward, D. A. (1996). Effect of high-pressure treatment on the activity of some polyphenoloxidases. Food Chemistry, 56, 1-5.
Jackson, J. C., Gordon, A., Wizzard, G., McCook, K., & Rolle, R. (2004). Changes in chemical composition of coconut (Cocos nucifera) water during maturation of the fruit. Journal of Science Food Agriculture, 84, 1049-1052.
Keenan, D. F., Rößle, C., Gormley, R., Butler, F., & Brunton, N. P. (2012). Effect of high hydrostatic pressure and thermal processing on the nutritional quality and enzyme activity of fruit smoothies. Food Science and Technology, 45, 50-57.
on Enzyme, Microorganism and Flavor in Cantaloupe (Cucumis Melo L.) Juice. Journal of Food Process Engineering, 33(3), 540-553.
Michiels, C., Bartlett, D. H., & Aertsen, A. (2008). High-Pressure Microbiology. ASM Press.
Washington, DC. Murasaki-Aliberti, N. C., Silva, R. M. S., Gut, J. A. W., & Tadini, C. C. (2009). Thermal
inactivation of polyphenoloxidase and peroxidase in green coconut (Cocos nucifera) water. International Journal of Food Science and Technology, 44, 2662-2668.
Oey, I., Lille, M., Van Loey, A., & Hendrickx, M. (2008). Effect of high-pressure processing on colour, texture and flavour of fruit- and vegetable-based food products: a review. Trends in Food Science & Technology, 19(6), 320-328.
Patterson, M. F. (2005). Microbiology of pressure-treated foods. Journal of Applied Microbiology, 98(6), 1400-1409.
Patterson, M. F., McKay, A. M., Connolly, M., & Linton, M. (2012). The effect of high hydrostatic pressure on the microbiological quality and safety of carrot juice during refrigerated storage. Food Microbiology, 30(1), 205-212.
Rawson, A., Patras, A., Tiwari, B. K., Noci, F., Koutchma, T., & Brunton, N. (2011). Effect of thermal and non thermal processing technologies on the bioactive content of exotic fruits and their products: Review of recent advances. Food Research International, 44, 1875-1887.
U.S. Food and Drug Administration. 2001. Hazard Analysis and Critical Control Point
(HACCP); Procedures For the Safe and Sanitary Processing and Importing of Juice. Federal Registry. 66: 6137– 6202.
56
Vojdani, J. D., Beuchat, L. R., & Tauxe, R. V. (2007). Juice-Associated Outbreaks of Human Illness in the United States, 1995 through 2005. Journal of Food Protection, 71(2), 356-364.
Weemaes, C. A., Ludikhuyze, L. R., Van den Broeck, I., Hendrick, M. E., & Tobback, P. P. (1998). Activity, Electrophoretic Characteristics and Heat Inactivation of Polyphenoloxidases from Apples, Avocados, Grapes, Pears and Plums. Lebensmittel-Wissenschaft und -Technologie, 31(1), 44-49.
Wolbang, C. M., Fitos, J. L., & Treeby, M. T. (2008). The effect of high pressure processing on nutritional value and quality attributes of Cucumis melo L. Innovative Food Science & Emerging Technologies, 9(2), 196-200.
57
Figure 1. Average log10 reduction of E. coli O157:H7 Cider, Salmonella Typhimurium, and Listeria monocytogenes in Coconut Water at 400, 500, and 600 MPa for 120 seconds at starting temperature of 4°C.
0
1
2
3
4
5
6
7
400 500 600
Log10 Reduction
Pressure Applied (MPa)
E. coli
S. Typhimurium
L. monocytogenes
BA A C C C C C C
58
Figure 2. Level of D-‐glucose in untreated Coconut Water and after High Pressure treatments of 400, 500, and 600 MPa for 120 seconds starting at 4°C.
0.00
0.10
0.20
0.30
0.40
0.50
0.60
0.70
0.80
0.90
1.00
Amount of Glucose (g/L)
Pressure (MPa)
400
500
600
Untreated
59
Figure 3. Level of D-‐fructose in untreated Coconut Water and after High Pressure treatments of 400, 500, and 600 MPa for 120 seconds starting at 4°C.
0.00
5.00
10.00
15.00
20.00
25.00
Amount of Fructose (g/L)
Pressure (MPa)
400
500
600
Untreated
60
Figure 4. Level of Sucrose in untreated Coconut Water and after High Pressure treatments of 400, 500, and 600 MPa for 120 seconds starting at 4°C.
0.00
10.00
20.00
30.00
40.00
50.00
60.00
Amount of Sucrose (g/L)
Pressure (MPa)
400
500
600
Untreated
61
Figure 5. Change in phenol oxidase levels in Coconut water after treatments of 400, 500, or 600 MPa or untreated. Absorbancies were read at 480nm. *UNTRD is Untreated Sample
-‐0.0010
-‐0.0005
0.0000
0.0005
0.0010
UNTRD 400 500 600
Change in Absorbance
Treatment (MPa)
PPO
62
APPENDIX A: BIOSCREEN
Initially, preliminary studies were done using the Bioscreen to evaluate the
growth of each pathogen (E. coli O157:H7, S. Typhimurium and L. monocytogenes) in
coconut water (CW). This experiment was done to see at which hours the bacteria
species began to grow, which hour they began their log-phase of growth, and when they
reached their stationary phase. These time frames were also used to estimate the hours at
which the researcher would take plating samples for the growth curve done by hand. The
data obtained from the Bioscreen was not quantitative, unlike the growth curve done by
hand, which was desired for the results section.
BIOSCREEN METHODS
Two 10 ml test tubes of each 24h culture were spun at 6000 rpm for 10 minutes.
Supernatant was discarded and cells were re-suspended in 10 ml of sterile peptone water
(SPW). Cells were washed twice more and finally re-suspended in SPW. The cultures
were then serially diluted in SPW. The final serial dilution was completed with either
CW or TSB/TSBYE to achieve a final inoculum level of approximately 2-log10 CFU/ml.
A portion (200µl) of each culture/broth combination was pipeted into 10 honeycomb
wells each. Thirty wells (10 each) were filled with uninocluated TSB, TSBYE, or CW.
The honeycomb plate was inserted into a Bioscreen Growth Curve Machine (Growth
Curves USA, Piscattaway, NJ) for 24h at 37°C. The optical density was taken every 15
minutes using the wideband spectrum (450-580 nm). This process was run in duplicate
(n= 20).
63
The Bioscreen tests were run to gather preliminary data in order to get an
estimation of how to design the growth curve experiments. The data from the Bioscreen
runs helped gather an understanding of what hours the data needed to be gathered at for


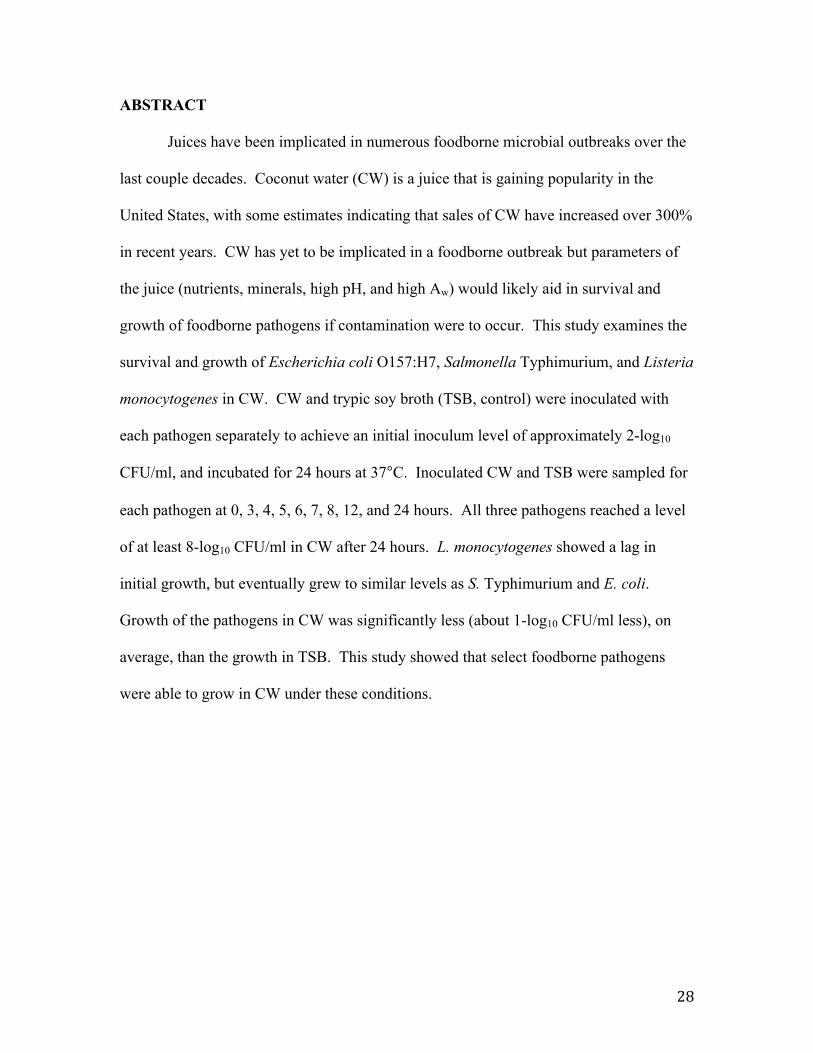
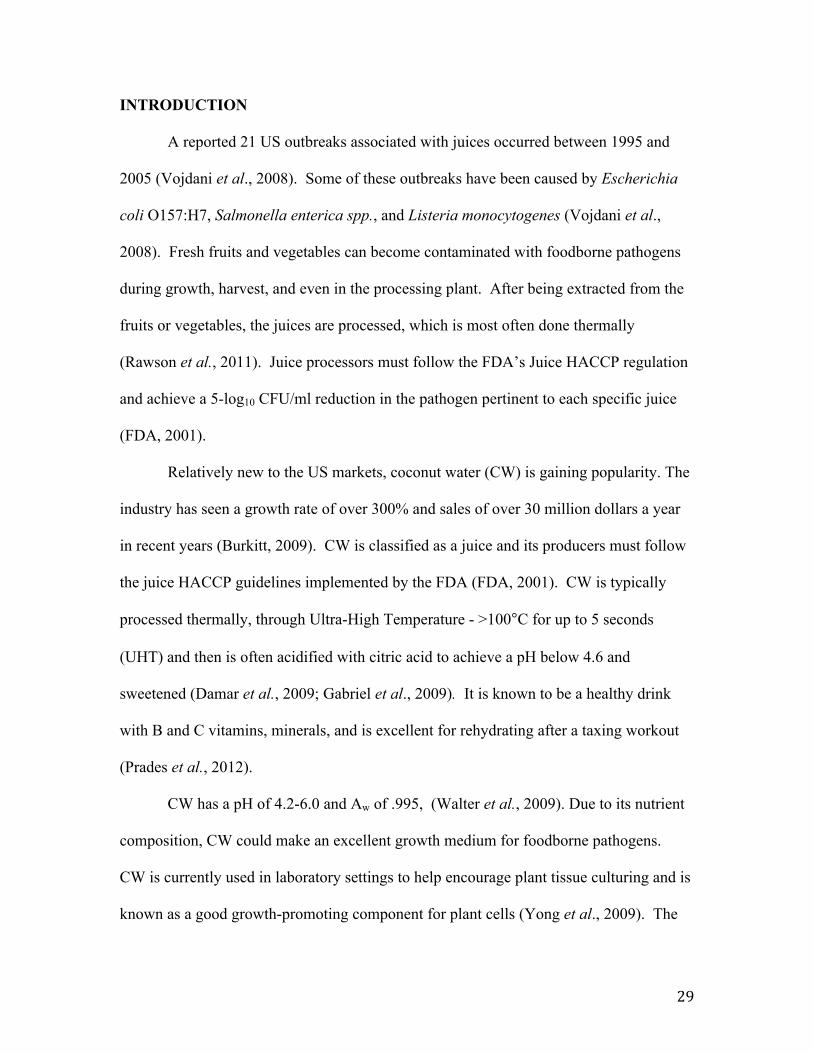
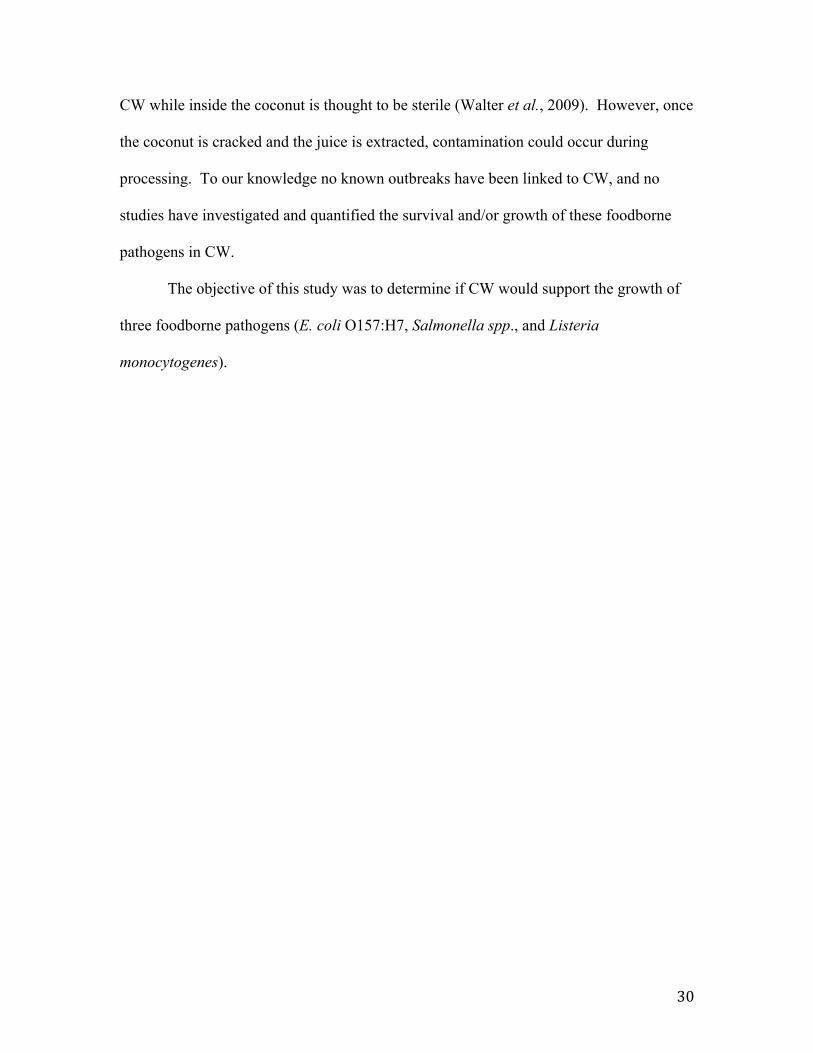


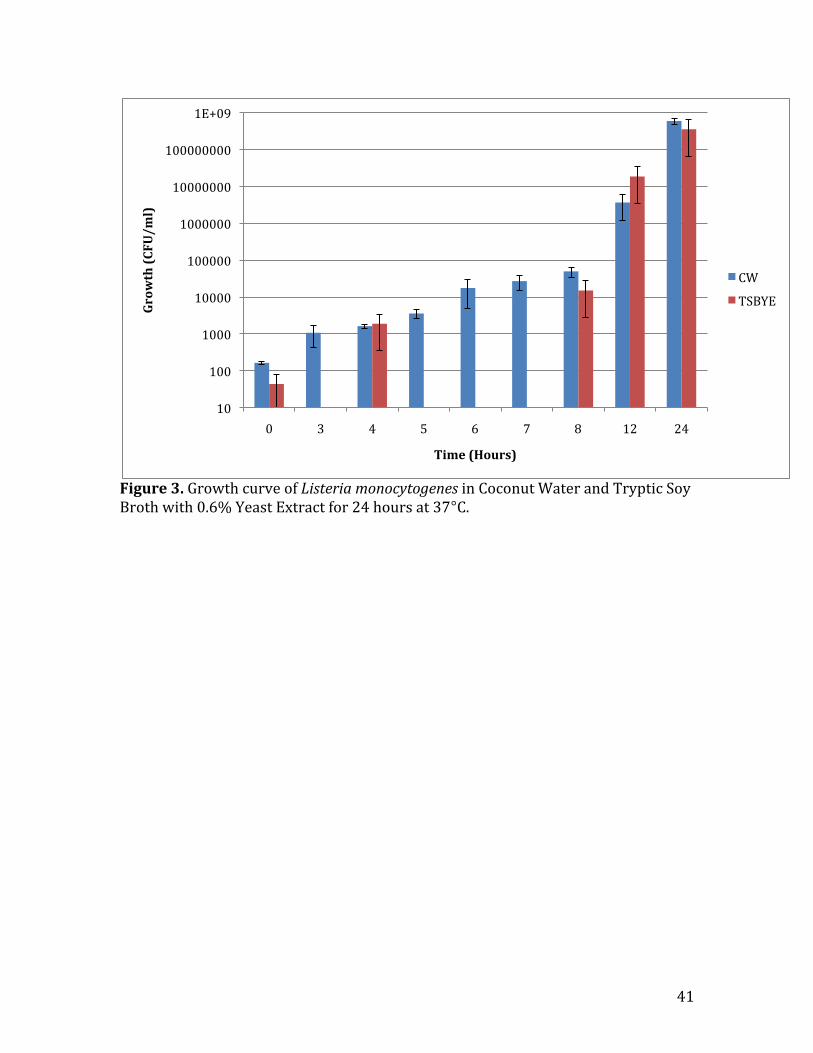


![APPLICATION OF BACTERIOCINS IN THE PRESERVATION OF FRUIT JUICE · [Clementine:Valencia (1:1)], followed by inoculation into RTD juice (mango-orange), including a HACCP plan for the](https://static.documents.pub/doc/80x56/5b20991d7f8b9afa388b461e/application-of-bacteriocins-in-the-preservation-of-fruit-juice-clementinevalencia.jpg)


