Page 1
Use of Ozone for DisinfectionUse of Ozone for Disinfectionand EDC Removal at CCWRDand EDC Removal at CCWRD
Doug Drury, Ph.D.Doug Drury, Ph.D.Deputy General ManagerDeputy General Manager
Clark County Water Reclamation DistrictClark County Water Reclamation District
Shane Snyder, Ph.D.Shane Snyder, Ph.D.R&D Project ManagerR&D Project Manager
Southern Nevada Water AuthoritySouthern Nevada Water Authority
Page 2
ObjectivesObjectives• Expansion of current facility
– 110 to 150 MGD
– opportune time to utilize state of the art technology
• Investigate ozone for disinfection and emerging contaminant removal
• Use bench-scale evaluations for initial feasibility
• Engineering analysis to estimate capital and O&M costs
– compare UV and ozone disinfection
Page 3
Why Ozone?Why Ozone?• Powerful disinfectant
• No residual (compared to chlorine)
• Stronger oxidant (compared chlorine/UV)
• Three ozone plants in Southern Nevada
– AMS 600 MGD drinking water
– River Mountains 300 MGD drinking water
– Big Bend (Laughlin) 20 MGD drinking water
• Ozone proven technology for disinfection & contaminant removal
Page 4
SNWA Treatment StudiesSNWA Treatment Studies
Page 5
Emerging ContaminantsEmerging Contaminants• 1994: Britain discovers fish below WWTP outfalls
with symptoms of exposure to estrogenic compounds
• 1996: USGS reports similar findings in carp from the Las Vegas Bay, Lake Mead
• 1996: EPA reports endocrine disruption in fish from Minnesota near WWTPs
• 1996: Amendment to SDWA mandates EPA develop a screening program for EDCs
• 1997: SNWA initiates monitoring and fish studies for EDCs
Page 7
SNWA EDC ResearchSNWA EDC Research• 1997: Initial screening of LV Wash & Lake
– Estrogen compounds detected in Wash & Bay
– No estrogens detected in drinking water
– First detection of pharmaceuticals
• 1998: Fish caged in Lake Mead
– Subtle differences in fish from LV Bay, but not dramatic as seen in USGS studies
• 2000: DOD funded study of fish
– Small differences among LV Bay & Overton
– Perchlorate not related to EDC effects in fish
• 2003-Current: Monitoring of Lake Mead
Page 8
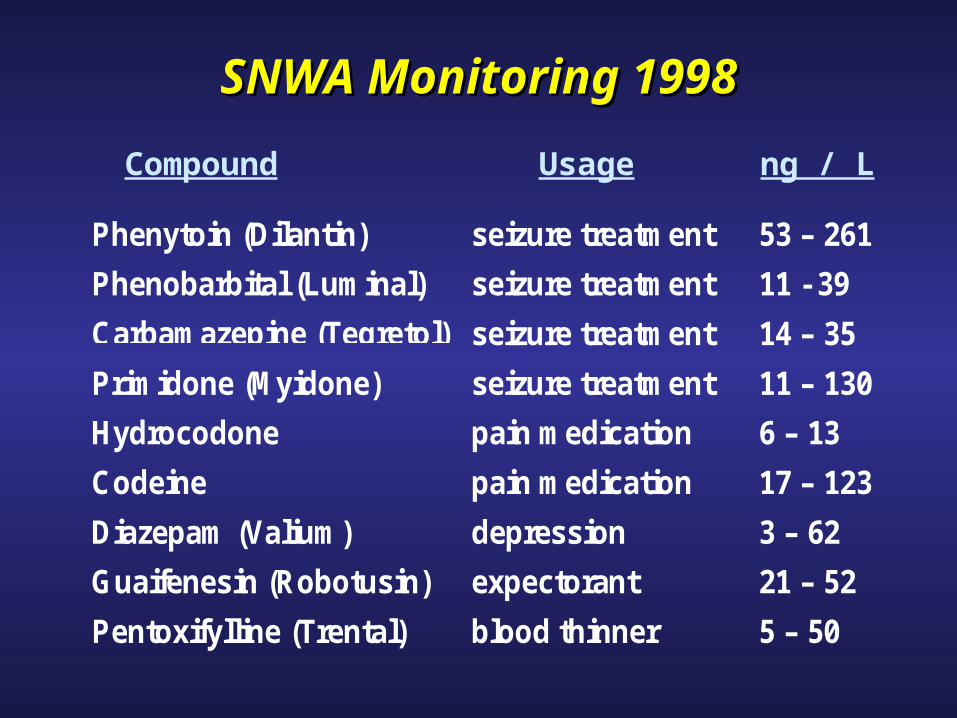
SNWA Monitoring 1998SNWA Monitoring 1998
Phenytoin (Dilantin) seizure treatment 53 – 261
Phenobarbital (Luminal) seizure treatment 11 - 39
Carbamazepine (Tegretol) seizure treatment 14 – 35
Primidone (Myidone) seizure treatment 11 – 130
Hydrocodone pain medication 6 – 13
Codeine pain medication 17 – 123
Diazepam (Valium) depression 3 – 62
Guaifenesin (Robotusin) expectorant 21 – 52
Pentoxifylline (Trental) blood thinner 5 – 50
Compound Usage ng / L
Page 9
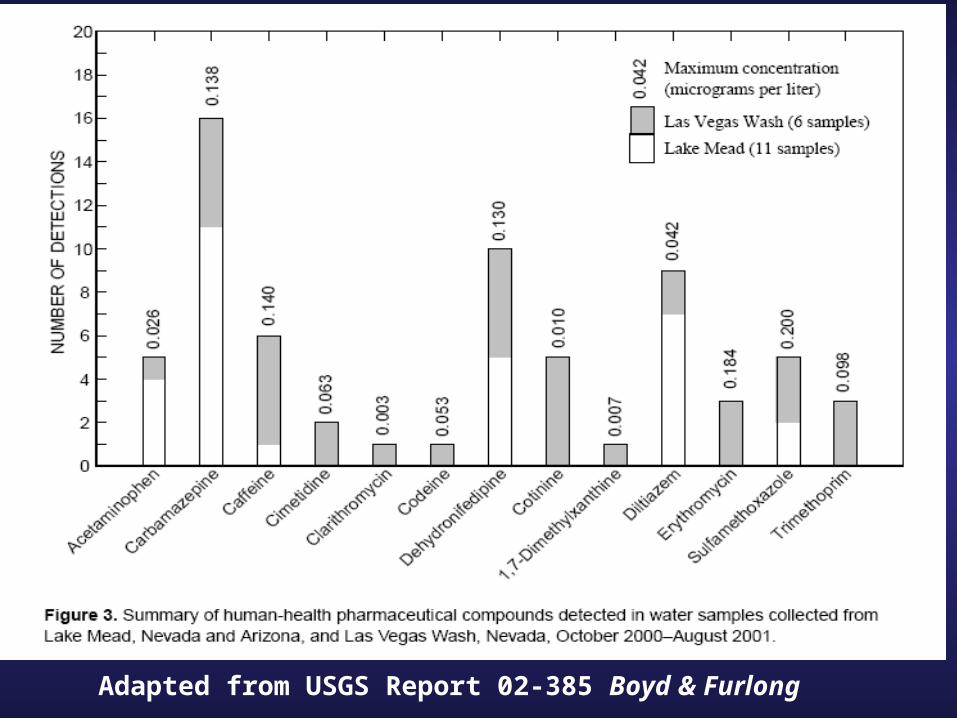
Adapted from USGS Report 02-385 Boyd & Furlong
Page 10
Adapted from USGS Report 02-385
Boyd & Furlong - 2002
2001-2002 USGSMonitoring of Lake Mead
Page 11
Southern Nevada WWTPs 2003 (ng/L)Southern Nevada WWTPs 2003 (ng/L)UV - Final Free Cl Combined Cl
Analyte ppt ppt pptHydrocodone 64 <1.0 44Trimethoprim 24 <1.0 <10
Acetaminophen <1.0 1.2 <10Caffeine 39 64 38
Erythromycin 262 <1.0 507
Sulfamethoxazole 141 15 20
Fluoxetine 9.9 5.3 52Pentoxifylline <1.0 16 <10Meprobamate 195 594 571
Dilantin 57 78 244TCEP 122 187 155
Carbamazepine 91 86 67DEET 279 269 <10
Atrazine <1.0 <1.0 <10Diazepam 2.0 1.9 <10
Oxybenzone 4.2 4.3 <10Estriol 1.6 2.1 <100
Ethynylestradiol <1.0 <1.0 <10Estrone <1.0 2.5 <25
Estradiol <1.0 <1.0 <10Testosterone 2.0 6.8 <10Progesterone <1.0 <1.0 <10
Androstenedione <1.0 3.0 <10Iopromide 82 29 101Naproxen 5.0 <1.0 <10Ibuprofen 6.1 7.0 110Diclofenac 6.9 <1.0 <10Triclosan 15 19 <10
Gemfibrozil 14 8.4 <10
WWTP#1 WWTP#2 WWTP#3
Page 12
AwwaRF Treatment StudyAwwaRF Treatment Study
• Evaluation of conventional and advanced water treatment for EDC removal
– Disinfection: UV, chlorine, ozone
– Membranes: RO, NF, UF, MF, EDR, MBR
– Activated carbon
– Biological
– Ion exchange
• SNWA received $350,000 from AwwaRF
• Project completed in early 2005
Page 13
EstriolAndrostenedione
Progesterone
Testosterone
17β Estradiol
Ethinyl estradiol
Estrone
SteroidsSteroids
Page 14
AntimicrobialsAntimicrobials
Triclosan
Sulfamethoxazole
Erythromycin
Trimethoprim
Page 15
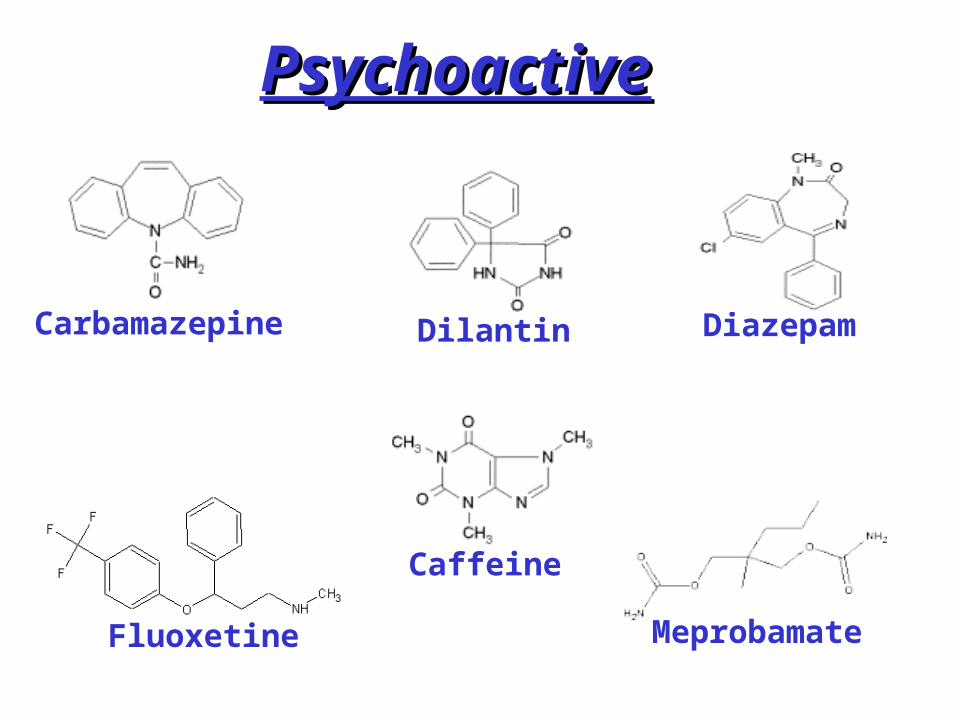
PsychoactivePsychoactive
Carbamazepine Diazepam
Fluoxetine
Caffeine
Meprobamate
Dilantin
Page 16
AnalgesicsAnalgesics
Ibuprofen
Naproxen Hydrocodone
Acetaminophen
Diclofenac
Page 17
OthersOthers
Gemfibrozil
Pentoxifylline
Iopromide
Metolachlor
Galaxolide
TCEP
Musk Ketone Atrazine
Page 18
<30% Removal 30-70% Removal >70% RemovalTestosterone SulfamethoxazoleProgesterone Triclosan
Androstenedione DiclofenacEstriol Acetaminophen
EthynylestradiolEstrone
EstradiolErythromycin-H2O
TrimethoprimNaproxen
HydrocodoneIbuprofenCaffeine
FluoxetineMeprobamate
DiazepamDilantin
CarbamazepineDEET
AtrazineGalaxolide
TCEPIopromide
PentoxifyllineMetolachlorGemfibrozil
Musk Ketone
UV 40mJ/cmUV 40mJ/cm22
Page 19
<30% Removal 30-70% Removal >70% RemovalTestosterone Ibuprofen EstriolProgesterone Metolachlor Ethynylestradiol
Androstenedione Gemfibrozil EstroneCaffeine Estradiol
Fluoxetine Erythromycin-H2O
Meprobamate SulfamethoxazoleDiazepam Triclosan
Dilantin TrimethoprimCarbamazepine Naproxen
DEET DiclofenacAtrazine Hydrocodone
Galaxolide AcetaminophenTCEP Musk Ketone
IopromidePentoxifylline
Chlorine 3.5 mg/L 24 hrChlorine 3.5 mg/L 24 hr
Page 20
<30% Removal 30-70% Removal >70% RemovalMusk Ketone Meprobamate Testosterone
TCEP Atrazine ProgesteroneIopromide Androstenedione
EstriolEthynylestradiol
EstroneEstradiol
Erythromycin-H2OSulfamethoxazole
TriclosanTrimethoprim
NaproxenDiclofenacIbuprofen
HydrocodoneAcetaminophenCarbamazepine
DilantinDiazepamCaffeine
FluoxetineDEET
MetolachlorGalaxolide
PentoxifyllineGemfibrozil
Ozone 2.5 mg/LOzone 2.5 mg/L
Page 21
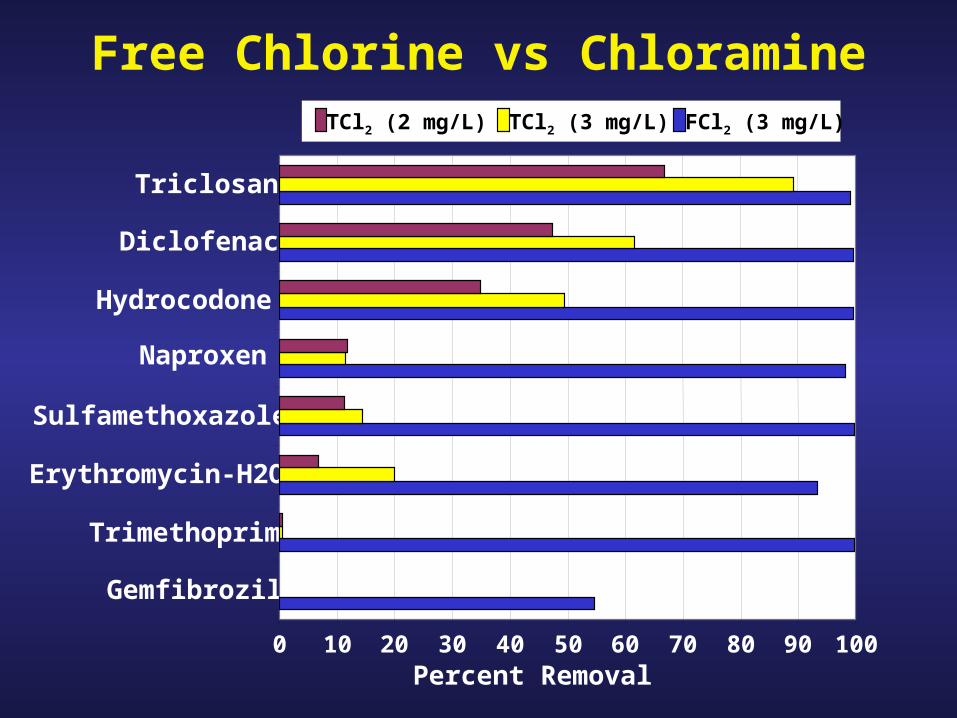
0 10 20 30 40 50 60 70 80 90 100
Gemfibrozil
Trimethoprim
Erythromycin-H2O
Sulfamethoxazole
Naproxen
Hydrocodone
Diclofenac
Triclosan
Percent Removal
TCl2 (2 mg/L) TCl2 (3 mg/L) FCl2 (3 mg/L)
Free Chlorine vs Chloramine
Page 22
CCWRD EvaluationCCWRD Evaluation
• 200 L of tert. treated effluent collected prior to UV disinfection
– June 2005
– Ozone demand/decay determined
– 1-L/min flow through “micro-pilot”
– 12 contactors with 2 min. contact time each
– Ozone injection in 1st contactor only
– Organic contaminants, microbes, and estrogenicity (bioassay) monitoring
– Samples collected at various contact times
Page 24
0
1
2
3
4
5
6
0 5 10 15 20 25 30
Contact Time (min)
Dis
solv
ed O
zon
e R
esid
ual
(m
g/L
)
O3=6.9 mg/L
O3=6.0 mg/L
O3=4.3 mg/L
O3=1.8 mg/L
CCWRD Bench Ozone Decay
Page 25
Analyte
Hydrocodone
Trimethoprim
Acetaminophen
Caffeine
Erythromycin-H2O
Sulfamethoxazole
Pentoxifylline
Meprobamate
Dilantin
TCEP
Carbamazepine
DEET
Atrazine
Oxybenzone
Raw Sewage-AVE
ng/L
218
319
43750
97800
285
590
46
739
94
453
99
413
251
2925
Secondary Effluent AVE
ng/L
240
35
ND
51
133
841
ND
332
154
373
210
188
ND
6
O3 3 mg/L
ng/L
ND
ND
ND
ND
ND
3.1
ND
140
17
427
ND
39
ND
8.2
O3 6 mg/L
ng/L
ND
ND
ND
ND
ND
ND
ND
63
3.4
352
ND
10
ND
ND
O3 8 mg/L
ng/L
ND
ND
ND
ND
ND
ND
ND
42
ND
334
ND
3.4
ND
1.5
Page 26
<2<2<22675>16,000,000Fecal Coliform
<2<2<26750>16,000,000Total Coliform
NDNDND0.626>40EEq ng/mL
427283133225Musk Ketone
NDND4611691680Galaxolide
NDNDNDND1105Gemfibrozil
7250112851590Triclosan
NDNDND5428Diclofenac
NDNDND1911950Ibuprofen
NDNDND1313200Naproxen
ND262237Iopromide
ng/L ng/Lng/Lng/Lng/LAnalyte
8 mg/L6 mg/L3 mg/LSecondary
Effluent AVERaw
Sewage-AVE
Page 27
Before Ozonation After Ozonation
Page 28
ConclusionsConclusions• Ozone is effective for disinfection and removal of
emerging contaminants
• No perfect treatment
– RO/NF membranes = brine and water loss
– Activated carbon = disposal/regeneration
– Disinfection = byproducts
• Ozone can remove cellular estrogenicity
– Effects on fish should be evaluated
– European scientists found same effect
Page 29
Implications for CCWRDImplications for CCWRD
Page 30
ConclusionsConclusions• Southern Nevada has extensive history & expertise in
ozone technology
• Costs for ozone and UV are comparable for disinfection in reuse application– UV is not oxidative at disinfect dose
– Ozone provides disinfection & oxidation
– UV subject to regrowth post-disinfection
– Neither UV nor ozone have residual issues
• Contact times from pilot would be realistic
– ≈ 8-20 min contact time for ozone
– ≈ 90 min contact time for chlorine
Page 31
Future EffortsFuture Efforts• Repeat study January 2006
– during winter season
– peroxide addition for advanced oxidation
• Plant expansion design decisions will occur in 2006 – membranes versus conventional filters
– ozone versus UV
– on-line by approximately 2009 (?)
• Monitoring efforts of Lake Mead will continue– SNWA analyses
– F&W, USGS, BOR, NPS all have on-going efforts
– CWC’s SCOP adaptive management plan
Page 32
Shane Snyder, Ph.D.Shane Snyder, [email protected] @snwa.com
QuestionsQuestionsDoug Drury, Ph.D.Doug Drury, Ph.D.
[email protected] @cleanwaterteam.com