Many analyses in geotechnical engineering assume that the soil isfully saturated or that the pore air in the soil is fully connected to theatmosphere, and in this way the gauge pore-air pressure is zero. Suchanalyses may not be applicable to a range of practical problemswhere the pore-air pressure is not equal to atmospheric pressure,such as vacuum stabilization, methane hydrate exploration, and soilvapor extraction.
In response to elevated pore-air pressures in soil, the net normalstress decreases. Accordingly, the shear strength and stiffness of thesoil can be significantly reduced (Wheeler et al. 1991; Fredlund andRahardjo 1993; Duffy et al. 1994). Consequently, the short-termstability of slopes or the load capacity of foundations will be de-creased, while the slope deformations will be larger. Fredlund andRahardjo (1993) estimated the pore-air pressures in a dam at the endof construction and analyzed the stability of the dam. It was foundthat ignoring the influence of pore-air pressure could result in a15e34% overestimate of the factor of safety and thus lead to anunsafe design.
Previous studies have emphasized the adverse effects of pore-airpressure on the stability and deformation of soil masses. Yet, it ispossible to apply pore-air pressure in a positive way. In fact, vacuumtechnologyhas beenused successfully to improve soft soil foundations
(Harvey 1997; Shang et al. 1998; Chu et al. 2000; Tang and Shang2000). Vacuum technology was also reported to have been applied torock slopes at a surface mining site to enhance the slope stability(Brawner and Cavers 1986), as well as to horizontal drains to stabilizelandslides (Arutiunian 1983; Arutjunyan 1988; Pakalnis et al. 1983a;Brawner 2003). Early applications of the vacuum technique in slopestability, however, did not gain enough attention, and have not led tofurther employment of vacuum techniques in recent decades. Thereason may be attributed to the heterogeneous nature of the ground-water system and the soil stratum, the insufficient techniques ofsealing, and the complex field operation, which make it hard to dis-tinguish the effect of vacuum from other means, that is, local stressrelief by a dragline in a tar sandmine (Pakalnis et al. 1983b). However,because the vacuum consolidation technique and the development ofgeomembrane liners have become more mature in recent years(Thevanayagam et al. 1994), vacuum-assisted slope stabilization haspromising applications.
In this study, the mechanisms of vacuum technology in the sta-bilization of dry soil slopes were investigated, and vacuum tech-nology was proposed for the emergency rescue of active landslides.The concept involves a proposed vacuum rescue system that appliesa vacuum to an enclosed soil mass (e.g., cut slope, fill slope, or fillbehind a retaining wall). The enclosure can be formed by existingprotection layers (e.g., shotcrete, chunan, masonry, or concretewalls) or a geomembrane that can be quickly installed in the field.Once prefailure signs are diagnosed on a slope or a retaining wall,the vacuum rescue system can bemobilized immediately to stabilizethe slope or retaining wall and to avert disastrous consequences. Thevacuum technique provides temporal support of the slope, althoughconventional approaches to slope improvement, such as slopemodification, earth buttresses, and restraining structures (Mitchell1981; Turner and Schuster 1996) are still needed.
A preliminary study was undertaken to better understand the pore-air pressure distributions caused by external vacuum points and theeffect of applied vacuum on slope stability. This preliminary studyhad the following objectives: (1) to perform numerical analysis of
1Assistant Professor, Dept. of Civil, Architectural, and EnvironmentalEngineering, Missouri Univ. of Science and Technology (formerly Univ.of Missouri-Rolla), Rolla, MO 65409 (corresponding author). E-mail:[email protected]
2Professor, Dept. of Civil and Environmental Engineering, The HongKong Univ. of Science and Technology, Clear Water Bay, Hong Kong.E-mail: [email protected]
two-dimensional (2D) steady-state airflow through dry sand, (2) toinvestigate the influence of vacuum on the stability of soil slopes andto quantify the influence using a limit equilibrium method, and (3) toconduct model tests to verify the numerical analyses and estimate theeffectiveness of vacuum stabilization. Theories of airflow through drysoils, mechanisms of using vacuum for soil slope stabilization, andslope stability analysis that consider the influence of pore-air pres-sures were studied first. Then a series of model tests was conductedto investigate steady-state flow of air in dry sand slopes and the sta-bility of dry sand slopes subjected to vacuum. Finally, 2D numericalanalyseswere conducted to simulate the airflow in themodels, and theslope stability analyses were performed to calculate the factors ofsafety of the model slopes.
Numerical Simulation Scheme
Theory of Airflow in Dry Soils
The rate of airflow through soil can be related to the air pressuregradient according to Fick’s law (Fredlund and Rahardjo 1993)
!m!t
! 2 kag!ua!z
"1#
where !m=!t 5 mass of air flowing through a unit area of air-filledpore space in unit time; ka 5 air coefficient of permeability; ua 5pore-air pressure; !ua=!z 5 pore-air pressure gradient through thesoil along the z-direction; and g 5 gravitational constant. An ex-perimental study of airflow by Blight (1971) has shown that Fick’slaw gives a satisfactory approximation of test results.
The air coefficient of permeability of a dry soil is usually muchlarger than its water coefficient of permeability (Fredlund andRahardjo 1993; Ba-Te 2005). Therefore, under constant flux con-ditions, steady-state airflow can be reached in a relative short time indry soil. The following assumptions were made: (1) the soil isnondeformable or there is no change in total stresses, (2) the soil ishomogeneous and isotropic, and (3) the airflow through the dry soilonly involves single-phase flow. Based on the conservation of massand Fick’s law, the 2D airflow continuity equation can be expressedas
!2ua!x2
$ !2ua!z2
! 0 "2#
where x and z 5 coordinates. Eq. (2) was used as the governingequation for numerical simulation of pore-air pressure distributionsin model soil slopes. Also, a finite-element partial differentialequation solver, FlexPDE (PDE Solutions Inc. 2011), was used toobtain a solution.
Mechanisms for Use of Vacuum in Soil SlopeStabilization
Vacuum can help stabilize a soil slope by two mechanisms, namely,an increase in the shear strength of soil and the acceleration ofdrainage. The shear strength of an unsaturated soil can be expressedin terms of two independent stress-state variables "s2 ua# and"ua 2 uw# as follows (Fredlund et al. 1978):
tf ! c9 $ "s2 ua#f tanf9 $ "ua2 uw#f tanfb "3#
where tf 5 shear strength; c9 5 effective cohesion intercept;"s2 ua#f 5 net normal stress at failure; ua5 pore-air pressure; uw5
pore-water pressure;f95 effective angle of shearing resistance;fb 5angle indicating the rate of change in shear strength relative to thechange in matric suction "ua 2 uw#f . Eq. (3) is known as the extendedMohr-Coulomb failure criterion. In vacuum stabilization, there is noincrease in total stresses (Leong et al. 2000). However, when vacuum(i.e., negative pore-air pressure) is applied to a soil mass, the net normalstress "s2 ua# increases. As a result, in the case of the vacuum-stabilized dry sand slopes where the suction term does not contribute,this leads to an increase in the shear strength tf , as shown inEq. (3). Theshear-strength increment will increase the stability of the slopes againstshallow failure. In the caseofvacuum-stabilizedunsaturated soil slopes,in addition to the increase in the net normal stress, "ua 2 uw# will alsoincrease because of the accelerated drainage of the pore water byvacuum. In the matric suction range that vacuum can create (,100kPa), it is most likely that the friction angle fb associated with matricsuction is not zero (Fredlund et al. 1978; Vanapalli et al. 1996). Asa result, the shear strength of the soil will increase. Furthermore, theshear strength can also be enhanced by possible density increase asa result of the compression of the soil under vacuum pressure.
Fredlund and Rahardjo (1993) derived a general limit equilibriummethod for calculating the factor of safety of soil slopes, includingthe effect of pore-air pressure. In a general limit equilibrium for-mulation, the factor of safety is defined as “the factor by which thecohesion and the coefficient of friction must be divided to drive theslope to a limit equilibrium state” (Duncan 1996). The slip surfacecan usually be assumed to be circular, with little inaccuracy, unlessthere are geological controls that constrain the slip surface to anoncircular shape (Duncan 1996).
Adopting assumptions made by Bishop (1955), the resultantinterslice shear forces can be ignored. The Fredlund-Rahardjoformulation (Fredlund and Rahardjo 1993) can then be simplified as
FS !
Pi5n
i! 1
(ci9biR $
"Ni 2 uwi bi
tan fbi
tan fi92 uai bi
12
tan fbi
tan fi9
!#R tan fi9
)
Pi5n
i! 1Wixi
"4#
where
Ni !Wi2
ci9bi sinai
FS$ uai
bi sinai
FS
!tanfi92 tanfb
i
"$ uwi
bi sinai
FStanfb
i
cosai $#sinai tan fi9
$%FS
"5#
where n 5 number of slices; FS 5 factor of safety; R 5 radius fora circular slip surface;Wi 5 total weight of the ith slice with a basesloping distance of bi; Ni 5 total normal force on the base of the ithslice; uai and uwi 5 pore-air and pore-water pressures at the base ofthe ith slice; ai 5 angle between the tangent to the center of the baseof the ith slice and the horizontal; ci9, fi9, andf
bi 5 effective cohesion
intercept, effective angle of shearing resistance and angle related tothe change in matric suction at the base of the ith slice, respectively;and xi5 horizontal distance from the centerline of the ith slice to thecenter of rotation.
The angle fb begins to deviate from the effective friction angleas the soil desaturates at suctions greater than the air-entry value(Vanapalli et al. 1996).As the soil suction reaches the residual suction,fb appears to approach a value close to zero. For the dry clean sand,
the residual suction must have been exceeded. Therefore, fb is set tozero. Pore-water pressures in the dry sand are also set as zero.
In this study, a computer routine called Slope-Air (Ba-Te 2005)was developed to analyze the stability of unsaturated soil slopes, bywhich distributed pore-air and pore-water pressures could be con-sidered simultaneously. The method of slices, as shown in Eqs. (4)and (5), was used, and circular slip surfaces were assumed foruniform soil. The results of pore-air pressure distribution, calculatedusing FlexPDE, are mapped onto the soil slope profile. The pore-airpressures along a slip surface can be used to calculate the factor ofsafety along that surface. A grid-and-radius scheme was adopted tofind the location of the center of the critical slip surface and the radiuscorresponding to the minimum factor of safety. An effective peakfriction angle of 34! (corresponding to the relative density of 75%)was selected based on Cai’s (2001) triaxial test results.
Materials and Experimental Setup of ModelSlope Tests
Model Testing Devices
A rotatable box was designed and built for the experimental study.Themain components are a rotatable acrylicmodel box (1.23 0.530.4 m, length 3 width 3 height), a stand on which the box couldrotate, a vacuum supply system, and measuring devices. The modelsoil slope was prepared in the box. Dry sand was used to formthe model and simulate the steady-state condition of the vacuumdrainage of a slope. The omission of capillarywater in themodel boxsingled out the effect of vacuum on net normal stress and got rid ofthe effect of matric suction. A latex membrane was applied to coverthe top of the slope to hold the vacuum.
During testing, negative pore-air pressures were applied to themodel soil slope. The negative air pressure was supplied by a vac-uum pump and controlled by pressure regulators. The box could berotated and fixed at any angle between 0 and 40!. 2D airflow con-ditions were simulated by using perforated strips as vacuum inletsand outlets. Air pressure measuring tips were installed inside themodel soil slope through predrilled holes that were aligned in tworows in the acrylic wall. A digital pressure switch (SMC seriesZSE40F) was used to display the pore-air pressure. The resolution ofthis vacuum gauge was 0.1 kPa. Two video cameras were installedorthogonal to each other to record the failure of the soil slope.
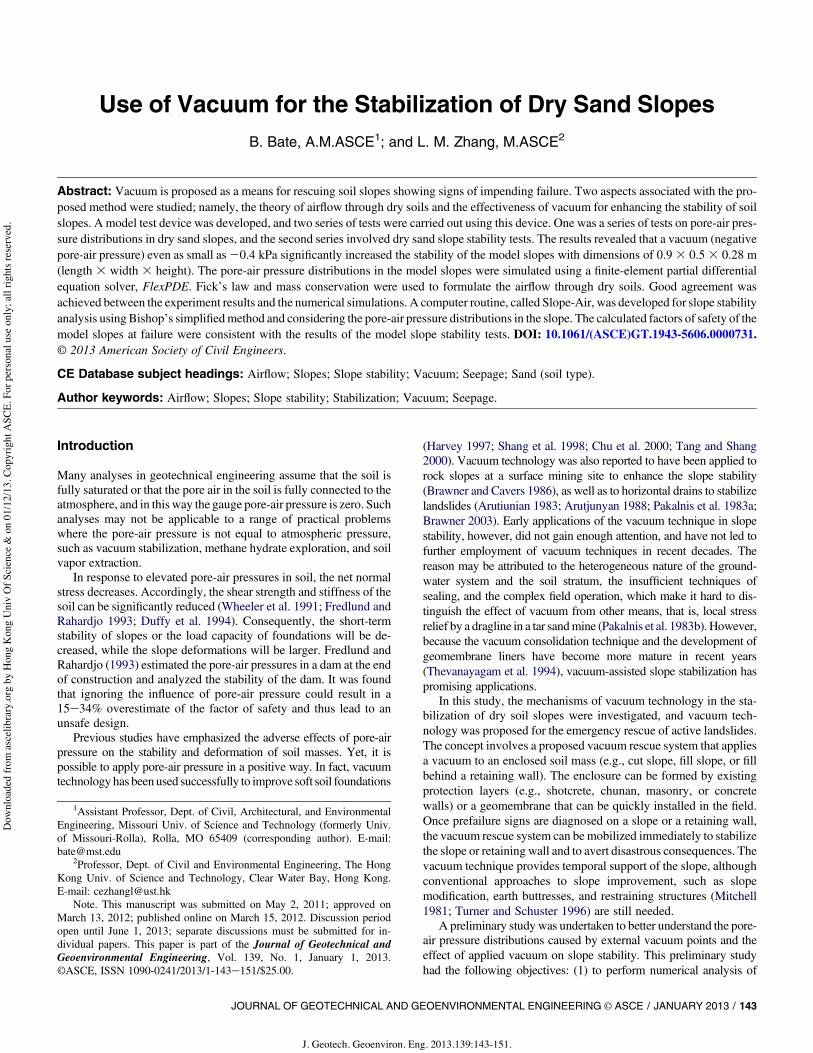
Soil Properties and Sample Preparation
Uniform Leighton Buzzard sand (Fraction E) was used to form themodel slope. This soil was fine and uniform uncrushed silica sandwhose grain size ranged between 0.09 and 0.15mm (Table 1). A drypluviation method was used to prepare the model sand slope. Twomain factors affect the density of the sand; namely,mass pouring rateand pouring height (Takemura et al. 1998; Ueno 1998). The pouringrate was carefully controlled using a scoop. Calibration between thefree fall height and the relative density was conducted at four dif-ferent free-fall heights. The average density values from those testresults are plotted in Fig. 1. A free-fall distance of 790 mm wasselected for final model preparation. The corresponding relativedensity of the sand was 75%. Based on Cai’s (2001) triaxial testresults, the extrapolated peak friction angle of the sand at a relativedensity of 75%was approximately 34!. This was also assumed to bethe effective angle of internal friction, f9, for Eqs. (4) and (5). Thecritical state friction angle of this sand was 29.7! (Cai 2001).
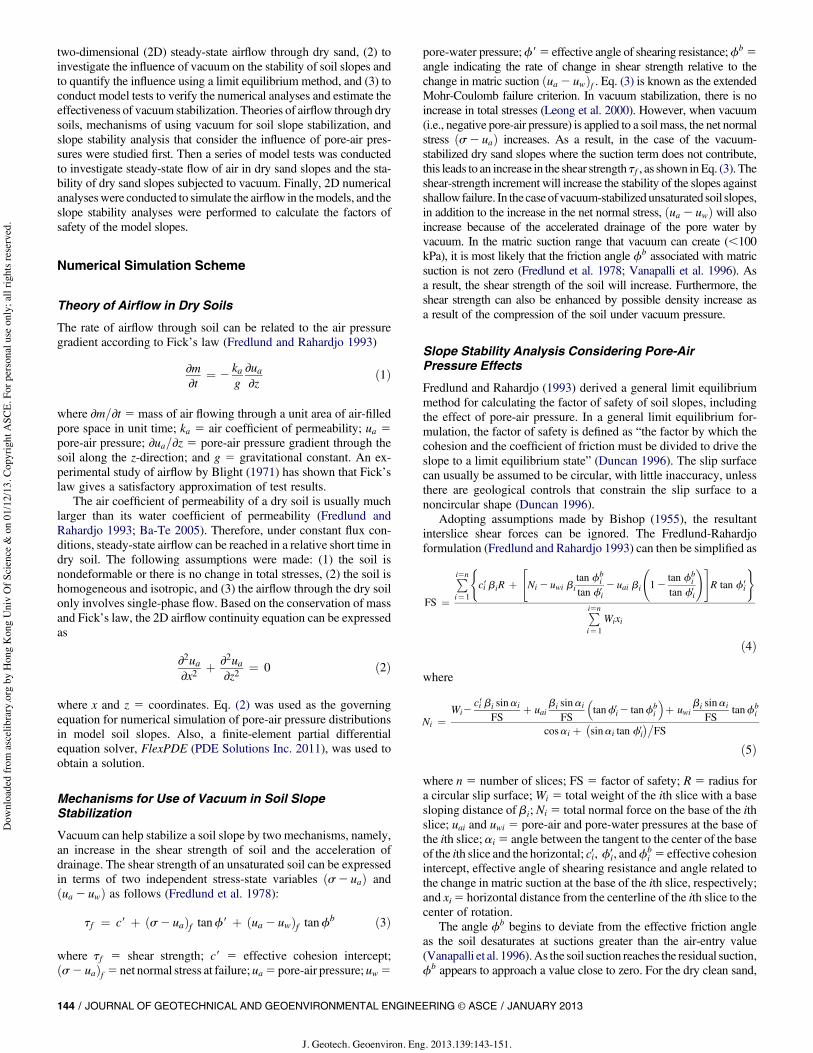
The prepared rectangular trapezoidal model slope was 0.9 m inlength and 0.28 m in height, with an initial slope angle of 18.4!.
Pore-Air Pressure Distribution Tests
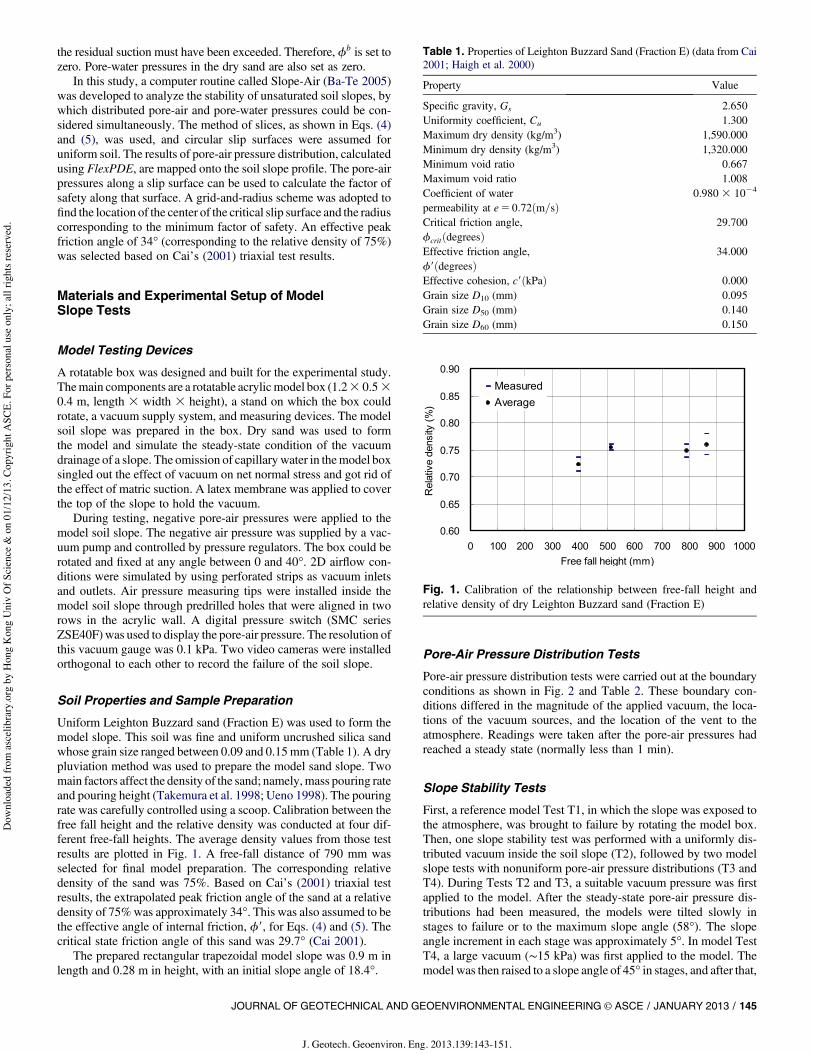
Pore-air pressure distribution tests were carried out at the boundaryconditions as shown in Fig. 2 and Table 2. These boundary con-ditions differed in the magnitude of the applied vacuum, the loca-tions of the vacuum sources, and the location of the vent to theatmosphere. Readings were taken after the pore-air pressures hadreached a steady state (normally less than 1 min).
Slope Stability Tests
First, a reference model Test T1, in which the slope was exposed tothe atmosphere, was brought to failure by rotating the model box.Then, one slope stability test was performed with a uniformly dis-tributed vacuum inside the soil slope (T2), followed by two modelslope tests with nonuniform pore-air pressure distributions (T3 andT4). During Tests T2 and T3, a suitable vacuum pressure was firstapplied to the model. After the steady-state pore-air pressure dis-tributions had been measured, the models were tilted slowly instages to failure or to the maximum slope angle (58!). The slopeangle increment in each stage was approximately 5!. In model TestT4, a large vacuum ("15 kPa) was first applied to the model. Themodel was then raised to a slope angle of 45! in stages, and after that,
Table 1. Properties of Leighton Buzzard Sand (Fraction E) (data from Cai2001; Haigh et al. 2000)
Property Value
Specific gravity, Gs 2.650Uniformity coefficient, Cu 1.300Maximum dry density (kg/m3) 1,590.000Minimum dry density (kg/m3) 1,320.000Minimum void ratio 0.667Maximum void ratio 1.008Coefficient of waterpermeability at e5 0:72"m=s#
the magnitude of the applied vacuumwas reduced in stages until theslope failed. The test conditions for the four model slope stabilitytests are summarized in Table 2.
Results and Discussions
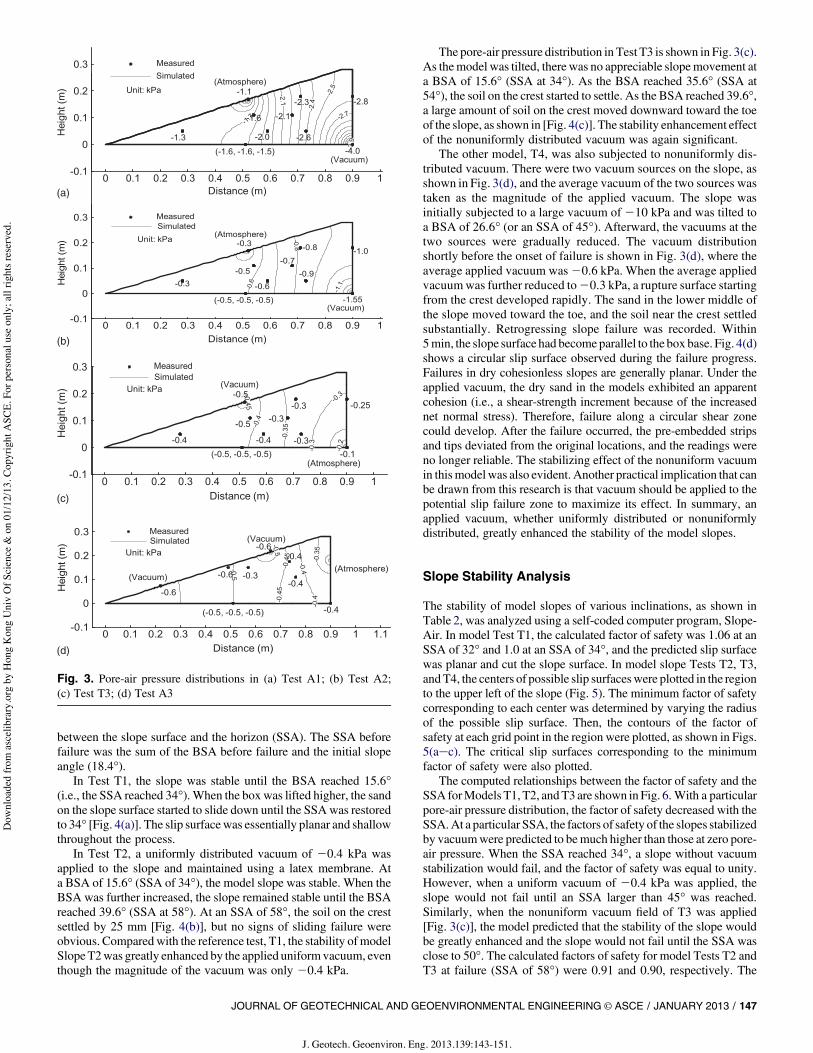
Pore-Air Pressure Distribution
The 2D flow condition was checked by measuring the air pressuresat the 2D coordinate of (0.51, 0) and three different positions normalto the 2D plane (Fig. 2). The results of pore-air pressure measure-ments are shown in Fig. 3. The differences among three pressurevalues at three positions normal to the 2D plane were 0.1 kPa forTest A1 and 0 kPa for Tests A2, A3, and T3. The 2D flow condition,created by the perforated strip vacuum source, was validated.
Figs. 3(a and b) show the pore-air pressure distributions at sourcevacuums of 24.0 and 21.55 kPa, respectively. The boundaryconditions were the same. The resulting pressure contours weresimilar in shape and different in magnitude. The magnitude of airpressure was proportional to the magnitude of the applied vacuum.This behavior occurred because Eq. (2) is a linear partial differential
equation. As long as the boundary conditions do not change, thecomputed steady-state pressure at any point will be linearly pro-portional to the source pressure. Fig. 3 also indicates that themeasuredair pressure values were generally in good agreement with thecalculated ones. Fick’s law is capable of describing the steady-stateairflow through the dry homogeneous sand.
A few mismatches between the measured and calculated airpressure results were observed. The largest mismatch was at co-ordinate (0.28, 0.05) in Test A1. The measured vacuum was21.3 kPa,while the calculated onewas between21.6 and21.7 kPa.The problem may be associated with connections of the tubings.However, the difference of all of the rest of themeasurements was nolarger than 0.2 kPa. This difference was primarily caused by thelimited resolution of the digital vacuum gauge, which was 0.1 kPa.The resolution was of high precision for normal usage. However, thevacuum in the soil slopes at failure was less than 0.6 kPa. A higherprecision vacuum gauge is recommended for future research.
Slope Stability
The inclination of themodel slopewas represented by both the anglebetween the base of the slope and the horizon (BSA) and the angle
Fig. 2. Model soil slope dimensions and points of air pressure source and measurement
Table 2. Pore-Air Pressure Distribution Tests and Model Slope Stability Test Schemes
Model slope testnumber
Air pressure distribution (kPa)Slope angle at failure
(degrees)a b c d e
Air pressure Test A1 24.0 Open to theatmosphere
Sealed boundary Sealed boundary Sealed boundary —
Air pressure Test A2 21.55 Open to theatmosphere
Sealed boundary Sealed boundary Sealed boundary —
Air pressure Test A3 Sealed boundary Sealed boundary 20.6 20.6 Open to theatmosphere
—
Slope stability Test T1 Sealed boundary Open to theatmosphere
Open to theatmosphere
Open to theatmosphere
Sealed boundary 34
Slope stability Test T2 Sealed boundary 20.4 Sealed boundary Sealed boundary Sealed boundary 58Slope stability Test T3 Open to the
between the slope surface and the horizon (SSA). The SSA beforefailure was the sum of the BSA before failure and the initial slopeangle (18.4!).
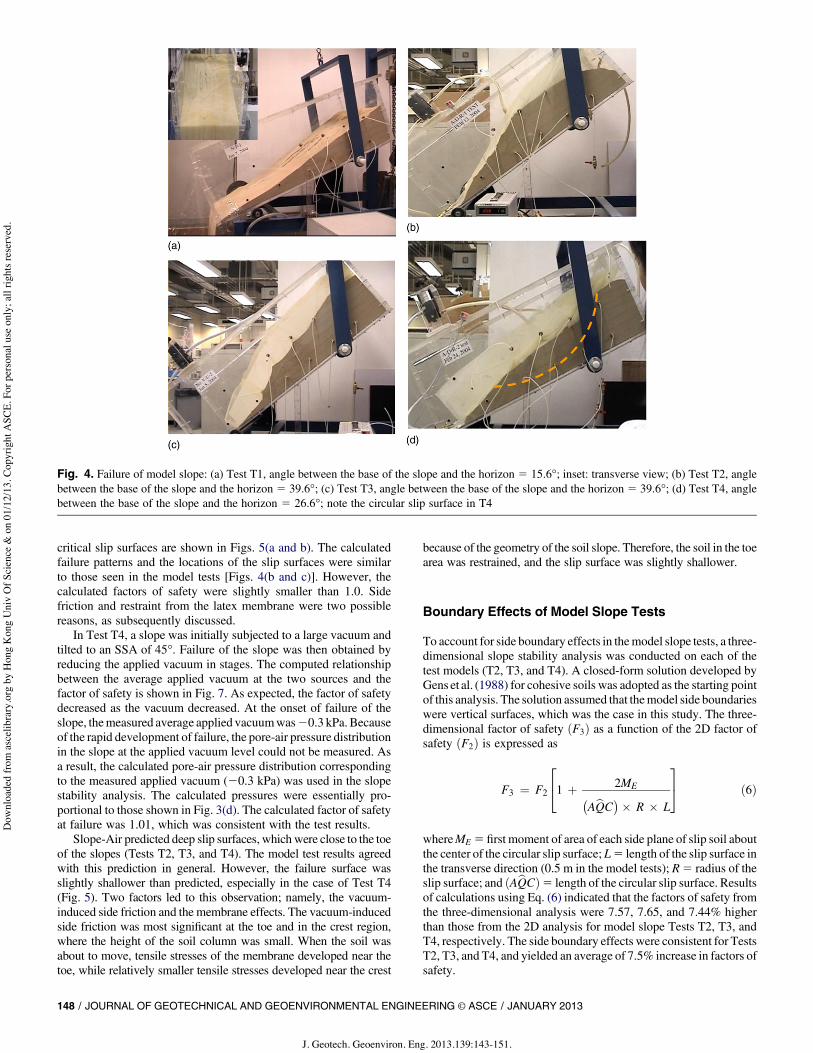
In Test T1, the slope was stable until the BSA reached 15.6!(i.e., the SSA reached 34!).When the box was lifted higher, the sandon the slope surface started to slide down until the SSAwas restoredto 34! [Fig. 4(a)]. The slip surfacewas essentially planar and shallowthroughout the process.
In Test T2, a uniformly distributed vacuum of 20.4 kPa wasapplied to the slope and maintained using a latex membrane. Ata BSA of 15.6! (SSA of 34!), the model slope was stable. When theBSA was further increased, the slope remained stable until the BSAreached 39.6! (SSA at 58!). At an SSA of 58!, the soil on the crestsettled by 25 mm [Fig. 4(b)], but no signs of sliding failure wereobvious. Comparedwith the reference test, T1, the stability ofmodelSlopeT2was greatly enhanced by the applied uniformvacuum, eventhough the magnitude of the vacuum was only 20.4 kPa.
The pore-air pressure distribution in Test T3 is shown in Fig. 3(c).As themodel was tilted, there was no appreciable slopemovement ata BSA of 15.6! (SSA at 34!). As the BSA reached 35.6! (SSA at54!), the soil on the crest started to settle. As the BSA reached 39.6!,a large amount of soil on the crest moved downward toward the toeof the slope, as shown in [Fig. 4(c)]. The stability enhancement effectof the nonuniformly distributed vacuum was again significant.
The other model, T4, was also subjected to nonuniformly dis-tributed vacuum. There were two vacuum sources on the slope, asshown in Fig. 3(d), and the average vacuum of the two sources wastaken as the magnitude of the applied vacuum. The slope wasinitially subjected to a large vacuum of 210 kPa and was tilted toa BSA of 26.6! (or an SSA of 45!). Afterward, the vacuums at thetwo sources were gradually reduced. The vacuum distributionshortly before the onset of failure is shown in Fig. 3(d), where theaverage applied vacuum was20.6 kPa. When the average appliedvacuumwas further reduced to20.3 kPa, a rupture surface startingfrom the crest developed rapidly. The sand in the lower middle ofthe slope moved toward the toe, and the soil near the crest settledsubstantially. Retrogressing slope failure was recorded. Within5min, the slope surface had becomeparallel to the box base. Fig. 4(d)shows a circular slip surface observed during the failure progress.Failures in dry cohesionless slopes are generally planar. Under theapplied vacuum, the dry sand in the models exhibited an apparentcohesion (i.e., a shear-strength increment because of the increasednet normal stress). Therefore, failure along a circular shear zonecould develop. After the failure occurred, the pre-embedded stripsand tips deviated from the original locations, and the readings wereno longer reliable. The stabilizing effect of the nonuniform vacuumin thismodelwas also evident. Another practical implication that canbe drawn from this research is that vacuum should be applied to thepotential slip failure zone to maximize its effect. In summary, anapplied vacuum, whether uniformly distributed or nonuniformlydistributed, greatly enhanced the stability of the model slopes.
Slope Stability Analysis
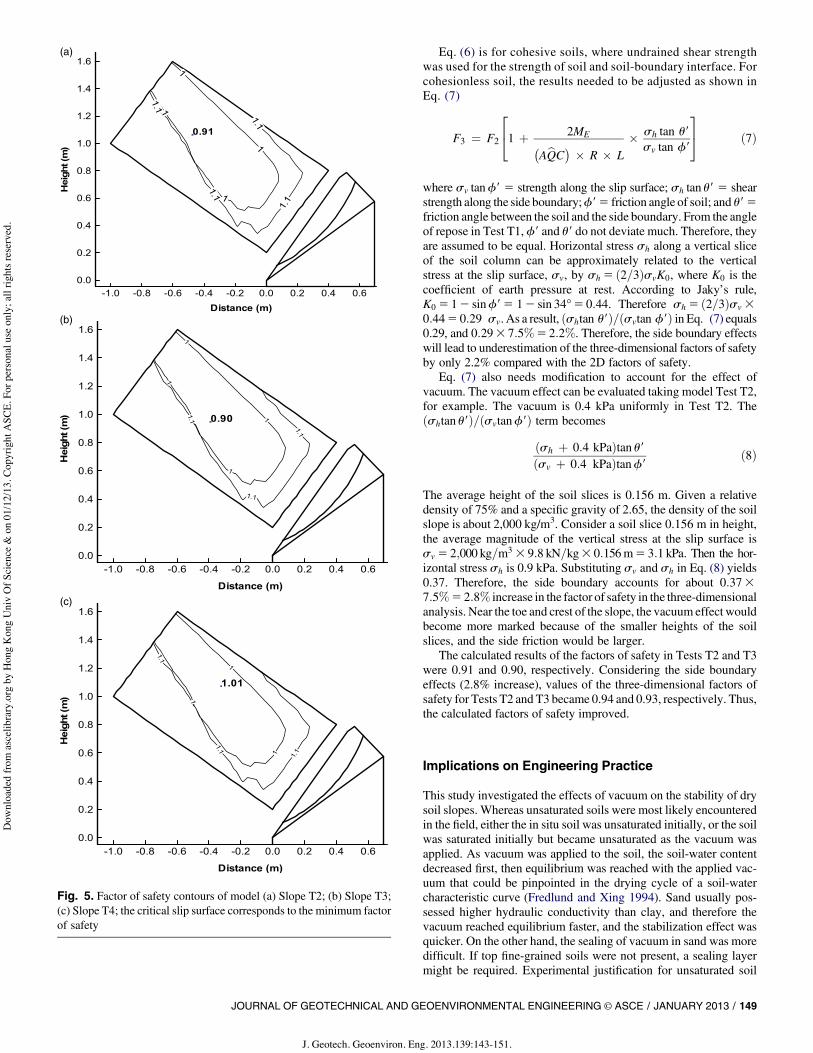
The stability of model slopes of various inclinations, as shown inTable 2, was analyzed using a self-coded computer program, Slope-Air. In model Test T1, the calculated factor of safety was 1.06 at anSSA of 32! and 1.0 at an SSA of 34!, and the predicted slip surfacewas planar and cut the slope surface. In model slope Tests T2, T3,andT4, the centers of possible slip surfaceswere plotted in the regionto the upper left of the slope (Fig. 5). The minimum factor of safetycorresponding to each center was determined by varying the radiusof the possible slip surface. Then, the contours of the factor ofsafety at each grid point in the region were plotted, as shown in Figs.5(aec). The critical slip surfaces corresponding to the minimumfactor of safety were also plotted.
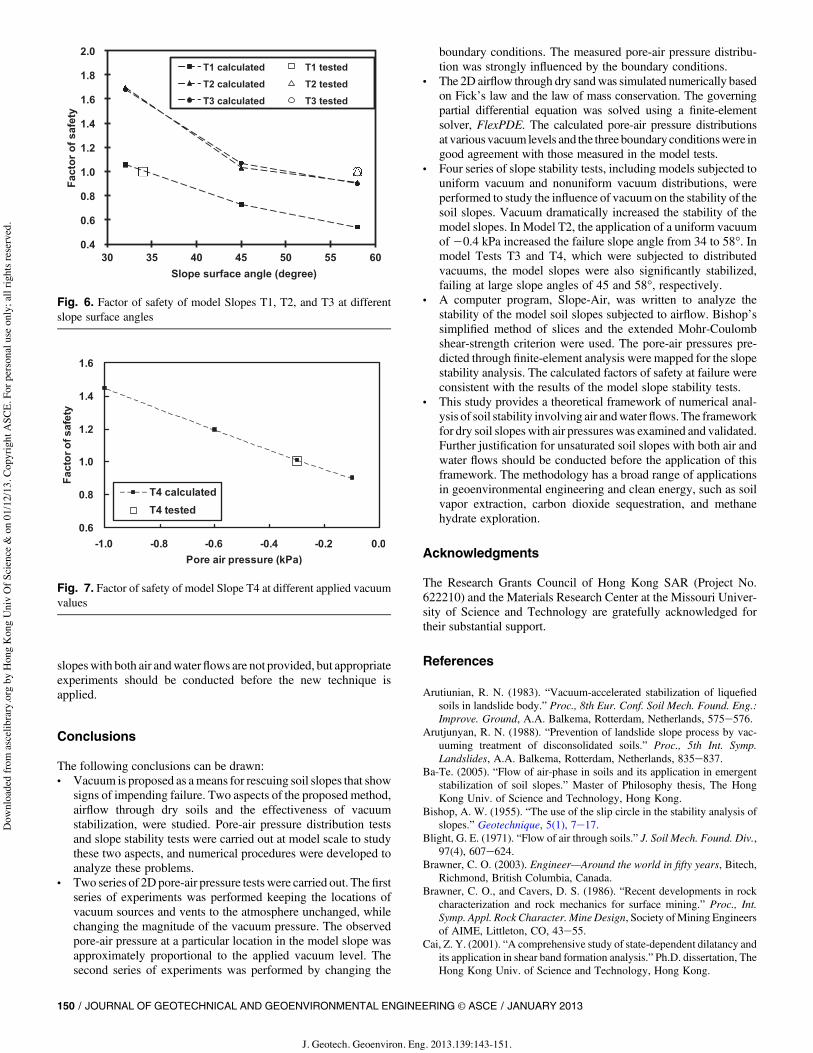
The computed relationships between the factor of safety and theSSA forModels T1, T2, andT3 are shown in Fig. 6. With a particularpore-air pressure distribution, the factor of safety decreased with theSSA.At a particular SSA, the factors of safety of the slopes stabilizedby vacuumwere predicted to bemuch higher than those at zero pore-air pressure. When the SSA reached 34!, a slope without vacuumstabilization would fail, and the factor of safety was equal to unity.However, when a uniform vacuum of 20.4 kPa was applied, theslope would not fail until an SSA larger than 45! was reached.Similarly, when the nonuniform vacuum field of T3 was applied[Fig. 3(c)], the model predicted that the stability of the slope wouldbe greatly enhanced and the slope would not fail until the SSA wasclose to 50!. The calculated factors of safety for model Tests T2 andT3 at failure (SSA of 58!) were 0.91 and 0.90, respectively. The
Fig. 3. Pore-air pressure distributions in (a) Test A1; (b) Test A2;(c) Test T3; (d) Test A3
critical slip surfaces are shown in Figs. 5(a and b). The calculatedfailure patterns and the locations of the slip surfaces were similarto those seen in the model tests [Figs. 4(b and c)]. However, thecalculated factors of safety were slightly smaller than 1.0. Sidefriction and restraint from the latex membrane were two possiblereasons, as subsequently discussed.
In Test T4, a slope was initially subjected to a large vacuum andtilted to an SSA of 45!. Failure of the slope was then obtained byreducing the applied vacuum in stages. The computed relationshipbetween the average applied vacuum at the two sources and thefactor of safety is shown in Fig. 7. As expected, the factor of safetydecreased as the vacuum decreased. At the onset of failure of theslope, themeasured average applied vacuumwas20.3 kPa.Becauseof the rapid development of failure, the pore-air pressure distributionin the slope at the applied vacuum level could not be measured. Asa result, the calculated pore-air pressure distribution correspondingto the measured applied vacuum (20.3 kPa) was used in the slopestability analysis. The calculated pressures were essentially pro-portional to those shown in Fig. 3(d). The calculated factor of safetyat failure was 1.01, which was consistent with the test results.
Slope-Air predicted deep slip surfaces, which were close to the toeof the slopes (Tests T2, T3, and T4). The model test results agreedwith this prediction in general. However, the failure surface wasslightly shallower than predicted, especially in the case of Test T4(Fig. 5). Two factors led to this observation; namely, the vacuum-induced side friction and the membrane effects. The vacuum-inducedside friction was most significant at the toe and in the crest region,where the height of the soil column was small. When the soil wasabout to move, tensile stresses of the membrane developed near thetoe, while relatively smaller tensile stresses developed near the crest
because of the geometry of the soil slope. Therefore, the soil in the toearea was restrained, and the slip surface was slightly shallower.
Boundary Effects of Model Slope Tests
To account for side boundary effects in themodel slope tests, a three-dimensional slope stability analysis was conducted on each of thetest models (T2, T3, and T4). A closed-form solution developed byGens et al. (1988) for cohesive soils was adopted as the starting pointof this analysis. The solution assumed that themodel side boundarieswere vertical surfaces, which was the case in this study. The three-dimensional factor of safety "F3# as a function of the 2D factor ofsafety "F2# is expressed as
F3 ! F2
2
41 $ 2ME#AbQC
$% R % L
3
5 "6#
whereME 5 first moment of area of each side plane of slip soil aboutthe center of the circular slip surface; L5 length of the slip surface inthe transverse direction (0.5 m in the model tests); R5 radius of theslip surface; and "AbQC#5 length of the circular slip surface. Resultsof calculations using Eq. (6) indicated that the factors of safety fromthe three-dimensional analysis were 7.57, 7.65, and 7.44% higherthan those from the 2D analysis for model slope Tests T2, T3, andT4, respectively. The side boundary effects were consistent for TestsT2, T3, and T4, and yielded an average of 7.5% increase in factors ofsafety.
Fig. 4. Failure of model slope: (a) Test T1, angle between the base of the slope and the horizon 5 15.6!; inset: transverse view; (b) Test T2, anglebetween the base of the slope and the horizon 5 39.6!; (c) Test T3, angle between the base of the slope and the horizon 5 39.6!; (d) Test T4, anglebetween the base of the slope and the horizon 5 26.6!; note the circular slip surface in T4
Eq. (6) is for cohesive soils, where undrained shear strengthwas used for the strength of soil and soil-boundary interface. Forcohesionless soil, the results needed to be adjusted as shown inEq. (7)
F3 ! F2
2
41 $ 2ME#AbQC
$% R % L
% sh tan u9sv tan f9
3
5 "7#
where sv tanf9 5 strength along the slip surface; sh tan u9 5 shearstrength along the side boundary;f95 friction angle of soil; and u95friction angle between the soil and the side boundary. From the angleof repose in Test T1,f9 and u9 do not deviate much. Therefore, theyare assumed to be equal. Horizontal stress sh along a vertical sliceof the soil column can be approximately related to the verticalstress at the slip surface, sv, by sh 5 "2=3#svK0, where K0 is thecoefficient of earth pressure at rest. According to Jaky’s rule,K0 5 12 sinf95 12 sin 34!5 0:44. Therefore sh 5 "2=3#sv 30:445 0:29 sv. As a result, "shtan u9#="svtan f9# in Eq. (7) equals0.29, and 0:293 7:5%5 2:2%. Therefore, the side boundary effectswill lead to underestimation of the three-dimensional factors of safetyby only 2.2% compared with the 2D factors of safety.
Eq. (7) also needs modification to account for the effect ofvacuum. The vacuum effect can be evaluated taking model Test T2,for example. The vacuum is 0.4 kPa uniformly in Test T2. The"shtan u9#="svtanf9# term becomes
"sh $ 0:4 kPa#tan u9"sv $ 0:4 kPa#tanf9
"8#
The average height of the soil slices is 0.156 m. Given a relativedensity of 75% and a specific gravity of 2.65, the density of the soilslope is about 2,000 kg/m3. Consider a soil slice 0.156 m in height,the average magnitude of the vertical stress at the slip surface issv 5 2;000 kg=m3 3 9:8 kN=kg3 0:156m5 3:1 kPa. Then the hor-izontal stress sh is 0.9 kPa. Substituting sv and sh in Eq. (8) yields0.37. Therefore, the side boundary accounts for about 0:3737:5%5 2:8% increase in the factor of safety in the three-dimensionalanalysis. Near the toe and crest of the slope, the vacuum effect wouldbecome more marked because of the smaller heights of the soilslices, and the side friction would be larger.
The calculated results of the factors of safety in Tests T2 and T3were 0.91 and 0.90, respectively. Considering the side boundaryeffects (2.8% increase), values of the three-dimensional factors ofsafety for Tests T2 and T3 became 0.94 and 0.93, respectively. Thus,the calculated factors of safety improved.
Implications on Engineering Practice
This study investigated the effects of vacuum on the stability of drysoil slopes. Whereas unsaturated soils were most likely encounteredin the field, either the in situ soil was unsaturated initially, or the soilwas saturated initially but became unsaturated as the vacuum wasapplied. As vacuum was applied to the soil, the soil-water contentdecreased first, then equilibrium was reached with the applied vac-uum that could be pinpointed in the drying cycle of a soil-watercharacteristic curve (Fredlund and Xing 1994). Sand usually pos-sessed higher hydraulic conductivity than clay, and therefore thevacuum reached equilibrium faster, and the stabilization effect wasquicker. On the other hand, the sealing of vacuum in sand was moredifficult. If top fine-grained soils were not present, a sealing layermight be required. Experimental justification for unsaturated soil
Fig. 5. Factor of safety contours of model (a) Slope T2; (b) Slope T3;(c) Slope T4; the critical slip surface corresponds to the minimum factorof safety
slopeswith both air andwaterflows are not provided, but appropriateexperiments should be conducted before the new technique isapplied.
Conclusions
The following conclusions can be drawn:• Vacuum is proposed as ameans for rescuing soil slopes that show
signs of impending failure. Two aspects of the proposed method,airflow through dry soils and the effectiveness of vacuumstabilization, were studied. Pore-air pressure distribution testsand slope stability tests were carried out at model scale to studythese two aspects, and numerical procedures were developed toanalyze these problems.
• Two series of 2Dpore-air pressure tests were carried out. Thefirstseries of experiments was performed keeping the locations ofvacuum sources and vents to the atmosphere unchanged, whilechanging the magnitude of the vacuum pressure. The observedpore-air pressure at a particular location in the model slope wasapproximately proportional to the applied vacuum level. Thesecond series of experiments was performed by changing the
boundary conditions. The measured pore-air pressure distribu-tion was strongly influenced by the boundary conditions.
• The 2D airflow through dry sandwas simulated numerically basedon Fick’s law and the law of mass conservation. The governingpartial differential equation was solved using a finite-elementsolver, FlexPDE. The calculated pore-air pressure distributionsat various vacuum levels and the three boundaryconditionswere ingood agreement with those measured in the model tests.
• Four series of slope stability tests, including models subjected touniform vacuum and nonuniform vacuum distributions, wereperformed to study the influence of vacuum on the stability of thesoil slopes. Vacuum dramatically increased the stability of themodel slopes. In Model T2, the application of a uniform vacuumof20.4 kPa increased the failure slope angle from 34 to 58!. Inmodel Tests T3 and T4, which were subjected to distributedvacuums, the model slopes were also significantly stabilized,failing at large slope angles of 45 and 58!, respectively.
• A computer program, Slope-Air, was written to analyze thestability of the model soil slopes subjected to airflow. Bishop’ssimplified method of slices and the extended Mohr-Coulombshear-strength criterion were used. The pore-air pressures pre-dicted through finite-element analysis were mapped for the slopestability analysis. The calculated factors of safety at failure wereconsistent with the results of the model slope stability tests.
• This study provides a theoretical framework of numerical anal-ysis of soil stability involving air andwaterflows. The frameworkfor dry soil slopes with air pressures was examined and validated.Further justification for unsaturated soil slopes with both air andwater flows should be conducted before the application of thisframework. The methodology has a broad range of applicationsin geoenvironmental engineering and clean energy, such as soilvapor extraction, carbon dioxide sequestration, and methanehydrate exploration.
Acknowledgments
The Research Grants Council of Hong Kong SAR (Project No.622210) and the Materials Research Center at the Missouri Univer-sity of Science and Technology are gratefully acknowledged fortheir substantial support.
References
Arutiunian, R. N. (1983). “Vacuum-accelerated stabilization of liquefiedsoils in landslide body.” Proc., 8th Eur. Conf. Soil Mech. Found. Eng.:Improve. Ground, A.A. Balkema, Rotterdam, Netherlands, 575e576.
Arutjunyan, R. N. (1988). “Prevention of landslide slope process by vac-uuming treatment of disconsolidated soils.” Proc., 5th Int. Symp.Landslides, A.A. Balkema, Rotterdam, Netherlands, 835e837.
Ba-Te. (2005). “Flow of air-phase in soils and its application in emergentstabilization of soil slopes.” Master of Philosophy thesis, The HongKong Univ. of Science and Technology, Hong Kong.
Bishop, A. W. (1955). “The use of the slip circle in the stability analysis ofslopes.” Geotechnique, 5(1), 7e17.
Blight, G. E. (1971). “Flow of air through soils.” J. Soil Mech. Found. Div.,97(4), 607e624.
Brawner, C. O. (2003). Engineer—Around the world in fifty years, Bitech,Richmond, British Columbia, Canada.
Brawner, C. O., and Cavers, D. S. (1986). “Recent developments in rockcharacterization and rock mechanics for surface mining.” Proc., Int.Symp. Appl. Rock Character. Mine Design, Society ofMining Engineersof AIME, Littleton, CO, 43e55.
Cai, Z. Y. (2001). “A comprehensive study of state-dependent dilatancy andits application in shear band formation analysis.” Ph.D. dissertation, TheHong Kong Univ. of Science and Technology, Hong Kong.
Fig. 6. Factor of safety of model Slopes T1, T2, and T3 at differentslope surface angles
Fig. 7. Factor of safety of model Slope T4 at different applied vacuumvalues
Chu, J., Yan, S.W., andYang, H. (2000). “Soil improvement by the vacuumpreloading method for an oil storage station.” Geotechnique, 50(6),625e632.
Duffy, S. M., Wheeler, S. J., and Bennell, J. D. (1994). “Shear modulusof Kaolin containing methane bubbles.” J. Geotech. Eng., 120(5),781e796.
Duncan, J. M. (1996). “State of the art: Limit equilibrium and finite-elementanalysis of slopes.” J. Geotech. Eng., 122(7), 577e596.
Fredlund, D. G., Morgenstern, N. R., and Widger, R. A. (1978). “Shearstrength of unsaturated soils.” Can. Geotech. J., 15(3), 313e321.
Fredlund, D. G., and Rahardjo, H. (1993). Soil mechanics for unsaturatedsoils, Wiley, New York.
Fredlund, D. G., and Xing, A. (1994). “Equations for the soil-water char-acteristic curve.” Can. Geotech. J., 31(4), 521e532.
Gens, A., Hutchinson, N., and Cavounidis, S. (1988). “Three-dimensionalanalysis of slides in cohesive soils.” Geotechnique, 38(1), 1e23.
Haigh, S., Madabhushi, S., Soga, K., Taji, Y., and Shamoto, Y. (2000).“Lateral spreading during centrifuge model earthquakes.” Proc., Geo-Eng2000, Int. Conf. on Geotechnical & Geological Engineering,Technomic, Lancaster, PA, 0317.
Harvey, J. A. P. (1997). “Vacuum drainage to accelerate submarine con-solidation at Chek Lap Kok, Hong Kong.” Ground Eng., 30, 34e36.
Leong, E. C., Soemitro, R. A. A., and Rahardjo, H. (2000). “Soil improvementby surcharge and vacuum preloadings.” Geotechnique, 50(5), 601e605.
Mitchell, J. K. (1981). “Soil improvement—State-of-the-art report.” Proc.,10th Int. Conf. Soil Mech. Found. Eng., Balkema, Rotterdam, Nether-lands, 509e565.
Pakalnis, R., Brawner, C. O., and Lutman, T. (1983a). “Landslide stabili-zation by vacuum drainage.” Proc., 7th Panamerican Conf. Soil Mech.Found. Eng., PAN AM 1983, Canadian Geotechnical Society, Montreal,509e523.
Pakalnis, R., Brawner, C. O., and Sweeney, G. T. (1983b). “Vacuumhorizontal drainage: A practical approach.” Proc., 20th Annual Eng.Geol. Soils Eng. Symp., Idaho Transportation Department, Division ofHighways, Boise, ID, 97e111.
PDE Solutions, Inc. (2011). The FlexPDE 6 user manual, Spokane Valley,WA.
Shang, J. Q., Tang, M., and Miao, Z. (1998). “Vacuum preloading con-solidation of reclaimed land: A case study.” Can. Geotech. J., 35(5),740e749.
Takemura, J., Katagiri, M., Ueno, K., Kouda, M., and Stewart, D. P. (1998).“Report of cooperative test on method for preparation of sand samples.”Proc., Int. Conf. Centrifuge 1998, A.A. Balkema, Rotterdam, Nether-lands, 1087e1152.
Tang, M., and Shang, J. Q. (2000). “Vacuum preloading consolidation ofYaoqiang Airport runway.” Geotechnique, 50(6), 613e623.
Thevanayagam, S., Kavazanjian, E., Jr., Jacob, A., and Juran, I. (1994).“Prospects of vacuum-assisted consolidation for ground improvement ofcoastal and offshore fills.” Proc., ASCE National Conv.,ASCE, Reston,VA, 90e105.
Turner, A. K., and Schuster, R. L. (1996). “Landslides: Investigation andmitigation.” Transportation Research Board Record 247, Transporta-tion Research Board, Washington, DC.
Ueno, K. (1998). “Methods for preparation of sand samples.” Proc., Int.Conf. Centrifuge 1998, A.A. Balkema, Rotterdam, Netherlands,1047e1058.
Vanapalli, S. K., Fredlund, D. G., Pufahl, D. E., and Clifton, A. W. (1996).“Model for the prediction of shear strength with respect to soil suction.”Can. Geotech. J., 33(3), 379e392.
Wheeler, S. J., Sills, G. C., Sham, W. K., Duffy, S. M., and Boden, D. G.(1991). “Influence of shallow gas on the geotechnical properties of fine-grained sediments.” Underwat. Technol., 17(3), 11e16.


![cement stabilization sand [modalità compatibilità] - … · Cement stabilization sand Study of mixture sand + 3-6% cement CtifitCompaction of mixture Study of mixture sand + 6%](https://static.documents.pub/doc/80x56/5b329d237f8b9ab5728d37eb/cement-stabilization-sand-modalita-compatibilita-cement-stabilization.jpg)
