114
DOC022.53.90389 LICO 690 and LICO 620 USER MANUAL 11/2018 Edition 5

DOC022.53.90389
LICO 690 and LICO 620
USER MANUAL
11/2018 Edition 5

3
Table of Contents
Section 1 Specifications ........................................................................................................................ 7
Section 2 General Information............................................................................................................... 9
2.1 Safety information............................................................................................................................... 9
2.1.1 Precautionary labels .................................................................................................................. 9
2.1.2 Safety around source lamps .................................................................................................... 10
2.1.3 Chemical and biological safety ................................................................................................ 10
2.2 Overview of product.......................................................................................................................... 10
Section 3 Installation ............................................................................................................................ 13
3.1 Unpacking the instrument ................................................................................................................. 13
3.2 Operating environment ..................................................................................................................... 13
3.3 Front and back view.......................................................................................................................... 14
3.4 Power connections ........................................................................................................................... 15
3.5 Interfaces .......................................................................................................................................... 16
3.6 Cuvette compartments and cuvette adapters ................................................................................... 16
3.6.1 Cuvette compartments and adapter......................................................................................... 16
3.6.2 Installation of cuvette adapter Z............................................................................................... 17
Section 4 Start Up ................................................................................................................................. 19
4.1 Switch on the instrument, startup process........................................................................................ 19
4.2 Language selection........................................................................................................................... 19
4.3 Self-check ......................................................................................................................................... 19
4.4 Sleep mode....................................................................................................................................... 20
4.5 Power off the instrument................................................................................................................... 20
Section 5 Standard programs .............................................................................................................. 21
5.1 Overview........................................................................................................................................... 21
5.1.1 Tips for using the touch screen................................................................................................ 21
5.1.2 Use of the alphanumeric keypad ............................................................................................. 21
5.1.3 Main menu ............................................................................................................................... 22
4
Table of Contents
5.2 Instrument Setup...............................................................................................................................23
5.2.1 Operator ID...............................................................................................................................23
5.2.2 Sample ID.................................................................................................................................24
5.2.2.1 Sample ID with hand-held scanner method 1..................................................................25
5.2.2.2 Sample ID with hand-held scanner method 2..................................................................26
5.2.2.3 Import sample ID list........................................................................................................26
5.2.3 Security settings .......................................................................................................................27
5.2.3.1 Assign operator security level..........................................................................................28
5.2.3.2 Deactivate password .......................................................................................................30
5.2.4 Date and time ...........................................................................................................................30
5.2.5 Sound settings..........................................................................................................................32
5.2.6 PC and printer ..........................................................................................................................32
5.2.6.1 Printer setup ....................................................................................................................33
5.2.6.2 Print data .........................................................................................................................34
5.2.6.3 Print data continuously ....................................................................................................34
5.2.6.4 Network setup..................................................................................................................35
5.2.7 Power Management .................................................................................................................38
5.3 Save, recall, send and delete data....................................................................................................38
5.3.1 Color values .............................................................................................................................39
5.3.1.1 Automatic/manual color value storage ............................................................................39
5.3.1.2 Recall color values from the measured data memory .....................................................39
5.3.1.3 Send color values from the measured data memory.......................................................41
5.3.1.4 Delete color values from the measured data memory.....................................................42
5.3.2 Control charts for data from the AQA Log ................................................................................43
5.3.3 Data log (only LICO 690)..........................................................................................................44
5.3.3.1 Automatic/manual saving of single and multi-wavelength measurements ......................44
5.3.3.2 Recall single and multi-wavelength measurements from the measured data memory ...45
5.3.3.3 Send single and multi-wavelengths from the measured data memory............................46
5.3.3.4 Delete single and multi-wavelengths from the measured data memory..........................48
5.3.4 Wavelength scan and time course (LICO 690 only).................................................................48
5.3.4.1 Data storage from wavelength scan or time course ........................................................48
5.3.4.2 Recall stored data from wavelength scan or time course................................................49
5.3.4.3 Send data from wavelength scan or time course ............................................................49
5.3.4.4 Delete stored data from wavelength scan or time course ...............................................51
5.3.5 Trends ......................................................................................................................................51
5.4 Take and prepare samples................................................................................................................53
5
Table of Contents
5.5 Color measurement .......................................................................................................................... 54
5.5.1 Take a color measurement ...................................................................................................... 55
5.5.1.1 Touch-sensitive areas in measurement mode ................................................................ 56
5.5.1.2 Parameter setup options................................................................................................. 57
5.5.1.3 Change the color scale after a measurement ................................................................. 58
5.5.1.4 Change the measuring range after a measurement ....................................................... 58
5.5.2 Determination of the iodine color value.................................................................................... 58
5.5.3 Determination of the Hazen color value (Pt-Co or APHA method) .......................................... 59
5.5.4 Determination of the Gardner color value ................................................................................ 59
5.5.5 Determination of the Mineral oil color value (ASTM D 1500 and ISO 2049)............................ 59
5.5.6 Determination of the Saybolt color number (ASTM D 156)...................................................... 60
5.5.7 Color determinations only by LICO 690................................................................................... 60
5.5.7.1 Color determination according to the European Pharmacopoeia (EP) ........................... 60
5.5.7.2 Color determination according to the US Pharmacopoeia (USP) ................................... 63
5.5.7.3 Color determination according to the Chinese Pharmacopoeia (CP) ............................. 64
5.5.7.4 Determination of the Klett color value ............................................................................. 64
5.5.7.5 Determination of the AOCS Cc 13 e (Lovibond®) scale.................................................. 65
5.5.7.6 Determination of the Yellowness Index (ASTM D 1925)................................................. 65
5.5.7.7 Determination of the Hess-Ives color number................................................................. 65
5.5.7.8 Determination of the ADMI color number........................................................................ 65
5.5.7.9 Determination of the Acid wash color ............................................................................. 66
5.5.7.10 Determination of the ICUMSA color index .................................................................... 66
5.6 Measurement of color differences (LICO 690 only) .......................................................................... 67
5.6.1 Take a color difference measurement ..................................................................................... 67
5.6.1.1 View graph/table/values.................................................................................................. 69
5.6.2 Take a color difference measurement with stored reference values ....................................... 70
5.6.3 Add a reference to the reference list........................................................................................ 70
5.7 Photometry (LICO 690 only) ............................................................................................................. 71
5.7.1 Single Wavelength (absorbance, concentration and transmittance readings)......................... 71
5.7.1.1 Set up Single Wavelength mode..................................................................................... 71
5.7.1.2 Take single wavelength readings (single reading).......................................................... 73
5.7.2 Multi Wavelength mode – readings with more than one wavelength....................................... 73
5.7.2.1 Set the Reading mode at different wavelengths ............................................................. 73
5.7.2.2 Complete a reading in the Multi Wavelength mode ........................................................ 76
5.7.3 Time course of absorbance/transmittance............................................................................... 76
5.7.3.1 Time course setup parameters ....................................................................................... 76
5.7.3.2 Time course scan reading............................................................................................... 78
5.7.3.3 Analysis of time course data ........................................................................................... 78
5.7.4 Wavelength Scan mode – recording of absorbance and transmission spectrums .................. 79
5.7.4.1 Set up the wavelength scan............................................................................................ 80
5.7.4.2 Perform a wavelength scan ............................................................................................ 82
5.7.4.3 Work with reference scans.............................................................................................. 83

6
Table of Contents
Section 6 Advanced Operations ..........................................................................................................87
6.1 System Checks .................................................................................................................................87
6.1.1 Instrument Information .............................................................................................................87
6.1.2 Update the instrument software ...............................................................................................87
6.1.2.1 Software update with USB memory.................................................................................87
6.1.2.2 Software update with network connection.......................................................................88
6.1.3 Optical Checks .........................................................................................................................88
6.1.4 AQA Analytical Quality Assurance ...........................................................................................90
6.1.4.1 Standard Configuration....................................................................................................90
6.1.4.2 Perform AQA Standard Measurement.............................................................................91
6.1.5 Instrument backup....................................................................................................................92
6.1.6 Service menu ...........................................................................................................................93
6.1.7 Service time..............................................................................................................................93
6.1.8 Lamps operating time...............................................................................................................93
6.2 Toolbar ..............................................................................................................................................94
6.2.1 Log on ......................................................................................................................................94
6.2.2 Sample ID.................................................................................................................................94
6.2.3 Timer ........................................................................................................................................95
6.2.4 AQA..........................................................................................................................................95
6.2.5 Trends ......................................................................................................................................95
6.2.6 LICO Website ...........................................................................................................................95
Section 7 Maintenance..........................................................................................................................97
7.1 Cleaning requirements ......................................................................................................................97
7.1.1 Spectrophotometer...................................................................................................................97
7.1.2 Screen ......................................................................................................................................97
7.1.3 Cuvettes/cells ...........................................................................................................................98
7.2 Lamp replacement.............................................................................................................................98
7.3 Cell compartment (2) replacement ..................................................................................................100
Section 8 Troubleshooting .................................................................................................................103
Section 9 Replacement Parts .............................................................................................................107
9.1 Accessories.....................................................................................................................................107
9.2 Replacement Parts..........................................................................................................................107
Section 10 Limited warranty...............................................................................................................109
Index .....................................................................................................................................................111
7
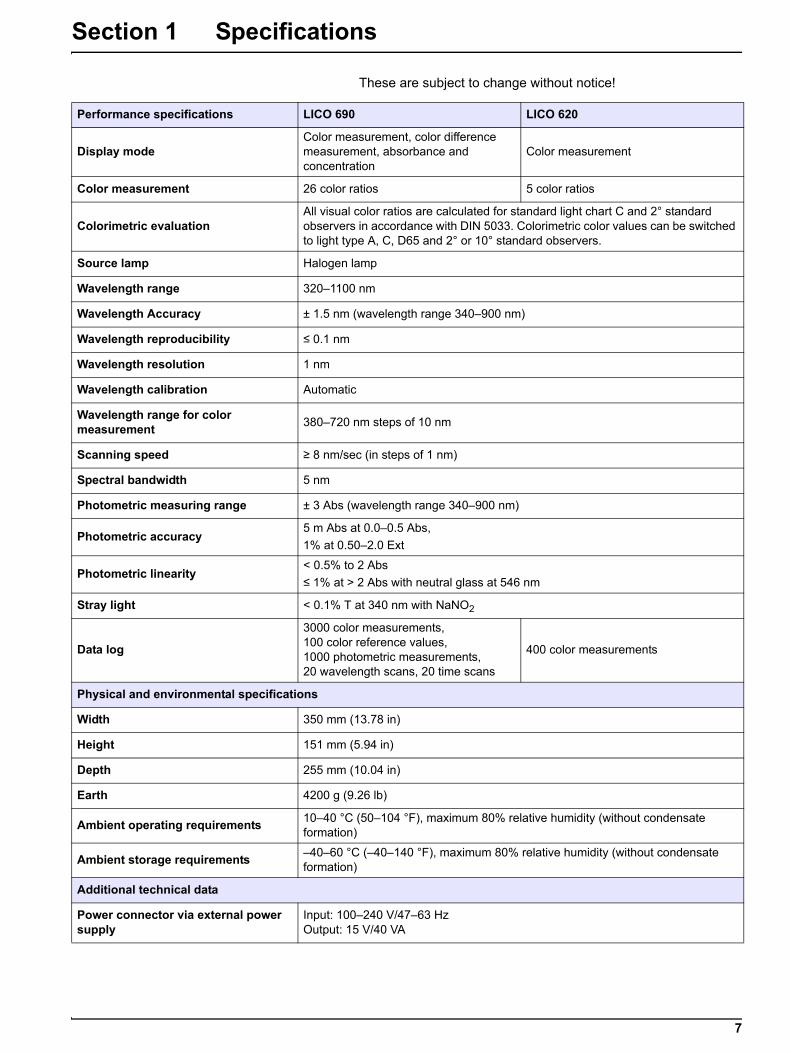
Section 1 Specifications
These are subject to change without notice!
Performance specifications LICO 690 LICO 620
Display modeColor measurement, color difference measurement, absorbance and concentration
Color measurement
Color measurement 26 color ratios 5 color ratios
Colorimetric evaluationAll visual color ratios are calculated for standard light chart C and 2° standard observers in accordance with DIN 5033. Colorimetric color values can be switched to light type A, C, D65 and 2° or 10° standard observers.
Source lamp Halogen lamp
Wavelength range 320–1100 nm
Wavelength Accuracy ± 1.5 nm (wavelength range 340–900 nm)
Wavelength reproducibility ≤ 0.1 nm
Wavelength resolution 1 nm
Wavelength calibration Automatic
Wavelength range for color measurement
380–720 nm steps of 10 nm
Scanning speed ≥ 8 nm/sec (in steps of 1 nm)
Spectral bandwidth 5 nm
Photometric measuring range ± 3 Abs (wavelength range 340–900 nm)
Photometric accuracy5 m Abs at 0.0–0.5 Abs,
1% at 0.50–2.0 Ext
Photometric linearity< 0.5% to 2 Abs
≤ 1% at > 2 Abs with neutral glass at 546 nm
Stray light < 0.1% T at 340 nm with NaNO2
Data log
3000 color measurements, 100 color reference values, 1000 photometric measurements, 20 wavelength scans, 20 time scans
400 color measurements
Physical and environmental specifications
Width 350 mm (13.78 in)
Height 151 mm (5.94 in)
Depth 255 mm (10.04 in)
Earth 4200 g (9.26 lb)
Ambient operating requirements10–40 °C (50–104 °F), maximum 80% relative humidity (without condensate formation)
Ambient storage requirements–40–60 °C (–40–140 °F), maximum 80% relative humidity (without condensate formation)
Additional technical data
Power connector via external power supply
Input: 100–240 V/47–63 HzOutput: 15 V/40 VA

8
Specifications
Interfaces
Use only shielded cable with maximum length of 3 m:
2x USB type A
1x USB type B
Use only shielded cable (for example STP, FTP, S/FTP) with maximum length of 20 m:
1x Ethernet
Housing rating IP40 (excluding interfaces and power supply)
Protection class Class I
This product has been tested to the requirements of CAN/CSA-C22.2 No. 61010-1, second edition, including Amendment 1, or a later version of the same standard incorporating the same level of testing requirements.
Performance specifications LICO 690 LICO 620

9
Section 2 General Information
2.1 Safety informationRead through the entire user manual carefully before you unpack the device, set up and put into operation. Pay attention to all danger and caution statements. Failure to do so could result in serious injury to the operator or damage to the equipment.
To make sure that the protection provided by this instrument is not impaired, do not use or install this instrument in any manner other than that specified in these operating instructions.
Note: Information that supplements points in the main text.
2.1.1 Precautionary labels
Read all labels and tags attached to the instrument. Personal injury or damage to the instrument could occur if not observed. For symbols attached to the device, corresponding warning notes are found in the user manual.
D A N G E RIndicates a potentially or imminently hazardous situation that, if not avoided, results in death or serious injury.
WA R N I N GIndicates a potentially or imminently hazardous situation that, if not avoided, may result in death or serious injury.
C A U T I O NIndicates a potentially hazardous situation that may result in minor or moderate injury.
N O T I C EIndicates a situation that, if it is not avoided, can lead to damage to the device. Information that requires special emphasis.
This symbol may be attached to the device and references the operation- and/or safety notes in the user manual.
This symbol on the device is an indication of hot surfaces.
Electrical equipment marked with this symbol may not be disposed of in European domestic or public disposal systems after 12 August 2005. In conformity with European local and national regulations (EU Directive 2002/96/EC), European electrical equipment users must now return old or end-of life equipment to the manufacturer for disposal at no charge to the user.
Note: For return for recycling, please contact the equipment manufacturer or supplier for instructions on how to return end-of-life equipment, manufacturer-supplied electrical accessories, and all auxiliary items for proper disposal.

10
General Information
2.1.2 Safety around source lamps
The source lamp is operated at high temperatures.
To prevent electric shock, disconnect the instrument from the power source before replacing the lamp.
2.1.3 Chemical and biological safety
Normal operation of this device may require the use of chemicals or samples that are biologically unsafe.
• Observe all cautionary information printed on the original solution containers and safety data sheets prior to their use.
• Dispose of all consumed solutions in accordance with the local and national regulations and laws.
• Select the type of protective equipment suitable to the concentration and quantity of the dangerous material being used.
2.2 Overview of productThe LICO 690 and LICO 620 instruments are VIS spectral-photometers with wavelength ranges from 320 to 1100 nm. The instruments can perform a precise colorimetric analysis in accordance with ISO/ASTM standards with a single measurement and display the result in the form of classic color systems such as iodine, Hazen or Gardner color values. The instruments support multiple languages.
The LICO 690 is supplied with 26 color value calculations, while the LICO 620 is supplied with five color value calculations (Iodine color, Hazen color, Gardner color, Saybolt color and ASTM D 1500 color numbers).
WA R N I N GThe manufacturer is not responsible for any damages due to misapplication or misuse of this product including, without limitation, direct, incidental and consequential damages, and totally excludes such damages as permitted under applicable laws.
The user is solely responsible to identify critical application risks and install appropriate mechanisms to protect processes during a possible equipment malfunction.
C A U T I O NBurn hazard. Allow the lamp(s) to cool for at least 30 minutes before maintaining/replacing them.
D A N G E RPotential danger with contact with chemical/biological substances.
Working with chemical samples, standards and reagents can be dangerous. Make yourself familiar with the necessary safety procedures and the correct handling of the chemicals before use and read and follow all relevant safety data sheets.
11
General Information
The LICO 690 contains the following programs and operating modes in addition to the color measurement: single wavelength mode, multi-wavelength mode, wavelength scan and time scan mode. The digital measurements are displayed in the dimensional units of concentration, absorbance or % transmittance, making the LICO 690 universally suitable for lab analysis.

12
General Information
13
Section 3 Installation
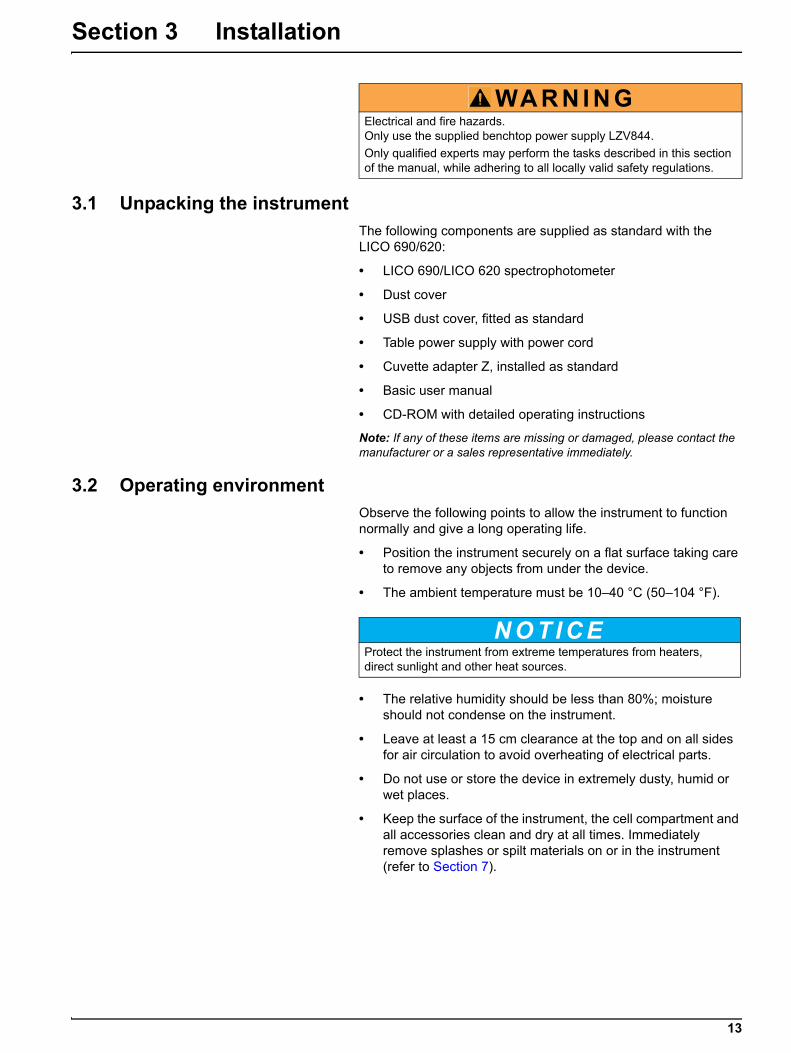
3.1 Unpacking the instrumentThe following components are supplied as standard with the LICO 690/620:
• LICO 690/LICO 620 spectrophotometer
• Dust cover
• USB dust cover, fitted as standard
• Table power supply with power cord
• Cuvette adapter Z, installed as standard
• Basic user manual
• CD-ROM with detailed operating instructions
Note: If any of these items are missing or damaged, please contact the manufacturer or a sales representative immediately.
3.2 Operating environmentObserve the following points to allow the instrument to function normally and give a long operating life.
• Position the instrument securely on a flat surface taking care to remove any objects from under the device.
• The ambient temperature must be 10–40 °C (50–104 °F).
• The relative humidity should be less than 80%; moisture should not condense on the instrument.
• Leave at least a 15 cm clearance at the top and on all sides for air circulation to avoid overheating of electrical parts.
• Do not use or store the device in extremely dusty, humid or wet places.
• Keep the surface of the instrument, the cell compartment and all accessories clean and dry at all times. Immediately remove splashes or spilt materials on or in the instrument (refer to Section 7).
WA R N I N GElectrical and fire hazards. Only use the supplied benchtop power supply LZV844.
Only qualified experts may perform the tasks described in this section of the manual, while adhering to all locally valid safety regulations.
N O T I C EProtect the instrument from extreme temperatures from heaters, direct sunlight and other heat sources.

14
Installation
3.3 Front and back view
Figure 1 Front view
1 USB port type A 3 Touch screen
2 Cuvette compartment cover 4 On/off switch
15
Installation
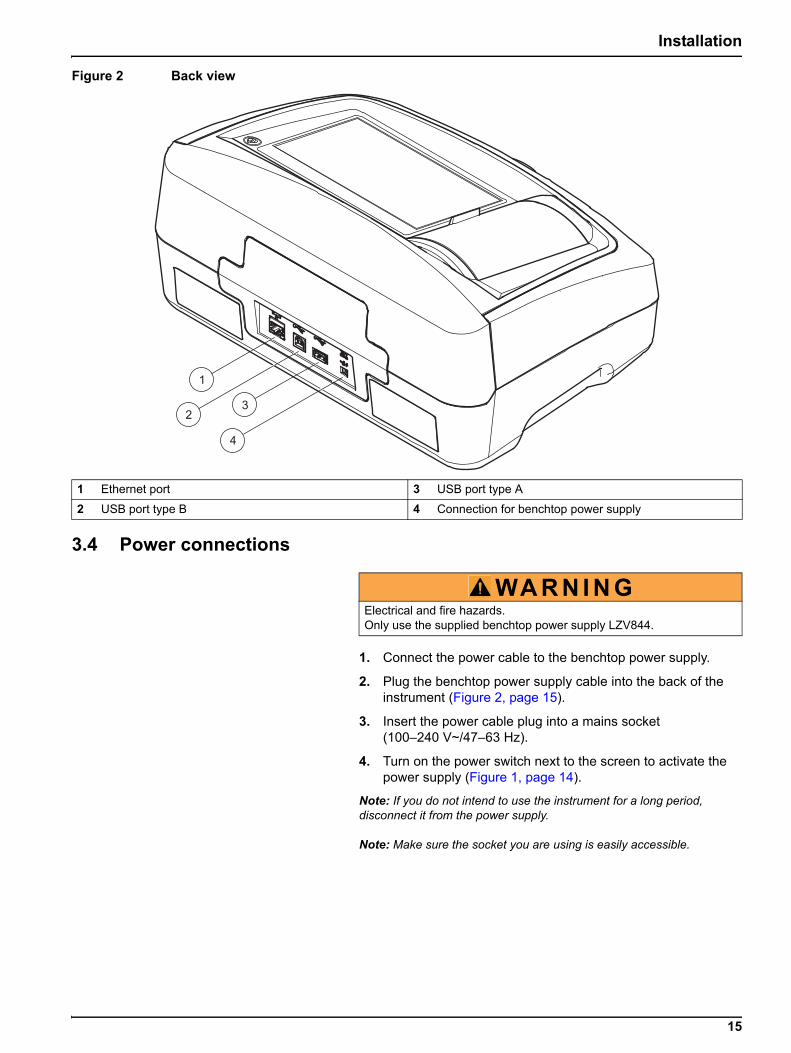
Figure 2 Back view
3.4 Power connections
1. Connect the power cable to the benchtop power supply.
2. Plug the benchtop power supply cable into the back of the instrument (Figure 2, page 15).
3. Insert the power cable plug into a mains socket (100–240 V~/47–63 Hz).
4. Turn on the power switch next to the screen to activate the power supply (Figure 1, page 14).
Note: If you do not intend to use the instrument for a long period, disconnect it from the power supply.
Note: Make sure the socket you are using is easily accessible.
1 Ethernet port 3 USB port type A
2 USB port type B 4 Connection for benchtop power supply
WA R N I N GElectrical and fire hazards. Only use the supplied benchtop power supply LZV844.

16
Installation
3.5 InterfacesThe instrument has three USB ports and one Ethernet port as standard. They are located on the front and rear of the instrument (Figure 1 Figure 2, page 15).
The USB type A ports are used for communications with a printer, USB memory stick or keyboard. A USB memory stick can be used to update the instrument software.
The USB type B port is used for communications with a PC. The optional Hach Lange Online Data software must be installed on the PC for this use.
A USB hub may be used to connect several accessories at a time.
Note: USB cables must not be longer than 3 m.
These USB ports permit data to be exported to a printer or PC and also allow the instrument software to be upgraded (refer to section 6.1.2, page 87). The Ethernet port supports real-time data transfer in local networks, LIMS systems or SC controllers. Only use a shielded cable (e.g. STP, FTP, S/FTP) with a maximum length of 20 m for the Ethernet port.
3.6 Cuvette compartments and cuvette adapters
3.6.1 Cuvette compartments and adapter
Open the cuvette compartments by sliding the cuvette compartment cover to the left.
The cover lowers to the side next to the cuvette compartments.
Note: If there are long intervals between uses, close the cuvette compartment cover to protect the optics of the instrument from dust and impurities.
The instrument has two cuvette compartments (Figure 3). Only one cell type at a time can be used for a reading.
Cell compartment (1) for:
• 11 mm round cuvettes
Note: Insert cuvette adapter Z into the cuvette compartment (2).
Table 1 Interfaces
Interfaces Description
USB (Type A) This USB port can be used to connect a printer, a USB memory stick or a keyboard.
USB (Type B)This USB port is intended only for the connection between the instrument and a PC (when the relevant software is installed).
EthernetThe Ethernet port is intended for data transfer to a PC without installed software or in a local network . Only use a shielded cable (e.g. STP, FTP, S/FTP) with a maximum length of 20 m for the Ethernet port.

17
Installation
Cell compartment (2) for:
The following cell types can be used in cell compartment (2).
• Without cuvette adapter Z in the cuvette compartment (2), you can insert 50 mm cuvettes.
• With cuvette adapter Z: 10 mm square cuvettes.
Note: These cuvettes must be inserted with cuvette adapter Z.
Note: In the event of severe contamination, you can replace the cuvette compartment (2) (see chapter 7.3, page 100).
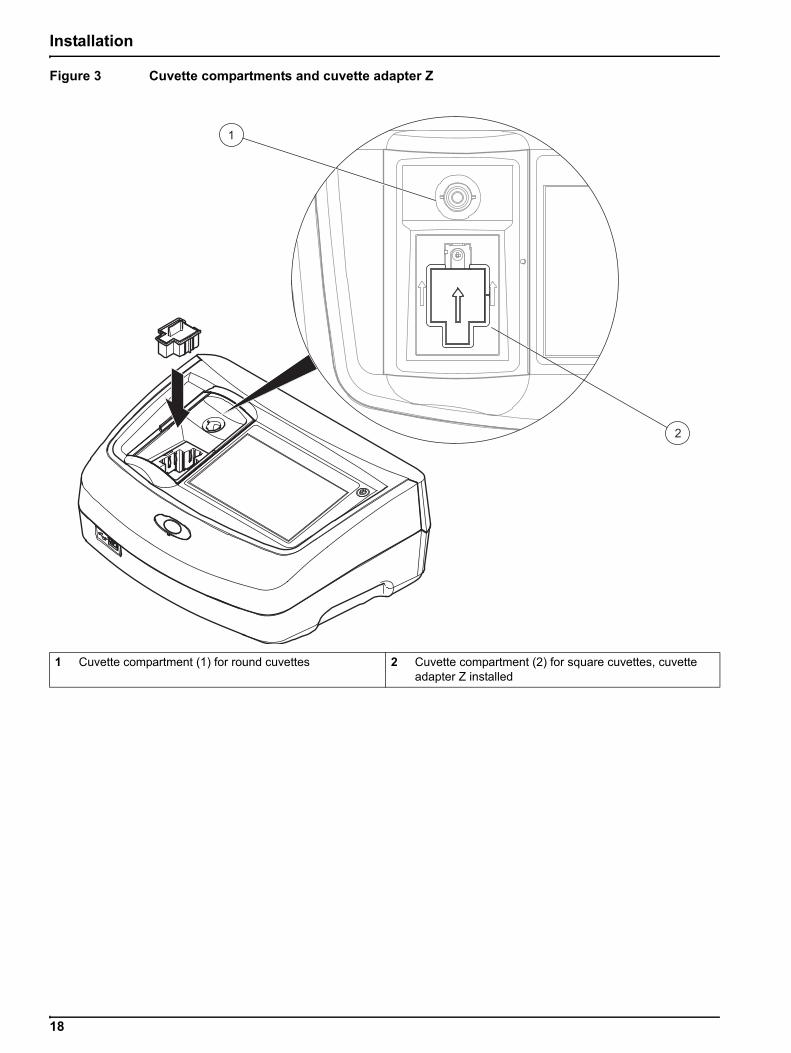
3.6.2 Installation of cuvette adapter Z
1. Open the cuvette compartment.
2. Insert cuvette adapter Z into the cuvette compartment (2) so that the arrow on the cuvette adapter is pointing toward the cuvette compartment (1) (Figure 3).
Note: The arrow on the cuvette adapter indicates the direction of the light beam path.
18
Installation
Figure 3 Cuvette compartments and cuvette adapter Z
1 Cuvette compartment (1) for round cuvettes 2 Cuvette compartment (2) for square cuvettes, cuvette adapter Z installed

19
Section 4 Start Up
4.1 Switch on the instrument, startup process1. Connect the power cable to the mains outlet.
2. Switch on the instrument by pressing the power switch next to the screen.
3. The instrument starts automatically with a startup process lasting approximately 45 seconds. The screen displays the manufacturer's logo. At the end of the startup process, a startup melody is heard.
Note: Wait approximately 20 seconds before switching on again so as not to damage the electronics and mechanics of the instrument.
4.2 Language selection
The software supports multiple languages. The first time the instrument is switched on, the language selection screen will be shown automatically after the startup process.
1. Select the required language.
2. Press OK to confirm the language selection. The self-check will then start automatically.
Change the language setting
The instrument functions in the selected language until the option is changed.
1. Turn the instrument on.
2. During the startup process, touch any point on the screen and maintain contact until the option for selecting a language is shown (approximately 45 seconds).
3. Select the required language.
4. Press OK to confirm the language selection. The self-check will then start automatically.
4.3 Self-check
Each time the instrument is powered up, a test program begins.
During the course of this program (approx. 25 seconds), system tests, lamp tests, filter calibration, wavelength calibration and voltage tests can be carried out. Each test that functions correctly is marked accordingly.
Note: For error messages during the test program, refer to Section 8, page 103.
N O T I C EAll screen displays in this operating manual correspond to the LICO 690. The screen displays of the LICO 620 may differ.

20
Start Up
The Main Menu is displayed when diagnostics are completed.
Note: section 5.1.3, page 22 contains a detailed description of the main menu.
4.4 Sleep mode
The instrument can be put into sleep mode.
1. Briefly press the power switch next to the screen.
The "Sleep mode" message is shown. The screen will then switch off automatically.
2. To switch on, press the power switch next to the screen.The self-check will start automatically. After that, the instrument is ready to use.
4.5 Power off the instrument1. Press the power switch next to the screen for
approx. 5 seconds.

21
Section 5 Standard programs
5.1 Overview
5.1.1 Tips for using the touch screenThe whole screen responds to touch. To choose an option, tap with a fingernail, fingertip, an eraser or a specialised stylus. Do not touch the screen with sharp objects, such as the tip of a ballpoint pen.
• Do not place anything on top of the screen, to prevent damage or scratching on the screen.
• Press buttons, words or icons to select them.
• Use scroll bars to move up and down long lists very quickly. Press and hold the scroll bar, then move up or down to move through the list.
• Highlight an item from a list by pressing it once. When the item has been successfully selected, it will be displayed as reversed text (light text on a dark background).
5.1.2 Use of the alphanumeric keypad
This display is used to enter letters, numbers and symbols as needed when programming the instrument. Unavailable options are disabled (grayed out). The icons on the right and left of the screen are described in Table 2.
The central keypad changes to reflect the chosen entry mode. Press a key repeatedly until the desired character appears on the screen. A space can be entered by using the underscore on the YZ_ key.
Press Cancel to cancel an entry, or press OK to confirm an entry.
Note: It is also possible to use a USB keyboard (with US keyboard layout) or a hand-held USB barcode scanner (refer to Section 9, page 107).
Table 2 Alphanumeric keypad
Icon / key Description Function
ABC/abc Alphabetic Toggles the character input mode between upper and lower case.
# % Symbols Punctuation, symbols and numerical sub- and superscripts may be entered..
123 Numeric For entering regular numbers..
CE Clear Entry Clear the entry.
Left Arrow Back Deletes the current character and goes back one position.
Right Arrow Next Navigates to the next space in an entry.
22
Standard programs
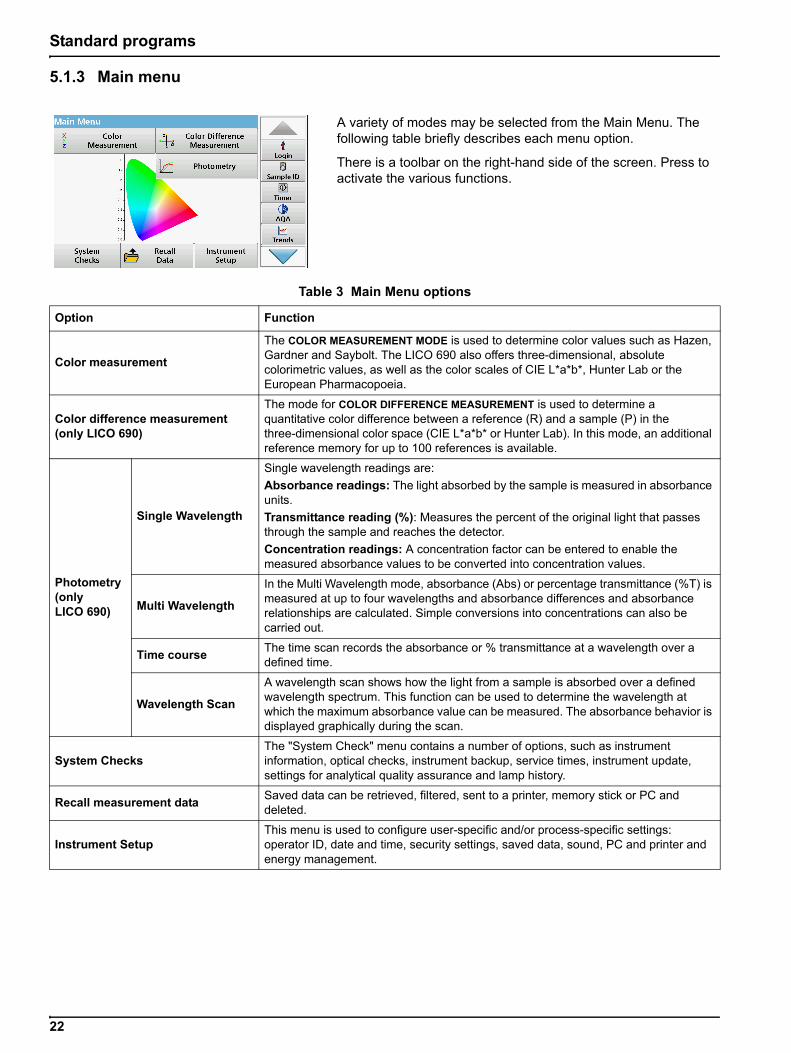
5.1.3 Main menu
A variety of modes may be selected from the Main Menu. The following table briefly describes each menu option.
There is a toolbar on the right-hand side of the screen. Press to activate the various functions.
Table 3 Main Menu options
Option Function
Color measurement
The COLOR MEASUREMENT MODE is used to determine color values such as Hazen, Gardner and Saybolt. The LICO 690 also offers three-dimensional, absolute colorimetric values, as well as the color scales of CIE L*a*b*, Hunter Lab or the European Pharmacopoeia.
Color difference measurement (only LICO 690)
The mode for COLOR DIFFERENCE MEASUREMENT is used to determine a quantitative color difference between a reference (R) and a sample (P) in the three-dimensional color space (CIE L*a*b* or Hunter Lab). In this mode, an additional reference memory for up to 100 references is available.
Photometry(only LICO 690)
Single Wavelength
Single wavelength readings are:
Absorbance readings: The light absorbed by the sample is measured in absorbance units.
Transmittance reading (%): Measures the percent of the original light that passes through the sample and reaches the detector.
Concentration readings: A concentration factor can be entered to enable the measured absorbance values to be converted into concentration values.
Multi Wavelength
In the Multi Wavelength mode, absorbance (Abs) or percentage transmittance (%T) is measured at up to four wavelengths and absorbance differences and absorbance relationships are calculated. Simple conversions into concentrations can also be carried out.
Time courseThe time scan records the absorbance or % transmittance at a wavelength over a defined time.
Wavelength Scan
A wavelength scan shows how the light from a sample is absorbed over a defined wavelength spectrum. This function can be used to determine the wavelength at which the maximum absorbance value can be measured. The absorbance behavior is displayed graphically during the scan.
System ChecksThe "System Check" menu contains a number of options, such as instrument information, optical checks, instrument backup, service times, instrument update, settings for analytical quality assurance and lamp history.
Recall measurement dataSaved data can be retrieved, filtered, sent to a printer, memory stick or PC and deleted.
Instrument SetupThis menu is used to configure user-specific and/or process-specific settings: operator ID, date and time, security settings, saved data, sound, PC and printer and energy management.

23
Standard programs
5.2 Instrument Setup
1. In the main menu, select the menu option Instrument setup.
A selection of functions appears in order to configure the functions of the instrument.
5.2.1 Operator IDUse this option to enter up to 30 sets of operator initials (up to ten characters each) into the instrument. This feature helps record which operator measured each sample.
1. Press Operator ID in "Instrument setup".
2. Press Options > New to enter a new operator ID.
Note: If no operator ID has yet been entered, the alphanumeric keyboard is immediately displayed.
3. Use the alphanumeric keypad to enter a new operator ID.
4. Press OK to confirm the entry.
5. Choose an icon for the operator ID using the Left Arrow and Right Arrow.
6. Press Operator password to protect the operator ID with a password.
7. Use the alphanumeric keypad to enter an operator password.
8. Press OK to confirm the entry.
9. Press Cancel to delete the complete entry for the operator ID. Press Back to reach to the input screen for operator ID. Press OK to confirm the entry. The following screen is displayed.

24
Standard programs
10. With Back the device returns to the menu "Instrument Setup".Press Logout to log out of an active operator ID.Press Login to activate a selected operator ID.Press Options to enter, change or delete additional operator IDs. The following screen is displayed.
11. Press New to enter another operator ID.Press Delete to delete an operator ID.Press Edit to edit an operator ID.
5.2.2 Sample IDUse this option to enter up to 100 different sample designations (up to 20 characters each) into the instrument. Sample IDs can be used to specify the sample location or other sample specific information, for example.
1. Press Sample ID in the toolbar on the right.
2. Press New to enter a new sample ID.
Note: If no sample ID has been entered yet, the alphanumeric keyboard is immediately displayed.
3. Use the alphanumeric keypad to enter a new Sample ID.
Note: If a USB Barcode handset scanner (refer to section 5.2.2.1, page 25) is connected, Sample IDs can also be scanned.
4. Press OK to confirm the entry.
5. Assign the current time and date, a sequential number or a colour to the sample ID.

25
Standard programs
6. To number the sample IDs sequentially (e. g. Inflow (01) etc.), press Add Number.
• Use the arrow keys to specify the first number of the sequence.
• Use the key between the arrow keys to enter the first number of the sequence using the alphanumeric keypad.
7. Press OK to return to the "Instrument Setup" menu.
The Sample ID is activated. Each Sample ID is automatically numbered in ascending order after a reading. The number is shown in parentheses behind the Sample ID.
8. Press Back to return the instrument to the "Instrument Setup" menu.Press Off to switch off the active sample ID.Press Select to activate the selected sample ID.Use Options to enter, change or delete additional sample IDs. The following screen is displayed:
9. Press New to enter another sample ID.Press Delete to delete a sample ID.Press Edit to edit a sample ID.Select Import Sample ID List to import *.txt and *.csv files via a USB stick or network; see section 5.2.2.3, page 26.
5.2.2.1 Sample ID with hand-held scanner method 11. Connect the hand-held scanner to the USB port.
Successful connection is indicated by a sound.
2. Press Sample ID > Options and NEW.
3. Read barcode with hand-held scanner.

26
Standard programs
4. The sample ID can have the current date and time, a sequential number and a colour allocated to it.Select the required options or a colour.
5. Press OK to confirm the entry.
6. Press New again and repeat the process for each barcode.
5.2.2.2 Sample ID with hand-held scanner method 21. Read the sample ID in measurement mode with the
hand-held scanner and calibrate the cuvette.
The sample ID is saved togther with the measured value but is not transferred to the list of sample IDs.
Note: To delete a sample ID, activate the ID by selecting it and pressing Delete.
Note: A sample ID can be entered or changed in Reading Mode. To do this, press Options > More > Instrument Setup. If a sample ID is already assigned, select the "Sample ID" symbol.
5.2.2.3 Import sample ID list
1. Create an external sample ID list with a spreadsheet program.
Four columns are permitted; column 1 contains the sequential number, column 2 the sample designation, columns 3 and 4 are optional.
Headings and comment lines must begin with #.
2. Create a folder named "Sample ID" on a USB stick or in your established network.
3. Save the sample ID list with Save As in the format CSV or UNICODE-TXT in the folder "Sample ID".
4. Connect the instrument to the USB stick or network.
All *.TXT and *.CSV files in the Sample ID folder will be displayed for selection.

27
Standard programs
5. Select the desired file with OK.
6. Transfer the displayed sample ID list with DONE.
5.2.3 Security settingsThe "Security" menu contains a variety of security settings to control access to various functions.
All functions can be allocated to three different security levels:
• not secured: every operator can make changes in this area.
• one key: every operator assigned this security level can make changes to non-secured functions and functions with one key.
• two keys: every operator assigned this security level can make changes in all functions
1. Press Security in the "Instrument Setup" menu.
2. In order to open the Security List, assign a password as security administrator. Press Security Password.
3. Enter a new security password (up to 10 characters long) via the alphanumeric keypad, and confirm with OK.
4. Press Security List to access various functions with security level 1 or 2.

28
Standard programs
5. Select the required function and press Setup.
6. Select the required security level (two keys, one key or off) and confirm using OK.
7. Press OK to return to the "Security" menu.
8. Press On to activate the new settings of the security list.
9. Press OK to return to the "Instrument Setup" menu.
Note: The alphanumeric keypad for entering the password appears when a user tries to reach a locked setting.
5.2.3.1 Assign operator security levelEvery operator with an operator ID can be assigned a security level. This assignment is connected to the operator password. Setup must be coordinated with the security administrator and the operator.
1. Press Operator ID in "Instrument setup".
2. Enter the security password and confirm with OK.
3. Set up an operator ID (refer to section 5.2.1).
29
Standard programs
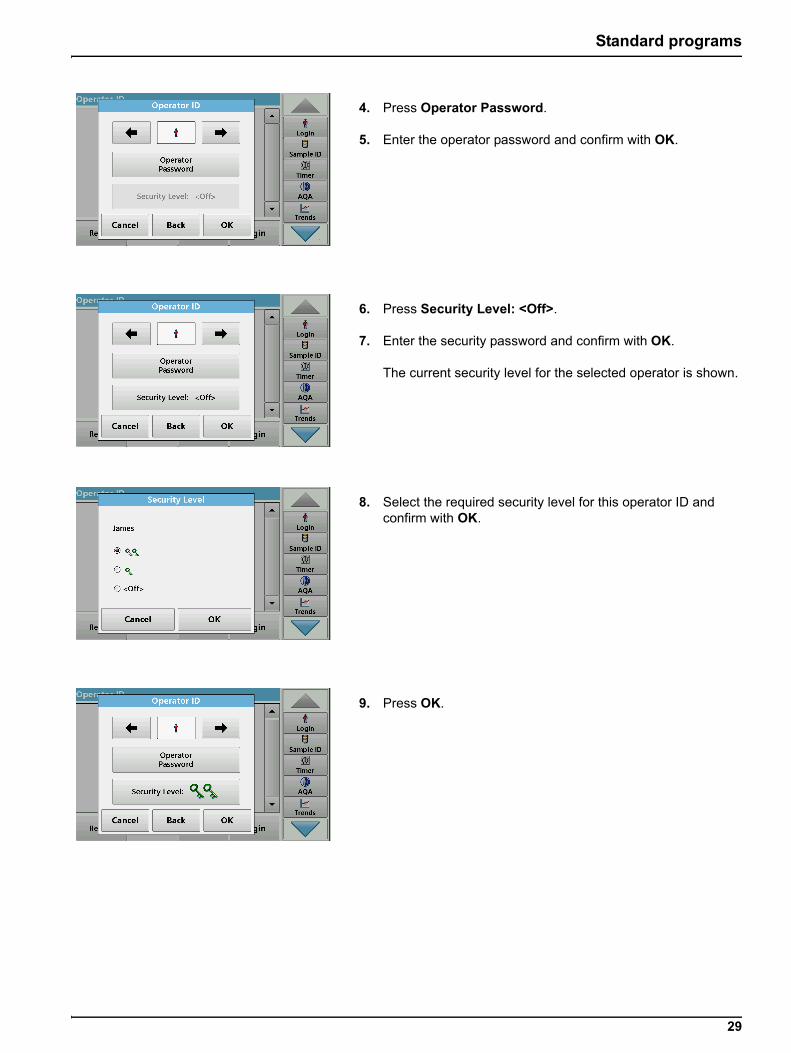
4. Press Operator Password.
5. Enter the operator password and confirm with OK.
6. Press Security Level: <Off>.
7. Enter the security password and confirm with OK.
The current security level for the selected operator is shown.
8. Select the required security level for this operator ID and confirm with OK.
9. Press OK.

30
Standard programs
The operator ID is displayed with the selected security level.
10. Activate the selected operator ID by pressing Login.
11. Enter the operator password.
12. Confirm with OK and return to "Instrument Setup".
5.2.3.2 Deactivate password
1. Press Security in the "Instrument Setup" menu.
2. Enter the security password and confirm with OK.
3. Press Off to deactivate the settings of the Security List.
4. Press OK and return to the "Instrument Setup" menu.
Note: Use this function to delete the former password or to enter a new one.
5.2.4 Date and time
1. Press Date and Time in "Instrument setup".
31
Standard programs
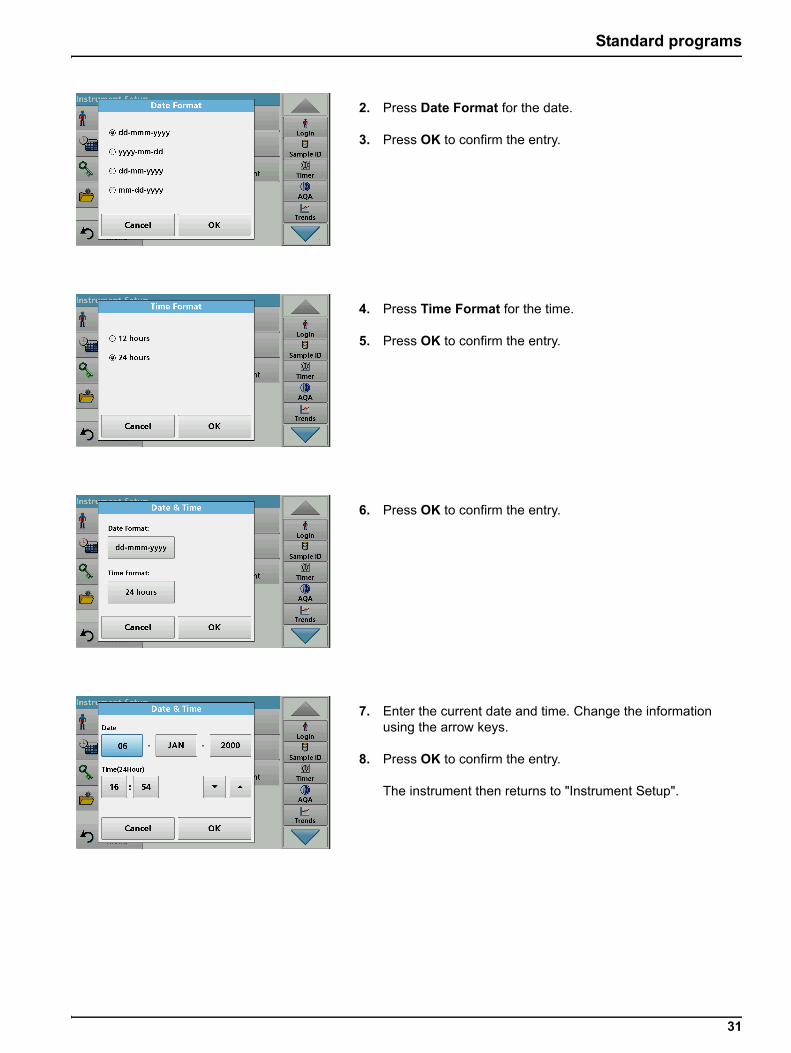
2. Press Date Format for the date.
3. Press OK to confirm the entry.
4. Press Time Format for the time.
5. Press OK to confirm the entry.
6. Press OK to confirm the entry.
7. Enter the current date and time. Change the information using the arrow keys.
8. Press OK to confirm the entry.
The instrument then returns to "Instrument Setup".

32
Standard programs
5.2.5 Sound settings
1. Press Sound Settings in "Instrument Setup".
The following options will be displayed:
• All: Activates/deactivates a sound with a variable volume for every function, with the exception of the timer.
• Touch screen: Activates/deactivates a short sound with variable volume every time the screen is touched.
• Reading done: Activates/deactivates a short sound with variable volume when the reading is done.
• Timer: Sets short/long sound with variable volume when timer has ended.
• Startup: Activates/deactivates a startup melody with variable volume when the test program is started.
• Warning: Activates/deactivates a short sound with variable volume if there is an error message.
• Shutdown: Activates/deactivates a short sound with variable volume when shutting down.
2. Select the required action.
3. Press Setup and complete the required settings.
4. Press OK to confirm the entry.
5. Press OK to confirm the entry.
The instrument then returns to "Instrument Setup".
5.2.6 PC and printerAs standard, the instrument has one Ethernet port and 2 USB ports on the rear of the instrument, as well as one USB port on the front (see Figure 1 and Figure 2, page 15). These interfaces can be used for exporting data and graphics to a printer, updating data and transferring data to a PC and in a network. They are intended for connecting a USB memory, an external USB keypad or a USB barcode hand-held scanner.
Note: With a USB hub, you can connect various accessory instruments at the same time.
A USB memory stick is used to update data, refer to section 6.1.2, page 87.
Note: A shielded USB cable must not be longer than 3 m!
33
Standard programs
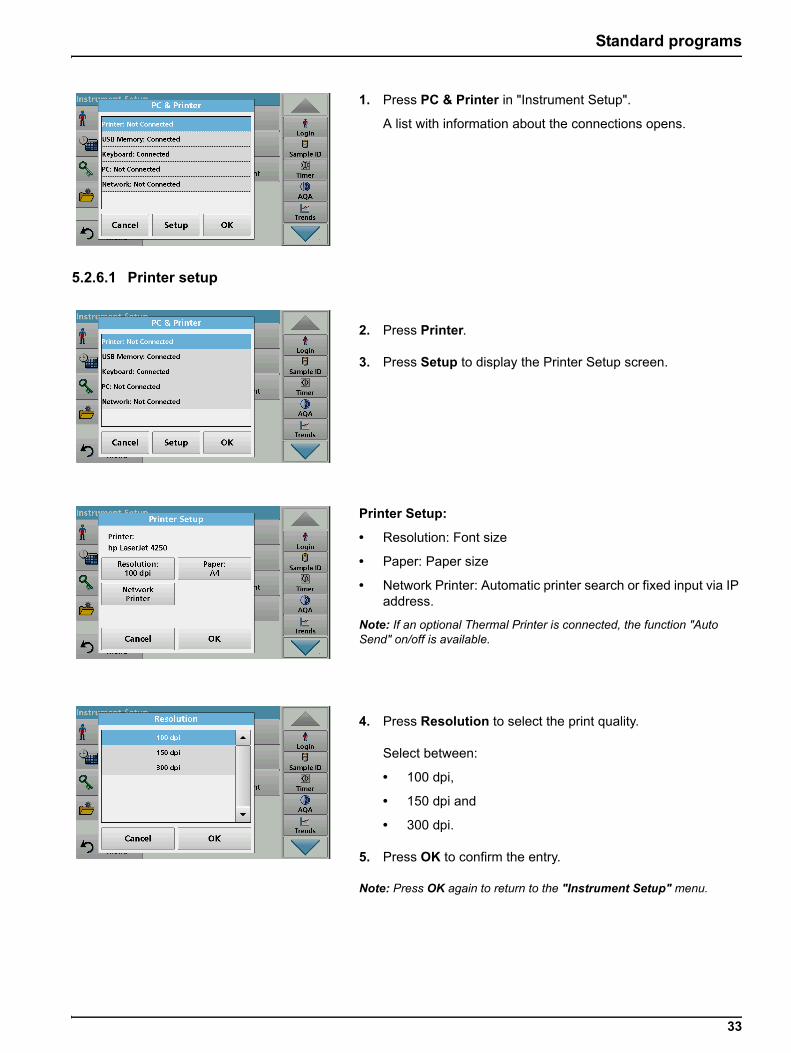
1. Press PC & Printer in "Instrument Setup".
A list with information about the connections opens.
5.2.6.1 Printer setup
2. Press Printer.
3. Press Setup to display the Printer Setup screen.
Printer Setup:
• Resolution: Font size
• Paper: Paper size
• Network Printer: Automatic printer search or fixed input via IP address.
Note: If an optional Thermal Printer is connected, the function "Auto Send" on/off is available.
4. Press Resolution to select the print quality.
Select between:
• 100 dpi,
• 150 dpi and
• 300 dpi.
5. Press OK to confirm the entry.
Note: Press OK again to return to the "Instrument Setup" menu.
34
Standard programs
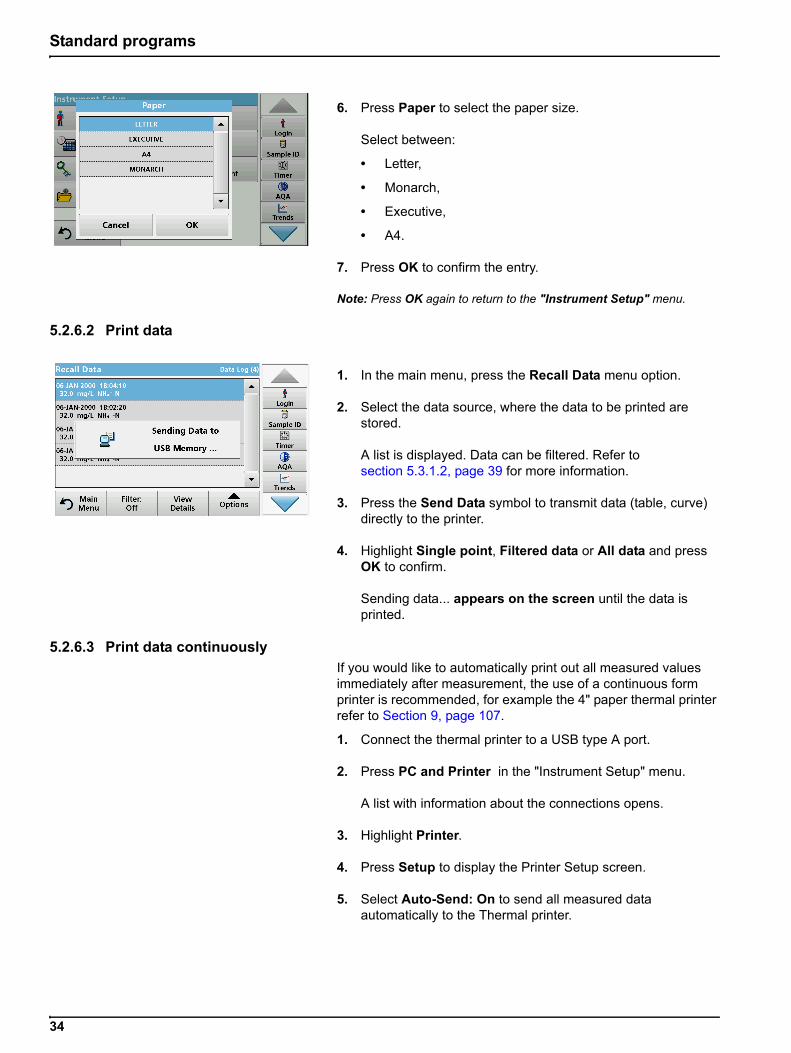
6. Press Paper to select the paper size.
Select between:
• Letter,
• Monarch,
• Executive,
• A4.
7. Press OK to confirm the entry.
Note: Press OK again to return to the "Instrument Setup" menu.
5.2.6.2 Print data
1. In the main menu, press the Recall Data menu option.
2. Select the data source, where the data to be printed are stored.
A list is displayed. Data can be filtered. Refer to section 5.3.1.2, page 39 for more information.
3. Press the Send Data symbol to transmit data (table, curve) directly to the printer.
4. Highlight Single point, Filtered data or All data and press OK to confirm.
Sending data... appears on the screen until the data is printed.
5.2.6.3 Print data continuouslyIf you would like to automatically print out all measured values immediately after measurement, the use of a continuous form printer is recommended, for example the 4" paper thermal printer refer to Section 9, page 107.
1. Connect the thermal printer to a USB type A port.
2. Press PC and Printer in the "Instrument Setup" menu.
A list with information about the connections opens.
3. Highlight Printer.
4. Press Setup to display the Printer Setup screen.
5. Select Auto-Send: On to send all measured data automatically to the Thermal printer.

35
Standard programs
5.2.6.4 Network setup
The instrument supports communication in local networks. For the setup of an Ethernet communication in networks, a special configuration is required. The manufacturer recommends support from a network administrator. Only use a shielded cable (e.g. STP, FTP, S/FTP) with a maximum length of 20 m for the Ethernet port. This section describes the setting options for the photometer in relation to network communication.
The connection parameters must be configured for data transfer to a PC or connection to a network.
1. Press PC & Printer in "Instrument Setup".
2. Press Network > Setup.
3. Press On and then LICO6xx IP: Automatic.
4. Press IP address.An IP address is used to send data from a sender to a pre-defined recipient.
• If the IP for the instrument is automatically assigned in the network, no further settings are necessary. A hostname can optionally be assigned.
• If the instrument address is fixed, the connection must be configured.
5. To configure the IP address, press Fix.
N O T I C ENetwork and access point security is the responsibility of the customer that uses the wireless instrument. The manufacturer will not be liable for any damages, inclusive however not limited to indirect, special, consequential or incidental damages, that have been caused by a gap in, or breach of network security.
36
Standard programs
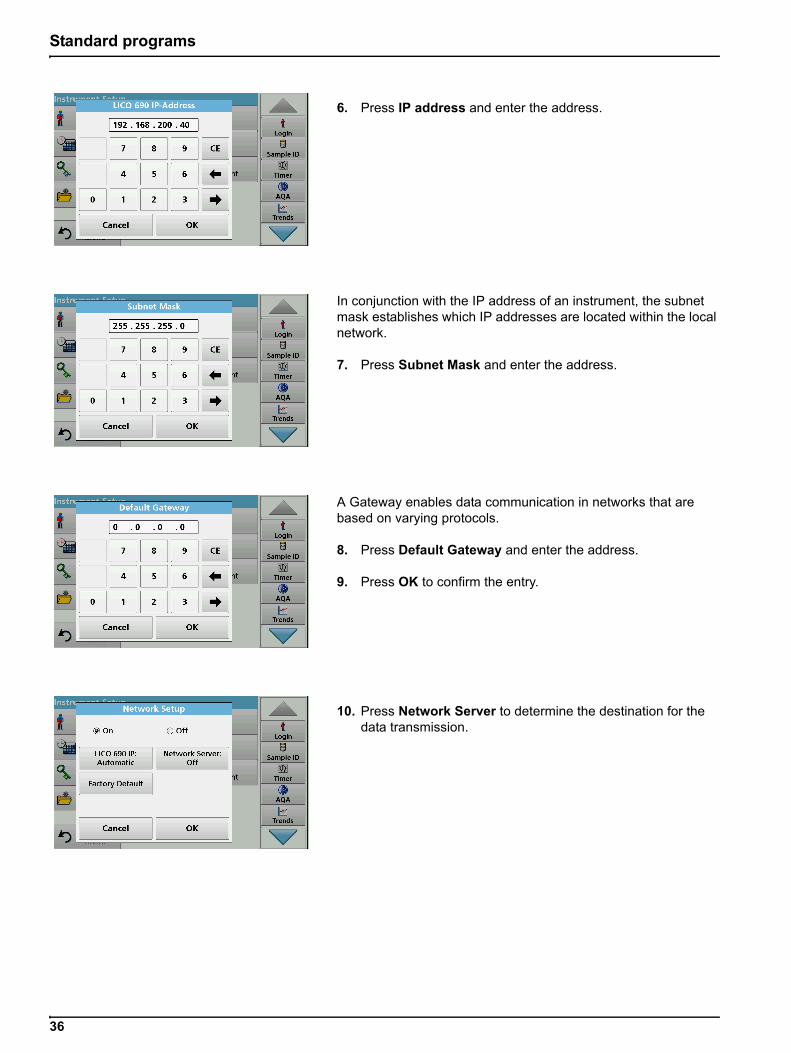
6. Press IP address and enter the address.
In conjunction with the IP address of an instrument, the subnet mask establishes which IP addresses are located within the local network.
7. Press Subnet Mask and enter the address.
A Gateway enables data communication in networks that are based on varying protocols.
8. Press Default Gateway and enter the address.
9. Press OK to confirm the entry.
10. Press Network Server to determine the destination for the data transmission.

37
Standard programs
11. Press Netdrive and run a netdrive setup.Alternatively, select FTP and run FTP Setup.The procedures are completely identical. As an example, Netdrive Setup is described here.
The target site can be defined by IP address or a server name.
12. Press IP-Address and enter the IP address or select Server Name and enter a server name.
13. Press Data Folder and enter the target folder name.
Note: A folder with the selected name must exist on the target system. Additionally, the folder must be shared with the operator, using the corresponding password.
14. Press OK to confirm the entry.
User and password must be identical to the settings on the target system.
15. Press User and enter the user designation.
16. Press OK to confirm.
17. Press Password and enter the password.
18. Press OK to confirm the entry.
38
Standard programs
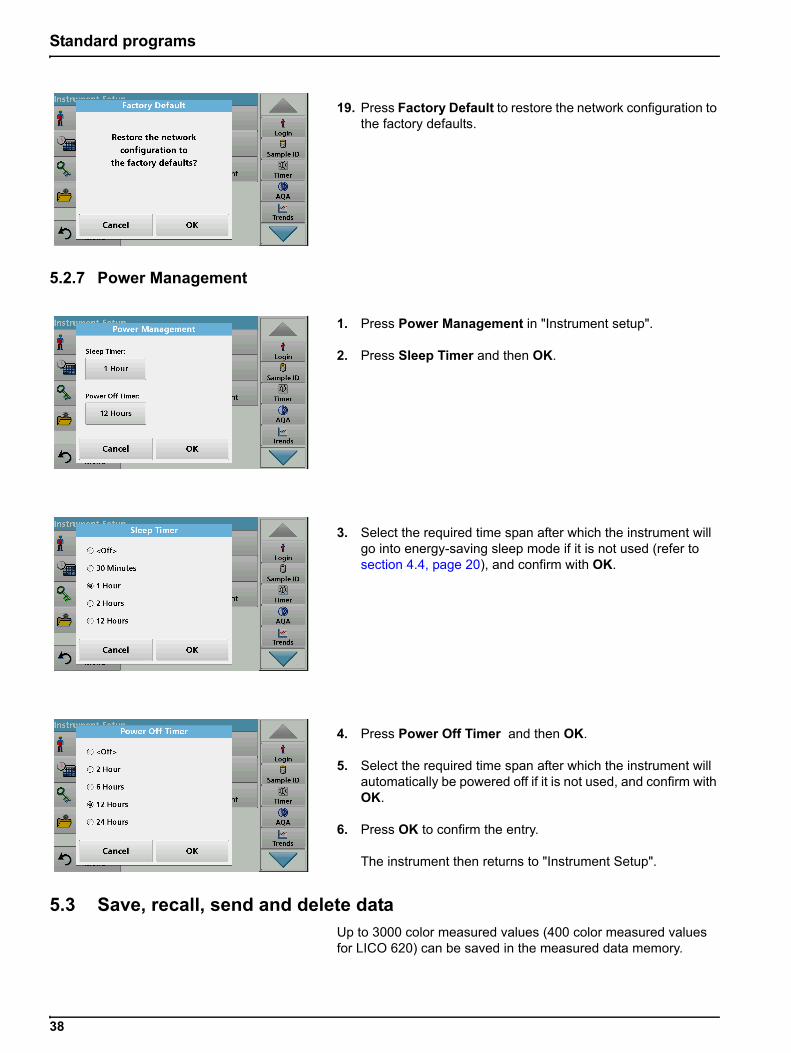
19. Press Factory Default to restore the network configuration to the factory defaults.
5.2.7 Power Management
1. Press Power Management in "Instrument setup".
2. Press Sleep Timer and then OK.
3. Select the required time span after which the instrument will go into energy-saving sleep mode if it is not used (refer to section 4.4, page 20), and confirm with OK.
4. Press Power Off Timer and then OK.
5. Select the required time span after which the instrument will automatically be powered off if it is not used, and confirm with OK.
6. Press OK to confirm the entry.
The instrument then returns to "Instrument Setup".
5.3 Save, recall, send and delete data Up to 3000 color measured values (400 color measured values for LICO 620) can be saved in the measured data memory.
39
Standard programs
In addition, the LICO 690 can store 100 reference color measurements, 1000 single and multi-wavelength measurements, 20 wavelength scans and 20 time scans.
A complete record of the analysis is stored, including the Date, Time, Results, Sample ID and Operator ID.
5.3.1 Color valuesMeasurement results from the color measurement can be found under Recall Data > Color Log.
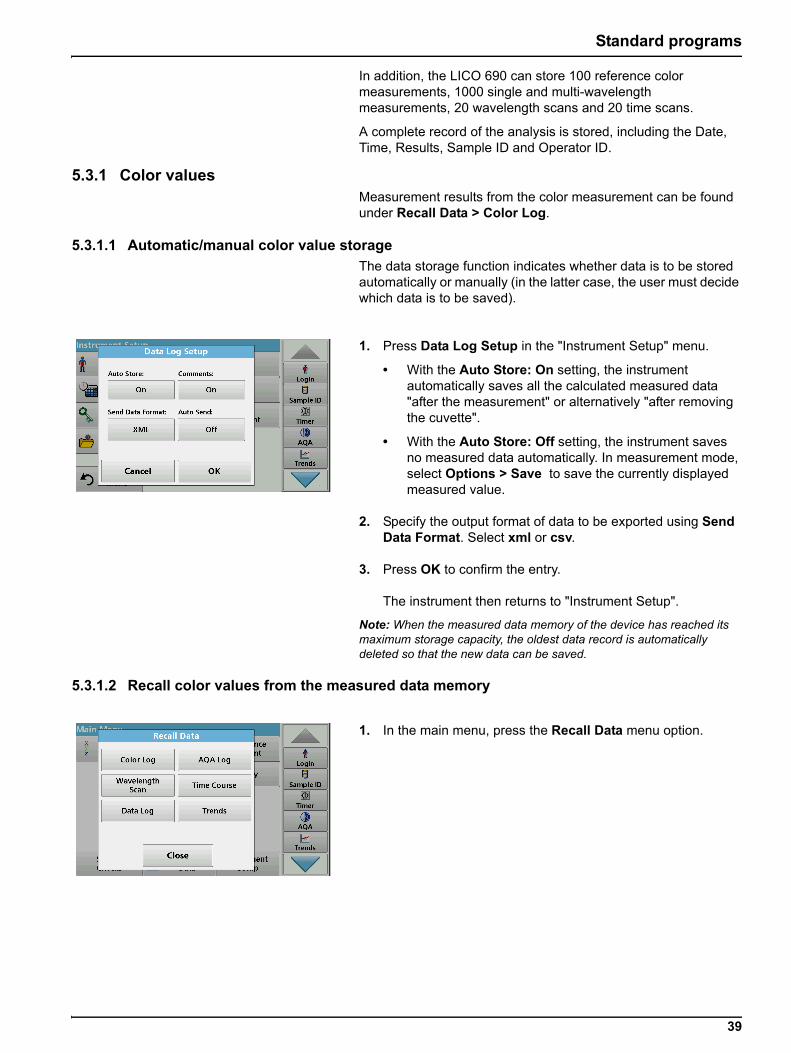
5.3.1.1 Automatic/manual color value storage
The data storage function indicates whether data is to be stored automatically or manually (in the latter case, the user must decide which data is to be saved).
1. Press Data Log Setup in the "Instrument Setup" menu.
• With the Auto Store: On setting, the instrument automatically saves all the calculated measured data "after the measurement" or alternatively "after removing the cuvette".
• With the Auto Store: Off setting, the instrument saves no measured data automatically. In measurement mode, select Options > Save to save the currently displayed measured value.
2. Specify the output format of data to be exported using Send Data Format. Select xml or csv.
3. Press OK to confirm the entry.
The instrument then returns to "Instrument Setup".
Note: When the measured data memory of the device has reached its maximum storage capacity, the oldest data record is automatically deleted so that the new data can be saved.
5.3.1.2 Recall color values from the measured data memory
1. In the main menu, press the Recall Data menu option.

40
Standard programs
2. Press Color Log.
A listing of the stored data is displayed.
3. Press Filter: On/Off. The function Filter Settings is used to search for specific items.
4. Activate On. The data can now be filtered using the following selection criteria.
• Sample ID
• Operator ID
• Start Date
• Color Scale
or any combination of the four.
5. Press OK to confirm the selection.
The chosen items are listed.
6. Press View Details to get more information.
41
Standard programs
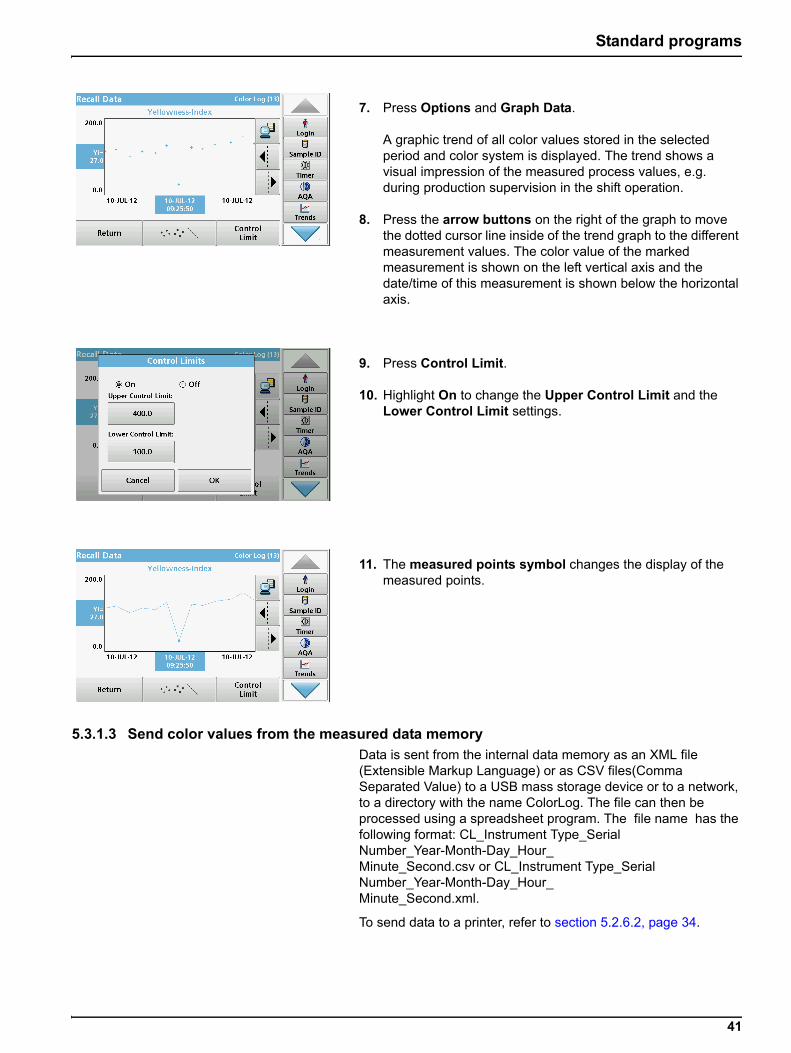
7. Press Options and Graph Data.
A graphic trend of all color values stored in the selected period and color system is displayed. The trend shows a visual impression of the measured process values, e.g. during production supervision in the shift operation.
8. Press the arrow buttons on the right of the graph to move the dotted cursor line inside of the trend graph to the different measurement values. The color value of the marked measurement is shown on the left vertical axis and the date/time of this measurement is shown below the horizontal axis.
9. Press Control Limit.
10. Highlight On to change the Upper Control Limit and the Lower Control Limit settings.
11. The measured points symbol changes the display of the measured points.
5.3.1.3 Send color values from the measured data memory Data is sent from the internal data memory as an XML file (Extensible Markup Language) or as CSV files(Comma Separated Value) to a USB mass storage device or to a network, to a directory with the name ColorLog. The file can then be processed using a spreadsheet program. The file name has the following format: CL_Instrument Type_Serial Number_Year-Month-Day_Hour_Minute_Second.csv or CL_Instrument Type_Serial Number_Year-Month-Day_Hour_Minute_Second.xml.
To send data to a printer, refer to section 5.2.6.2, page 34.

42
Standard programs
1. Plug the USB memory stick into the USB-A port on the instrument or connect the instrument to a network drive (see section 5.2.6.4, page 35).
2. In the main menu, press the Recall Data option.
3. Select the data category to be transferred, e. g. Color Log.
A list of the selected measurement data is displayed.
4. Press Options and then the PC & Printer icon.
5. Select the data to be sent.The following options are available:
• Single point: only this selected reading will be sent
• Filtered data: only readings that correspond to the set filters will be sent
• All data: all data in the selected data category will be sent.
6. Press OK to confirm.
Note: The number in parentheses is the total number of data sets assigned to this selection.
5.3.1.4 Delete color values from the measured data memory
1. In the main menu, press the Recall Data menu option.
2. Press Color Log > Options > Delete.
3. Highlight Single point, Filtered data or All data and press OK to confirm.
Note: The number in parentheses is the total number of data sets assigned to this selection.

43
Standard programs
5.3.2 Control charts for data from the AQA Log
1. In the main menu, press the Recall Data menu option.
2. Press AQA Log.
A listing of the stored data is displayed.
3. Press Filter: On/Off.
4. Activate On.
5. Select a required parameter.
6. Press OK to confirm the selection.
The chosen items are listed.
7. Press Options > Control Chart.

44
Standard programs
The measured standard concentrations are displayed graphically with the control limits and date.
5.3.3 Data log (only LICO 690)Measurement results from the photometric measurements of single and multi-wavelengths can be found under Recall Data Data Log.
5.3.3.1 Automatic/manual saving of single and multi-wavelength measurements
The data log function indicates whether data is to be stored automatically or manually (in the latter case, the user must decide which data is to be saved).
1. Press Data Log Setup in the "Instrument Setup" menu.
• With the Auto Store: On setting, the instrument automatically saves all the calculated measured data "after the measurement" or alternatively "after removing the cuvette".
• With the Auto Store: Off setting, the instrument saves no measured data automatically. In measurement mode, Options > Save can be used to save the currently displayed measured value.
2. Specify the output format of data to be exported using Send Data Format. Select xml or csv.
3. Press OK to confirm the entry.
The instrument then returns to "Instrument Setup".
Note: When the measured data memory of the instrument has reached its maximum storage capacity, the oldest data record is automatically deleted so that the new data can be saved.
45
Standard programs
5.3.3.2 Recall single and multi-wavelength measurements from the measured data memory
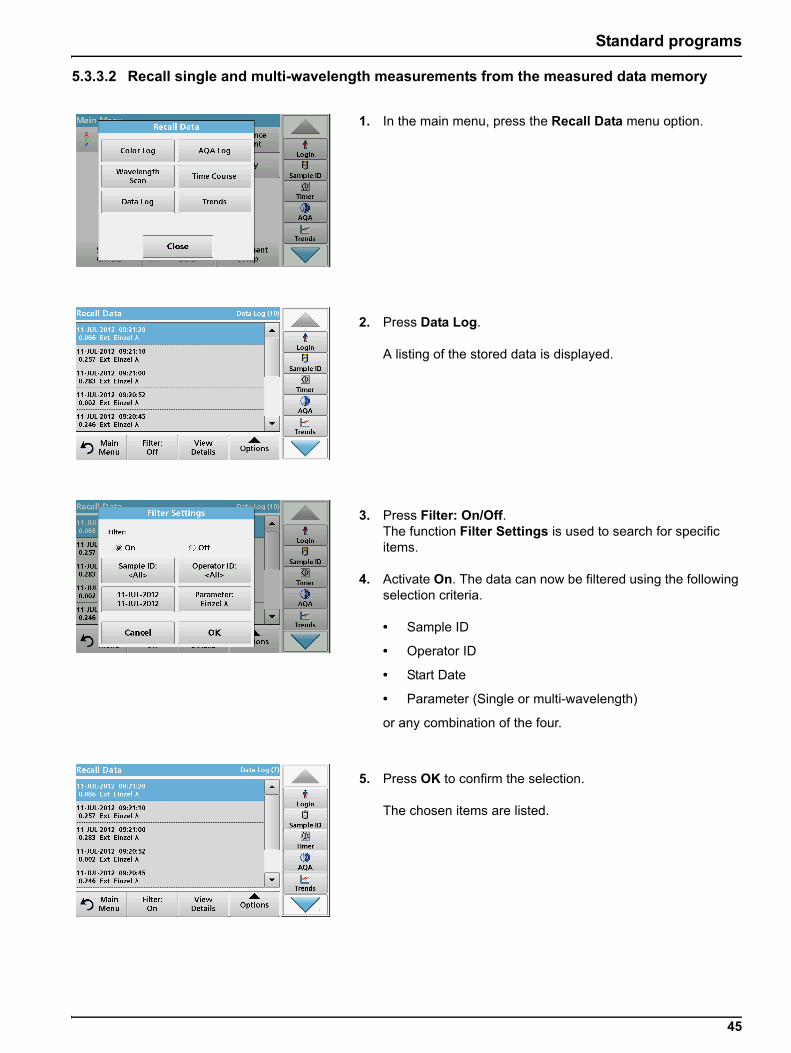
1. In the main menu, press the Recall Data menu option.
2. Press Data Log.
A listing of the stored data is displayed.
3. Press Filter: On/Off. The function Filter Settings is used to search for specific items.
4. Activate On. The data can now be filtered using the following selection criteria.
• Sample ID
• Operator ID
• Start Date
• Parameter (Single or multi-wavelength)
or any combination of the four.
5. Press OK to confirm the selection.
The chosen items are listed.

46
Standard programs
6. Press View Details to get more information.
7. Press Options and View Graph.
A graphic trend of all wavelength measurements stored in the selected period is displayed. The trend shows a visual impression of the measured process values, e.g. during production supervision in the shift operation.
8. Press the arrow buttons on the right of the graph to move the dotted cursor line inside of the trend graph to the different measurement values. The absorbance of the selected measurement is displayed on the left vertical axis, while the date/time of this measurement is displayed below the horizontal axis.
9. Press Control Limit.
10. Highlight On to change the Upper Control Limit and the Lower Control Limit settings.
11. The measured points symbol changes the display of the measured points.
5.3.3.3 Send single and multi-wavelengths from the measured data memory Data is sent from the internal data log as an XML (Extensible Markup Language) file or as a CSV (Comma Separated Value)

47
Standard programs
file, to a directory with the name DataLog on a USB mass storage device or a network drive. The file can then be processed using a spreadsheet program. The file name has th format: DL_Instrument Type_Serial Number_Year-Month-Day_Hour_Minute_Second.csv or DL_Instrument Type_Serial Number_Year-Month-Day_Hour_Minute_Second.xml.
To send data to a printer, refer to section 5.2.6.2, page 34.
1. Plug the USB memory stick into the USB-A port on the instrument or connect the instrument to a network drive (see section 5.2.6.4, page 35).
2. In the main menu, press the Recall Data menu option.
3. Select the data category to be transferred, e.g. Data Log.
A list of the selected measurement data is displayed.
4. Press Options and then the PC & Printer icon.
5. Select the data to be sent.The following options are available:
• Single point: only this selected reading will be sent
• Filtered data: only readings that correspond to the set filters will be sent
• All data: all data in the selected data category will be sent.
6. Press OK to confirm.
Note: The number in parentheses is the total number of data sets assigned to this selection.

48
Standard programs
5.3.3.4 Delete single and multi-wavelengths from the measured data memory
1. In the main menu, press the Recall Data menu option.
2. Press Data Log > Options > Delete.
3. Highlight Single point, Filtered data or All data and press OK to confirm.
Note: The number in parentheses is the total number of data sets assigned to this selection.
5.3.4 Wavelength scan and time course (LICO 690 only)You can save 20 data records for the wavelength scan and 20 data records for the time course. The data must be stored manually after it is displayed.
5.3.4.1 Data storage from wavelength scan or time course
1. Press the Folder icon in the "Options" menu after a reading is taken.
The Store Data list will be displayed.
2. Press Store to save the current scan to the highlighted numbered line.
Note: Scans can be overwritten.

49
Standard programs
5.3.4.2 Recall stored data from wavelength scan or time course
1. In the main menu, press the Recall Data menu option.
a. Select Wavelength Scan or Time Course to recall data.
b. If you are already working in one of these programs, press Options > More > Recall Data.
2. Select the required data.
3. Tap on Graph to display details.
Note: Press View List to return to "Recall Data".
4. Press Table to display details.
Note: Press View List to return to the "Recall Data" list.
5.3.4.3 Send data from wavelength scan or time course There are two ways to recall sent data to a USB memory stick, printer or PC with Hach Data Trans.
Option 1:
1. In the main menu, press the Recall Data menu option and then Wavelength Scan or Time Course.
2. Press Options and then the PC & Printer icon to send the data to a USB memory stick, to a printer or to a PC with Hach Data Trans.
• When a printer is connected, select how to send the data to the printer (graph, table or both graph and table).

50
Standard programs
• If a USB memory stick is connected, the files will be automatically sent to the USB memory stick as xml or csv files in the file folder "WLData (data of a wavelength scan) or "TCData" (data of a time course).
The file name has the following format:
• Data from a wavelength scan:"ScanData_LICO690_Serial NUmber_X.xml" or"ScanData_LICO690_Serial Number_X.csv"
• Data of a time course:"TCData_Serial Number_X.xml" or"TCData_Serial Number_X.csv"
X = number of scans (1–20).
For further processing use a spreadsheet program.
Note: The message, "Data already present. Overwrite?" is displayed if the files are already stored. Press OK to overwrite the stored data.
Option 2:
1. Press Wavelength Scan or Time Course and then Options > More > Send Data to send the data to a USB memory stick or to a printer.
• When a printer is connected, select how to send the data to the printer (graph, table or both graph and table).
• If a USB memory stick is connected, the files will be automatically sent to the USB memory stick as xml or csv files in the file folder "WLData (data from a wavelength scan) or "TCData" (data from a time course).
The file name has the following format:
• Data from a wavelength scan:"ScanData_LICO690_Serial Number_Year-Month-Day_Hour_Minute_Second.xml" or"ScanData_LICO690_Serial Number_Year-Month-Day_Hour_Minute_Second.csv"
• Data from a time course:"TCData_LICO690_Serial Number_Year-Month-Day_Hour_Minute_Second.xml" or"TCData_LICO690_Serial Number_Year-Month-Day_Hour_Minute_Second.csv"
For further processing use a spreadsheet program.
51
Standard programs
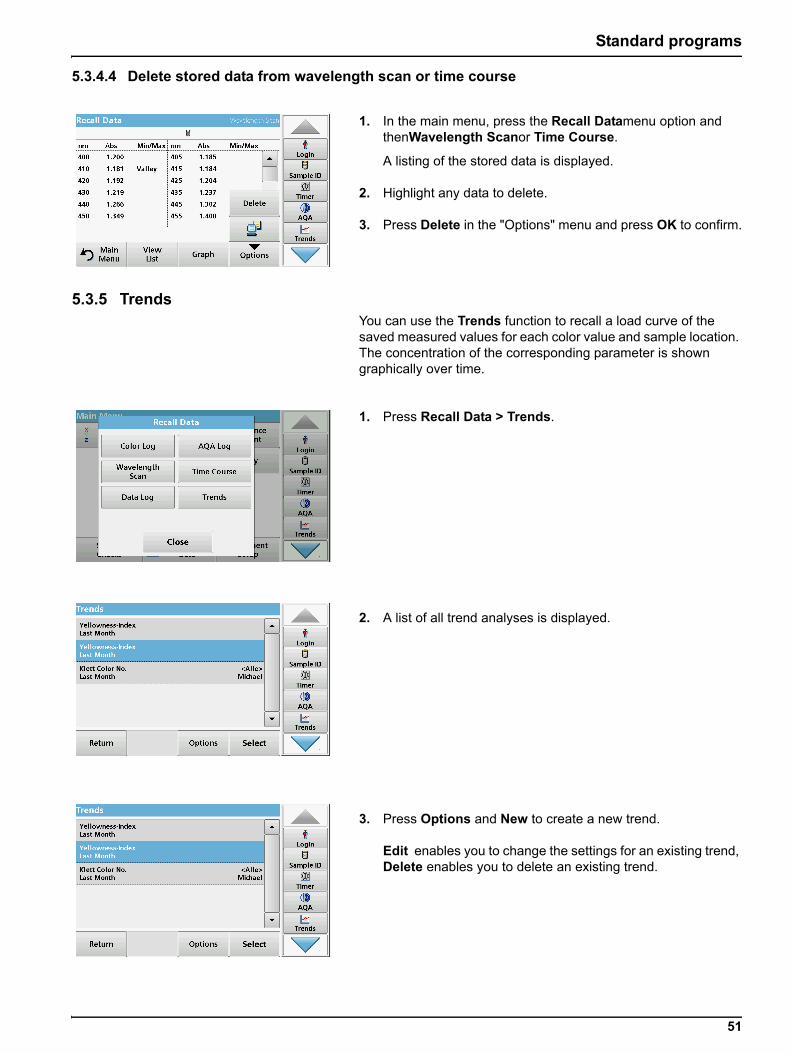
5.3.4.4 Delete stored data from wavelength scan or time course
1. In the main menu, press the Recall Datamenu option and thenWavelength Scanor Time Course.
A listing of the stored data is displayed.
2. Highlight any data to delete.
3. Press Delete in the "Options" menu and press OK to confirm.
5.3.5 TrendsYou can use the Trends function to recall a load curve of the saved measured values for each color value and sample location. The concentration of the corresponding parameter is shown graphically over time.
1. Press Recall Data > Trends.
2. A list of all trend analyses is displayed.
3. Press Options and New to create a new trend.
Edit enables you to change the settings for an existing trend, Delete enables you to delete an existing trend.

52
Standard programs
4. Define the trend settings according to sample ID, operator ID, time interval and parameter.
5. Use control limits to define the upper and lower limits that are displayed in the graphic.
6. Select the required trend and confirm with Select.
7. The trend can be displayed in several formats, as a line or as points.
53
Standard programs
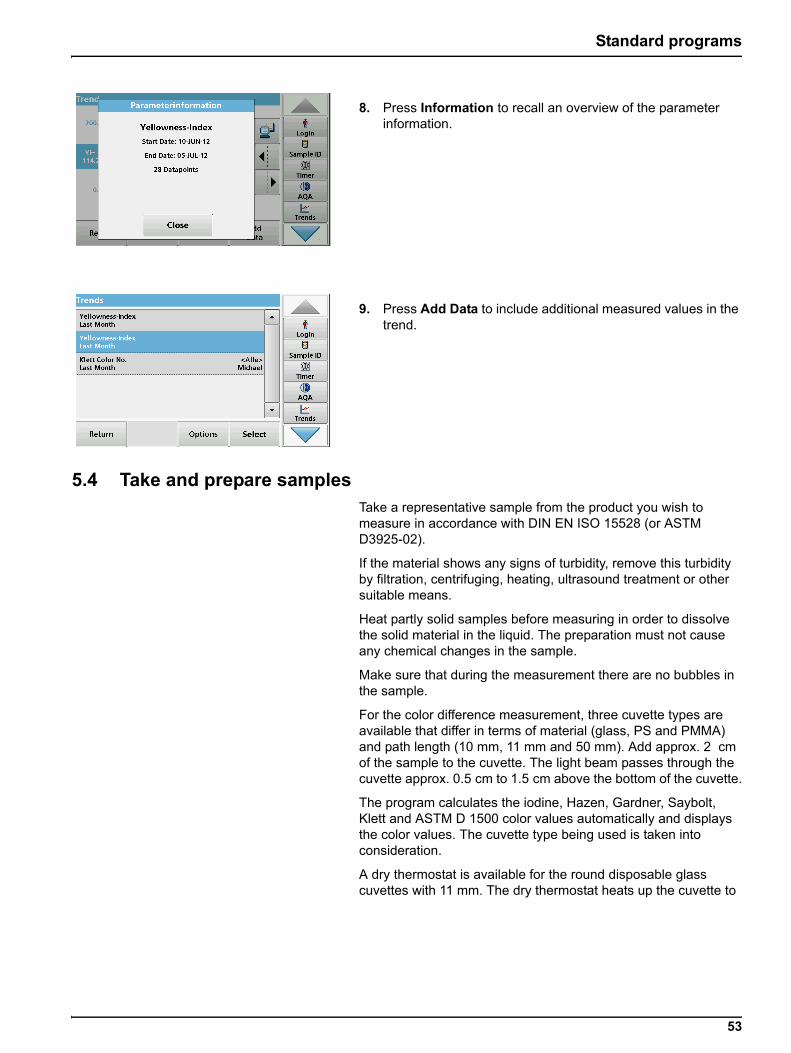
8. Press Information to recall an overview of the parameter information.
9. Press Add Data to include additional measured values in the trend.
5.4 Take and prepare samplesTake a representative sample from the product you wish to measure in accordance with DIN EN ISO 15528 (or ASTM D3925-02).
If the material shows any signs of turbidity, remove this turbidity by filtration, centrifuging, heating, ultrasound treatment or other suitable means.
Heat partly solid samples before measuring in order to dissolve the solid material in the liquid. The preparation must not cause any chemical changes in the sample.
Make sure that during the measurement there are no bubbles in the sample.
For the color difference measurement, three cuvette types are available that differ in terms of material (glass, PS and PMMA) and path length (10 mm, 11 mm and 50 mm). Add approx. 2 cm of the sample to the cuvette. The light beam passes through the cuvette approx. 0.5 cm to 1.5 cm above the bottom of the cuvette.
The program calculates the iodine, Hazen, Gardner, Saybolt, Klett and ASTM D 1500 color values automatically and displays the color values. The cuvette type being used is taken into consideration.
A dry thermostat is available for the round disposable glass cuvettes with 11 mm. The dry thermostat heats up the cuvette to

54
Standard programs
any temperature between ambient temperature and 150 °C (302 °F).
• Always hold the cuvette/sample cell close to the top to make sure that there are no fingerprints in the measurement zone of the cuvette/sample cell. Use suitable transfer pipettes to introduce samples into the cuvettes/sample cells.
• Slowly add samples to the cuvettes/sample cells to make sure air bubbles do not form on the cuvette/sample cell wall and in the sample. Air bubbles will cause false readings.
• If air bubbles are entrapped, remove them by heat, vacuum, ultrasonic treatment or other suitable means.
• Clean the outside of the cuvettes/sample cells thoroughly before inserting them in the cell compartment.
5.5 Color measurementProper sample preparation is extremely important for accurate color measurement. To make sure that an exact measurement is taken, refer to the following sample preparation guidelines:
• Always clean the glass cuvettes/sample cells immediately after use.
• Only use optically preferred samples for measurement. Make sure the cuvettes/sample cells are clean and show no signs of opaqueness.
• Slowly add the liquid to the cuvette in order to prevent the formation of air bubbles in the sample.
• Chapter 5.4, Page 53 contains further information on preparing and taking samples.
The color measurement mode is used to determine absolute color values in the Hazen, Gardner, CIE L*a*b* or European Pharmacopoeia color scales.
For each cuvette type (11 mm round cuvette and 10 and 50 mm square cuvettes), an independent calibration data record is used.
It is possible to calibrate the instrument with one, two or three types of cuvettes/sample cells and to use these different cuvette/sample cell types in parallel.
N O T I C EThe samples must be clear and free of turbidity. If products in paste or solid form cannot be measured directly, the product must be melted before being transferred to the cuvettes/sample cells. Make sure the cuvettes/sample cells do not contain any air bubbles.
N O T I C EBefore using disposable cuvettes/sample cells made of PS (Polystyrene) or PMMA (Polymethyl methacrylate), be sure that the cuvettes/sample cells will not be destroyed by samples, otherwise the cell compartment can be damaged.

55
Standard programs
To use the 10 mm square cuvette and 11 mm round cuvettes, adapter Z must be inserted into the cuvette compartment (2). For measurements with 50 mm square cuvettes, you must remove the adapter.
5.5.1 Take a color measurement
1. Press Color Measurement.
2. Insert a cuvette/sample cell with distilled water to calibrate.
Note: Always carry out the calibration very carefully, as a faulty calibration can cause inaccurate results to be obtained.
3. The calibration starts automatically once the instrument has detected the cuvette.
The type of cuvette/sample cell used and the exact progress of calibration is shown in a separate window.
4. After calibration, the cuvette size used is displayed in the top right.
Note: After calibration, you can measure the cuvette with distilled water again as a sample. The displayed measured values should match the uncolored color indices (i.e. Hazen = 0, Gardner = 0.0, CIE L*a*b* = 100.0, 0.0, 0.0, etc.)

56
Standard programs
5. Insert the test cuvette.
The measurement starts automatically.The result of the color calculation is displayed.
Note: The bar on the right next to the result shows the result relative to the measurement range.
6. For the next measurement, remove the cuvette and insert the next sample cuvette, or press Measure to measure the same sample again.
5.5.1.1 Touch-sensitive areas in measurement mode
In measurement mode, there are touch-sensitive areas that give you immediate access to various menu options.
Figure 4 Touch-sensitive areas in measurement mode
1 Open Select Color Scale, and select the scale for the display (see section 5.5.1.3, page 58).
4 Change the Upper Limit of the color range (see section 5.5.1.4, page 58).
2 Change the displayed color scale to the next color system which is selected in the Operator ID color scale list for display (see section 5.5.1.3, page 58).
5 Change the Lower Limit of the color range (see section 5.5.1.4, page 58).
3 OpenSample ID to change or add the sample ID (see section 5.2.2, page 24).
6 Open Comments to enter a comment.

57
Standard programs
5.5.1.2 Parameter setup options
Press Options to set up the parameter.
Table 4 Color measurement options
Options Description
More For further Options
Save iconSymbol: Store Data, if Instrument Setup > Data Log Setup > Auto Store: Off is selected.
Symbol: Recall Data, if Instrument Setup > Data Log Setup > Auto Store: On is selected.
Send Data icon To send data to a printer, computer or USB memory stick (USB A) or network.
Color Scale Select the color scale
View GraphView TableView Values
VIEW GRAPH shows the spectral graph of the transmittance or absorbance graph.
Note: View Graph is activated after the first measured value.
VIEW TABLE displays the spectral transmittance values T% from 380 nm to 720 nm.
VIEW VALUESdisplays the result of the last color calculation.
Scale & Units
UNITS: Select absorbance or transmittance.
SCALE: In the automatic Scale mode, the y-axis is automatically adjusted so that the total scan is displayed.
The manual Scale mode allows sections of the scan to be displayed.
Ph.Eur.: AutoEuropean Pharmacopoeia
Select AUTO or the REQUIRED SCALE
Color Scale Selection
Define 3 different color scale combinations with up to 3 different color scales for the result display.
Selection 1: Klett Color No. + Yellowness Index
Selection 2: Klett Color No. + ADMI Color No. + Yellowness Index
Selection 3: Yellowness Index + individual transmittance
Illuminant/Observer: C/2°
Illuminant: Select C, A or D65
Observer: 2° or 10°
Color Scales for Operator ID:
Individual selection of the color scales for the operator ID.

58
Standard programs
5.5.1.3 Change the color scale after a measurement
1. Press the touch-sensitive area, e. g. Color Value Gardner.
2. A list of all color scales is displayed.
3. Select the required scale.
4. Press OK to confirm.
The current result of the actual reading and all further measurements will be displayed in the selected color scale.
Alternative
1. Tap the touch-sensitive area Result .
2. The result is shown in the next color scale in the list.
5.5.1.4 Change the measuring range after a measurement
1. Tap the touch-sensitive areas for the upper or lower limits of the barchart.
2. Enter the new limit and press OK to confirm.
Note: The changed measurement range limit is displayed in blue.
Note: It is only possible to change the limits inside the measuring range of the color scale. It is not possible to expand the range, e. g. to Hazen 2000.
The current result and all further measurements will be displayed with the new measuring range.
5.5.2 Determination of the iodine color valueDIN 6162 defines the iodine color value as mg iodine per 100 mL potassium iodide solution. Color matching with the iodine color

59
Standard programs
scale determines the depth of color of clear liquids like solvents, plasticisers, resins, oils and fatty acids, whose color is similar to that of a solution of iodine and potassium iodide of the same thickness.
For iodine color values of less than or approximately 1, the determination of the Hazen value according to DIN-ISO 6271 is to be preferred. Taking and preparing samples is described in Chapter 5.4, Page 53. The iodine color value can be determined with sufficient accuracy using an 11 mm disposable glass round cuvette.
5.5.3 Determination of the Hazen color value (Pt-Co or APHA method)The Hazen color value (ISO 6271, also referred to as the "APHA method" or Platinum-Cobalt Scale) is defined as mg platinum per 1 liter of solution. The Hazen parent solution comprises 1.246 g potassium-hexachloroplatinate (IV) and 1.00 g cobalt(II) chloride, which is dissolved in 100 mL hydrochloric acid and topped up to 1000 mL with distilled water.
The Hazen-color scale is used to evaluate the colors of nearly water-clear products. It has narrower gradations in the light yellow range than the Iodine Color Scale and extends to water-clear color casts.
Note: Samples with Hazen values of between 50 and 1000 can be measured with sufficient accuracy in 10 mm square and 11 mm round cuvettes. Hazen values below 50 should be measured in 50 mm cuvettes. Hazen values below 10 should be measured only with the 50 mm cuvette that was used for the calibration. The reason for this is that almost colorless products can cause false measurement results due to the cuvette tolerances.
5.5.4 Determination of the Gardner color valueThe Gardner color value is defined in DIN-ISO 4630. The Gardner color values for lighter color tones (1 to 8) are based on potassium-chloroplatinate solutions, while the color values for darker color tones (9 to 18) are based on solutions of iron(III) chloride, cobalt(II) chloride and hydrochloric acid. You can determine Gardner values with all cuvette path lengths (but only values up to Gardner color value 4 in 50 mm cuvettes).
The 10 mm and 11 mm cuvettes, however, usually offer adequate accuracy.
5.5.5 Determination of the Mineral oil color value (ASTM D 1500 and ISO 2049)The mineral oil color scale is used to evaluate the color of mineral oil products such as lubricating oils, fuel oil, diesel fuel and paraffin. The color scale starts at color value 0 for water-white, non-colored oils and ends at 8 for very dark brown oils. The substances are optically rated in multiples of 0.5 (0.5; 1.0; 1.5 etc.). The instrument displays the results in multiples of 0.1. For samples whose color value is higher than 8, *** is displayed.
Note: Due to the strong color of the ASTM D 1500 color number, it is only calculated for 11 mm round or 10 mm square cuvettes. No calculation is carried out for the 50 mm path length.

60
Standard programs
5.5.6 Determination of the Saybolt color number (ASTM D 156)The Saybolt color scale is used to evaluate refined oil products such as petrol and kerosene, as well as petroleum waxes and pharmaceutical white oils.
The Saybolt color properties are comparable to those of the Hazen scale (APHA). The Saybolt color scale starts at color value +30 (lightest color, corresponds to approx. 8 to 10 Hazen) and ends at -16 (strongest color, corresponds to approx. 350 Hazen).
The measurements can be taken in cuvettes with path lengths of 10 mm, 11 mm or 50 mm. A longer path length increases the measurement accuracy (50 mm recomended).
5.5.7 Color determinations only by LICO 690
5.5.7.1 Color determination according to the European Pharmacopoeia (EP)
The method used to determine coloration according to the Europeean Pharmacopoeia (Pharm.Eur.) corresponds to the specifications in Chapter 2.2.2 of the Pharmacopeia "Degree of Coloration of Liquids", in which a total of 37 color reference solutions for the color tones yellow (Y1 – Y7), green-yellow (GY1 – GY7), brownish-yellow (BY1 – BY7), brownish (B1-B9) and red (R1-R7) are defined. Each color reference solution is clearly defined in the CIE L*a*b* color space in terms of brightness, hue and saturation.
There are two ways of color matching of a sample with the Ph.Eur.system.system:
• Automatic: The color of the solution is compared to the colors of the 37 color reference solutions. The identifier of the reference solution whose color is closest to that of the sample (i.e. the reference solution with the smallest color difference E* to the sample) is displayed.
• Specified scale: A scale is specified (e.g. BY). The identifier of the reference solution whose color is closest to that of the sample (i.e. the reference solution with the smallest color difference E* to the sample within the specified scale) is displayed.
If a scale is defined (e.g. scale BY), one of the following five symbols is used to define the relationship between the measured results and the scale (see Table 5).
Table 5 Specified scale
Character Description
= equal The color number of the sample is equal to that of the reference solution
< less The color number of the sample is less than that of the reference solution
> greater The color number of the sample is greater than that of the reference solution
<> between The color number of the sample is between those of two reference solutions
-> nextThe color numner of the sample does not match any reference solution in this scale, but the indicated reference solution is nearest in color
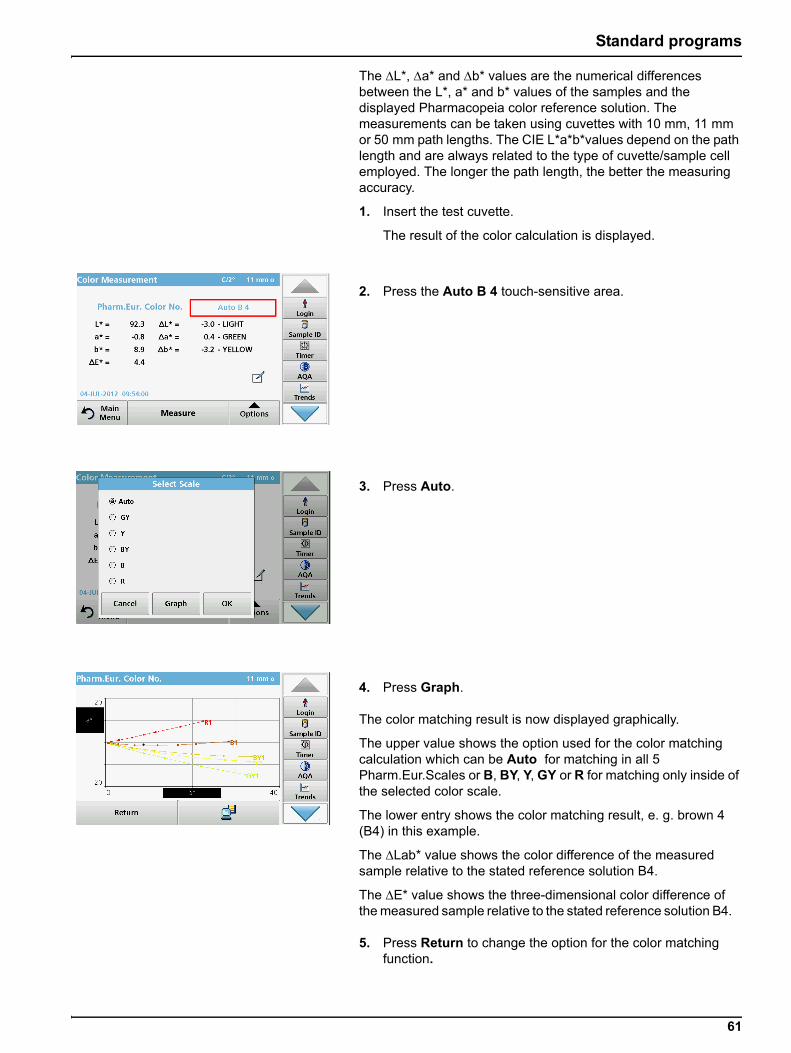
61
Standard programs
The L*, a* and b* values are the numerical differences between the L*, a* and b* values of the samples and the displayed Pharmacopeia color reference solution. The measurements can be taken using cuvettes with 10 mm, 11 mm or 50 mm path lengths. The CIE L*a*b*values depend on the path length and are always related to the type of cuvette/sample cell employed. The longer the path length, the better the measuring accuracy.
1. Insert the test cuvette.
The result of the color calculation is displayed.
2. Press the Auto B 4 touch-sensitive area.
3. Press Auto.
4. Press Graph.
The color matching result is now displayed graphically.
The upper value shows the option used for the color matching calculation which can be Auto for matching in all 5 Pharm.Eur.Scales or B, BY, Y, GY or R for matching only inside of the selected color scale.
The lower entry shows the color matching result, e. g. brown 4 (B4) in this example.
The Lab* value shows the color difference of the measured sample relative to the stated reference solution B4.
The E* value shows the three-dimensional color difference of the measured sample relative to the stated reference solution B4.
5. Press Return to change the option for the color matching function.

62
Standard programs
6. Select Scale is displayed.
7. The option for color matching to a special scale can be changed.
8. Graph offers a visualisation of the matching result in the selected matching option.
9. Depending on the scale selection, the appropriate graph of the color scale will be displayed.
When option Auto is selected the a*, b* color locus of the measured sample will be displayed in all 5 color scales of the Pharm Eur.
10. Press the Print symbol to print the graph.
The CIE L*a*b* values depend on the path length of the cuvette/sample cell. Therefore the scale of the a*, b* axis in the graph depends also on the cuvette/sample cell size.
Graph for the greenish yellow scale GY.
Graph for the brownish scale B.
Graph for the brownish yellow scale BY.

63
Standard programs
Graph for the yellow scale Y.
Graph for the red scale R.
If the CIE L*a*b* value of the sample does not correspond to any reference solution in a selected scale, the > (next) symbol appears, followed by the next reference solution with the smallest color difference E*. In this case, select Auto for a color matching in all scales to see which color scale and color reference solution is the closest to the sample color.
If the color space of the sample is outside the graph of a color comparison scale, the error message Value outside! appears above the graph.
5.5.7.2 Color determination according to the US Pharmacopoeia (USP)The method used to determine color according to the US Pharmacopoeia corresponds to the specifications in Chapter 631 "Color and Achromicity" and in Chapter 1061 "Color - Instrumental measurement". A total of 20 color reference solutions (identified by the sequential letters A to T) are defined in the US Pharmacopeia. The color of the measured sample is automatically correlated to the color reference solutions. This

64
Standard programs
means that the color reference solution that is closest to the sample (i.e. the reference solution with the smallest color difference E* to the color of the sample) is displayed. The values L*, a* and b* are the quantitative differences between the L*, a* and b* values of the sample and those of the displayed USP solutions.
The measurements can be taken using cuvettes with path lengths of 10 mm, 11 mm or 50 mm. The use of longer path lengths increases the accuracy of the measurement.
The CIE L*a*b* values depend on the path length and are always related to the type of cuvette/sample cell used.
1. Press US Pharmacopoeia.
2. Insert the test cuvette.
3. The result of the color calculation is displayed.
The L*a*b* value shows the color difference of the measured sample relative to the next USP color standard, which is displayed above the color difference values (in this case color standard B).
The E* value shows the three-dimensional color difference of the measured sample relative to the USP color standard B.
The touch-sensitive area around the color standard is active.
4. Press the area around the color standard (in this case B). The color axis a*, b* and the loci of the sample (+) is displayed as well as the USP color standards. The color matching result is displayed graphically.
5. Press the Send Data symbol to print the graphic or Return to exit the window.
5.5.7.3 Color determination according to the Chinese Pharmacopoeia (CP)The Chinese grade scheme for pharmaceutical solutions is split into five color scales: yellow-green (YG1 - YG10); yellow (Y1 - Y10); orange-yellow (OY1 - OY10); orange-red (OR1 - OR10); brown-red (BR1 - BR10). The Chinese Pharmacopoeia resembles the color scales of the European Pharmacopoeia (EP), with yellow, red and blue primary solutions. The yellow solutions, however, differ from the European Pharmacopoeia in the proportion of solution and color designation.
5.5.7.4 Determination of the Klett color valueThe Klett color number is used in the cosmetics industry to evaluate surfactants and detergents. The Klett color value is usually measured in 40 mm cuvettes/sample cells with a Summerson photometer using a blue filter (no. 42).
The measuring range starts at Klett color number 0 and ends at Klett color number 1000.

65
Standard programs
You can measure the Klett color value with all cuvette types (10, 11 and 50 mm). The 50 mm cuvette, however, offers the highest accuracy. For Klett, however, the measurement result is always calculated with 40 mm and blue filter no. 42.
5.5.7.5 Determination of the AOCS Cc 13 e (Lovibond®) scaleThe calculation of the Lovibond color values is derived from the methods AOCS Cc 13e or BS 684 -1.14 and based on the yellow/red values (5 1/2 inch or 1 inch) of the AF900/AF960 instruments. On the printout, the 1" values are identified by a 1.
5.5.7.6 Determination of the Yellowness Index (ASTM D 1925)
The Yellowness Index is calculated and displayed according to ASTM D 1925 for standard illuminant C and a 2° standard observer. This color value can be measured in 10 mm, 11 mm or 50 mm cuvettes.
The Yellowness Index is calculated as follows:
Y i = 100 × ( 1.277 × X 1.059 × Z )/Y
5.5.7.7 Determination of the Hess-Ives color number
The Hess-Ives color number is used in the cosmetics industry to evaluate the color of fat derivatives. It combines in one number the weighted color intensities, which represent the red, green and blue parts of the transmittance spectrum of the sample at 3 wavelengths. It is defined in DGK 8 method no. F 050.2 and calculated and displayed in accordance with this method. The Hess-Ives color number is calculated from:
H - I = ((R + G + B) ×6)/path length
R, G and B are the color components for the red (640 nm), green (560 nm) and blue (464 nm) parts. For R,G and B:
R = 43.45 × E640
G = 162.38 × E560
B = 22.89 × (E460 + E470)/2
5.5.7.8 Determination of the ADMI color numberThe ADMI color number is used to measure the color of water and wastewater having color characteristics significantly different from platinum-cobalt standards, as well as to those similar in hue to the standards.
The American Dye Manufacturers Institute (ADMI) has adopted the Platinum-Cobalt standard of the American Public Health Association (APHA) as the standard for color value. Although this standard is yellow, the ADMI method works for all hues.
The measurements can be taken using 10 mm, 11 mm or 50 mm cuvettes. A longer path length increases the measurement accuracy (50 mm path length is recommended).
Turbid samples must be filtered prior to analysis.

66
Standard programs
5.5.7.9 Determination of the Acid wash color
ASTM D848 - 09 is the standard test method for the acid wash color in the "aromatic hydrocarbon" industry. The test procedure covers the determination of the acid wash color for benzene, toluene, xylene, refined solvents such as naphtha and similar aromatic hydrocarbons. The color scale was developed for detecting impurities in industrial aromatic hydrocarbons. Sulfur contamination causes the material to discolor, for example.
5.5.7.10 Determination of the ICUMSA color index
The ICUMSA (International Commission for Uniform Methods of Sugar Analysis) color index is a photometric method for color correction of filtered sugar solutions. The test method is based on the transmittance of the solution with a known concentration (Brix value) at a wavelength of 420 nm.
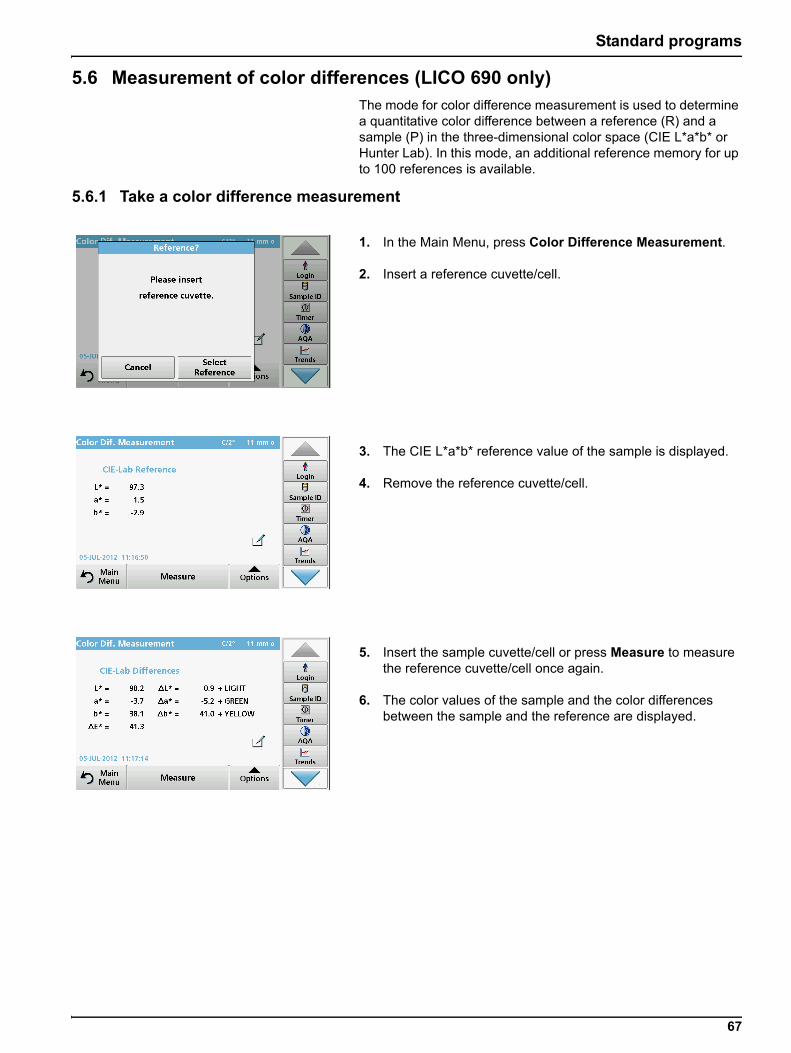
67
Standard programs
5.6 Measurement of color differences (LICO 690 only)The mode for color difference measurement is used to determine a quantitative color difference between a reference (R) and a sample (P) in the three-dimensional color space (CIE L*a*b* or Hunter Lab). In this mode, an additional reference memory for up to 100 references is available.
5.6.1 Take a color difference measurement
1. In the Main Menu, press Color Difference Measurement.
2. Insert a reference cuvette/cell.
3. The CIE L*a*b* reference value of the sample is displayed.
4. Remove the reference cuvette/cell.
5. Insert the sample cuvette/cell or press Measure to measure the reference cuvette/cell once again.
6. The color values of the sample and the color differences between the sample and the reference are displayed.

68
Standard programs
7. Press Option for Parameter Setup. Table 6 contains additional information on the program options.
Table 6 Options for color difference measurement
Options Description
More For further Options
Save iconSymbol: Store Data, if Instrument Setup > Data Log Setup > Auto Store: Off is selected.
Symbol: Recall Data, if Instrument Setup > Data Log Setup > Auto Store: On is selected.
Send Data icon To send data to a printer, computer or USB memory stick (Type A)
Color Scale Select the color scale
View GraphView TableView Values
VIEW GRAPH shows the spectral graph of the transmission or absorbance curve.
"View Graph" will be activated after the first reading.
VIEW TABLE displays the spectral transmittance values T% from 380 nm to 720 nm.
VIEW VALUES shows the result of the last color calculation.
Scale & Units
UNITS: Select absorbance or transmittance.
SCALE: In the automatic Scale mode, the y-axis is automatically adjusted so that the total scan is displayed.
The manual Scale mode allows sections of the scan to be displayed.
Ph.Eur.: AutoEuropean Pharmacopoeia
Select AUTO or REQUIRED SCALE
Select Reference Select stored reference data.
Color Scale selection
Define 3 different color scale combinations with up to 3 different color scales for the result display.
Selection 1: Klett color number + Yellowness Index
Selection 2: Klett color number + ADMI color number + Yellowness Index
Selection 3: Yellowness Index + individual transmittance
Illuminant/observerIlluminant: Select C, A or D65
Observer : 2° or 10°
Color Scales for Operator ID
Configure the color scale to display or to print
Store Reference Store new reference data.

69
Standard programs
5.6.1.1 View graph/table/values
1. Press Options > View Graph to display the transmittance graph for the sample (black line) and the reference (red line) in the wavelength range of 380 nm to 720 nm on the x-axis and the % transmittance on the y-axis. In the middle of the graph a dotted cursor line is displayed. Below the graphic, the transmission difference between reference and sample on the current cursor position is displayed.
2. Press the appropriate button on the right screen to move the cursor line left or right or touch any position inside of the graph area. In the middle of the x-axis the wavelength at the actual cursor position is displayed.
3. Press Options > More > Scale & Units > Ext. A graph showing the absorbance curve for the measurement is displayed. Below the graph diagram, the absorption difference is displayed.
4. Press Options > View Table to switch to the table of transmittance values or absorbance values (depending on the option selected in "Scale & Units").
There are three columns in which the wavelengths 380 nm to 580 nm and the corresponding transmittance/absorbance are displayed.
Scroll down to display the transmittance and absorbance wavelengths up to 720 nm.
5. Press Options > View Values. The color value of the sample is displayed.
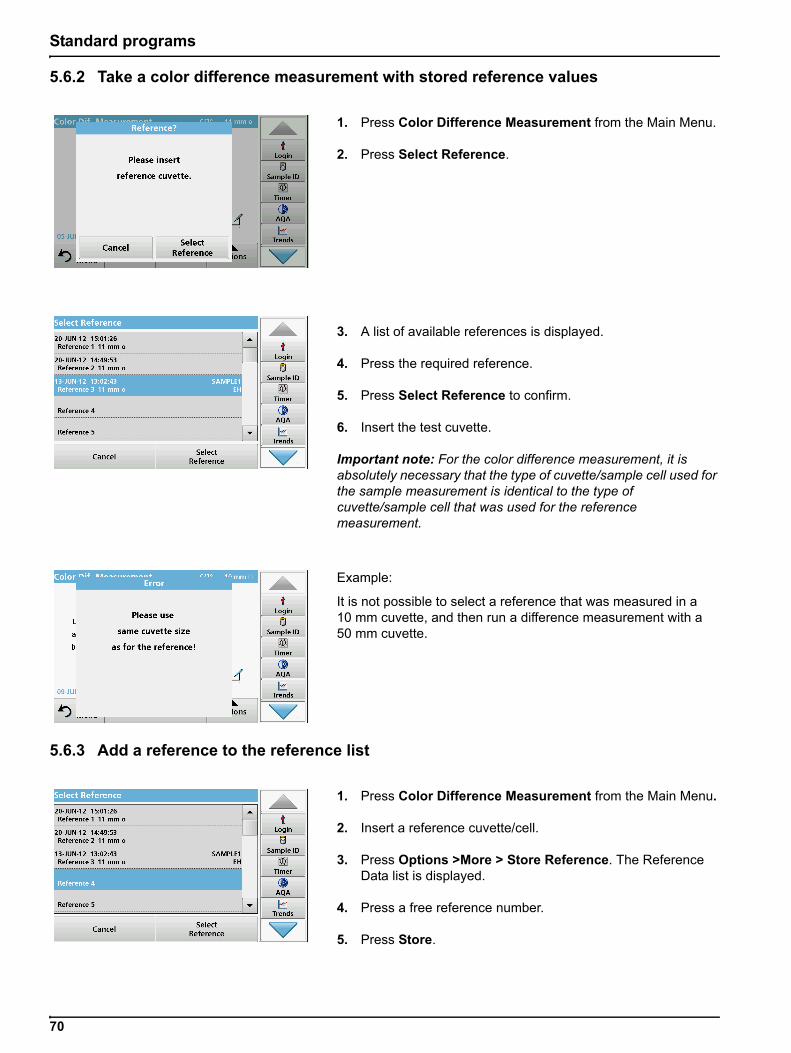
70
Standard programs
5.6.2 Take a color difference measurement with stored reference values
1. Press Color Difference Measurement from the Main Menu.
2. Press Select Reference.
3. A list of available references is displayed.
4. Press the required reference.
5. Press Select Reference to confirm.
6. Insert the test cuvette.
Important note: For the color difference measurement, it is absolutely necessary that the type of cuvette/sample cell used for the sample measurement is identical to the type of cuvette/sample cell that was used for the reference measurement.
Example:
It is not possible to select a reference that was measured in a 10 mm cuvette, and then run a difference measurement with a 50 mm cuvette.
5.6.3 Add a reference to the reference list
1. Press Color Difference Measurement from the Main Menu.
2. Insert a reference cuvette/cell.
3. Press Options >More > Store Reference. The Reference Data list is displayed.
4. Press a free reference number.
5. Press Store.
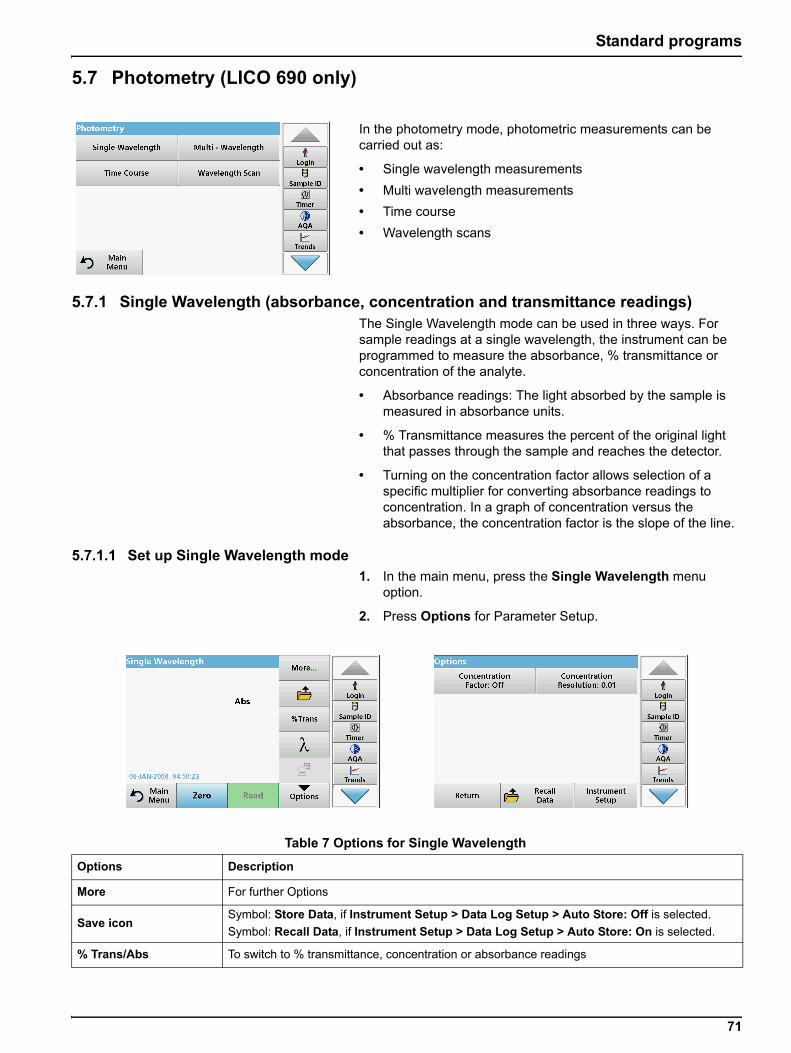
71
Standard programs
5.7 Photometry (LICO 690 only)
In the photometry mode, photometric measurements can be carried out as:
• Single wavelength measurements
• Multi wavelength measurements
• Time course
• Wavelength scans
5.7.1 Single Wavelength (absorbance, concentration and transmittance readings)The Single Wavelength mode can be used in three ways. For sample readings at a single wavelength, the instrument can be programmed to measure the absorbance, % transmittance or concentration of the analyte.
• Absorbance readings: The light absorbed by the sample is measured in absorbance units.
• % Transmittance measures the percent of the original light that passes through the sample and reaches the detector.
• Turning on the concentration factor allows selection of a specific multiplier for converting absorbance readings to concentration. In a graph of concentration versus the absorbance, the concentration factor is the slope of the line.
5.7.1.1 Set up Single Wavelength mode
1. In the main menu, press the Single Wavelength menu option.
2. Press Options for Parameter Setup.
Table 7 Options for Single Wavelength
Options Description
More For further Options
Save iconSymbol: Store Data, if Instrument Setup > Data Log Setup > Auto Store: Off is selected.
Symbol: Recall Data, if Instrument Setup > Data Log Setup > Auto Store: On is selected.
% Trans/Abs To switch to % transmittance, concentration or absorbance readings

72
Standard programs
Concentration Factor:
1. Press Concentration Factor: Off in the "Options" menu.
2. Press On to activate this function.
3. Press the Factor button and enter the factor.
4. Press Unit and select the corresponding units for concentration from the displayed list.
5. Press OK to confirm.
Concentration Resolution:
1. Press Concentration Resolution in the "Options" menu.
2. Select the resolution.
3. Press OK to confirm.
4. Then press Return to return to measurement mode.
WavelengthTo input the wavelength setting. Use the alphanumeric keypad to enter the reading wavelengths. The entered wavelength must be in the range from 320-110 nm.
Send Data icon To send data to a printer, computer or USB memory stick (Type A)
Concentration Factor Multiplication factor for converting absorbance values into concentration values.
Concentration Resolution
To select the number of decimal places.
Recall measurement data
Recall saved measurement data, wavelength scans or time courses, refer to section 5.3, page 38.
Instrument Setup mode Basic data of the instrument, refer to section 5.2, page 23.
Table 7 Options for Single Wavelength(Continued)
Options Description

73
Standard programs
5.7.1.2 Take single wavelength readings (single reading)
1. Insert the zero solution cell into the cell compartment.
2. Press Zero.
Note: The Read key is only active after the zero reading has been completed.
3. Insert the analysis cell into the cell compartment.
4. Press Read.
5. For data storage, refer to section 5.3.1, page 39.
5.7.2 Multi Wavelength mode – readings with more than one wavelengthIn the Multi Wavelength mode, absorbance values can be measured at up to four wavelengths and the results can be mathematically processed to obtain sums, differences and relationships.
• Absorbance readings: The light absorbed by the sample is measured in absorbance units.
• % Transmittance measures the percent of the original light that passes through the sample and reaches the detector.
• Turning on the concentration factor allows selection of a specific multiplier for converting absorbance readings to concentration. In a graph of concentration versus the absorbance, the concentration factor is the slope of the line. Concentration is calculated using a single factor for each wavelength, which is input by the user.
5.7.2.1 Set the Reading mode at different wavelengths
In the main menu, press the Multi-Wavelength menu option. Press Options for Parameter Setup.
Table 8 Multi wavelength setup options
Options Description
More For further Options
Save iconSymbol: Store Data, if Instrument Setup > Data Log Setup > Auto Store: Off is selected.
Symbol: Recall Data, if Instrument Setup > Data Log Setup > Auto Store: On is selected.
% Trans/Abs To switch to % transmittance, concentration or absorbance readings

74
Standard programs
Absorbance Formula
1. Press Absorbance Formula.
2. The formula selected in the top key determines the number of wavelength and coefficient keys that will appear below.
3. Press the key to change the calculation formula.
4. Select a formula from the displayed list.
5. Press OK.
When a new formula is selected, the number of variables below changes to match.
The following formulas are available:
K 1 A 1 + K 2 A 2K 1 A 1 + K 2 A 2 + K 3 A 3K 1 A 1 + K 2 A 2 + K 3 A 3 + K 4 A 4K 1 A 1 / K 2 A 2(K 1 A 1 + K 2 A 2 ) / K 3 A 3(K 1 A 1 + K 2 A 2 ) / (K 3 A 3 + K 4 A 4 )
A 1 refers to the absorbance at wavelength 1
A 2 refers to the absorbance at wavelength 2, etc.
WavelengthTo input the wavelength setting. Use the alphanumeric keypad to enter the reading wavelengths. The entered wavelength must be in the range from 320–1100 nm.
Send Data icon To send data to a printer, computer or USB memory stick (Type A)
Concentration Factor Multiplication factor for converting absorbance values into concentration values.
Concentration Resolution
To select the number of decimal places.
Absorbance Formula Calculation basis for evaluating samples
Recall measurement data
Recall saved measurement data, wavelength scans or time courses, see section 5.3, page 38.
Instrument Setup mode Basic data of the instrument, refer to section 5.2, page 23.
Table 8 Multi wavelength setup options(Continued)
Options Description
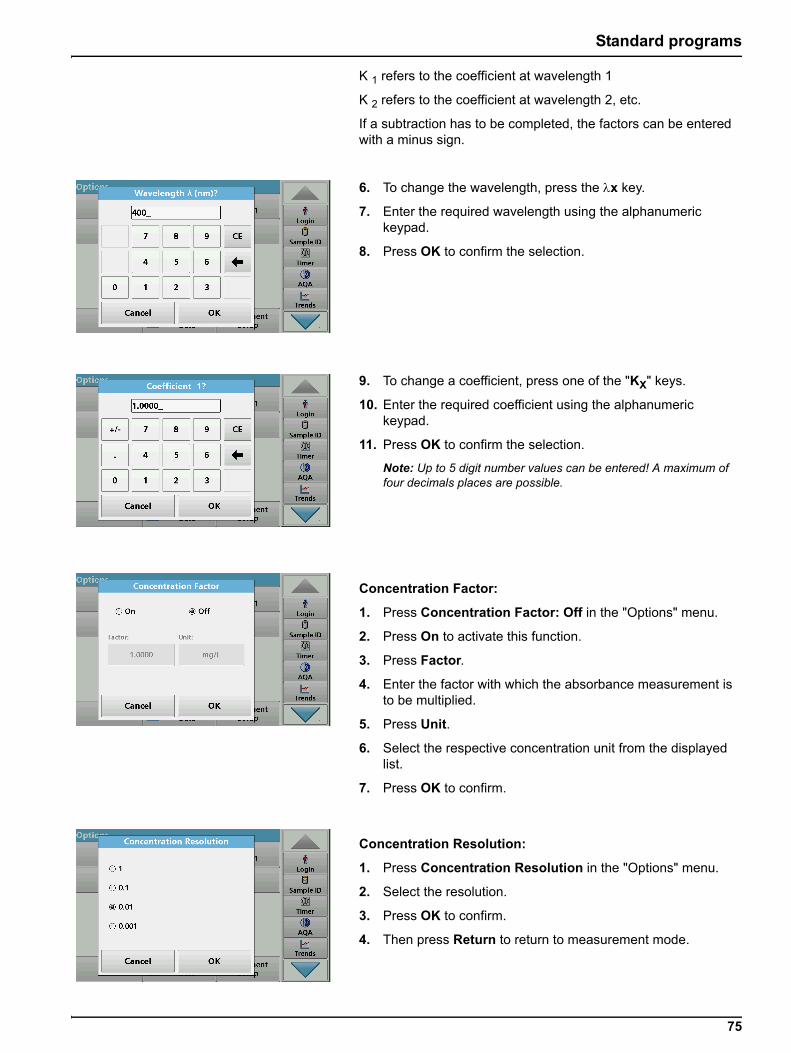
75
Standard programs
K 1 refers to the coefficient at wavelength 1
K 2 refers to the coefficient at wavelength 2, etc.
If a subtraction has to be completed, the factors can be entered with a minus sign.
6. To change the wavelength, press the x key.
7. Enter the required wavelength using the alphanumeric keypad.
8. Press OK to confirm the selection.
9. To change a coefficient, press one of the "KX" keys.
10. Enter the required coefficient using the alphanumeric keypad.
11. Press OK to confirm the selection.
Note: Up to 5 digit number values can be entered! A maximum of four decimals places are possible.
Concentration Factor:
1. Press Concentration Factor: Off in the "Options" menu.
2. Press On to activate this function.
3. Press Factor.
4. Enter the factor with which the absorbance measurement is to be multiplied.
5. Press Unit.
6. Select the respective concentration unit from the displayed list.
7. Press OK to confirm.
Concentration Resolution:
1. Press Concentration Resolution in the "Options" menu.
2. Select the resolution.
3. Press OK to confirm.
4. Then press Return to return to measurement mode.

76
Standard programs
5.7.2.2 Complete a reading in the Multi Wavelength mode
1. Insert the zero solution cell into the cell compartment.
2. Press Zero.
Note: The Read key does not become active until the zero reading has been completed.
3. Insert the analysis cell into the cell compartment.
4. Press Read.
5. For data storage, refer to section 5.3.1, page 39.
5.7.3 Time course of absorbance/transmittanceThe Time Course mode is used to collect data in either absorbance or transmittance for a user-specified length of time. This data can be displayed in either a graph or a table.
5.7.3.1 Time course setup parameters
1. In the main menu, press the Time Course menu option.
2. Press Options to configure parameters.
Table 9 Time course options
Options Description
More For further Options
Save iconSymbol: Store Data, if Instrument Setup > Data Log Setup > Auto Store: Off is selected.
Symbol: Recall Data, if Instrument Setup > Data Log Setup > Auto Store: On is selected.
Time & IntervalTo input the total time for data collection and the time interval between the collection of data points.
To input the wavelength setting.
View TableTo display readings in absorbance, transmittance or concentration. This can be changed after sample data is collected
Scale & Units
Scale: In the automatic Scaling mode, the y-axis is automatically adjusted so that the total scan is displayed. The manual Scaling mode allows sections of the scan to be displayed. Units: Choice of absorbance or transmittance.

77
Standard programs
Time & Interval:
1. Press the "Options" menu on the Time & Interval menu option.
2. Enter the total time and measurement interval.
3. Press OK to confirm.
Note: In total, 500 measuring steps can be accomplished during a scan. To select a total time and a time interval that would cause this number of readings to be exceeded, the time interval is defined automatically and the OK key is inactivated.
Scale & Units:
1. Press the "Options" menu on the Scale & Units menu option.
2. Highlight Abs or %T as the required units.
3. Highlight Auto or Manual scaling on the graph's y-axis.
Note: When selecting the manual scaling, the limit values y min and y max can be entered using the alphanumeric keypad. The graph is adjusted to display only the values in the selected range. If automatic scaling is selected, the instrument sets the limits automatically so that the total range can be displayed.
4. Press OK to confirm.
5. Press Return to return to the Scan mode.
Send Data To send Data to a printer, computer or USB memory stick (Type A)
Recall measurement data
Recall saved measurement data, wave-length scans or time courses, see section 5.3, page 38.
Instrument Setup Basic data of the instrument, refer to section 5.2, page 23.
Table 9 Time course options(Continued)
Options Description

78
Standard programs
5.7.3.2 Time course scan reading
After all scan parameters have been selected, the instrument must then be zeroed. Afterward the sample can be analyzed.
1. Insert the zero solution cuvette into the cuvette compartment and close the cuvette compartment cover.
2. Press Zero.
The blank value is displayed on the screen.
3. Insert the analysis cuvette into the cuvette compartment and close the cuvette compartment cover.
4. Press Read.
The instrument will begin collecting Time Course data (kinetic data).
Note: During the reading the Zero and Read keys change to Mark and Stop.
• Mark: Press the Mark button to mark the next measurement point visibly on the screen. This mark is not used by the instrument, but is available for the user and may indicate a significant event, such as the addition of a sample or other reagent. The mark is also shown in the table.
• Select Stop to stop taking sample readings.
5.7.3.3 Analysis of time course data
After the Time Course data has been collected, the following manipulations can be done on the graphic data:
The Time Course Program is complete, if
• the instruments beeps after completion of the overall time
• the graph is shown full-size,
• the scaling of the x-axis occurs automatically,
• the Cursor functions in the vertical navigation bar are highlighted.
Navigation of a time scan or a time scan analysis
After a time scan has been completed, the time and the absorbance/transmittance data is displayed as a curve.
Where the cursor is positioned on the curve, the elapsed time up to this point and the corresponding absorbance are highlighted.

79
Standard programs
5.7.4 Wavelength Scan mode – recording of absorbance and transmission spectrumsIn the Wavelength Scan mode, the absorbance of the light in a solution over a defined wavelength spectrum is measured. While the scan is taking place, the cell compartment cover must be closed. Therefore, a scan of the round cell compartment is not possible.
The reading results can be displayed as a curve, as percentage transmittance (%T) or as Absorbance (Abs). The collected data can be printed as a table or a curve.
The data is available for formatting changes. These include automatic scaling and zoom functions. Maximum and minimum values are determined and shown as a table.
The cursor can be moved to any point on the curve for the purpose of reading off the absorbance or transmittance value and the wavelength. The data for each data point can also be displayed as a table.
Table 10 Navigating the time scan
Cursor function/Zoom function
Description
Curve Icon(Choice of Cursor Mode)
Delta mode: A second cursor is highlighted. The position of the fixed cursor was previously defined in Cursor mode Single. Use the active cursor to select any point on the reading curve. The difference to the fixed cursor is shown on the curve. The delta values are correspondingly highlighted and displayed on the x and y axes.The gradient of the curve and the correlation coefficient (r2) between the cursor points in the Delta mode are shown under the curve.
Cursor mode, single: The cursor moves to each selected measuring point of the scan.
Arrow keys
The arrow keys (right/left) are used to move the cursor (depending on the selected mode) to the next data point. The data of the data point (wavelength, absorbance or transmittance value) are highlighted on the x and y axes.
Note: Press any point on the curve to display the associated data.
Zoom IconThis function is used to magnify the section of the curve in the vicinity of the cursor. The original curve size can be restored by pressing the zoom icon again.

80
Standard programs
5.7.4.1 Set up the wavelength scan
In the main menu, press the Wavelength Scan menu option. Press Options for Parameter Setup.
Table 11 Options during wavelength scan
Option Description
More For further Options
Save iconSymbol: Store Data, if Instrument Setup > Data Log Setup > Auto Store: Off is selected.
Symbol: Recall Data, if Instrument Setup > Data Log Setup > Auto Store: On is selected.
Reference Off/On
From the displayed list of stored scans, a record is selected for use as a reference scan/superimposed scan. This can be highlighted or shown in the background in comparison with the actual measured scan.
Note: This option is only available when there are stored scans with the same wavelength range and step.
Wavelength Enter the wavelength spectrum and scan interval
View TableView Graph
Enables the user to switch the display back and forth between the scan data tables (wavelength/absorbance) and the graph of the curve.
Note: "Select View" will be activated after the first reading.
Cursor ModeTo select Track or Peak/Valley. The selection for this menu item determines to which points on the graph the cursor moves.
Send Data To send data to a printer, computer or USB memory stick (Type A)
Integral: On/Off The integral gives the area and the derivative of the integral gives the original function
Scale & Units
Scale: In the automatic Scaling mode, the y-axis is automatically adjusted so that the total scan is displayed. The manual Scaling mode allows sections of the scan to be displayed. Units: Choice of absorbance or transmittance.
Recall measurement data
Recall saved measurement data, wave-length scans or time courses, see section 5.3, page 38.
Instrument Setup mode Basic data of the instrument, refer to section 5.2, page 23.

81
Standard programs
Set the wavelength range
1. Press the key in the "Options" menu to select the wavelength range and the wavelength step.
2. Press the upper left key to select the lower wavelength.
3. Enter the lower wavelength.
4. Press OK to confirm.
5. Press the upper right key to select the upper wavelength.
6. Enter the upper wavelength.
7. Press OK to confirm.
Note: Do not select the same wavelength for minimum and maximum.
8. Highlight the required wavelength step.
Note: The selection of the interval influences the duration and resolution of the Wavelength Scan. Scans with a high resolution take longer than scans with a low resolution. The larger the increments of the interval selected, the faster the scan runs. In contrast, the resolution of the determined data decreases. In summery maximally 780 measuring steps can be accomplished during a Scan.
Note: The maximum wavelength adjust automatically if the difference between the maximum and minimum wavelength is not a multiple of the interval.
9. Press OK to return to the Scan mode.
Selected parameters are displayed along the graph‘s x-axis.
Select view (display table)
1. Perform a Wavelength Scan (section 5.7.4.2, page 82)
2. Press Display table in the "Options" menu.
3. A table with the results is displayed.
4. To return to the graph press Options and then View Graph.
Cursor Mode
1. Press Cursor mode: tracking in the "Options" menu.
The selection for this menu item determines what data is displayed in the table.
2. Highlight Track or Peak/Valley.
3. Press OK to confirm.
4. Press Return to return to the Scan mode.
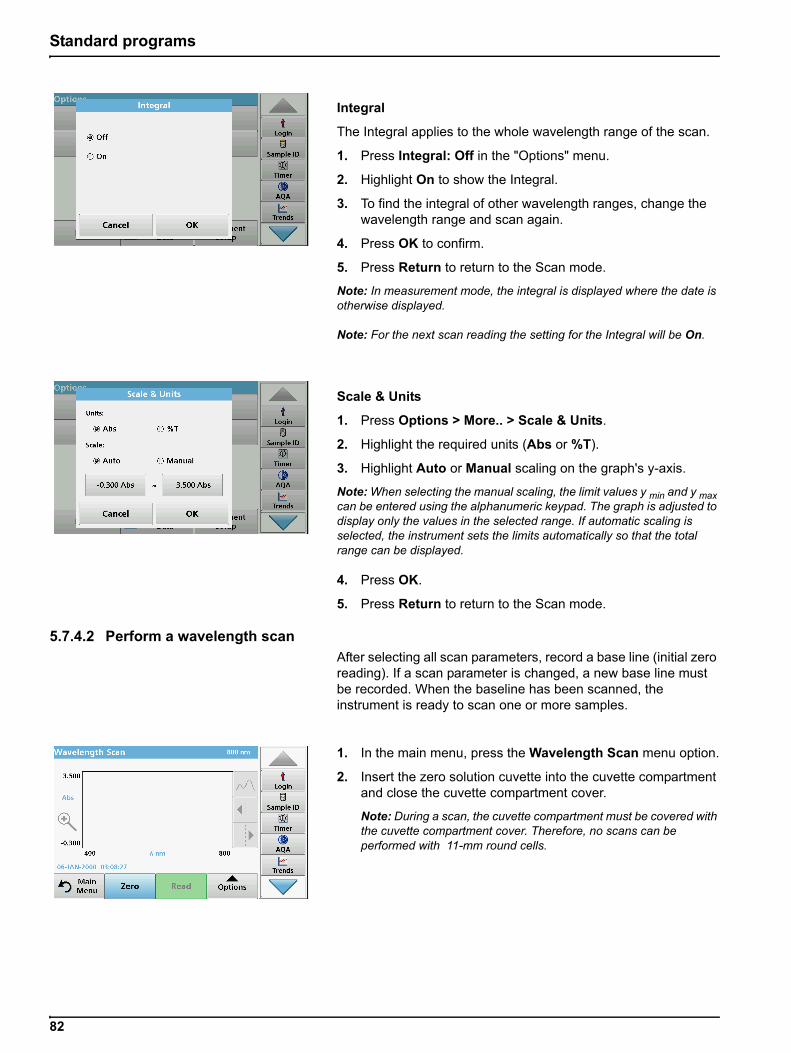
82
Standard programs
Integral
The Integral applies to the whole wavelength range of the scan.
1. Press Integral: Off in the "Options" menu.
2. Highlight On to show the Integral.
3. To find the integral of other wavelength ranges, change the wavelength range and scan again.
4. Press OK to confirm.
5. Press Return to return to the Scan mode.
Note: In measurement mode, the integral is displayed where the date is otherwise displayed.
Note: For the next scan reading the setting for the Integral will be On.
Scale & Units
1. Press Options > More.. > Scale & Units.
2. Highlight the required units (Abs or %T).
3. Highlight Auto or Manual scaling on the graph's y-axis.
Note: When selecting the manual scaling, the limit values y min and y max can be entered using the alphanumeric keypad. The graph is adjusted to display only the values in the selected range. If automatic scaling is selected, the instrument sets the limits automatically so that the total range can be displayed.
4. Press OK.
5. Press Return to return to the Scan mode.
5.7.4.2 Perform a wavelength scan
After selecting all scan parameters, record a base line (initial zero reading). If a scan parameter is changed, a new base line must be recorded. When the baseline has been scanned, the instrument is ready to scan one or more samples.
1. In the main menu, press the Wavelength Scan menu option.
2. Insert the zero solution cuvette into the cuvette compartment and close the cuvette compartment cover.
Note: During a scan, the cuvette compartment must be covered with the cuvette compartment cover. Therefore, no scans can be performed with 11-mm round cells.

83
Standard programs
3. Press Zero.
During the scan of the base line, "Zero calibration" is shown in the screen.
4. Insert the prepared analysis cuvette into the cuvette compartment and close the cuvette compartment cover.
5. Press Read.
Under the graph, the display "Reading..." appears, and a graph of the absorbance or transmittance values for the scanned wavelengths is continuously displayed.
The Wavelength Scan is complete, if
• the graph is shown full-size,
• the scaling of the x-axis occurs automatically,
• the Cursor functions in the vertical navigation bar are highlighted.
• a signal sounds
Navigation of the wavelength scan graph or a wavelength scan analysis
5.7.4.3 Work with reference scans
There are two options to work with Reference Scan:
First option:
1. Press Reference: Off in the "Options" menu to select another scan to display on the same screen with the current scan. Highlight the required scan number and press Highlight reference.
Note: Once a reference scan has been selected, the Reference: Off key in the "Options" menu turns into Reference: On.
Note: Only scans that have the same wavelength range and step can be displayed using the overlay option. This process can be repeated until all matching scans are displayed.
Table 12 Navigating the wavelength scan
Cursor function/Zoom function
Description
Curve Icon(Choice of Cursor mode)
Choice of Cursor mode Peak/Valley (cursor moves between minimum/maximum absorbance values) or Cursor mode Tracking (cursor moves over each data point of the scan).
Arrow keys
The arrow keys (right/left) are used to move the cursor (depending on the selected mode) to the next data point. The data of the data point (wavelength/absorbance or transmittance value) are highlighted on the x and y axes.
Note: Press any point on the curve to display the associated data.
Zoom IconThis function is used to magnify the section of the curve in the vicinity of the cursor. The original curve size can be restored by pressing the zoom icon again.

84
Standard programs
2. The reference curve is displayed in orange. The absorbance or transmittance value and the associated wavelength are highlighted in grey.
Note: A black and an orange field are displayed in the top left of the screen. The orange box relates to the reference scan and the black one relates to the current wavelength scan.
3. To complete the wavelength scan reading, refer to section 5.7.4.2, page 82.
• The newly plotted wavelength scan curves are shown in black.
• The absorbance or transmittance value and the associated wavelength are highlighted in black.
• In addition, the display shows the difference between the wavelength scan curve and the reference curve against the wavelength.
4. Press the black or orange field in the top left corner of the screen to toggle between the measured wavelength scan and the reference scan
Second option:
1. Insert the zero solution cell into the cell compartment. Press Zero.
2. Insert the analysis cell into the cell compartment. Tap on Read.
• The newly plotted wavelength scan curves are shown in black.
• The absorbance or transmittance value and the associated wavelength are highlighted in black.
3. Press Options and then Reference: Off in the "Options" menu to select another scan to display on the same screen with the current scan. Highlight the required scan number and press Highlight Reference.
Note: After selecting a reference scan the Reference: Off key in the "Options" menu turns into Reference: On.
Note: Only scans that have the same wavelength range and step can be displayed using the overlay option. This process can be repeated until all matching scans are displayed.
85
Standard programs
4. The reference graph is displayed in orange. The absorbance or transmittance value and the associated wavelength are displayed in orange.
• In addition, the difference of the absorbance and/or transmittance value between the two scans (measured scan and reference scan) is indicated/highlighted at each position of the cursor.
Note: A black and an orange field are displayed in the top left of the screen. The orange box relates to the reference scan and the black one relates to the current wavelength scan.
5. Press the black or orange field in the top left corner of the screen to toggle between the measured wavelength scan and the reference scan

86
Standard programs

87
Section 6 Advanced Operations
6.1 System Checks
1. Press System Checks in the Main Menu.
The "System Check" menu contains instrument information and various performance tests.
6.1.1 Instrument Information
1. Press Instrument Information in the "System Check" menu.
2. The model, serial number and software version are displayed.
6.1.2 Update the instrument software
6.1.2.1 Software update with USB memory
To obtain the software for the update from the Internet at www.hach.com:

88
Advanced Operations
1. Go to http://www.hach.com.
2. Select the country.
3. Enter LICO into the "Search" field.
4. Select Documents and Software from the field "according to".
5. Navigate to the corresponding file for download.
6. Save the file to a USB storage device or PC.
7. Tap on Instrument Update in the "System Checks" menu.
8. Plug the USB storage device into the USB port (USB A) of the device, refer to section 3.5, page 16.
9. Press OK. The link is established automatically and the software is updated.
10. Press OK to return to the "System Check" menu.
Note: After the instrument update, a prompt to restart the instrument will be displayed.
6.1.2.2 Software update with network connection
If the instrument, as described under section 5.2.6.4, is connected to the Internet, the instrument will check during the test program whether a new software update is available on the website http://www.hach.com.
1. Press OK to confirm the one-time window "Run software update".
The link is established automatically and the software is updated.
2. Press OK to return to the "System Check" menu.
Note: After the instrument update, a prompt to restart the instrument will be displayed.
6.1.3 Optical Checks
The Verification Kit (refer to Section 9, page 107) is designed for periodic monitoring of scattered light, photometric accuracy and the wavelength accuracy of the spectrophotometers.
When results exceed allowable tolerances (given in the quality control certificate to the test record), contact the manufacturer.
1. Press Optical Checks in the "System Check" menu.
2. Press Nominal Values.

89
Advanced Operations
3. Press Edit.
An automatic menu guidance queries values (filters, wavelength, nominal values and tolerances) given in the quality control certificate, to the following specifications:
• Stray light
• Photometrical accuracy
• Wavelength accuracy
4. Press OK when all values are entered and the overview is displayed.
5. Press Verification.
6. Insert cuvette adapter Z (Figure 3, page 18) into the cuvette shaft (2).
7. Remove any present cuvettes from the cuvette compartment.
8. Close the cuvette compartment cover.
9. Press Start.
10. Follow the instructions on the screen and insert the different filters one after another in the sequence shown.
11. Press Next after inserting a filter.

90
Advanced Operations
After the last reading the results are displayed.
12. Press PC & Printer icon to send the data to a USB memory stick, PC or to a printer.
The files will be stored automatically as CSV files (Comma Separated Value). The file name will be formatted as "Verification.csv".
6.1.4 AQA Analytical Quality Assurance
6.1.4.1 Standard Configuration
Analyzing an AQA standard solution enables you to check your working procedure, photometer and accessories.
1. Under "System Check", select AQA, or press AQA in the toolbar on the right of the screen.
A list of standard solutions opens.
2. Select Options > New to define a new standard.
3. Enter the name of the standard solution and confirm with OK.

91
Advanced Operations
4. Enter the concentration, unit, confidence range and unit by pressing the relevant fields.
5. Press OK to confirm the entry.
6. All the standard solutions entered are shown on the screen.
7. Select Options for further editing.
Select New to define a new standard.
Select Edit to change the settings.
Select Delete to delete the standard. Only user-programmed standards can be deleted.
Select Reminder to enter an automatic interval at which you are prompted to take a standard measurement.
6.1.4.2 Perform AQA Standard Measurement
If you have set a reminder function, you will be prompted to take the AQA standard measurement after a set interval has elapsed.
1. Select the required AQA standard.
The AQA button in the toolbar is displayed in yellow.
2. Take the standard measurement.

92
Advanced Operations
6.1.5 Instrument backup
Prior to the next service date, the "Instrument Backup" offers the opportunity to store all programs, measurement data, user IDs, passwords, as well as all adjustable data on a USB stick.
1. Press Instrument Backup in the "System Check" menu.
2. Insert the USB stick (refer to section 3.5, page 16).
3. Press Store to start a Backup.
If the file was stored, the message "Instrument Backup is stored" will be displayed.
4. Press OK to return to the "System Check" menu.
Restore backup data:
Note: All current data will be overwritten when restoring the Backup file!
1. Press Instrument Backup in the "System Check" menu.
2. Insert the USB stick with the backup (refer to section 3.5, page 16).
3. Press Restore to pass back the data.
4. The report "Restore instrument backup from S/N XXXXXXX. "Restore?" displays the serial number of the instrument relating to the backup. Press OK to confirm.
5. Restart the instrument after the backup is complete.

93
Advanced Operations
6.1.6 Service menu
Use of the service menu requires a service code. This menu is reserved exclusively for the service staff of the manufacturer for service work.
6.1.7 Service time
In order to make sure a regular inspection is performed, an automatic memory reference for the service times can be entered. After switching the instrument on, this memory reference will be activated and indicated at the appropriate time.
1. Press Service Time in the "System Check" menu.
2. Activate the On checkbox.
3. Press Last service.
4. Enter the date of the last service.
5. Press OK to confirm the selection.
6. Activate the options field under Next service.
7. Select a time interval for the next service.
8. Press OK to confirm the selection.
When the next service is due the report "Next service due!!" is displayed when the instrument is switched on.
9. Press OK to return to the Main Menu.
Contact the manufacturer to schedule the next service date.
6.1.8 Lamps operating time
The "Lamps operating time" provides information on the switch-on cycles of the lamps.

94
Advanced Operations
After a lamp is replaced, the display of the switch-on cycles is reset to 0.
1. Press Lamp History in the "System Check" menu.
2. Press Reset and the lamp data are reset.
3. Press OK to return to the "System Check" menu.
6.2 Toolbar
There is a toolbar with various programs on the right-hand side of the screen. Many of these programs can also be called up via a menu but the operation is the same.
6.2.1 Log on
Use this function to enter up to 30 different operator initials (up to 10 characters each) into the instrument. This feature helps record which operator measured each sample. For a detailed description, refer to section 5.2, page 23.
6.2.2 Sample ID
Use this function to enter up to 100 different sample designations (each with max. 20 characters) into the instrument. Sample IDs can be used to specify the sample location or other sample specific information, for example. For a detailed description, refer to section 5.2.2, page 24.

95
Advanced Operations
6.2.3 Timer
Use this function to activate a timer at any time.
1. In the toolbar, press Timer.
2. Enter the required time and confirm with OK.
The count-down starts automatically.
3. Press Close to let the timer run in the background.Press Cancel to stop the timer.
4. When the timer has finished a sound is emitted.
6.2.4 AQA
Analyzing an AQA standard solution enables you to check your working procedure, photometer and accessories. Press AQA in the toolbar on the right-hand side of the screen to open a list of standard solutions. For a detailed description, refer to section 6.1.4, page 90.
6.2.5 Trends
Use this function to call up a load curve of the stored measurement values for each parameter or sample location. The concentration of the corresponding parameter is shown graphically over time. For a detailed description, refer to section 5.3.5, page 51.
6.2.6 LICO Website
Use this function to open a website via an existing network connection. Here you will find the latest software updates, as well as documents and information on the instrument.
The labeling of the key varies from model to model and may vary from the illustration in these instructions.

96
Advanced Operations
97
Section 7 Maintenance
7.1 Cleaning requirements
7.1.1 Spectrophotometer
• Only clean the housing, the cell compartments and all accessories with a soft, damp cloth. A mild soap solution can also be used.
• Do not get excess water in the cell compartments.
• Do not insert a brush or sharp object into cell compartment #1 to avoid damaging the mechanical components.
• Dry the cleaned parts carefully with a soft cotton cloth.
7.1.2 Screen
• Do not scratch the screen. Never touch the screen with pens, pencils or similar sharp objects.
• Clean the screen using a soft, lint-free and oil-free cotton cloth. Diluted window cleaner liquid can also be used.
C A U T I O NPotential Chemical, Biological Eye and Skin Hazards.
Only qualified personnel should conduct the tasks described in this section of the manual.
N O T I C ERemove all cells remaining in the instrument. Dispose of the cells or their contents in an authorized manner.
C A U T I O NPotential Pinch, Eye, Burn and Chemical Hazards.
Before cleaning, always disconnect the instrument from the power source.
N O T I C EUnder no circumstances may solvents such as turpentine, acetone or similar be used to clean the instrument, including the screen and accessories.
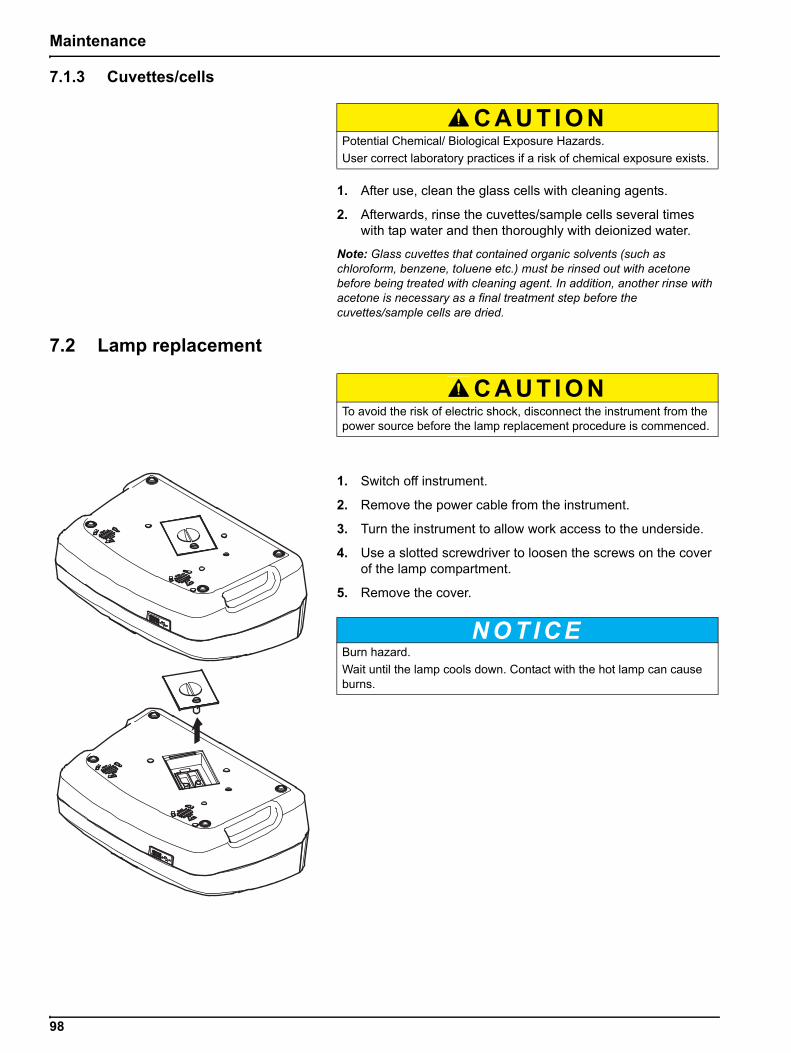
98
Maintenance
7.1.3 Cuvettes/cells
1. After use, clean the glass cells with cleaning agents.
2. Afterwards, rinse the cuvettes/sample cells several times with tap water and then thoroughly with deionized water.
Note: Glass cuvettes that contained organic solvents (such as chloroform, benzene, toluene etc.) must be rinsed out with acetone before being treated with cleaning agent. In addition, another rinse with acetone is necessary as a final treatment step before the cuvettes/sample cells are dried.
7.2 Lamp replacement
1. Switch off instrument.
2. Remove the power cable from the instrument.
3. Turn the instrument to allow work access to the underside.
4. Use a slotted screwdriver to loosen the screws on the cover of the lamp compartment.
5. Remove the cover.
C A U T I O NPotential Chemical/ Biological Exposure Hazards.
User correct laboratory practices if a risk of chemical exposure exists.
C A U T I O NTo avoid the risk of electric shock, disconnect the instrument from the power source before the lamp replacement procedure is commenced.
N O T I C EBurn hazard.
Wait until the lamp cools down. Contact with the hot lamp can cause burns.
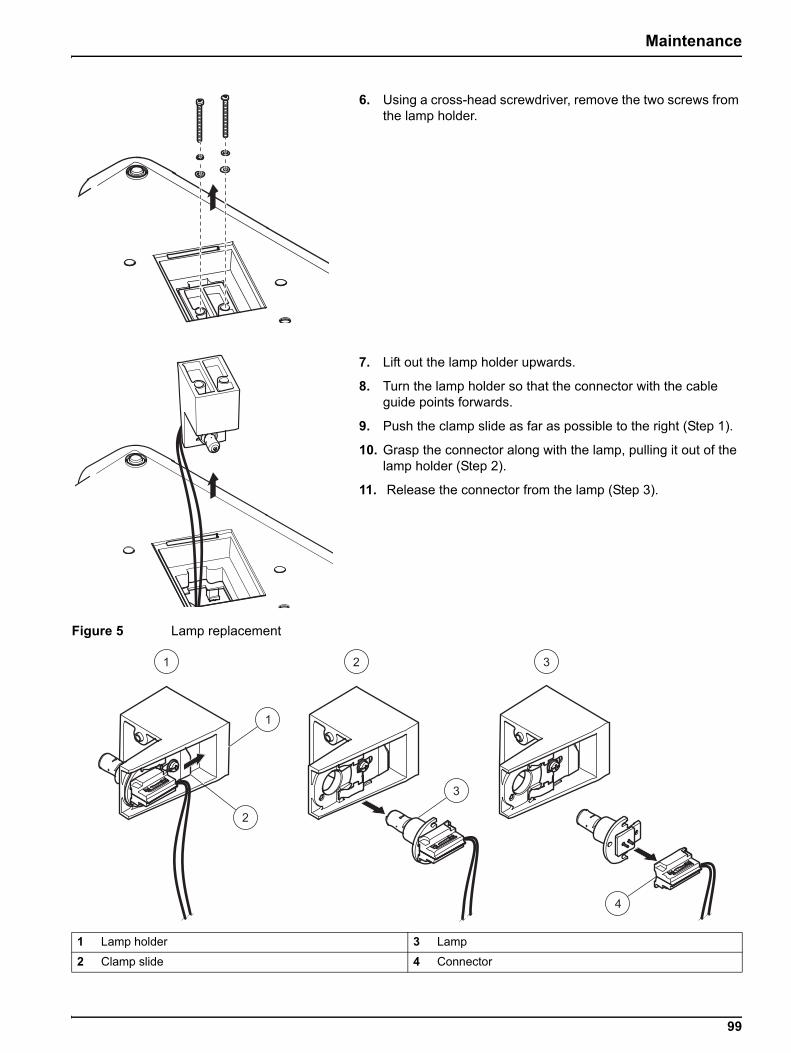
99
Maintenance
6. Using a cross-head screwdriver, remove the two screws from the lamp holder.
7. Lift out the lamp holder upwards.
8. Turn the lamp holder so that the connector with the cable guide points forwards.
9. Push the clamp slide as far as possible to the right (Step 1).
10. Grasp the connector along with the lamp, pulling it out of the lamp holder (Step 2).
11. Release the connector from the lamp (Step 3).
Figure 5 Lamp replacement
1 Lamp holder 3 Lamp
2 Clamp slide 4 Connector

100
Maintenance
To fit a new lamp carry out the procedure in reverse.
1. Connect a new lamp to the connector.
2. Install the lamp with the connector in the lamp holder.
3. Secure the lamp with the clamp slide. To do this, push the connector downwards and push the clamp slide as far as possible to the left.
4. Install the lamp holder in the instrument.
Note: Take care that the lamp cable is not pinched by the cable guide.
5. Using a cross-head screwdriver, tighten the two screws on the lamp holder.
6. Put the lamp compartment cover back into position.
7. Using a slotted screwdriver, tighten the screws on the cover.
8. Connect the power cable to the instrument.
9. Reset the lamp operating time section 6.1.8, page 93.
7.3 Cell compartment (2) replacement
If there is severe soiling, the complete cell compartment (2) can be replaced.
N O T I C EOnly hold lamp at lamp holder. Avoid touching the glass, as substances on the skin can bake onto the lamp bulb and thus accelerate the ageing process of the lamp.
C A U T I O NTo avoid electric shock, disconnect the instrument from the power supply before replacing the cuvette compartment.
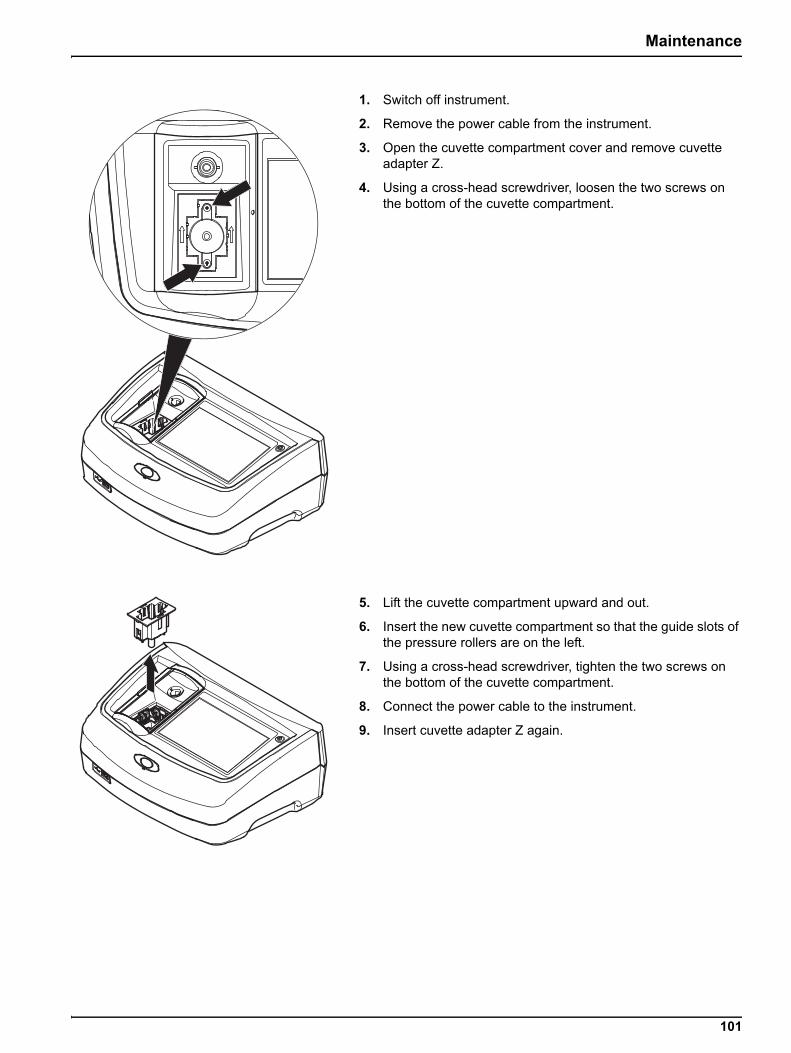
101
Maintenance
1. Switch off instrument.
2. Remove the power cable from the instrument.
3. Open the cuvette compartment cover and remove cuvette adapter Z.
4. Using a cross-head screwdriver, loosen the two screws on the bottom of the cuvette compartment.
5. Lift the cuvette compartment upward and out.
6. Insert the new cuvette compartment so that the guide slots of the pressure rollers are on the left.
7. Using a cross-head screwdriver, tighten the two screws on the bottom of the cuvette compartment.
8. Connect the power cable to the instrument.
9. Insert cuvette adapter Z again.

102
Maintenance

103
Section 8 Troubleshooting
Error displayed Definition Resolution
An error occurred when uploading the instrument data.
Restart the process or contact the manufacturer or national agent.
An error occurred when reading from the USB memory stick.
Restart the process or contact the manufacturer or national agent.
An error occurred when writing to the USB memory stick.
Restart the process or contact the manufacturer or national agent.
Please check on the current update file.
Error during update. Check the USB memory stick.
Please contact Customer Service. Error during update.Contact the manufacturer or national agent.
Please check network configuration. See section 5.2.6.4, page 35.
Please check the connection. See section 5.2.6.4, page 35.
Please close the cover. Close the cuvette compartment cover.
Please insert the USB memory stick.Insert a USB memory stick into a USB A port on the instrument.
Please check the connection and contact the administrator.
Network setup or FTP errorRefer to section 5.2.6.4, page 35 or contact the manufacturer or national agent.
File for instrument update missing. Error during update. Check the USB memory stick.
File for instrument update is faulty. Error during update.Save the update file again and repeat the procedure.
It’s recommended to execute a Full System Check
Check of the air values failed
Switch the instrument off and then back on again. If the system test is unsuccessful, contact the manufacturer or national agent.
Entry invalid! Password incorrectForgotten your password?
Contact the manufacturer or national agent
Absorbance > 3.5!The measured absorbance exceeds 3.5
Dilute sample and measure again
Color = ***Color value outside measurement range.
Dilute the sample or select appropriate color scale.
Error when calling up the local IP address.
Network setup: DHCP client has no connection to the DHCP server
Enter the IP address again.
Error during default gateway setup.Network setup: default gateway cannot be set for fixed IP address
Try to create the connection again.
Error during network drive setup! Error during network setup Check the settings.
Error during subnet mask setup.Network setup: Subnet mask cannot be set for fixed IP address
Enter the subnet mask again.
Error copying from USB memory stick.
Error during updateRestart the process or contact the manufacturer or national agent.
Error in FTP connection. FTP errorMake sure that the instrument is connected to the network.

104
Troubleshooting
FaultTest program stopped!Please check lampClose the lid.Error [xx]
Test program stops when the instrument is started
Check the lamp and replace it if necessary.
Close lid.
Press Start Again.
FaultTest program stopped!Please remove the cuvetteClose the lid.
Test program stops when the instrument is started
Remove the cuvette/sample cell from the cell compartment.
Press OK.
ErrorSelfcheck stopped.Hardware error.Error [x]
Electronic defectContact the manufacturer or national agent and specify the error number.
ErrorToo much ambient light!Move instrument into shadeor close the lid
The instrument sensors detects too much ambient light.
Decrease ambient light. Avoid direct sunlight.
Close lid.
No instrument backup present! Check the USB memory stick.
No valid data for these parameters!Data analysis not possible, no measurement data
Change the selection.
No valid data found! Data cannot be viewed in the data log Change the selection.
No measurement data present!Data analysis settings cannot be configured without measurement data.
Change the selection.
Control range not reached! Data analysis limits not reachedThis is a warning notice. The control limit set was not reached.
Control range exceeded! Data analysis limits exceeded.This is a warning notice. The control limit was exceeded.
Concentration too high!Calculated concentration is higher than 999999
Dilute sample and measure again
Possible interference by: Interference CheckThe analysis is possibly erroneous due to interferences.
Possible interference from: Interference CheckThe analysis is possibly erroneous due to interferences.
Next service is due!
Contact the manufacturer or national agent for an instrument service. For setting the service reminder, refer to section 6.1.7, page 93
Negative result! The calculated result is negative Check concentration of sample
Network switched off.Network setup off, when access to homepage via sidebar
Activate the online connection.
Remote server cannot be reached. Error during network setupMake sure that the instrument is connected to the network.
Unstable lighting conditions!Avoid direct sunlight at the measuring location.
Please insert adapter Z.For measurements with 11 mm round cuvettes, adapter Z is required.
Insert adapter Z into cell compartment #2. Confirm with OK.
Insufficient memory for update . Error during update. Select a memory with more space.
Error displayed Definition Resolution
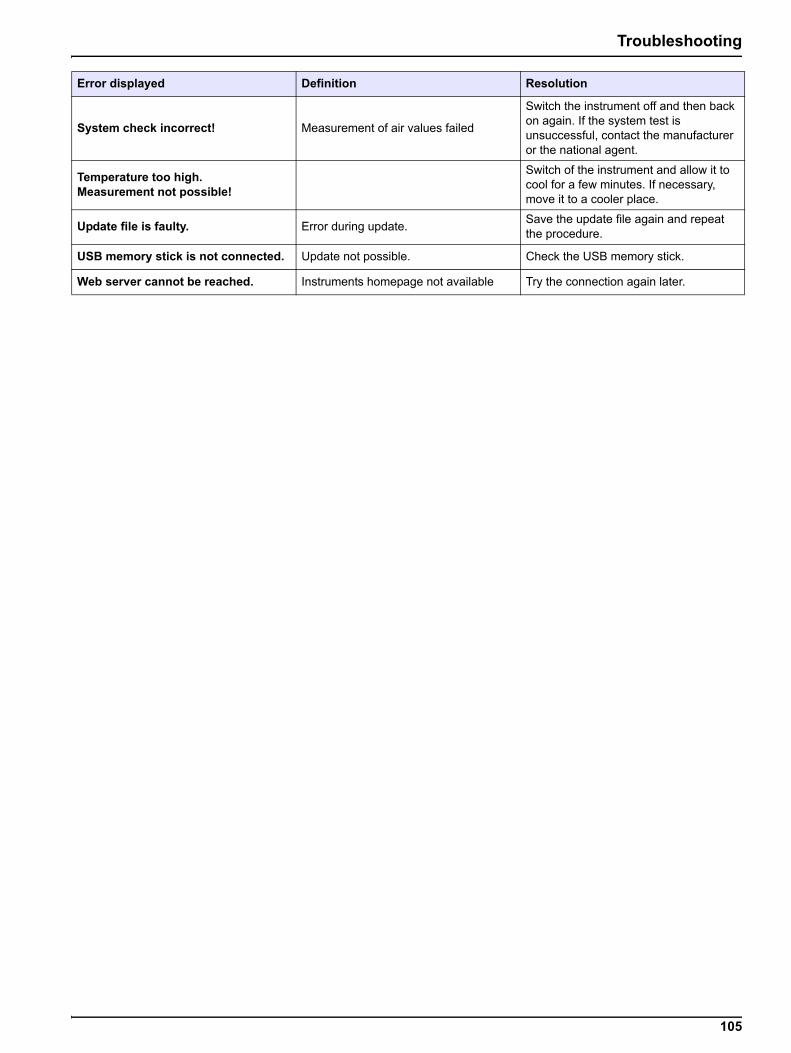
105
Troubleshooting
System check incorrect! Measurement of air values failed
Switch the instrument off and then back on again. If the system test is unsuccessful, contact the manufacturer or the national agent.
Temperature too high.Measurement not possible!
Switch of the instrument and allow it to cool for a few minutes. If necessary, move it to a cooler place.
Update file is faulty. Error during update.Save the update file again and repeat the procedure.
USB memory stick is not connected. Update not possible. Check the USB memory stick.
Web server cannot be reached. Instruments homepage not available Try the connection again later.
Error displayed Definition Resolution

106
Troubleshooting

107
Section 9 Replacement Parts
9.1 Accessories
9.2 Replacement Parts
Description Cat. No.
Certified test filter set for self-checks (Verification Kit) 4 precision glass filters with nominal values
LZM339
"Addista-color" certified testing solution set consisting of 6 certified test solutions LZM282
11 mm round cuvettes, glass, 560 units LYY621
10 mm square cuvettes, glass, 3 units LZP045
10 mm square plastic cuvettes, PS, 1000 units EBK019
50 mm square cuvette, glass, 1 unit LZP167
50 mm square cuvettes, PMMA with cover, 10 units LZP341
50 mm square cuvettes, PMMA, 50 units LZM130
Hand barcode scanner LZV566
USB-Memory Stick LZV568
USB keypad (US keypad layout) LZV582
Hach Lange Online Data for direct data transfer to MS Excel LZV799
Protective cap for USB port LZV881
USB extension cord LZV567
Ethernet cable, shielded, 2 m in length. LZV873
Interface cable USB - computer LZV632
Description Cat. No.
Halogen lamp LZV565
Cuvette adapter Z LZM369
Cell compartment (2) LZV848
Bench top power supply LZV844
Power cord EU YAA080
Power cord CH XLH051
Power cord UK XLH057
Power cord US XLH055
Power cable China/Australia XLH069
Dust Cover LZV845

108
Replacement Parts

109
Section 10 Limited warranty
Hach Company warrants its products to the original purchaser against any defects that are due to faulty material or workmanship for a period of one year from date of shipment unless otherwise noted in the product manual.
In the event that a defect is discovered during the warranty period, Hach Company agrees that, at its option, it will repair or replace the defective product or refund the purchase price excluding original shipping and handling charges. Any product repaired or replaced under this warranty will be warranted only for the remainder of the original product warranty period.
This warranty does not apply to consumable products such as chemical reagents; or consumable components of a product, such as, but not limited to, lamps and tubing.
Contact Hach Company or your distributor to initiate warranty support. Products may not be returned without authorization from Hach Company.
Limitations
This warranty does not cover:
Damage caused by acts of God, natural disaster, labor unrest, acts of war (declared or undeclared), terrorism, civil strife or acts of any governmental jurisdiction
Damage caused by misuse, neglect, accident or improper application or installation
• Damage caused by any repair or attempted repair not authorized by Hach Company
• Any product not used in accordance with the instructions furnished by Hach Company
• Freight charges to return merchandise to Hach Company
• Freight charges on expedited or express shipment of warranted parts or product
• Travel fees associated with on-site warranty repair
This warranty contains the sole express warranty made by Hach Company in connection with its products. All implied warranties, including without limitation, the warranties of merchantability and fitness for a particular purpose, are expressly disclaimed.
Some states within the United States do not allow the disclaimer of implied warranties and if this is true in your state the above limitation may not apply to you. This warranty gives you specific rights, and you may also have other rights that vary from state to state.
This warranty constitutes the final, complete, and exclusive statement of warranty terms and no person is authorized to make any other warranties or representations on behalf of Hach Company.
Limitation of Remedies
The remedies of repair, replacement or refund of purchase price as stated above are the exclusive remedies for the breach of this warranty. On the basis of strict liability or under any other legal theory, in no event shall Hach Company be liable for any

110
Limited warranty
incidental or consequential damages of any kind for breach of warranty or negligence.
111
Index
AAbsorbance Formula ................................................ 74
Acid wash color ........................................................ 66
ADMI color number .................................................. 65
Alphanumeric keypad ............................................... 21
APHA method .......................................................... 59
ASTM D 1500 .......................................................... 59
ASTM D 156 ............................................................ 60
ASTM D 1925 .......................................................... 65
ASTM D848 - 09 ...................................................... 66
Audio signals ............................................................ 32
CCell compartment (1) ................................................ 16
Cell compartment (2) ................................................ 17
Chinese Pharmacopoeia .......................................... 64
Cleaning
Display .................................................................. 97
Spectrophotometer ............................................... 97
color difference ......................................................... 67
Concentration Factor ................................... 72, 74, 75
Concentration Resolution ............................. 72, 74, 75
Cursor Mode ...................................................... 80, 81
Cuvette compartment cover ..................................... 14
Cuvettes/cells ........................................................... 98
DData
deleting ..................................................... 38, 42, 48
recalling .......................................................... 38, 48
sending ........................................................... 38, 48
storing ............................................................. 38, 48
Data Folder .............................................................. 37
Data log ...................................................................... 7
Data Storage ............................................................ 48
Date and time ........................................................... 30
Default Gateway ...................................................... 36
DIN 6162 .................................................................. 58
DIN-ISO 2049 .......................................................... 59
DIN-ISO 4630 .......................................................... 59
DIN-ISO 6271 .......................................................... 59
Display ............................................................... 21, 97
Display and Sound ................................................... 32
Display mode ............................................................. 7
Disposal ..................................................................... 9
Documentation overview .......................................... 95
Drift Check ............................................................... 93
EEthernet communication .......................................... 35
Ethernet port ............................................................ 16
European Pharmacopoeia ....................................... 60
FFactory Service ........................................................ 93
Filter Settings ..................................................... 40, 45
GGardner color value .................................................. 59
HHazen color value .................................................... 59
Hess-Ives color number ........................................... 65
IICUMSA color index ................................................. 66
Instrument Backup ................................................... 92
Instrument Information ............................................. 87
Instrument Setup ........................ 22, 23, 72, 74, 77, 80
Integral ............................................................... 80, 82
Interfaces ........................................................... 16, 32
Internet ..................................................................... 87
Iodine color value ..................................................... 58
IP address ................................................................ 35
KKlett color number .................................................... 64
Llamp ......................................................................... 10
Lamp History ............................................................ 93
Language ................................................................. 19
LICO ......................................................................... 95
local networks .......................................................... 35
Lovibond scale ......................................................... 65
MMain menu ............................................................... 22
Maintenance ............................................................. 97
Marking .................................................................... 78
Mineral oil color value .............................................. 59
Multi Wavelength .............................. 22, 73, 74, 75, 76
NNetwork setup .......................................................... 35

112
Index
OOperator ID .............................................................. 23
Optical Checks ............................................. 88, 90, 93
Output Checks ......................................................... 93
Overview of Product/Function .................................. 10
PPassword ........................................................... 27, 38
deactivate ............................................................. 30
PC and Printer ............................................. 32, 33, 34
Pharmacopoeia
European .............................................................. 60
US ......................................................................... 63
Photometric accuracy ................................................ 7
Photometric linearity .................................................. 7
Photometric measuring range .................................... 7
Photometry ............................................................... 71
Power cable ............................................................. 13
Prepare sample ........................................................ 53
Printer Setup ............................................................ 33
Printing data ............................................................. 34
Program overview .................................................... 22
RRecall ....................................................................... 22
Recall Data ....................................... 49, 72, 74, 77, 80
Reference ................................................................ 70
Reference Scan ................................................. 80, 83
reference values ...................................................... 70
Replaceable cuvette compartment ......................... 100
SSafety information ...................................................... 9
Sample ID ................................................................ 24
creating ................................................................. 24
deleting ................................................................. 26
Saybolt color number ............................................... 60
Scale & Units .......................................... 76, 77, 80, 82
Scanning speed ......................................................... 7
Security List ............................................................. 27
Select View .............................................................. 81
Self-Check ............................................................... 19
Send Data .............................................. 41, 46, 77, 80
Server Name ............................................................ 37
Service Time ............................................................ 93
Single Wavelength ............................................. 22, 72
Software ................................................................... 87
Source lamp ............................................................... 7
Specifications ............................................................. 7
Spectral bandwidth ..................................................... 7
Startup melody ......................................................... 19
Startup process ........................................................ 19
Stored Data .............................................................. 39
Stored programs ....................................................... 71
Stray light ................................................................... 7
Subnet Mask ............................................................ 36
System Check .................................................... 19, 93
System Checks ................................ 22, 87, 90, 92, 93
TTime & Interval ................................................... 76, 77
Time Course ................... 22, 48, 49, 50, 51, 76, 77, 78
Time course ............................................................. 78
Time course scan reading ........................................ 78
Timer ........................................................................ 32
Toolbar ..................................................................... 94
Touch screen ............................................................ 21
Troubleshooting ..................................................... 103
UUnpacking the instrument ........................................ 13
Update ...................................................................... 87
US Pharmacopoeia .................................................. 63
USB port type A ....................................................... 14
USB port type B ....................................................... 15
VVerification Kit .......................................................... 93
View Table ................................................................ 76
WWarranty ................................................................. 109
Wavelength ........................................................ 72, 74
Wavelength accuracy ................................................. 7
Wavelength calibration ............................................... 7
Wavelength Check ................................................... 90
Wavelength Range ............................................... 7, 81
Wavelength reproducibility ......................................... 7
Wavelength resolution ................................................ 7
Wavelength Scan ..... 22, 48, 49, 50, 51, 79, 80, 81, 83
Wavelength selection ................................................. 7
Wavelength setting ................................................... 76
Wavelength spectrum .............................................. 80
YYellowness Index ..................................................... 65


HACH COMPANY World HeadquartersP.O. Box 389, Loveland, CO 80539-0389 U.S.A.Tel. (970) 669-3050(800) 227-4224 (U.S.A. only)Fax (970) [email protected]
HACH LANGE GMBHWillstätterstraße 11D-40549 Düsseldorf, GermanyTel. +49 (0) 2 11 52 88-320Fax +49 (0) 2 11 52 [email protected]
HACH LANGE Sàrl6, route de Compois1222 VésenazSWITZERLANDTel. +41 22 594 6400Fax +41 22 594 6499
© Hach Company/Hach Lange GmbH, 2012, 2018. All rights reserved. Printed in Germany 11/2018, Edition 5


