PORTLAND STATE UNIVERSITY DEPARTMENT OF CIVIL & ENVIRONMENTAL ENGINEERING CENTER FOR TRANSPORTATION STUDIES Using Archived Data to Measure Operational Benefits of ITS Investments: Region 1 Incident Response Program Robert L. Bertini Michael W. Rose Ahmed M. El-Geneidy Sponsored by OREGON DEPARTMENT OF TRANSPORTATION TRANSPORTATION NORTHWEST (TransNow) In cooperation with U.S. Department of Transportation Federal Highway Administration Research Report June 2004
Transcript
PORTLAND STATE UNIVERSITY DEPARTMENT OF CIVIL & ENVIRONMENTAL ENGINEERING CENTER FOR TRANSPORTATION STUDIES
Using Archived Data to Measure Operational Benefits of ITS Investments: Region 1 Incident Response Program Robert L. Bertini Michael W. Rose Ahmed M. El-Geneidy
Sponsored by OREGON DEPARTMENT OF TRANSPORTATION TRANSPORTATION NORTHWEST (TransNow)
In cooperation with U.S. Department of Transportation Federal Highway Administration
Research Report June 2004
Using Archived Data to Measure Operational Benefits of ITS Investments: Incident Response Program Page ii
Portland State University Center for Transportation Studies 2004
TABLE OF CONTENTS Disclaimer iii List of Figures iv List of Appendicies v Acknowledgements vi 1.0 Introduction 1
1.1 Background 1 1.2 The Region 1 Incident Response Program 3 1.3 Costs of the Incident Response Program 4 1.4 Organization of the Report 4
2.0 Literature Review 5 3.0 Data Sources 8 3.1 Incident Database 8 3.2 Automated Vehicle Location 9 3.3 Inductive Loop Detectors 9 3.4 Automatic Traffic Recorders 10 3.5 Weather Data 10 3.6 Observations 10 4.0 Analysis 12 4.1 Metro Area Incident Statistics 12 4.2 Incidents and Weather Conditions 13 4.3 Crashes and Stalls 14 4.4 Resource Allocation 14 4.5 Interstate 5 Analysis 15 4.6 An Incident With Response 16 4.7 Estimation of Delay 17
4.8 Estimating the Cost of Delay 18 4.9 Cost/Benefit Analysis of the Incident Response Program 19
Using Archived Data to Measure Operational Benefits of ITS Investments: Incident Response Program Page iii
Portland State University Center for Transportation Studies 2004
DISCLAIMER The contents of this report reflect the views of the authors, who are responsible for the facts and
the accuracy of the data presented herein. This document is disseminated through the
Transportation Northwest (TransNow) Regional Center under the sponsorship of the U.S.
Department of Transportation UTC Grant Program and through the Oregon Department of
Transportation. The U.S. government assumes no liability for the contents or use thereof.
Sponsorship for the local match portion of this research project was provided by the Washington
State Department of Transportation. The contents do not necessarily reflect the official views or
policies of the U.S. Department of Transportation or Washington State Department of
Transportation. This report does not constitute a standard, specification, or regulation.
Using Archived Data to Measure Operational Benefits of ITS Investments: Incident Response Program Page iv
Portland State University Center for Transportation Studies 2004
LIST OF FIGURES
Figure 1 Incident Response Coverage and Beat Map
Figure 2 Incident Type (A), Lanes Blocked (B), and Incident Location (C) by Percent 2001
Figure 3 Lane Location Trees 2001
Figure 4 Incident Frequency 2001
Figure 5 Incidents Per Month by Type 2001
Figure 6 Crashes and Precipitation
Figure 7 Frequency of Crashes by Duration(A) and Frequency of Stalls by Duration (B)
Figure 8 Frequency of Crashes by Day of Week (A) and by Time of Day (B)
Figure 9 Incidents by Time and Duration (A), and by Concurrent Incidents vs Available IR
Vehicles (B) for one Tuesday
Figure 10 Average Ongoing Incidents by Day of Week vs. IR Vehicles
Figure 11 Incidents on I-5 by Time of Day (A) and Day of Week (B) 2001
Figure 12 Frequency of Incidents by Duration on I-5 2001
Figure 13 Incidents by Type and Location on I-5
Figure 14 Location of One Incident, IR Vehicles, and Loop Detectors.
Figure 15 Typical Delay Curve
Figure 16 Efficiency Curve
Using Archived Data to Measure Operational Benefits of ITS Investments: Incident Response Program Page v
Portland State University Center for Transportation Studies 2004
LIST OF APPENDICES
APPENDIX A Data Dictionary
APPENDIX B Automatic Traffic Recorders
APPENDIX C Capacity Reduction Table
APPENDIX D Value of Travel Time Estimate, 1999
APPENDIX E Vehicle Occupancy Rates for Oregon
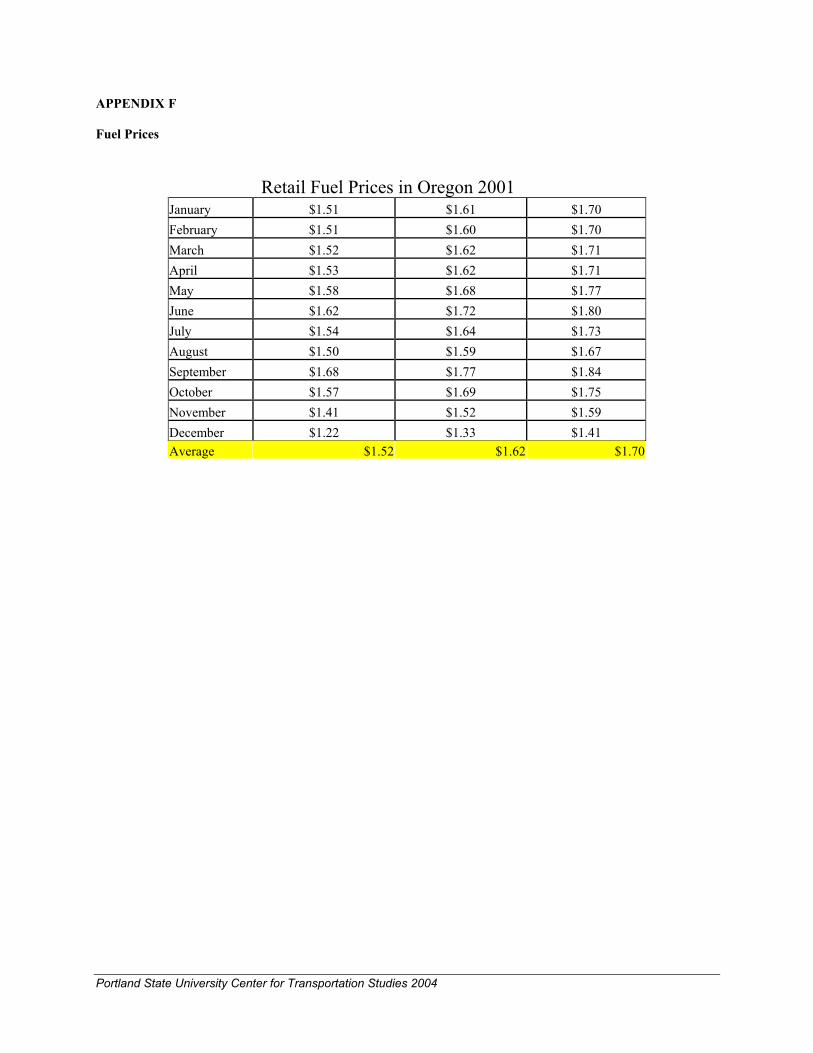
APPENDIX F Fuel Prices
Using Archived Data to Measure Operational Benefits of ITS Investments: Incident Response Program Page vi
Portland State University Center for Transportation Studies 2004
ACKNOWLEDGEMENTS
The authors thank the U.S. Department of Transportation, and Transportation Northwest
(TransNow) for providing funding for this project. In addition, the Oregon Department of
Transportation and the Portland State University Department of Civil & Environmental
Engineering provided financial support for the work described here. In particular, Dennis
Mitchell, Jack Marchant and Richard Santa Ana of ODOT, provided valuable data, information
and insights, without which this project would not have been possible. The authors also
acknowledge Barnie Jones, Rob Edgar, Galen McGill and Edward Anderson at ODOT for their
support. Finally, thank you to Tarek Abou El-Seoud for his assistance with statistical analysis.
Using Archived Data to Measure Operational Benefits of ITS Investments: Incident Response Program Page vii
Portland State University Center for Transportation Studies 2004
EXECUTIVE SUMMARY
Introduction
The proliferation of new data gathering and archiving technologies has provided a wealth of new transportation data. Engineers, planners and freeway management system operators in many urban areas are finding themselves working in an increasingly data rich environment. The availability of these data enables the analysis of multiple aspects of a freeway network from a regional scale down to a single incident. This study uses archived ITS data to evaluate the effectiveness of a freeway incident response program in Portland, Oregon. Data used in this study were extracted from an archived computer aided dispatch database (CAD), automatic vehicle location systems (AVL), inductive loop detectors, automatic traffic counters (ATC) and weather archives. The data are used to show various ways of presenting transportation information being used as indicators of the effectiveness of an incident response program. This type of evaluation is necessary on an on-going basis in order to clearly articulate the benefits and costs of this critical component of the regions traffic management system.
In the Portland metro area ODOT currently operates an extensive advanced traffic management system (ATMS), including 75 CCTV cameras, 18 variable message signs, an extensive fiber optics communications system and 118 ramp meters, including approximately 436 inductive loop detectors. This study, supported by TransNow, ODOT, and Portland State University, focuses primarily on the incident response program. Incidents are defined as crashes, breakdowns and other random events that occur on our highway system. It is well known that incidents contribute to approximately 50 percent of the congestion delay on the nation’s highways, lead to
major road closures and adversely affect the safety of our transportation network. Further, incidents increase drivers’ exposure to hazardous conditions and are known to lead to secondary crashes as well. In Portland, Oregon maintenance personnel typically managed incidents on an as-needed or reactive basis. Knowing that incidents do not only occur during the hours when maintenance personnel are working, overtime charges are necessary for response to major incidents on weekends and overnight. In recent years, growth in traffic volumes and tightening maintenance budgets have led to the need for more proactive operations management strategies. During this same period, more and more diversion of maintenance resources has led to increased overtime costs and increasingly negative effects on maintenance productivity. Additionally, reducing congestion and minimizing roadway blockages improves freight movement, allowing the flow of commerce to occur unimpeded. Portland is at the convergence of key interstate highways, waterways, rail facilities and an international airport. This multi-modal hub makes timely freight movement along Portland’s highways a high priority for the state’s economy.
The incident response program, known as COMET, began service in March 1997, and now covers the Portland metropolitan area nearly 24 hours a day with 11 specially equipped incident response (IR) vehicles. During a typical weekday there are four response vehicles patrolling the freeways from morning to night, and two vehicles on weekends and overnight. Each vehicle travels an average of 120 miles per shift. Standard equipment on the vehicles includes a variable message sign, basic traffic control equipment, gasoline and automotive fluids, basic automotive tools, a communications system, and an AVL system. The vehicles in the COMET program do not have towing capabilities. They do have push bumpers and tow cables to push, pull or drag disabled vehicles off
Using Archived Data to Measure Operational Benefits of ITS Investments: Incident Response Program Page viii
Portland State University Center for Transportation Studies 2004
the roadway. The responders themselves are a very important part of the program. Each responder is given extensive training in areas such as emergency vehicle operations, traffic control, and bridge inspection.
Benefits of Incident Response For the purposes of this study, in addition to the costs of implementing the IR program, a number of prospective IR benefits were identified. Some of the benefits accrue to the general public, including: Reduced delay Reduced fuel consumption Improved air quality Improved safety and security (avoided
crashes and secondary crashes and an improved feeling of security on the transportation system)
Improved flow of commerce Reduced harm to wildlife, soil and water
quality Other IR benefits include those that accrue to ODOT and other agencies, including: Reduced maintenance crew cost Value of extra maintenance performed Increased recovery of Charges Against
Others (CAO) from motorists’ insurance companies
Awareness of potentially hazardous items requiring maintenance
Improved public relations and good will.
Research Objectives
This study included the extraction and display of incident data on the freeways of the Portland Metro Area in 2001 with a more detailed look at the I-5 corridor. Further analysis estimates the cost of delay in the region and how COMET is effective in achieving the goal of delay reduction. A final objective was to demonstrate the use
of archived data from multiple sources as an evaluation tool. Study Area Figure 1 shows the freeways and patrol routes of the program in the Portland Metro Region. The area is divided into 4 patrol regions. The freeways include Interstates 5, 84, 205, 405 and state routes 217, 26 and 30. The cost to operate COMET for on year is about 750,000 dollars.
Figure 1 – Study Area
Data Analysis
The CAD data in ODOT Region 1 includes 72 different fields. A few of the key data fields used in this study include: incident location by primary and secondary route, incident type, incident begin and end times, lanes blocked, and GPS coordinates identifying incident location. The CAD database included 70,976 incident records in 2001. Most of the incidents in the CAD data were recorded multiple times throughout the duration of the incident. Each time new or changed information is added to the database a new record is created. Removal of duplicate entries generated a result of 21,728 unique reported incidents. Findings
Using Archived Data to Measure Operational Benefits of ITS Investments: Incident Response Program Page ix
Portland State University Center for Transportation Studies 2004
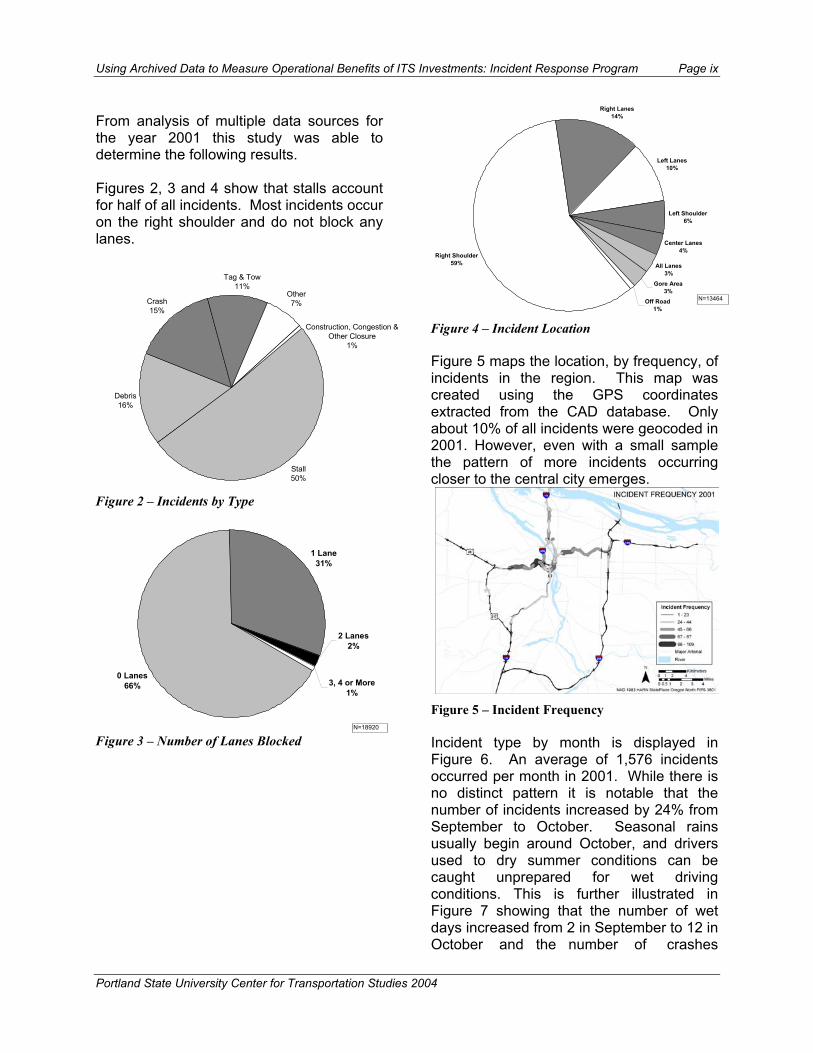
From analysis of multiple data sources for the year 2001 this study was able to determine the following results. Figures 2, 3 and 4 show that stalls account for half of all incidents. Most incidents occur on the right shoulder and do not block any lanes.
Stall50%
Debris16%
Crash15%
Tag & Tow11%
Other7%
Construction, Congestion & Other Closure
1%
Figure 2 – Incidents by Type
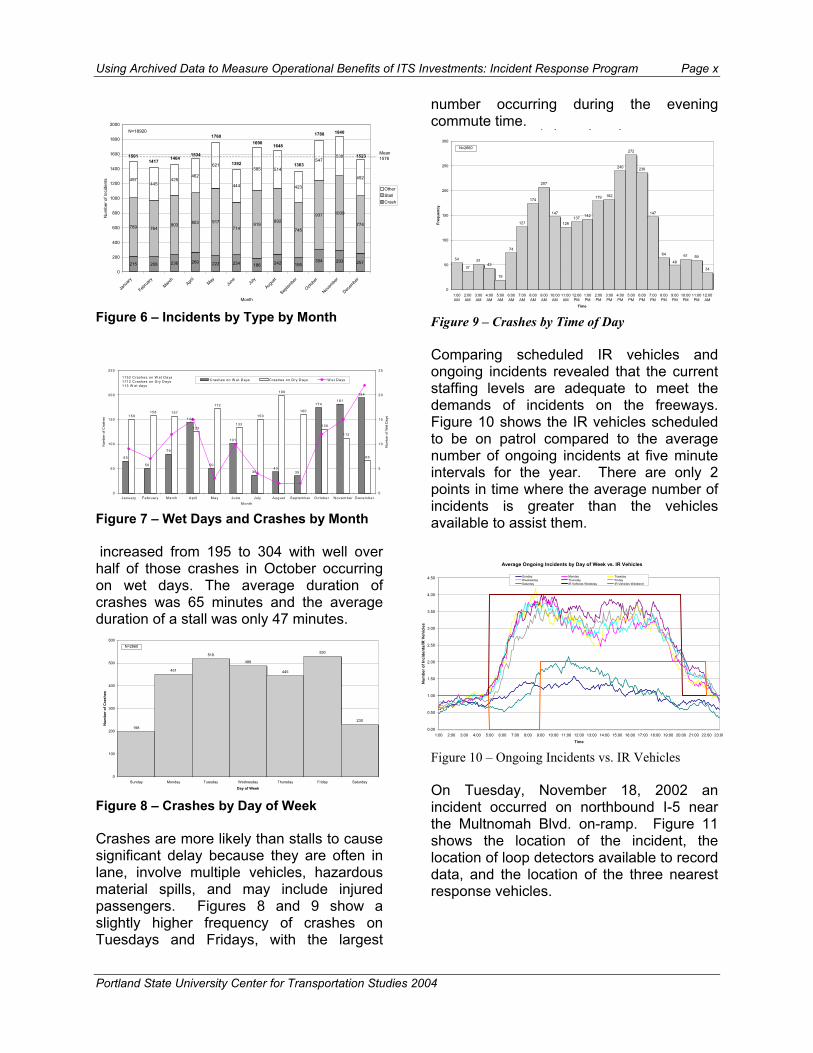
0 Lanes66%
1 Lane31%
3, 4 or More1%
2 Lanes2%
N=18920 Figure 3 – Number of Lanes Blocked
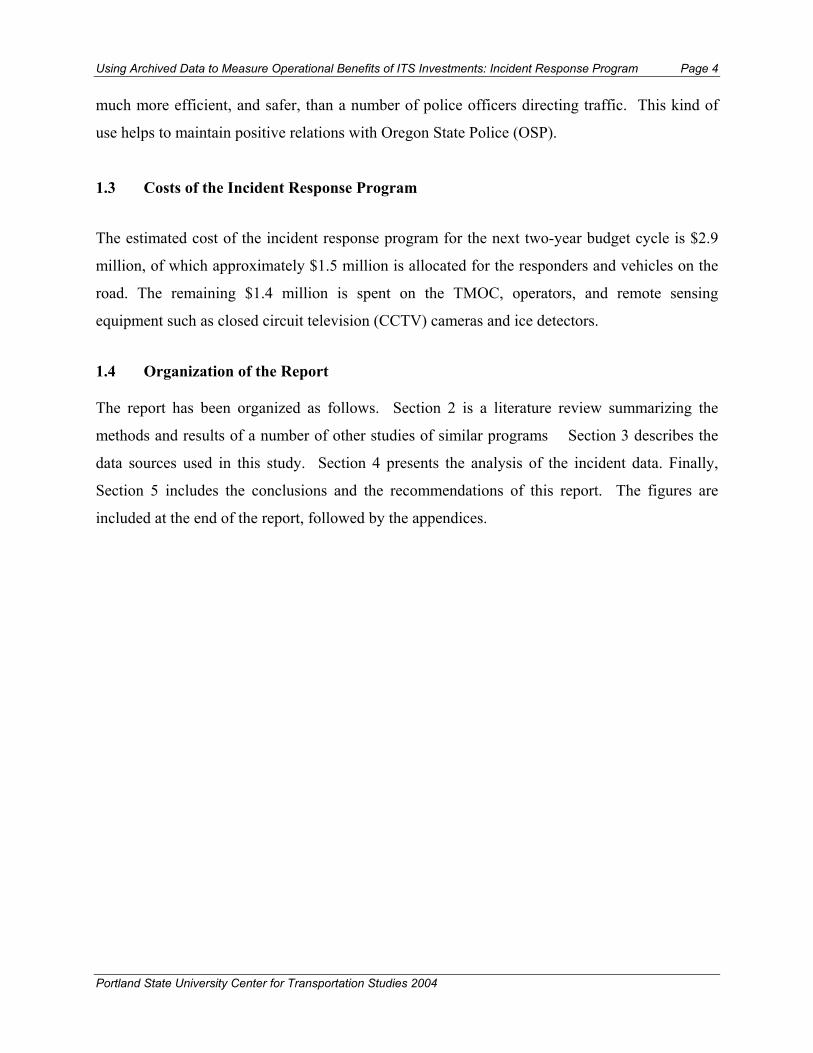
Right Shoulder59%
Right Lanes14%
Left Lanes10%
Left Shoulder6%
Center Lanes4%
All Lanes3%
Gore Area3%
Off Road1%
N=13464
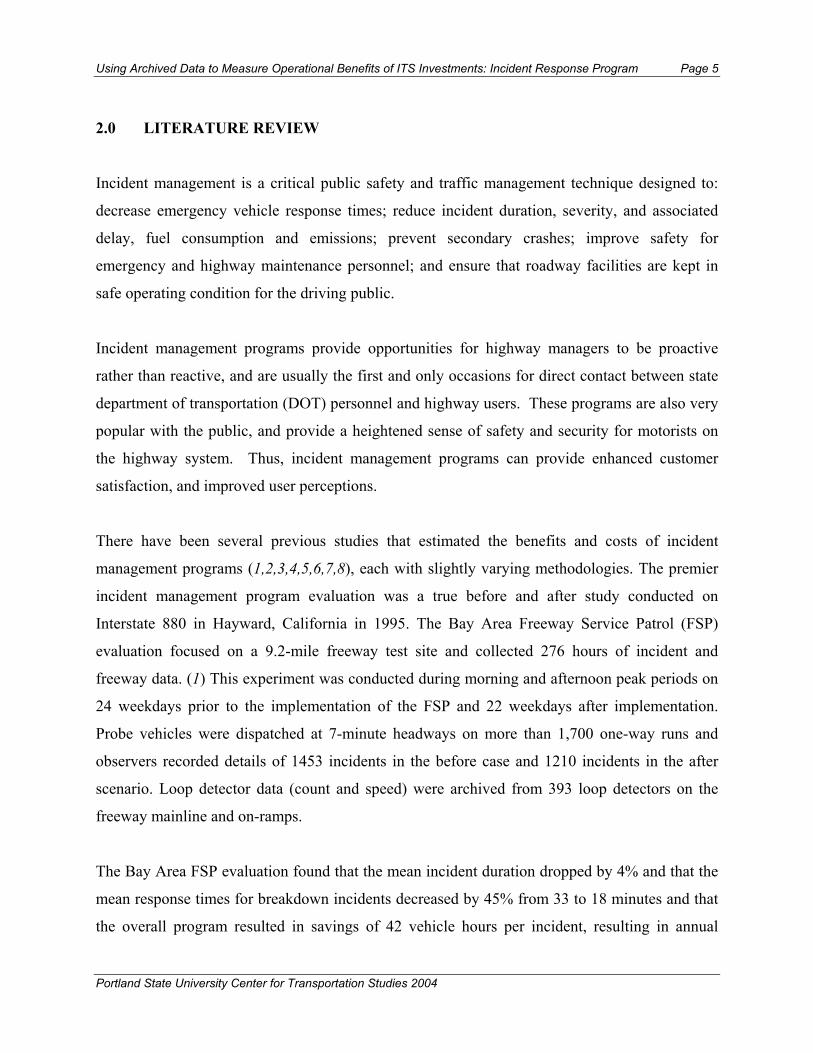
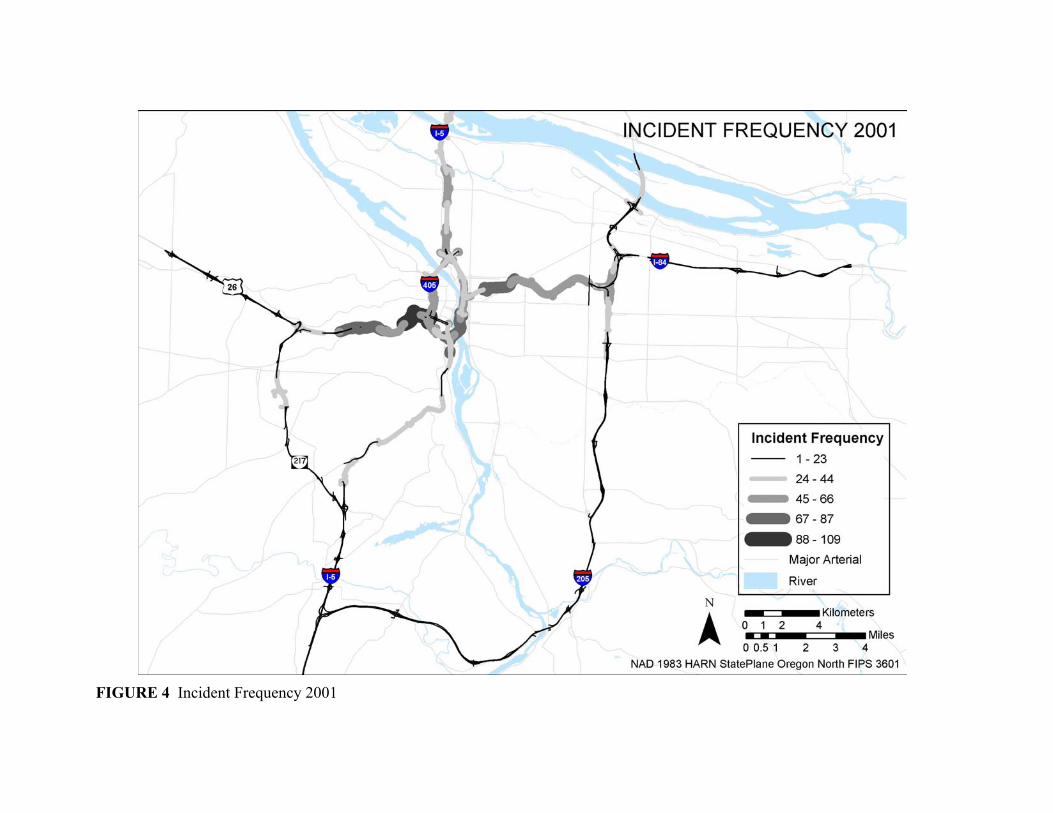
Figure 4 – Incident Location Figure 5 maps the location, by frequency, of incidents in the region. This map was created using the GPS coordinates extracted from the CAD database. Only about 10% of all incidents were geocoded in 2001. However, even with a small sample the pattern of more incidents occurring closer to the central city emerges.
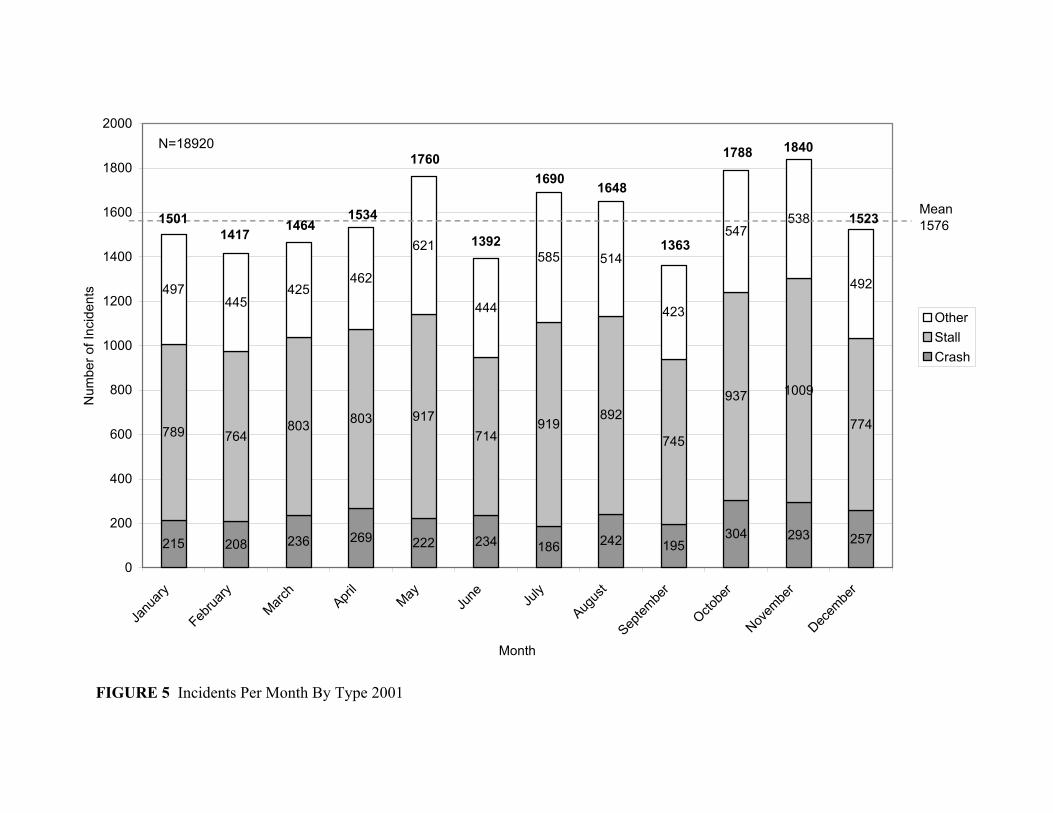
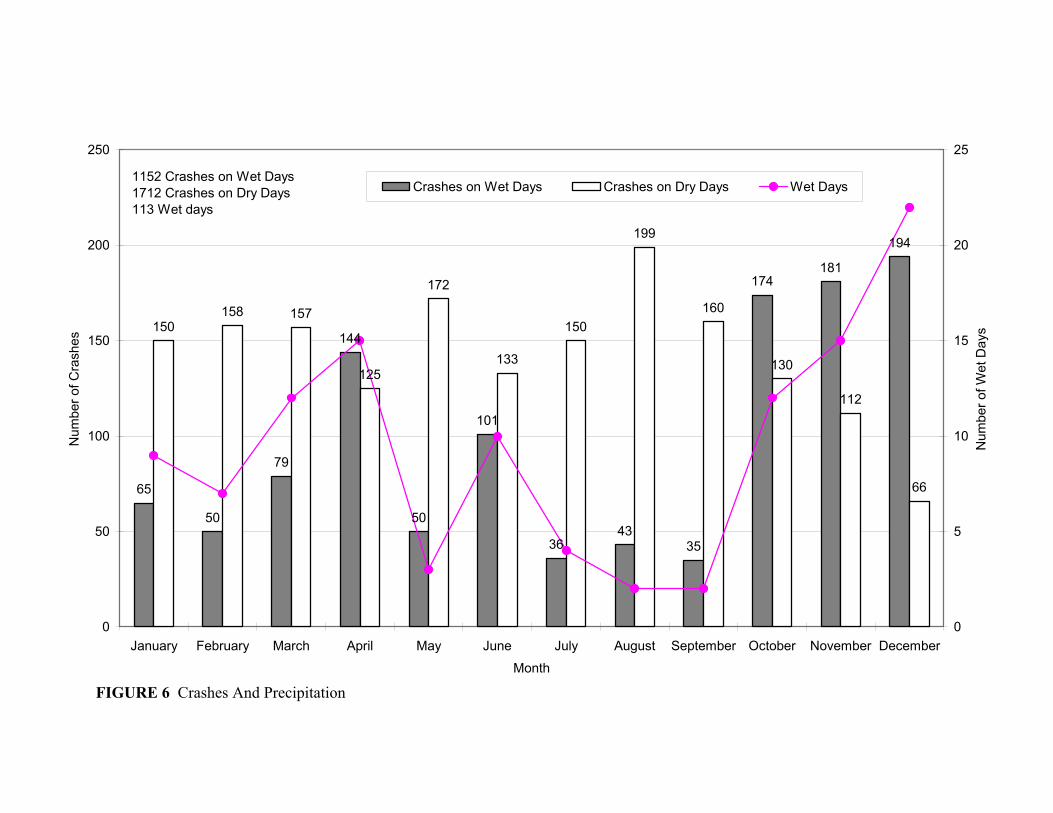
Figure 5 – Incident Frequency Incident type by month is displayed in Figure 6. An average of 1,576 incidents occurred per month in 2001. While there is no distinct pattern it is notable that the number of incidents increased by 24% from September to October. Seasonal rains usually begin around October, and drivers used to dry summer conditions can be caught unprepared for wet driving conditions. This is further illustrated in Figure 7 showing that the number of wet days increased from 2 in September to 12 in October and the number of crashes
Using Archived Data to Measure Operational Benefits of ITS Investments: Incident Response Program Page x
Portland State University Center for Transportation Studies 2004
215 208 236 269 222 234 186 242 195304 293 257
789 764803 803 917
714919
892
745
937 1009
774
497445
425462
621
444
585 514
423
547538
492
0
200
400
600
800
1000
1200
1400
1600
1800
2000
Janu
ary
Februa
ryMarc
hApri
lMay
June Ju
ly
Augus
t
Septem
ber
Octobe
r
Novem
ber
Decem
ber
Month
Num
ber o
f Inc
iden
ts
OtherStallCrash
N=18920
1501 153414641417
1760
1392
1690 1648
1363
1788 1840
1523Mean1576
Figure 6 – Incidents by Type by Month
65
50
79
144
50
101
3643
35
174181
194
150158 157
125
172
133
150
199
160
130
112
66
0
50
100
150
200
250
January February M arch April M ay June Ju ly Augus t Septem ber O ctober N ovem ber D ecem berM onth
Num
ber o
f Cra
shes
0
5
10
15
20
25
Num
ber o
f Wet
Day
s
C rashes on W et D ays C rashes on D ry D ays W et D ays1152 C rashes on W et D ays1712 C rashes on D ry D ays113 W et days
Figure 7 – Wet Days and Crashes by Month increased from 195 to 304 with well over half of those crashes in October occurring on wet days. The average duration of crashes was 65 minutes and the average duration of a stall was only 47 minutes.
Figure 8 – Crashes by Day of Week Crashes are more likely than stalls to cause significant delay because they are often in lane, involve multiple vehicles, hazardous material spills, and may include injured passengers. Figures 8 and 9 show a slightly higher frequency of crashes on Tuesdays and Fridays, with the largest
number occurring during the evening commute time. q y y y
54
37
5143
19
74
127
174
207
147
126137 142
179 182
240
272
236
147
64
48
61 59
34
0
50
100
150
200
250
300
1:00AM
2:00AM
3:00AM
4:00AM
5:00AM
6:00AM
7:00AM
8:00AM
9:00AM
10:00AM
11:00AM
12:00PM
1:00PM
2:00PM
3:00PM
4:00PM
5:00PM
6:00PM
7:00PM
8:00PM
9:00PM
10:00PM
11:00PM
12:00AM
Time
Freq
uenc
y
N=2860
Figure 9 – Crashes by Time of Day Comparing scheduled IR vehicles and ongoing incidents revealed that the current staffing levels are adequate to meet the demands of incidents on the freeways. Figure 10 shows the IR vehicles scheduled to be on patrol compared to the average number of ongoing incidents at five minute intervals for the year. There are only 2 points in time where the average number of incidents is greater than the vehicles available to assist them.
Figure 10 – Ongoing Incidents vs. IR Vehicles On Tuesday, November 18, 2002 an incident occurred on northbound I-5 near the Multnomah Blvd. on-ramp. Figure 11 shows the location of the incident, the location of loop detectors available to record data, and the location of the three nearest response vehicles.
Average Ongoing Incidents by Day of Week vs. IR Vehicles
Sunday Monday TuesdayWednesday Thursday FridaySaturday IR Vehicles Weekday IR Vehicles Weekend
Using Archived Data to Measure Operational Benefits of ITS Investments: Incident Response Program Page xi
Portland State University Center for Transportation Studies 2004
Figure 11 – One Incident The summary of the incident follows: • Incident ID: 13072 • Location: Northbound I-5 near Multnomah
Blvd on-ramp • Date: Tuesday, November 18th 2002 • Confirmation time 4:15 PM. • Actual start time: 3:58 PM. • COMET 15 arrived at 4:05:22 PM from I-405
(7 min) • COMET 14 arrived at 4:04:29 PM from I-5/I-
205 (6 min) • Number of vehicles involved: 11 • Number of lanes blocked: one (left lane) • Number of injuries: zero • Involved vehicles were towed and the
incident was cleared by 5:15 PM. • Incident log had eleven entries for this
incident. • Incident level 3, based on a 0-4 scale. • COMET 14 left the scene at 4:45:14 • COMET 15 left the scene at 5:25:34 • Highway completely recovered by 5:35 PM
(based on loop detector data) The duration of the incident was 1 hour and 27 minutes. The highway was completely recovered 10 minutes after the last IR vehicle left the scene. With the data currently available, a detailed analysis is possible for almost all incidents and can be used as a tool for evaluation of response procedures when necessary. Finally, a key component in any IR evaluation is an estimate of cost savings provided by the program. As with other IR
programs, there is no “before” data since the incident reporting system was initiated at the same time as the COMET program. Therefore, a true before and after study is not possible. However, by estimating the cost of delay for 2001 we can determine the cost savings of delay reduction and develop a tool to assist program operators evaluating the effectiveness of their program. The estimated cost of delay on the Region 1 freeways for 2001 is $51 million. If each delay-causing incident increased in duration by an average of 30 seconds the increased cost of delay is $711,300, or roughly the cost of operating COMET for 1 year. Figure 12 shows an efficiency curve plotted using these time and cost values. If the program is operating up and to the right of the curve the benefits are greater than the costs.
Efficiency Curve
0%
10%
20%
30%
40%
50%
60%
70%
80%
90%
100%
0 1 2 3 4 5 6 7 8 9 10 11
Average Reduction of Incident Duration in Minutes
Perc
enta
ge o
f Inc
iden
ts A
ssis
ted
Benefits are Greater than Costs
Costs are Greater than Benefits
Figure 12 – Efficiency Curve While the data were not available to definitively conclude that the benefits of COMET outweigh the costs it is reasonable to conclude that it does. The responders only need to reduce the duration of each incident by just a few minutes to have a measurable impact on the flow of traffic. It is impossible to measure and assign a dollar value to the numerous other environmental and public relations benefits of the program discussed above. Our study concludes that the benefits of the COMET program in Region 1 are greater than the costs.
Using Archived Data to Measure Operational Benefits of ITS Investments: Incident Response Program Page 1
Portland State University Center for Transportation Studies 2004
1.0 INTRODUCTION
1.1 Background
The Oregon Department of Transportation (ODOT), the City of Portland, TriMet, (Portland’s
Transit Provider) Metro (the Portland region’s Metropolitan Planning Organization and directly
elected regional government) and other jurisdictions are partners in the intelligent transportation
systems (ITS) implementation program called TransPort. Through regional and statewide
cooperation and monthly technical advisory committee meetings, this system provides traffic
management, incident response (IR) and traveler information, reducing traffic congestion,
stabilizing travel times, and preventing crashes. TransPort is comprised of three components:
• Transportation management: monitoring and surveillance equipment identifies incidents and
crashes, assisting system operators manage traffic flows.
• Incident response: COMET (COrridor ManagEment Team) is dispatched to incidents and
other appropriate emergency services are notified.
• Traveler information: drivers are notified by variable message signs or via car radio of an
incident ahead, enabling them to choose alternate routes to avoid congestion.
ITS programs such as TransPort are conceptually new types of projects, as their implementation
relies on an unseen communications network, mostly invisible sensors, software that is housed
within the transportation management center and unique human resources facilitating
communication and coordination. Only a small number of individuals is required to operate the
transportation management system, and in many cases users do not even know they are
benefiting from the system. As with any investment decision, it is important to include some
form of evaluation as part of a continuous improvement process. It is believed that a qualitative
and quantitative analysis of the incident management programs in Oregon will lead to a better
understanding of their costs and benefits, and thus their effectiveness in meeting their objectives.
This greater understanding may also lead to improvements in making decisions about where and
Using Archived Data to Measure Operational Benefits of ITS Investments: Incident Response Program Page 2
Portland State University Center for Transportation Studies 2004
when to deploy and/or expand these programs, and how to prioritize resources in times of
budgetary strain.
Typical measures of effectiveness for incident management programs include improvements in
safety, traffic congestion/delay, fuel consumption, air quality, customer satisfaction and
prevented collisions. These benefits can be estimated based upon a quantification of the
incremental reduction in incident duration and response time due to the presence of the IR
program.
In this context, the objective of this project is to use existing data, collected via the region’s
surveillance and communications infrastructure to measure the effectiveness of the COMET
incident response program in the Portland metropolitan area. IR vehicles patrol the interstate and
state highways, assisting state and local police forces, individual motorists, and other emergency
responders during a wide variety of traffic events. In areas not covered by IR teams, maintenance
workers are dispatched on an incident-by-incident basis, which leads to ineffectiveness in the
performance of maintenance tasks. ODOT also deploys dedicated IR teams along several
highways in the Southern Willamette Valley. At some point, as traffic volumes continue to
increase, IR tasks may become frequent enough to warrant expansion of existing programs and
creation of dedicated IR teams in other areas of the state.
This project is somewhat unique in that it attempts to extract archived data from five sources to
measure the effectiveness of an ongoing program. The existing ITS data sources include: a
computer-aided dispatch incident database, automatic vehicle location (AVL) data for the
individual COMET vehicles, 20-second inductive loop detector data from the freeway mainlines,
automatic traffic recorders stationed throughout the freeway network and archived weather data.
These datasets can provide planners and operators with quantifiable measurements that can be
used as ongoing evaluation tools. Given accurate real-time data, operators can modify the
system dynamically as conditions on the highways change. Most large urban areas have readily
identifiable trouble spots on their highway system, known as recurrent bottlenecks. IR programs
are often designed to focus on those particular areas. The times when incidents occur in unusual
places, or when a special event is planned are when the real-time data flow and a dynamic
Using Archived Data to Measure Operational Benefits of ITS Investments: Incident Response Program Page 3
Portland State University Center for Transportation Studies 2004
system are particularly important. The ability to quickly find a problem area or detect a change
in the traffic pattern and respond with changes in the management system is important to the
success of an ITS system. Improvements in data collection and analysis will soon allow urban
areas to achieve this kind of real-time management.
1.2 The Region 1 Incident Response Program
The COMET program began service in March 1997, and now covers the Portland metropolitan
area nearly 24 hours a day with 11 specially equipped IR vehicles. Each vehicle travels an
average of 120 miles per shift. Some of the original vehicles in the program have logged over
300,000 miles in the 6 years they have been in service. The vehicles are maintained by an
ODOT mechanic and receive regular maintenance as recommended by the manufacturer.
Standard equipment on the vehicles includes a variable message sign, basic traffic control
equipment, gasoline and automotive fluids, basic automotive tools, a communications system,
and an AVL system. The vehicles in the COMET program do not have towing capabilities. They
do have push bumpers and tow cables to push, pull or drag disabled vehicles off the roadway.
The responders themselves are a very important part of the program. A majority of those hired
as responders come from a police, fire, towing, or emergency medical technician (EMT)
background. A number of the responders also work as operators in the Traffic Management
Operations Center (TMOC). Each responder is given extensive training in areas such as
emergency vehicle operations, traffic control, and bridge inspection.
The COMET program covers all the major state and interstate highways in the Portland
area. The region is divided into 4 patrol areas; Figure 1 shows COMET coverage and beat map.
The responders are not limited to only the area within their beat. They will respond to incidents
in other patrol areas as the need arises. Most of the responders use the Interstate 5-Interstate 405
loop as a turn around at the end of their route. This loop has a very high frequency of incidents
and the extra patrols help to keep it free of problems.
As the highways are patrolled almost 24 hours a day, a standard full shift includes 4
vehicles covering their respective beats. At off peak times the beats will be consolidated as
needed to patrol the region with fewer vehicles. The IR program sometimes provides responders
and vehicles for special events where additional traffic control is needed. The variable message
sign (VMS) on the vehicles makes them very useful for traffic control. A single VMS is often
Using Archived Data to Measure Operational Benefits of ITS Investments: Incident Response Program Page 4
Portland State University Center for Transportation Studies 2004
much more efficient, and safer, than a number of police officers directing traffic. This kind of
use helps to maintain positive relations with Oregon State Police (OSP).
1.3 Costs of the Incident Response Program
The estimated cost of the incident response program for the next two-year budget cycle is $2.9
million, of which approximately $1.5 million is allocated for the responders and vehicles on the
road. The remaining $1.4 million is spent on the TMOC, operators, and remote sensing
equipment such as closed circuit television (CCTV) cameras and ice detectors.
1.4 Organization of the Report The report has been organized as follows. Section 2 is a literature review summarizing the
methods and results of a number of other studies of similar programs Section 3 describes the
data sources used in this study. Section 4 presents the analysis of the incident data. Finally,
Section 5 includes the conclusions and the recommendations of this report. The figures are
included at the end of the report, followed by the appendices.
Using Archived Data to Measure Operational Benefits of ITS Investments: Incident Response Program Page 5
Portland State University Center for Transportation Studies 2004
2.0 LITERATURE REVIEW
Incident management is a critical public safety and traffic management technique designed to:
delay, fuel consumption and emissions; prevent secondary crashes; improve safety for
emergency and highway maintenance personnel; and ensure that roadway facilities are kept in
safe operating condition for the driving public.
Incident management programs provide opportunities for highway managers to be proactive
rather than reactive, and are usually the first and only occasions for direct contact between state
department of transportation (DOT) personnel and highway users. These programs are also very
popular with the public, and provide a heightened sense of safety and security for motorists on
the highway system. Thus, incident management programs can provide enhanced customer
satisfaction, and improved user perceptions.
There have been several previous studies that estimated the benefits and costs of incident
management programs (1,2,3,4,5,6,7,8), each with slightly varying methodologies. The premier
incident management program evaluation was a true before and after study conducted on
Interstate 880 in Hayward, California in 1995. The Bay Area Freeway Service Patrol (FSP)
evaluation focused on a 9.2-mile freeway test site and collected 276 hours of incident and
freeway data. (1) This experiment was conducted during morning and afternoon peak periods on
24 weekdays prior to the implementation of the FSP and 22 weekdays after implementation.
Probe vehicles were dispatched at 7-minute headways on more than 1,700 one-way runs and
observers recorded details of 1453 incidents in the before case and 1210 incidents in the after
scenario. Loop detector data (count and speed) were archived from 393 loop detectors on the
freeway mainline and on-ramps.
The Bay Area FSP evaluation found that the mean incident duration dropped by 4% and that the
mean response times for breakdown incidents decreased by 45% from 33 to 18 minutes and that
the overall program resulted in savings of 42 vehicle hours per incident, resulting in annual
Using Archived Data to Measure Operational Benefits of ITS Investments: Incident Response Program Page 6
Portland State University Center for Transportation Studies 2004
savings of more than 90,000 vehicle hours. Similarly, improvements in fuel consumption and
emissions were also documented. The opportunity to conduct a true before and after experiment
is rare, particularly since many urban areas have operated incident response programs for many
years.
The Los Angeles FSP evaluation (1998), an example of an evaluation performed after
implementation of an FSP program, focused on a 7.8-mile section of Interstate 10 in El Monte
and Alhambra, California. (2) This project also used the probe vehicle observation method (6-
min headways), coupled with archived loop detector data. The evaluation included a total of 192
hours’ observation over 32 weekdays, with details on 1,560 incidents, 3,600 probe vehicle runs,
and data from 240 loop detectors. Using data from the Bay Area FSP and other evaluations, a
relationship between delay and incident duration was modeled, resulting in the ability to estimate
the benefits of the FSP program according to a range of incident duration reduction. The study
found that the program was operating with a benefit-cost ratio between 3.8 and 5.6.
In Oregon, an evaluation of ODOT’s Region 2 Incident Response program also used archived
dispatch and traffic flow data collected after the program was initiated. (3) Using a statistical
analysis of the incident data, reductions in fuel consumption and delay were estimated for more
than 2,500 incidents logged in two 50-mile highway corridors. It was shown that the mean
incident duration and thus delay per incident have decreased with expansion of the Region 2 IR
program and that the benefits of the program far outweigh its modest cost.
The Puget Sound Region of Washington State implemented a freeway service patrol in August of
2000. (4) A study was conducted in which archived incident data from six months following
implementation were compared to pre-implementation data from the same six month period
during the previous year. This study revealed a decrease in emergency response time. Prior to
the implementation of the service patrol, the mean response time for assistance was over 9
minutes, which was reduced by 61% to approximately 5.8 minutes. Faster response time was
estimated to reduce annual vehicle hour delay by 13,048 hours and result in a cost savings of
nearly $200,000.
Using Archived Data to Measure Operational Benefits of ITS Investments: Incident Response Program Page 7
Portland State University Center for Transportation Studies 2004
A study in Phoenix, Arizona looked at the effect of a Freeway Management System (FMS) on
the safety of a freeway network. (5) The data included crash records, traffic volumes, and
roadway characteristics for approximately 65 miles of urban freeways in the metropolitan
Phoenix area from 1991 to 1998. The freeway sections were divided into two groups, sections
with a FMS system and sections without. The sections with an FMS showed a reduction of 25%
in crashes involving property damage only. There was also a reduction in the number of crashes
involving possible injury and minor injury of 30% and 21% respectively. This study estimated
the annual benefit in crash reduction to be between $4.8 and $13.2 million dollars from 1996-
1998.
A consistent finding among most IR evaluations is that many of the benefits of these programs
are difficult to quantify. For example, incident management programs provide valuable public
relations functions, a heightened sense of safety and security for motorists, and also prevent
secondary crashes. Furthermore, assigning a value to the lost time of a commuter or shipment of
goods due to delay caused by an incident is difficult, debatable and these costs do not accrue to
the agency providing the IR service. Each vehicle on the road has a different purpose and the
cost of delay for each individual vehicle can vary greatly. Many studies use wage rates and fuel
consumption averages of idling or slow moving vehicles to assign dollar values to incidents.
These are really just approximations using the best available data. With the increasing
availability of more detailed data these types of evaluations can become more accurate and
become more valuable tools to planners and operators of IR programs.
Using Archived Data to Measure Operational Benefits of ITS Investments: Incident Response Program Page 8
Portland State University Center for Transportation Studies 2004
3.0 DATA SOURCES
Transportation engineering, planning and analysis have moved into a data rich environment. The
proliferation of traffic monitoring and data gathering devices facilitates analysis on a level not
available just a short time ago. In the Portland metro area ODOT currently operates an extensive
advanced traffic management system (ATMS), including 75 CCTV cameras, 18 variable
message signs, an extensive fiber optics communications system and 118 ramp meters, including
approximately 436 inductive loop detectors. This paper will use data from the loop detectors,
AVL system, incident database, automatic traffic recorders and National Oceanic and
Atmospheric Administration (NOAA) to measure the effectiveness of the IR program, detail the
life of an incident and make suggestions for improvements to the IR program.
3.1 Incident Database
The computer aided dispatch (CAD) data included 70,976 records in 2001. Most of the incidents
in the CAD data included a number of duplicates, which occurred for a variety of reasons. Each
incident is given a unique number and each time new information about a particular incident is
entered into the database, a new record is created using the same incident number. The more
severe the incident or the longer the duration of the incident, the more entries an incident is likely
to have. For some portions of our study it was necessary to remove the duplicate entries. See
Appendix A for a listing and description of the items in the database.
The software used by the TMOC can be used to record an X,Y, coordinate of an incident. This
location can then be displayed on ODOT’s statewide Tripcheck traveler information website
(www.tripcheck.com) and shown on the highway map in the TMOC. For more detailed incident
information to be available on Tripcheck, the operators must manually enter the incident
information.
The TMOC software also has a built in response plan based on incident location and severity.
When an incident record is completed, including the X,Y coordinates, the appropriate response
plan can be implemented which includes a preprogrammed set of messages on the VMS system.
Unfortunately, sometimes information about lane location or even specific X,Y coordinates
Using Archived Data to Measure Operational Benefits of ITS Investments: Incident Response Program Page 9
Portland State University Center for Transportation Studies 2004
cannot be immediately determined, but is necessary for the software response plan to take effect.
In order to get information to the freeway users as soon as possible the VMS is manually
activated using a preprogrammed or custom message for that specific location and incident.
Therefore, many incidents during which a VMS was activated were not geocoded in the incident
database. In 2001 geocoding was optional if the incident did not require the use of the software
response plan. Because it was optional, approximately 10% of the incidents in 2001 were
geocoded.
3.2 Automated Vehicle Location
Each IR vehicle is equipped with an AVL device. This device records the time and geographic
location of the IR vehicle as reported by a GPS device. These data are periodically transmitted to
the TMOC and used to determine where the IR vehicles were at any given time. We have used
these data to determine where the vehicles were located at the time of an incident and how long it
took them to respond to the incident. These data will be used to further study and make
recommendations about the routes used by the operators to respond to incidents.
Each operator also has direct radio access to the IR vehicles, police, fire and rescue in the
jurisdictions patrolled. When an incident is detected by, or reported to, the TMOC, the operators
will use the remote sensing equipment to verify the incident and relay the information, via radio,
to the appropriate responder in the field. Information about the incidents including location,
duration and severity are logged into the database by the operators at the TMOC.
3.3 Inductive Loop Detectors
These detectors collect vehicle count, occupancy, and average speed data at 20-second intervals
on the freeways. The loop detector data are important for determining the length of delay and
recovery for incidents along the highways. These data are continuously monitored at the TMOC,
where they are displayed on a highway map which uses various colors to represent the current
travel speed along each section of freeway. The TMOC is equipped with 14 video monitors
which allow the operators to view many areas of the transportation network at once through a
closed circuit TV system. The operators can control each of the cameras through their fiber-optic
network to pan, tilt and zoom as needed to obtain the best view of incidents on the highway. An
Using Archived Data to Measure Operational Benefits of ITS Investments: Incident Response Program Page 10
Portland State University Center for Transportation Studies 2004
indication of sudden slowdown on the highway map will prompt TMOC operators to use the
CCTV cameras to search for an incident in that area.
3.4 Automatic Traffic Recorders
There are 14 automatic traffic recorders (ATR) located throughout the area patrolled by
COMET. These devices record the number of vehicles passing a certain point by hour. The
archived data are broken down by direction. Appendix B shows the location of the ATR devices
within the Portland metro region.
3.5 Weather Data
Archived weather data are available from NOAA at their website (www.noaa.gov). For this
study we have downloaded and used detailed weather data recorded at the Portland International
Airport for 2001.
3.6 Observations
To effectively study a program like COMET the research team needs to be familiar all aspects of
the program. Each member of the research staff rode along with IR staff for at least one shift to
become familiar with the existing scope and operating conditions of IR services. The following
are some observations made during these sessions:
• When there are multiple incidents, the incident creating the most traffic delay is given the
highest priority. IR vehicles will be called out of their patrol zones when there are more
incidents in another zone than the assigned vehicle can handle.
• Incidents that block travel lanes are the most important and warrant the use of lights and
sirens to move through traffic and arrive at the scene quickly.
• Responders do not log incident data. They report information via radio to the operators at
the TMOC where it is entered into the database.
• The first priority of the responders, after safety, is to remove the incident as quickly as
possible to keep traffic moving. The phrase often used among the responders is push,
pull or drag the obstacle out of the roadway to keep traffic moving.
Using Archived Data to Measure Operational Benefits of ITS Investments: Incident Response Program Page 11
Portland State University Center for Transportation Studies 2004
• Drivers are usually very grateful for the help of the responder.
• Response vehicles rarely stop to assist freight trucks stopped on the shoulder. These
drivers usually have a support system either through their trucking company or the
network of other professional truckers on the road. The drivers also commonly stop prior
to entering an unfamiliar city to check a map to make sure they don’t make a wrong turn.
• Responders maintain good relationships with police, fire, EMT, and tow companies.
• Assisted motorists are no longer given comment cards. Virtually all of the comment
cards returned were very positive and the program managers feel continuing the comment
card portion of the program is an unnecessary expense.
Using Archived Data to Measure Operational Benefits of ITS Investments: Incident Response Program Page 12
Portland State University Center for Transportation Studies 2004
4.0 ANALYSIS
4.1 Metro Area Incident Statistics
Of the nearly 71,000 incident records logged in 2001, a total of 21,728 unique incidents were
identified. The breakdown of the incident types are shown in Figure 2A. As shown, for the year
2001 half of the recorded incidents were stalls. Stalls are vehicles stopped on the side of the road
or in lane for any reason other than a crash or debris removal. Most often it is due to vehicle
mechanical failure, overheating or running out of fuel. Crashes and debris are the next two
largest categories. The tag and tow category refers to the removal of abandoned vehicles from
the roadway, and comprises 11% of recorded incidents. Figure 2B shows lane blockage statistics for the 18,920 incidents that included lane data. As
shown, of the 33% that were lane blocking, most were only blocking one lane.
Shown in Figure 2C is an inventory of the location of the 13,464 incidents that included this
information in its log. As shown, 59% of these incidents occurred on the right shoulder and 14%
were located in the right lane. More serious safety concerns arise for motorists and responders
when incidents occur in left lanes, center lanes, left shoulder and gore areas. A total of 23% of
incidents fell into those categories. Three percent of incidents were recorded as blocking all
lanes - the most serious category.
In comparison to previous studies done in the Bay Area (2) and values reported by the FHWA
(8), Portland has a much larger percentage of in-lane crashes and stalls, as shown in Figure 3.
Both previous studies showed 4% or fewer of the crashes and stalls occurring in-lane while
29.3% of the crashes and stalls reported in Portland were in-lane. The Bay Area study concedes
that the percentage of in lane incidents probably would have been higher if they had been using
CCTV rather than probe vehicles for detection. The type of in-lane incident in Portland is nearly
evenly split between crashes and stalls which is similar to the Bay Area “before” data, while the
data from FHWA show a larger percentage of stalls occurring in-lane. The Bay Area study
shows an increase in the in-lane crashes after their FSP was implemented. The rest of the
statistics in the tree are very similar across all three studies.
Using Archived Data to Measure Operational Benefits of ITS Investments: Incident Response Program Page 13
Portland State University Center for Transportation Studies 2004
In order to visualize the spatial distribution of incidents, Figure 4 shows the frequency of
incidents by location on the freeway network in the region. This figure uses only the 1,917
incidents that were geocoded. As one might expect, the frequency of incidents decreases as one
moves away from the central city. This is also a reflection of the volume of traffic on the
respective sections of highway. This figure is useful for considering where to invest additional
IR resources and provides an example of how a complete set of geocoded data can be used.
Incident distribution also has an notable temporal component. The number of incidents per
month categorized by crashes, stalls and other is shown in Figure 5. For 2001 note that the total
number of incidents was noticeably higher in October and November. This is typically when
seasonal rains begin in Portland after several months of dry weather.
4.2 Incidents and Weather Conditions
As discussed above, weather conditions can have a significant impact on incident frequency and
should not be overlooked when extracting data from archived incident records. Unfortunately,
the incident dataset in Portland does not include weather information. Using archived weather
data from NOAA, each day in the 2001 incident dataset was associated with the reported amount
of precipitation. For this study, any day that had a total measured amount of rainfall of .05” or
greater was counted as a wet day. Figure 6 shows the number of crashes on wet days, the
number of crashes on dry days, and the number of wet days per month for 2001. As shown,
there was a statistically significant relationship between the amount of rain and the frequency of
crashes. Using a chi-square test it was determined that the value of the chi-square was 48.06 with
a significance of 0.00. Looking further into the data it was observed that 44% of the days with a
high frequency of crashes, 11 or more, were days with heavy rain. On the other hand 58% of the
days with a low frequency of incidents, 3 or fewer, were dry days. This information can be used
by IR teams to make changes to their operations for a wet day. Since most of the operators in the
TMOC are also trained as responders, an operator could be sent out into the field to serve as an
additional responder when the weather conditions change. This information would also be useful
to the public to remind them to be cautious on wet pavement.
Using Archived Data to Measure Operational Benefits of ITS Investments: Incident Response Program Page 14
Portland State University Center for Transportation Studies 2004
4.3 Crashes and Stalls
Figures 7A and 7B show frequency of crashes and stalls by duration. Crashes and stalls account
for 65% of all the incidents in the study area. Only 27% of the stalls had a duration longer than
30 minutes, while 55% of the crashes lasted longer than 30 minutes. Crashes also block an
average of 0.64 lanes per incident, while stalls only block an average of 0.31 lanes per incident.
Crashes only account for 15% of the incidents in 2001, but they usually last longer and reduce
capacity more than the other types of incidents.
It is interesting to note when these crashes occur. Figure 8A shows that Tuesday and Friday
were the days of the week with the most crashes in 2001. Figure 8B shows that, as one might
expect, the AM and PM peak travel times are when crashes occur most often and that the PM
peak is the most crash prone time of day.
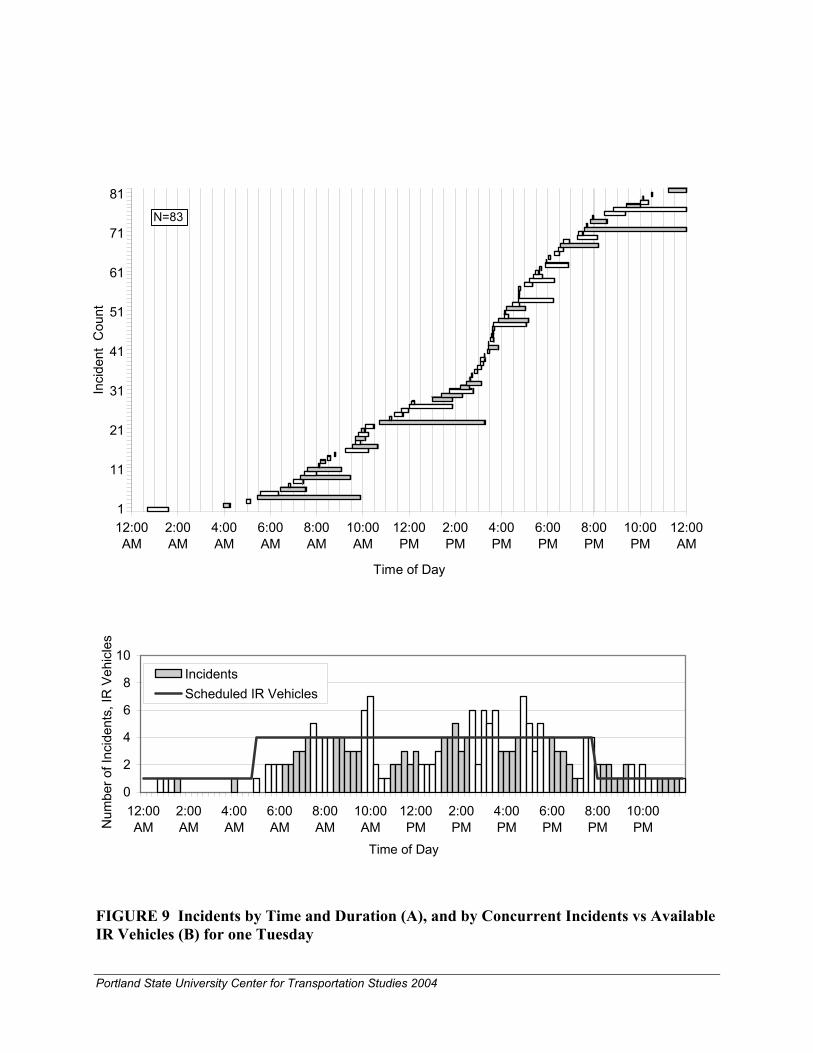
4.4 Resource Allocation
In order to understand the relationship between incident occurrence and responder availability
Figure 9A shows all incidents for one day, (Tuesday, November 18, 2002) by time and duration.
Figure 9B shows the number of concurrent incidents by fifteen minute time increments and the
number of IR vehicles on the road by time. It is easy to see that the highest number of incidents
occurred during the peak commute times. Of the 96 time increments, incidents outnumbered
responders during 17 of them.
Figure 10 shows the average number of concurrent incidents and the number of scheduled IR
vehicles by day of week for the entire year. The data were sampled at 5 minute increments from
1:00 AM to 11:00 PM. The figure indicates that the operators of the COMET program have
scheduled an appropriate number of vehicles to be on the road at any given time. Tuesday at
about 9:00 AM is the only time where the average number of ongoing incidents exceeds the
number of scheduled IR vehicles during the week. On the weekends, for a short period of time at
about 11:00 AM on Saturday there are more incidents than responders.
Using Archived Data to Measure Operational Benefits of ITS Investments: Incident Response Program Page 15
Portland State University Center for Transportation Studies 2004
4.5 Interstate 5 Analysis
The I-5 corridor was selected in consultation with the project technical advisory committee for
more detailed analysis and is shown on Figure 1. We have limited our study to the section of I-5
beginning from the North at the Columbia River, South through downtown Portland to
Wilsonville at the far southern end of the map. I-5 has many unique characteristics that make it
difficult to travel and more prone to incidents than other freeways in the area. The corridor
includes steep grades, sharp curves, sections without shoulders, and heavy truck volumes. Many
of the on and off-ramps are not standard diamond interchanges, which can make the freeway
confusing to those inexperienced with the corridor.
In 2001 there were 5,698 incidents in the I-5 corridor. In order to understand some of the
corridor’s characteristics, Figure 11 shows the frequency of these incidents by time of day and
day of week. As expected, the number of crashes was lower on weekends and during off-peak
hours. It is interesting to note that the AM peak period displays higher incident frequency than
the PM peak. There was an average of 1,035 weekday incidents on I-5 in 2001.
Approximately 40% of the incidents in the I-5 corridor had durations of less than 10 minutes, as
shown in Figure 12. The average duration for an incident in this corridor was 33 minutes. Only
a small percentage of incidents had a duration of over 2 hours. Some of the very long duration
incidents were severe crashes or examples of TMOC operators neglecting to close an incident
record. Incidents with low impact and severity but excessively long durations are likely cases of
records forgetting to be closed.
Figure 13 shows the location by type, of each of the incidents on I-5 in 2001. Only 32% of the
incidents occurred in lane, and almost 2/3 of the incidents occurred on the right shoulder of the
freeway. Sixty-one percent of the incidents on 1-5 were stalls, as compared to the entire metro
region in which 50% of the incidents were stalls. The percentage of crash and debris incidents is
similar to the region as a whole.
Using Archived Data to Measure Operational Benefits of ITS Investments: Incident Response Program Page 16
Portland State University Center for Transportation Studies 2004
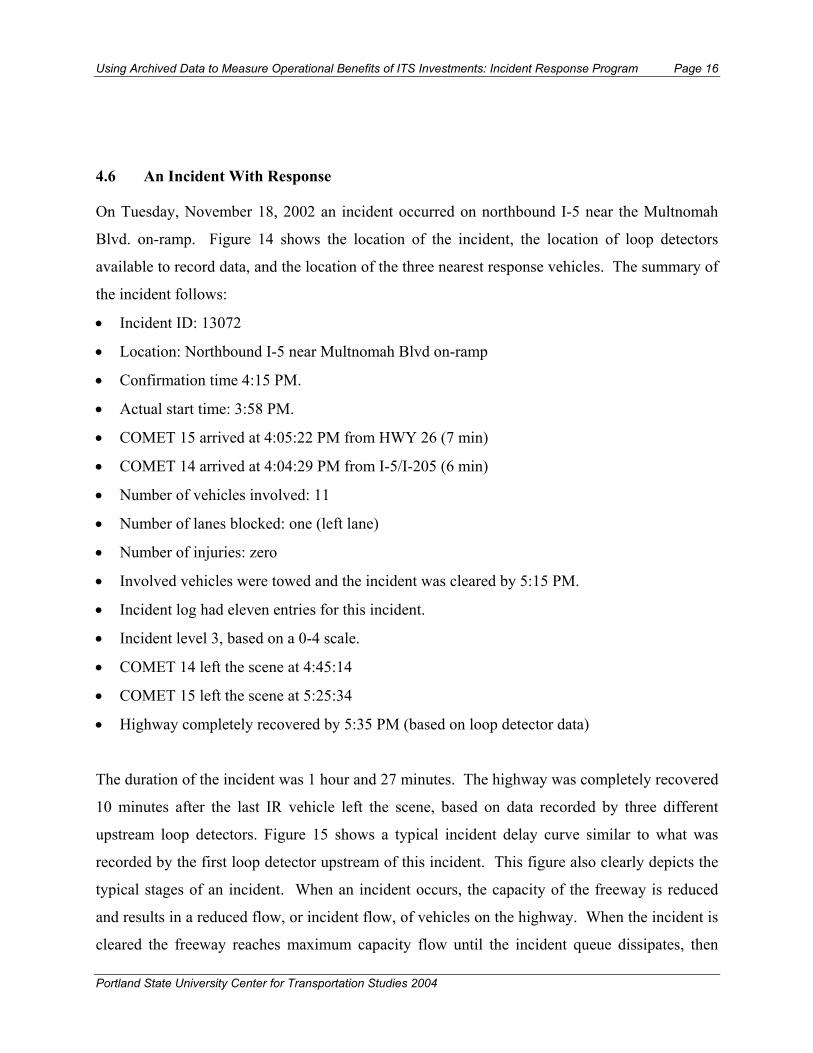
4.6 An Incident With Response
On Tuesday, November 18, 2002 an incident occurred on northbound I-5 near the Multnomah
Blvd. on-ramp. Figure 14 shows the location of the incident, the location of loop detectors
available to record data, and the location of the three nearest response vehicles. The summary of
the incident follows:
• Incident ID: 13072
• Location: Northbound I-5 near Multnomah Blvd on-ramp
• Confirmation time 4:15 PM.
• Actual start time: 3:58 PM.
• COMET 15 arrived at 4:05:22 PM from HWY 26 (7 min)
• COMET 14 arrived at 4:04:29 PM from I-5/I-205 (6 min)
• Number of vehicles involved: 11
• Number of lanes blocked: one (left lane)
• Number of injuries: zero
• Involved vehicles were towed and the incident was cleared by 5:15 PM.
• Incident log had eleven entries for this incident.
• Incident level 3, based on a 0-4 scale.
• COMET 14 left the scene at 4:45:14
• COMET 15 left the scene at 5:25:34
• Highway completely recovered by 5:35 PM (based on loop detector data)
The duration of the incident was 1 hour and 27 minutes. The highway was completely recovered
10 minutes after the last IR vehicle left the scene, based on data recorded by three different
upstream loop detectors. Figure 15 shows a typical incident delay curve similar to what was
recorded by the first loop detector upstream of this incident. This figure also clearly depicts the
typical stages of an incident. When an incident occurs, the capacity of the freeway is reduced
and results in a reduced flow, or incident flow, of vehicles on the highway. When the incident is
cleared the freeway reaches maximum capacity flow until the incident queue dissipates, then
Using Archived Data to Measure Operational Benefits of ITS Investments: Incident Response Program Page 17
Portland State University Center for Transportation Studies 2004
resumes normal demand flow. With the currently available data, a detailed analysis is possible
for almost all incidents and can be used as a tool for evaluation of response procedures when
necessary.
4.7 Estimation Of Delay
Estimating the delay caused by the 21,728 incidents in the Portland Area in 2001 is not an easy
task, and any method employed will introduce some degree of error. However, this study
attempts to minimize the error when possible. The CAD data and the average hourly traffic
volume from the ATCs were used for delay estimation. As discussed earlier, only 10% of the
incidents in the CAD data for 2001 are geocoded, and the data archive only records incident
locations by major highway and nearest cross-street, exit, or landmark. This required each
incident to be manually located on a map and manually assigned to the nearest traffic recorder.
Since there were over 21,000 incidents to locate, a smaller three week sample was selected for
analysis. There were 2,300 incident records during a three week period from November 4th to
November 24th in 2001. After removing the duplicate entries there were only 660 unique
incidents remaining. A closer look at the data shows that only about 25% of those incidents
caused delay. A delay causing incident includes those with a duration of 1 minute or greater,
located on a freeway, either in lane or on a shoulder. Further filtering of the incidents resulted in
164 that were determined to be delay causing. Those filtered out were test records, incidents
located on surface roads and incidents with a duration of zero.
After each incident was assigned to a traffic recorder, the average hourly traffic volumes for the
specific hour of each incident were extracted from the ATC data and associated with the incident
as the normal flow for that time of day and location. To determine the capacity reduction caused
by each incident, we used the table in Appendix C, from the Highway Capacity Manual. The
length of each incident was determined by the difference in hours between the time when the
incident was first confirmed and the time when it was cleared.
Using Archived Data to Measure Operational Benefits of ITS Investments: Incident Response Program Page 18
Portland State University Center for Transportation Studies 2004
Vehicle hours of delay was then estimated for each incident using the following calculation:
D = F * R * T Where: D = Vehicle Hours of Delay F = Normal Flow R = reduction of capacity by percent T =duration of incident in hours
The result for the three weeks of data was 112,146 total vehicle hours of delay. Extrapolating
that result to the full year results in an estimate of 90 vehicle hours of delay per incident and
1,940,126 vehicle hours of delay on the freeways of the Portland metro area in 2001.
4.8 Estimating the Cost of Delay
The two primary factors considered in an estimation of delay cost are fuel consumption and time.
Fuel costs were estimated using the following simple General Motors model:
E = k5 * L + k6 * T
Where: E = additional fuel consumed per vehicle k5 = 90 ml/km = 0.03826 gallons per mile L = distance traveled in queue k6 = 0.44 ml/sec = 0.4184 gallons per hour T = travel time in queue
This model estimates the additional fuel consumed by vehicles moving slowly in traffic (average
speed under 40 mph) such as those in a queue. The data were not recorded in a format that
differentiated vehicles by type so only total numbers of vehicles were used. For the purpose of
this report, it was assumed that vehicles average approximately 10 mph throughout the queue
and that the cost of fuel is $1.62 per gallon, the average price for a gallon of mid-grade fuel in
2001. Therefore, the equation can be simplified to:
E *1.62 = $1.30 per hour per vehicle
For the Portland Metro Area in 2001 the estimated cost of additional fuel consumption due to
delay was $2,522,164.
Using Archived Data to Measure Operational Benefits of ITS Investments: Incident Response Program Page 19
Portland State University Center for Transportation Studies 2004
Time costs were estimated using the following model:
T=C*VO*VHD Where: T = Total cost of time spent in delay C = One hour of time cost, $17.87 VO = Vehicle Occupancy, 1.47 for the Portland Metro Area VHD = Vehicle Hours of Delay
The origin of the time cost and vehicle occupancy rates are shown in Appendix D and E. For the
Portland Metro Area in 2001 the estimated cost of lost time due to delay was $48,483,758. Time
cost is far and away the most expensive portion of delay costs. The estimated cost of incident
delay for 2001 including both fuel consumption and time is $2,350 per incident and a total of
$51,005,922 for all incidents.
4.9 Cost/Benefit Analysis of the Incident Response Program
Unfortunately, data prior to the inception of the COMET program are not available for this
evaluation, however other studies have shown that incident response systems do reduce the
duration of the incidents in which they assist. (2) This reduction is primarily due to faster
response times because the vehicles are already patrolling the area and the network of CCTV
cameras can identify incidents and call for response more quickly. While it is impossible to
determine exactly how much COMET reduces the average duration of incidents we can
reasonably assume that there is some reduction. Table 1 shows the vehicle hours of delay, fuel
consumption, time cost and total cost for the actual duration of the incidents. In addition it
shows the costs if the duration of each incident were increased by 1, 5, or 10 minutes. Making
the assumption that without COMET each incident would increase in duration by 1 minute then
the cost of delay increases by $1,422,618, or roughly twice the cost of operating the Comet
program for one year. If incidents were to increase in duration by more than 1 minute without
COMET then the benefits created by the program increase much more dramatically.
Using Archived Data to Measure Operational Benefits of ITS Investments: Incident Response Program Page 20
Portland State University Center for Transportation Studies 2004
Actual Incident
Delay + 1 minute per
incident + 5 minutes per
incident + 10 minutes per
incident Hours of Delay 1,940,126 1,994,239 2,210,689 2,481,251
Time $48,483,758 $49,836,030 $55,245,115 $62,006,472
Total Cost $51,005,923 $52,428,540 $58,119,011 $65,232,099
Table 1
Based on the data indicating that an average reduction of about 30 seconds per incident is the
break even point for costs and benefits of the program we can plot a curve to show the level of
efficiency at which COMET must operate for benefits to exceed costs. Figure 16 shows the
percentage of incidents assisted on the vertical axis and the number of minutes duration is
reduced on the y axis. For the program to be operating at a cost efficient level they must be
operating up and to the right of the curve.
Applying this to the 2001 data is a little more difficult due to lack of reliable incident assistance
data. The CAD dataset records whether or not COMET was requested for each incident, but
does not indicate whether or not an incident was actually assisted by COMET, and incidents
where COMET discovered the incident do not record a request for assistance. However, as an
example, 9,435 incidents in 2001 included a request for COMET assistance. Making the
assumption that COMET assisted in each of those incidents 43% of all incidents received
assistance. Using the curve in Figure 16 each of those assisted incidents needed to be reduced in
duration by an average of about 1.1 minutes for the program to be cost effective.
Using Archived Data to Measure Operational Benefits of ITS Investments: Incident Response Program Page 21
Portland State University Center for Transportation Studies 2004
5.0 CONCLUSIONS & RECOMMENDATIONS
5.1 Conclusions As described above, there are numerous other benefits derived from the IR program that have not
been quantified due to limitations in the study scope and limitations in data collection feasibility.
First, by reducing delay, IR reduces the total exposure of motorists to congestion. Not only is
this measurable in terms of delay cost, but also in terms of avoided crashes and pollution.
Often the IR responder is first on the scene after a crash and is able to provide first aid that may
save a person’s life or reduce the total health care costs that will be necessary. In addition as the
“eyes and ears” of the DOT, the IR staff provide immeasurable good will and public relations
value, since many citizens may never have any other contact with ODOT. If their only contact
with ODOT staff is a person rescuing them from a roadside stall then their perceptions of ODOT
are likely to be positive. The IR program can provide a sense of security and safety for drivers
that is also difficult to measure.
Reducing congestion and minimizing roadway blockages improves freight movement, allowing
the flow of commerce to occur unimpeded. Portland is at the convergence of key interstate
highways, waterways, rail facilities and an international airport. This multi-modal hub makes
timely freight movement along Portland’s highways a high priority for the state’s economy.
In addition, IR responders assist with hazardous materials spills, which prevents harm to wildlife,
soil and water quality. As the responders patrol the highways they can relay maintenance issues
to the TMOC to be quickly handled, possibly preventing future incidents. Finally, with respect
to construction areas, the IR staff can monitor the status of cones, barricades and signage to help
maintain safety during periods when contractors are not working.
While the data were not available to definitively conclude that the benefits of COMET outweigh
the costs it is reasonable to conclude that it does. The responders only need to reduce the
duration of each incident by just a few minutes to have a measurable impact on the flow of
traffic. It is impossible to measure and assign a dollar value to the numerous other
Using Archived Data to Measure Operational Benefits of ITS Investments: Incident Response Program Page 22
Portland State University Center for Transportation Studies 2004
environmental and public relations benefits of the program discussed above. Our study
concludes that the COMET program in Region 1 is a benefit to the people of the community.
5.2 Recommendations
In order to make the CAD data more useful we recommend a few improvements to the database.
• All incidents should be geocoded to allow for easier analysis and incident location at a
later time.
• A field indicating COMET assistance should be accurately kept for each incident.
• Unused data fields should be removed from the database.
• Standardize the names used to indicate the primary and secondary routes of incidents.
• Add a field for weather data
• Include a field for the physical characteristics of the incident location including the
number of lanes on the highway, and if and where shoulders exist.
Future Study:
• Include a comparison of incidents cleared by COMET and those cleared by police. This
could be done with recorded video of each type of incident.
• Include evaluation of the variable message sign system to improve the effectiveness and
efficiency of this tool.
Using Archived Data to Measure Operational Benefits of ITS Investments: Incident Response Program Page 23
Portland State University Center for Transportation Studies 2004
REFERENCES
1. Bertini, R. Tantiyanugulchai, S. Anderson, E. Lindgren, R. Leal, M. Evaluation of Region 2 Incident Response Program Using Archived Data. Portland State University, Transportation Research Group, Research Report, 2001
2. Skabardonis, A. Noeimi, H. Petty, K. Rydzewski, D. Varaiya, P. and Al-Deek, H.
Freeway Service Patrol Evaluation. PATH Research Report UCB-ITS-PRR-95-5 University of California, Berkley. 1995
3. Skabardonis, A. Petty, K. Varaiya, P. and Bertini, R. Evaluation of the Freeway Service
Patrol (FSP) in Los Angeles. PATH Research Report UCB-ITS-PRR-98-31 University of California, Berkley. 1998
4. Nee, J. and Hallenbeck, M. Evaluation of the Service Patrol Program in the Puget Sound
Region. Report WA-RD 518.1. FHWA, U.S. Department of Transportation, 2001
5. Olmstead, T. Freeway management systems and motor vehicle crashes: a case study of Phoenix, Arizona, Accident Analysis and Prevention 33, 2001 pp. 433–447
6. Bertini, R.L. and El-Geneidy, A. Using Archived Advanced Traffic Management System
Data to Evaluate ITS Investments. In Assessing the Benefits and Costs of Intelligent Transportation Systems, Kluwer Academic Publishers, 2002. (In Press)
7. El-Geneidy, A. and Bertini, R.L. Integrating Geographic Information Systems and
Intelligent Transportation Systems to Improve Incident Management and Life Safety. The 8th International Conference on Computers in Urban Planning and Urban Management Conference, Sendai, Japan, 2003.
8. Lindley, J. A. Qualification of Urban Freeway Congestion and Analysis of Remedial
Measures. Report RD/87-052. FHWA, U.S. Department of Transportation, 1986.
FIGURE 1 Incident Response Coverage And Beat Map
FIGURE 2 Incident Type (A), Lanes Blocked (B), And Incident Location (C) By Percent 2001
Stall50%
Debris16%
Crash15%
Tag & Tow11% Other
7%Construction, Congestion &
Other Closure
1%
11078
3533
3188
2323 1457
149
N=21728 Right Shoulder
59%
Right Lanes14%
Left Lanes10%
Left Shoulder6%
Center Lanes4%
All Lanes3%
Off Road1%
Gore Area3%
N=13464
0 Lanes66%
1 Lane31%
2 Lanes2%
3, 4 or More1%
N=18920
(A)
(B)
(C)
* Incidents with complete lane location data FIGURE 3 Lane Location Trees 2001
In-Lane 29.3%
Shoulder 70.7%
Crash 50.5%
Crash 8.3%
Stall 49.5%
Stall 91.7%
One Lane 81.2%
Multi-Lane 18.8%
Multi-Lane 1.5%
N=9901*
One Lane 98.5%
FIGURE 4 Incident Frequency 2001
FIGURE 5 Incidents Per Month By Type 2001
215 208 236 269 222 234 186 242 195304 293 257
789 764803 803 917
714919
892
745
937 1009
774
497445
425462
621
444
585 514
423
547538
492
0
200
400
600
800
1000
1200
1400
1600
1800
2000
Janu
ary
Februa
ry
March
April
May
June Ju
ly
Augus
tSep
tembe
r
Octobe
r
Novem
ber
Decem
ber
Month
Num
ber o
f Inc
iden
ts
OtherStallCrash
N=18920
1501 15341464
1417
1760
1392
1690 1648
1363
1788 1840
1523Mean1576
FIGURE 6 Crashes And Precipitation
65
50
79
144
50
101
3643
35
174181
194
150158 157
125
172
133
150
199
160
130
112
66
0
50
100
150
200
250
January February March April May June July August September October November December
Month
Num
ber o
f Cra
shes
0
5
10
15
20
25
Num
ber o
f Wet
Day
s
Crashes on Wet Days Crashes on Dry Days Wet Days1152 Crashes on Wet Days1712 Crashes on Dry Days113 Wet days
FIGURE 7 Frequency Of Crashes By Duration (A) And Frequency Of Stalls By Duration (B)
Frequency of Stalls by Duration in 2001
230 120 78 44 30 24 20 11 10 6 9 2 2 1 1 5 0 8
546
1601
7318
0
1000
2000
3000
4000
5000
6000
7000
8000
0:30:0
0
1:00:0
0
1:30:0
0
2:00:0
0
2:30:0
0
3:00:0
0
3:30:0
0
4:00:0
0
4:30:0
0
5:00:0
0
5:30:0
0
6:00:0
0
6:30:0
0
7:00:0
0
7:30:0
0
8:00:0
0
8:30:0
0
9:00:0
0
9:30:0
0
10:00
:00
10:00
:00 +
Duration
Freq
uenc
yFrequency of Crashes by Duration in 2001
1286
923
321
12264
32 23 17 16 9 8 6 6 8 4 1 1 0 3 2 90
200
400
600
800
1000
1200
1400
0:30:0
0
1:00:0
0
1:30:0
0
2:00:0
0
2:30:0
0
3:00:0
0
3:30:0
0
4:00:0
0
4:30:0
0
5:00:0
0
5:30:0
0
6:00:0
0
6:30:0
0
7:00:0
0
7:30:0
0
8:00:0
0
8:30:0
0
9:00:0
0
9:30:0
0
10:00
:00
10:00
:00 +
Duration
Freq
uenc
y
(A)
(B)
N=2861
N=10066
Portland State University Center for Transportation Studies 2004
FIGURE 8 Crashes by Day of Week(A), and by Time of Day (B)
FIGURE 12 Frequency Of Incidents By Duration On I-5 2001
2201
1081
668
457
317234
167100 73 67 46 35 27 23 16 10 17 14 12 9 8 7 9 2
98
0
500
1000
1500
2000
2500
0:10
0:20
0:30
0:40
0:50
1:00
1:10
1:20
1:30
1:40
1:50
2:00
2:10
2:20
2:30
2:40
2:50
3:00
3:10
3:20
3:30
3:40
3:50
4:00
More
Minutes
Freq
uenc
y
0%
10%
20%
30%
40%
50%
60%
70%
80%
90%
100%
FrequencyCumulative %
N=5698
33 M
inut
e M
ean
Dur
atio
n
FIGURE 13 Incidents by Type and Location on I-5
Percentage of Incidents by Type on I-5
Crash16%
Stall61%
Debris12%
Tag & Tow11%
Percentage of Incidents by Location on I-5
Left Side6%
In-Lane32%
Right Side62%
FIGURE 14 Location of One Incident, IR Vehicles, and Loop Detectors.
FIGURE 15 Typical Delay Curve
Time
Cumulative Vehicles
Capacity Flow
Actual Incident Duration
DemandFlow
Total Delay
Incident Flow
Clearance Time
Det
ectio
n
Res
pons
e
Recovery
Capacity Flow
Inci
dent
Eff
ects
Cle
ared
Inci
dent
Cle
ared
Inci
dent
Occ
urs
Ver
ified
C
all R
ecei
ved
IR A
rriv
ed
Tow
Tru
ck C
alle
d
Tow
Tru
ck A
rriv
ed
Efficiency Curve
0%
10%
20%
30%
40%
50%
60%
70%
80%
90%
100%
0 1 2 3 4 5 6 7 8 9 10 11
Average Reduction of Incident Duration in Minutes
Perc
enta
ge o
f Inc
iden
ts A
ssis
ted
Benefits are Greater than Costs
Costs are Greater than Benefits
FIGURE 16 Efficiency Curve
APPENDIX A
Data Dictionary
This document describes the fields and data in the Computer Aided Dispatch database. The data field is shown in bold and the description of the data is below.
Incident ID
The number assigned to the incident. There can be multiple records using the same incident ID
Incident Type ID
A number from 1-8 used to describe the type of incident.
Detection Type ID
A number from 0-5 used to indicate how ODOT was made aware of the incident.
County Code ID
A number used to identify the county in which the incident took place. Each county is assigned a unique number.
City Code ID
A number used to identify the city in which the incident took place. Each city is assigned a unique number.
Primary Route
The interstate or state highway on which the incident took place.
Secondary Route
Additional descriptive information used to locate the incident. The nearest cross street, mile marker, or proximity to a landmark like a bridge.
Location Type ID
A number from 0-10 used to indicate the type of road. Some examples are; bridge, arterial, freeway.
Location Text
Short detailed description of incident location
Direction
Direction of Travel
Affected Lane Type ID
Number from 0-10 indicating the type of lane affected by the incident. Examples are; right, left, middle, shoulder.
Portland State University Center for Transportation Studies 2004
Number Lanes Affected
The number of lanes affected
Station ID
Loop Detector #
Segment ID
# of Segment (rarely used in Portland)
Navlink Start ID
Latitude/Longitude of segment start (rarely used in Portland)
Navlink End ID
Latitude/Longitude of segment end (rarely used in Portland)
Jurisdiction
A number representing the jurisdiction of fire, police and media in the area of the incident. (Not used in Portland)
Located Flag
1 indicates located, 0 represents not located.
Fire Department Presence
1 indicates present, 0 represents not present.
Hazardous Materials Presence
1 indicates hazardous materials present, 0 represents not present.
Injury Count
The number of people injured in the incident
Fatality Count
The number of deaths at the scene resulting from incident (not very reliable)
Need Police Flag
1 indicates police needed, 0 indicates police not needed.
Need COMET Flag
1 indicates COMET needed, 0 indicates COMET not needed. (not very reliable)
Need Auto Wrecker Flag
1 indicates auto wrecker needed, 0 indicates auto wrecker not needed.
Portland State University Center for Transportation Studies 2004
Signal Damage Light Pole Damage Structure Damage Other Damage 1 indicates damage, 0 indicates no damage
Pedestrian Count
Number of pedestrians involved in the incident. Railroad Count Automobile Count Motorcycle Count Pickup/Van Count DOT Vehicle Count Construction Vehicle Count Motorhome/Bus Count Light Truck Count Tractor Trailer Count
Other Vehicle Count
Number of each type of vehicle involved in the incident
Hazard Flag
1 indicates presence of a hazard, 0 indicates no presence. (Rarely Used)
Officer Name
Gives the name of the officer on scene (Rarely Used)
Officer Badge Number
Gives the badge number of the officer on scene. (Rarely Used)
Estimated End
Estimated time to clear incident. Operators make the estimate. Estimates are often too high because of a software feature that will remind operators too often that an incident is still active. If operators estimate a long time for incidents to be cleared they avoid pop-up reminders.
Impact Type
A number from 1-4 representing the impact of the incident on traffic movement. 1=No impact 2=Low 3=Medium 4=High
Portland State University Center for Transportation Studies 2004
Number Calls
Number of calls received about incident from all sources (not used in Portland)
Reported Via ID
A number from 0-5 indicating how the incident was reported
Reported by Name
Name of the person reporting the incident
Contact Name
Name to use to contact the person reporting the incident Contact Phone Number to use to contact the person reporting the incident
Radio Unit Number
Used for construction purposes. Radio Call Sign
Scheduled Start
Scheduled start time of a planned incident, usually used for construction.
Scheduled End
Scheduled end time of a planned incident, usually used for construction.
Actual Start
Actual start time of a planned incident, usually used for construction.
Actual End
Actual end time of a planned incident, usually used for construction.
Confirm Flag
1 indicates confirmation of incident, 0 indicates no confirmation
Confirm Time
Date and time of incident confirmation
Confirm Operator
The number of the operator confirming the incident.
Last Update Time
The time of the last update of that record
Portland State University Center for Transportation Studies 2004
Last Update Operator
The number of the operator last updating the incident
Action Pending
Unknown (not used in Portland)
Plan Flag
For planned construction incidents (not used in Portland)
Diversion Flag
1 indicates traffic diverted, 0 indicates no diversion.
X Position, Y Position
Location of incident by latitude and longitude
Alarm Interval
A software setting not used in Portland
Incident Level
1=No injury, no lanes blocked 2=Minor injury and/or 1 lane blocked 3=With or without injury, blocking 2 or more lanes 4=Closing highway for 2 or more hours
Comments
Descriptive comments about the incident from incident responders or operators.
Portland State University Center for Transportation Studies 2004
APPENDIX B
Automatic Traffic Recorders
Portland State University Center for Transportation Studies 2004
APPENDIX C
Capacity Reduction Table
Proportion of Freeway Segment Capacity Available under Incident Conditions
Number of Lanes Blocked Freeway Lanes in Shoulder Shoulder One Two Three Direction Disablement Accident
7 Total "On-the-Job" Value $ 32.95 $ 26.84 $ 28.31
8 Miles "on-the-job" % 10 31 100 9 Weighted Value $ 3.29 $ 8.32 $ 28.31
10 Total "Off-the-Job" Value $ 14.28 $ 14.28 $ -
11 Miles "off-the-job" % 90 69 0 12 Weighted Value $ 12.85 $ 9.85 $ -
13 Total Weighted Average $ 16.15 $ 18.17 $ 28.31
Assuming the following traffic composition, 65 percent passenger cars, 25 percent light trucks, and 10 percent heavy trucks, the average cost per hour is $17.87 per hour.
Portland State University Center for Transportation Studies 2004
APPENDIX E Vehicle Occupancy Rates for Oregon
Vehicle Occupancy The vehicle occupancy statistics shown on this page were derived from 180,725 vehicles that were involved in accidents during the years 1996, 1997, and 1998 in cities with a population over 10,000. The overall average vehicle occupancy per car was 1.47 for this period.
Portland State University Center for Transportation Studies 2004
APPENDIX F Fuel Prices
Retail Fuel Prices in Oregon 2001 January $1.51 $1.61 $1.70 February $1.51 $1.60 $1.70 March $1.52 $1.62 $1.71 April $1.53 $1.62 $1.71 May $1.58 $1.68 $1.77 June $1.62 $1.72 $1.80 July $1.54 $1.64 $1.73 August $1.50 $1.59 $1.67 September $1.68 $1.77 $1.84 October $1.57 $1.69 $1.75 November $1.41 $1.52 $1.59 December $1.22 $1.33 $1.41 Average $1.52 $1.62 $1.70