33
ACCURATELY MEASURE SOCIAL MEDIA ENGAGEMENT G O O G L E ANALYTICS USING HOW TO Digital Marketer Increase Engagement Series
ACCURATELY MEASURE S O C I A L M E D I A E N G A G E M E N T
G O O G L E A N A LY T I C SUSING
HOW TO
Digital Marketer Increase Engagement Series
Brought To You By: Digital Marketer
HOW TO ACCURATELY MEASURESOCIAL MEDIA ENGAGEMENT
USING GOOGLE ANALYTICS
PUBLISHED BY:
Digital Marketer
4330 Gaines Ranch Loop
Suite 120
Austin, TX 78735
c Copyright 2015
Digital Marketer LLC. All Rights Reserved.
May be shared with copyright and credit
left intact.
DigitalMarketer.com
THIS 3-PART EMAIL SERIES CONSISTENTLY DOUBLES SALES
If you’re looking for a simple
way to bump your conversions
(without having to write new
sales copy), then download
this copy-and-paste followup
series today...
3
ABOUT DIGITAL MARKETER
DigitalMarketer.com is a community where marketers, growth hackers, entrepreneurs and small business owners come to get
ideas on:
Driving More TrafficIncreasing Conversion Rates, and…
Boosting Social Engagement
NOTE: If you’re new to DM, you can click one of the links below for free, instant access to our most popular articles and case
studies on the subject that interests you most: Traffic, Conversion or Engagement.
If you like what you see, you can subscribe to our Digital Marketer Newsletter and get new case studies and reports in your inbox
every week…
4
CONTENTS
07
10
15
18
25
MEASURE WHAT MATTERS
MEASURING REVENUE FROM SOCIAL ENGAGEMENT IS HARD
DON’T USE THIS MODEL...
THERE IS A BETTER WAY
MEASURING THE COST OF SOCIAL MEDIA ENGAGEMENT IS EASY
6
No more excuses.
It’s time that we justify the time, energy and money spent on social media in the same way we justify all of our other business activities.
But it isn’t easy. In one case — it’s very difficult. In another, it’s actually very simple.
We’ll talk about both and, in the end, you’ll have a framework for measuring the impact social engagement is having on your business.
6
MEASURE WHAT MATTERS
8
At the end of the day, only two things matter to the success of your
business:
Open your accounting software and show me where Facebook Likes
appear on your Profit and Loss statement. Show me Retweets on
your Balance Sheet.
Your accountant, the IRS and the bank don’t care how many Retweets
you are getting. Businesses succeed or fail based on how much
money comes in the door and how much goes out.
Revenue
Costs
8
9
That doesn’t mean that Retweets don’t lead to sales. It doesn’t mean
that discussions on your Facebook page aren’t a cost effective way to
communicate with your market. They might very well be.
What it does mean is that simply measuring the number of Facebook
Fans, Twitter followers or Retweets you are getting isn’t ideal.
But it is possible to start measuring social media’s impact on your
business. You just need to know where to concentrate your effort.
Let’s start with the bad news…
9
MEASURING REVENUE FROM SOCIAL ENGAGEMENT IS HARD
11
In some cases, it’s impossible. But don’t let that deter you.
You can get close enough if you understand the problem.
The problem can be summed up to a single word that
makes marketing analytics professionals
shudder: attribution.
Sales attribution is defined as the identification of the
actions a buyer took that contributed to a sale and
assigning a value to those activities.
11
12
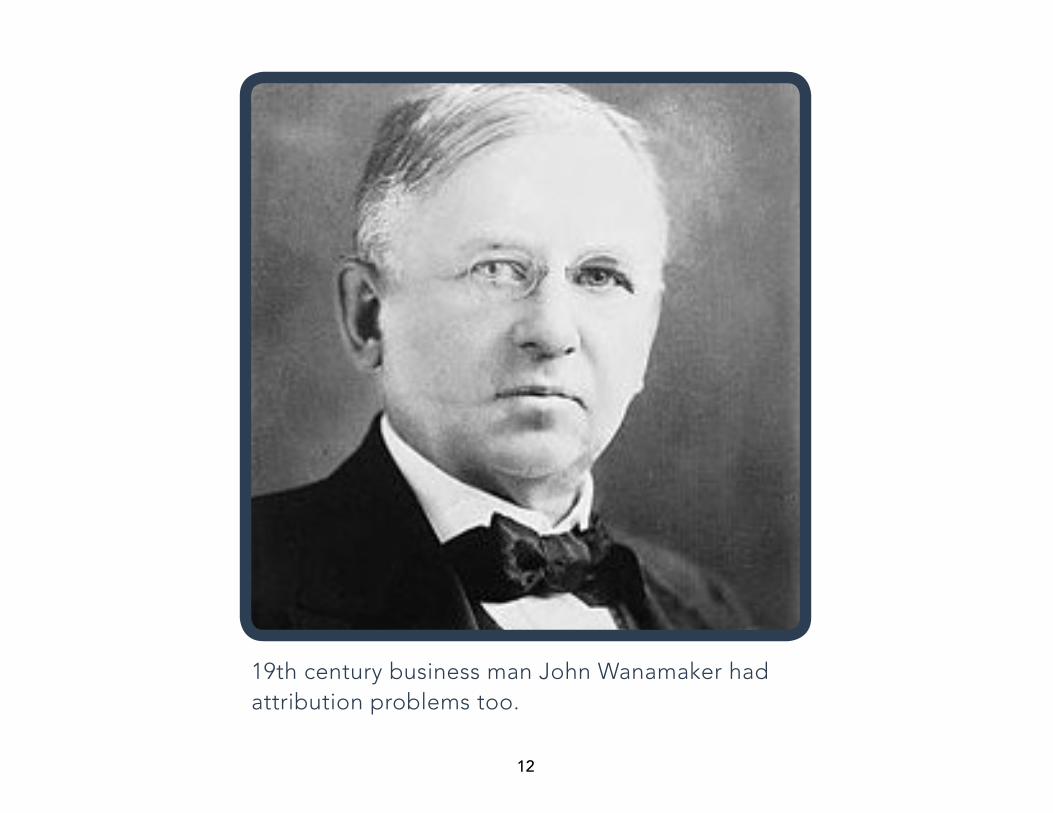
19th century business man John Wanamaker had attribution problems too.
12
13
The attribution problem isn’t new. Marketers have always struggled
to pin a sale to any particular marketing tactic.
You’ve likely heard the quote from 19th century business man,
John Wanamaker:
HALF THE MONEY I SPEND ON ADVERTISING IS WASTED; THE TROUBLE IS I DONT KNOW WHICH HALF
- JOHN WANAMAKER
14
Attribution is still a major issue in digital marketing, particularly when
we try to measure the impact of social engagement.
Sure, we have access to tools like Google Analytics where we can
track sales and see the source of traffic, but even the most expensive
analytics tools struggle with attribution.
14
DON’T USE THIS MODEL…
16
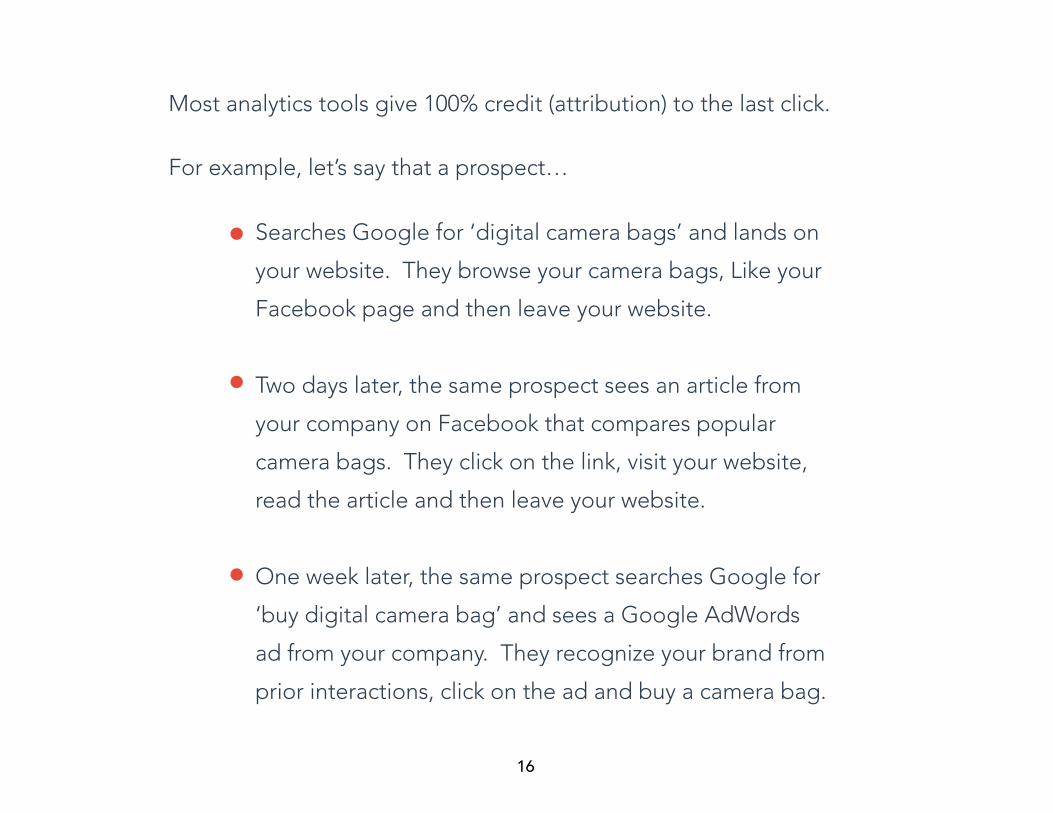
Most analytics tools give 100% credit (attribution) to the last click.
For example, let’s say that a prospect…
Searches Google for ‘digital camera bags’ and lands on
your website. They browse your camera bags, Like your
Facebook page and then leave your website.
Two days later, the same prospect sees an article from
your company on Facebook that compares popular
camera bags. They click on the link, visit your website,
read the article and then leave your website.
One week later, the same prospect searches Google for
‘buy digital camera bag’ and sees a Google AdWords
ad from your company. They recognize your brand from
prior interactions, click on the ad and buy a camera bag.
16
17
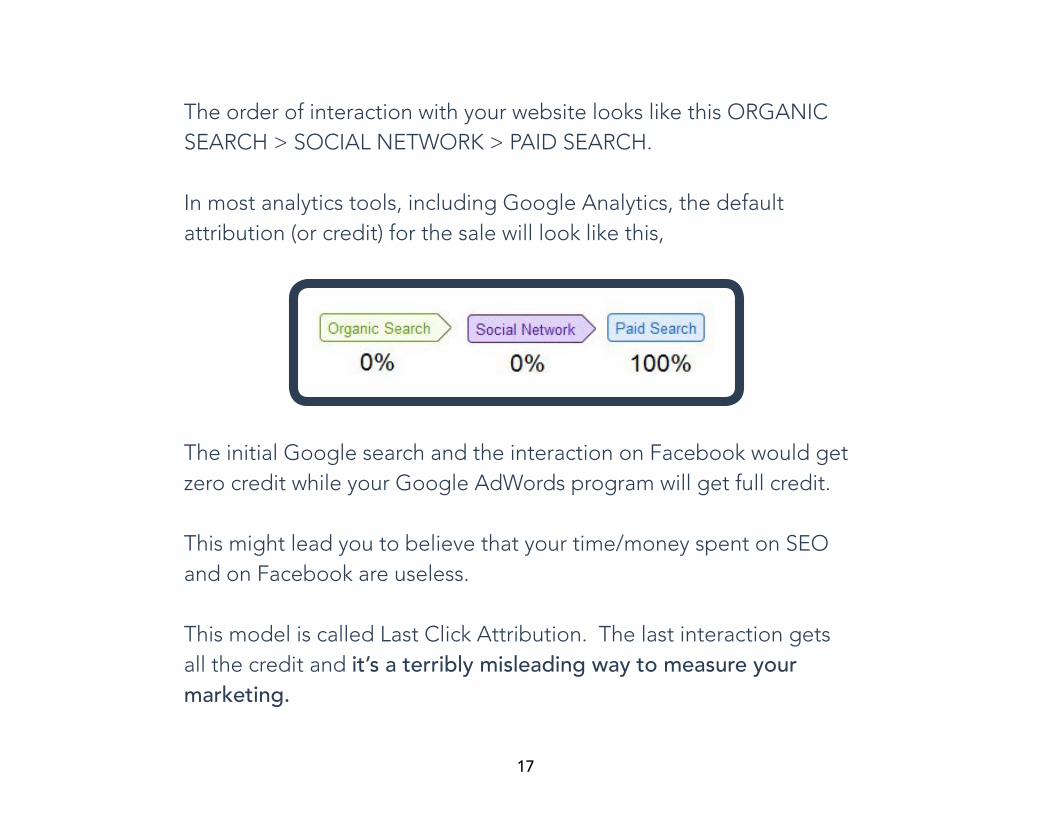
The order of interaction with your website looks like this ORGANIC SEARCH > SOCIAL NETWORK > PAID SEARCH.
In most analytics tools, including Google Analytics, the default attribution (or credit) for the sale will look like this,
The initial Google search and the interaction on Facebook would get zero credit while your Google AdWords program will get full credit.
This might lead you to believe that your time/money spent on SEO and on Facebook are useless.
This model is called Last Click Attribution. The last interaction gets all the credit and it’s a terribly misleading way to measure your marketing.
17
THERE IS A BETTER WAY
19
It’s not perfect, and won’t likely ever be, but there are better ways to
deal with the attribution problem.
There are other attribution models available — even in the free
version of Google Analytics. You just need to know where to look.
First, you will need to have goals set up in Google Analytics. If you
don’t, read this support document from Google to get Goals set up.
Open Google Analytics and then click on
CONVERSIONS > ATTRIBUTION > MODEL COMPARISON TOOL.
You’ll then see a number of attribution models to choose from.
19

20
You can change the way that Google Analytics is attributing credit to Goal Conversions.
20
21
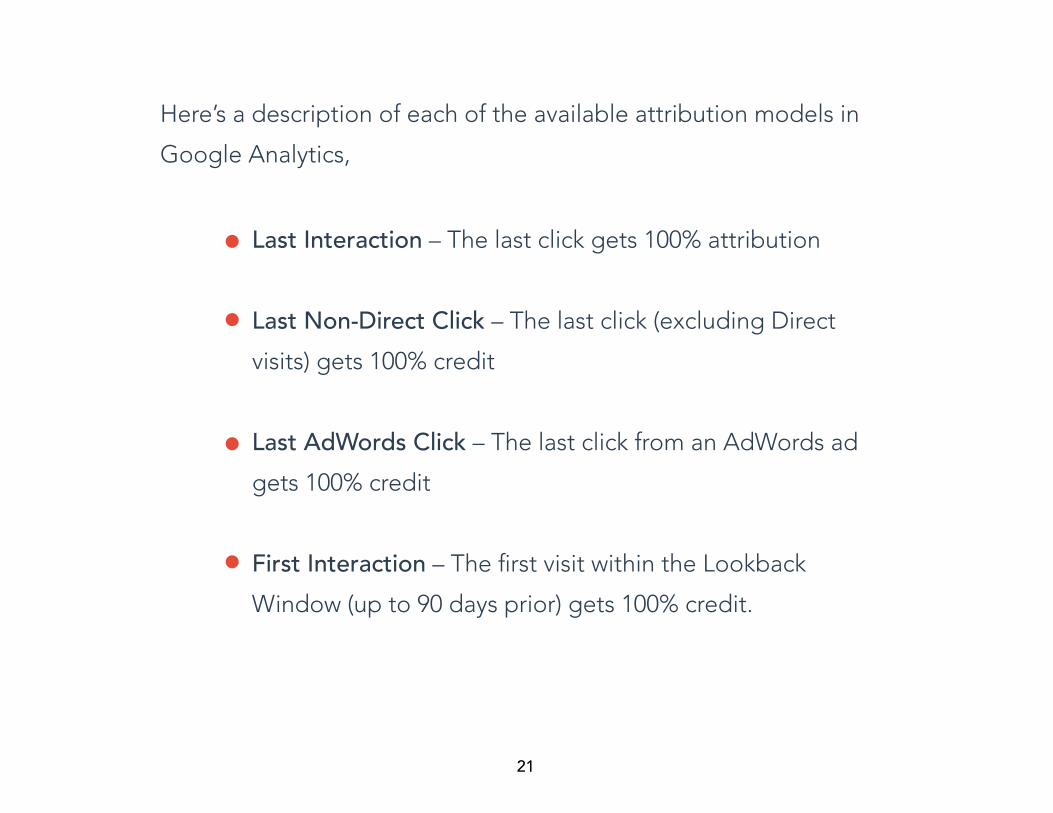
Here’s a description of each of the available attribution models in
Google Analytics,
Last Interaction – The last click gets 100% attribution
Last Non-Direct Click – The last click (excluding Direct
visits) gets 100% credit
Last AdWords Click – The last click from an AdWords ad
gets 100% credit
First Interaction – The first visit within the Lookback
Window (up to 90 days prior) gets 100% credit.
21

22
Linear – Each visit within the Lookback Window gets
equal credit.
Time Decay – More recent visits within the Lookback
Window get more credit while older visits within the
Lookback Window get less credit.
Position Based – The First and Last visits within the
Lookback Window split attribution.
In our example we sold a digital camera bag to a prospect that
visited via Organic Search (SEO), Facebook (Social) and then
ultimately converted after visiting through a Google AdWords Ad.
There are only two models above that would give a shred of credit to
your social media engagement — Linear and Time Decay.
22
23
In fact, these are the two models (Linear and Time Decay) you should
be using if you want a true understanding of how your different
marketing channels, including social media, are performing.
Google Analytics allows you to compare up to three models side
by side. Below is a comparison of the Last Interaction Model to the
Time Decay and Linear models for a start-up software company.
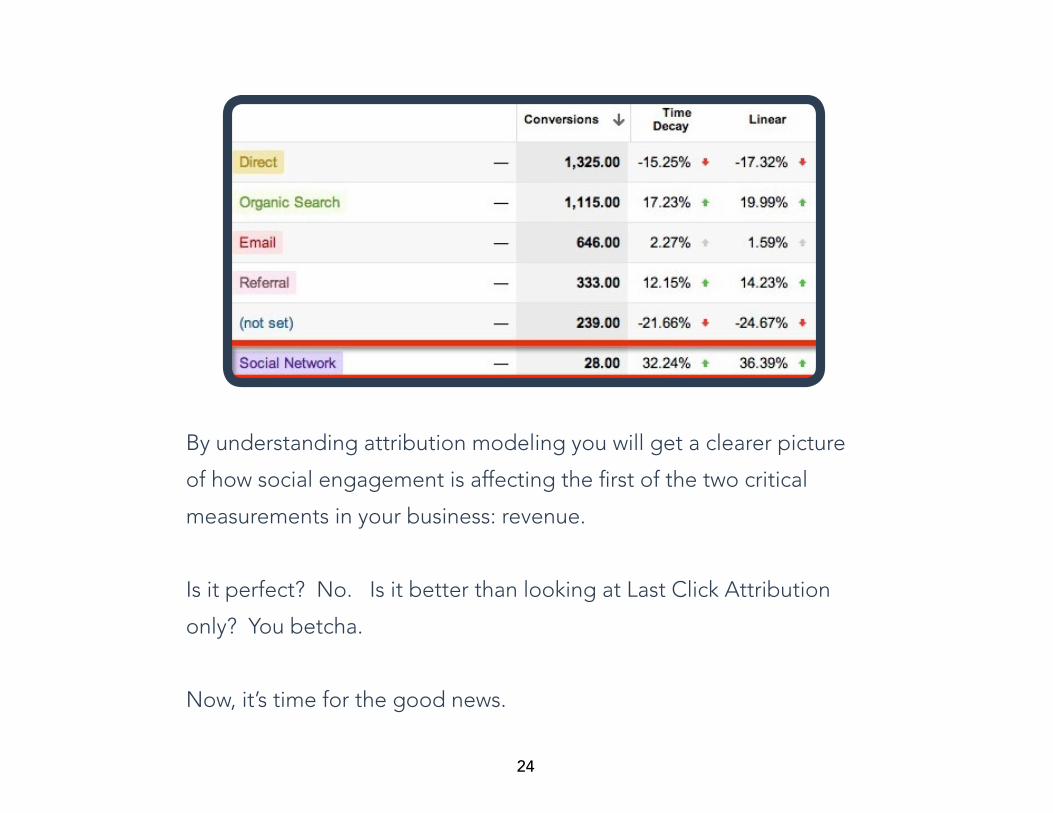
As you can see, when you look at Time Decay and Linear Models, it
becomes clear that Social Network’s have contributed up to 36.39%
more to goal conversions than we would have thought viewing only
the Last Interaction model.
For this company, engaging in social media is clearly better at
“assisting” in conversions than it is at being the last touch before
a conversion.
23
24
By understanding attribution modeling you will get a clearer picture
of how social engagement is affecting the first of the two critical
measurements in your business: revenue.
Is it perfect? No. Is it better than looking at Last Click Attribution
only? You betcha.
Now, it’s time for the good news.
24
MEASURING THE COST OF SOCIAL MEDIA ENGAGEMENTIS EASY
26
Measuring revenue isn’t easy. I get it. But the other
critical measurement in your business is well within your
reach: cost.
How much are you spending on social engagement?
We need that number.
Are you paying graphic designers to build awesome
graphics for Facebook? Are you buying prizes for
contests and giveaways? Are you paying an employee,
agency or contractor to engage in social media?
If it’s just you tweeting and Facebooking (is that a word?)
you are still spending money. What value do you place
on your time? $50 per hour? $100? $200?
26
27
Multiply that amount by the number of hours you spend engaging on
social media, that’s your cost.
For example, If you spend 20 hours on social media sites per month
and you value your time at $100 per hour, your budget is $2000
per month.
Now, at the very least, calculate a measurement called Cost per
Engagement over a particular period of time.
You do this by adding all social media engagements together and
dividing your spend by that number.
27
28
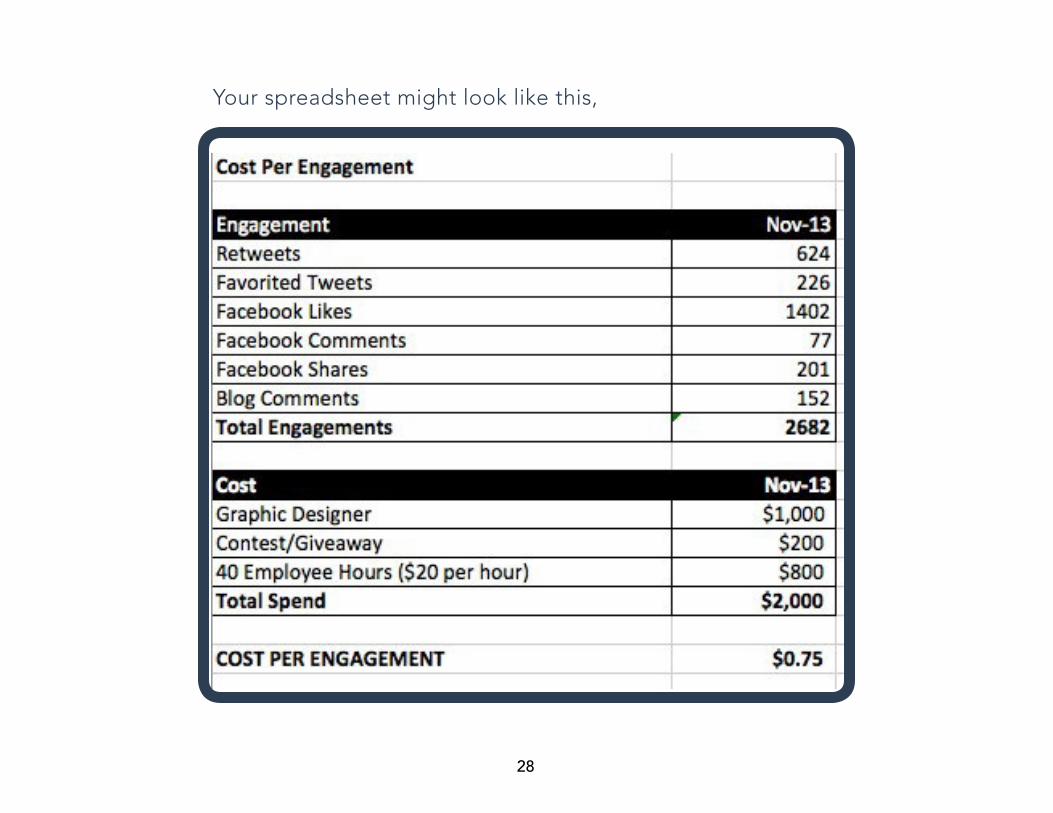
Your spreadsheet might look like this,
28
29
$2000 spend / 2682 engagements = $0.75 Cost Per Engagement
It’s not easy to add up all of your retweets, Likes, shares, etc. It’s a
manual process.
As a result, this might be a calculation you make once a quarter or twice
per year. That said, it might be exactly what you or your boss needs
to see.
In that case, it’s worth taking the time to calculate this metric on a
regular basis.
29
30
The next step is to compare across channels, time periods and
tactics.
Based on what you’ve gathered, you can see how you can easily get
to metrics like,
Cost per Twitter engagement
% Increase In Social Engagement (Month over Month)
Cost per Facebook Contest Engagement
30
31
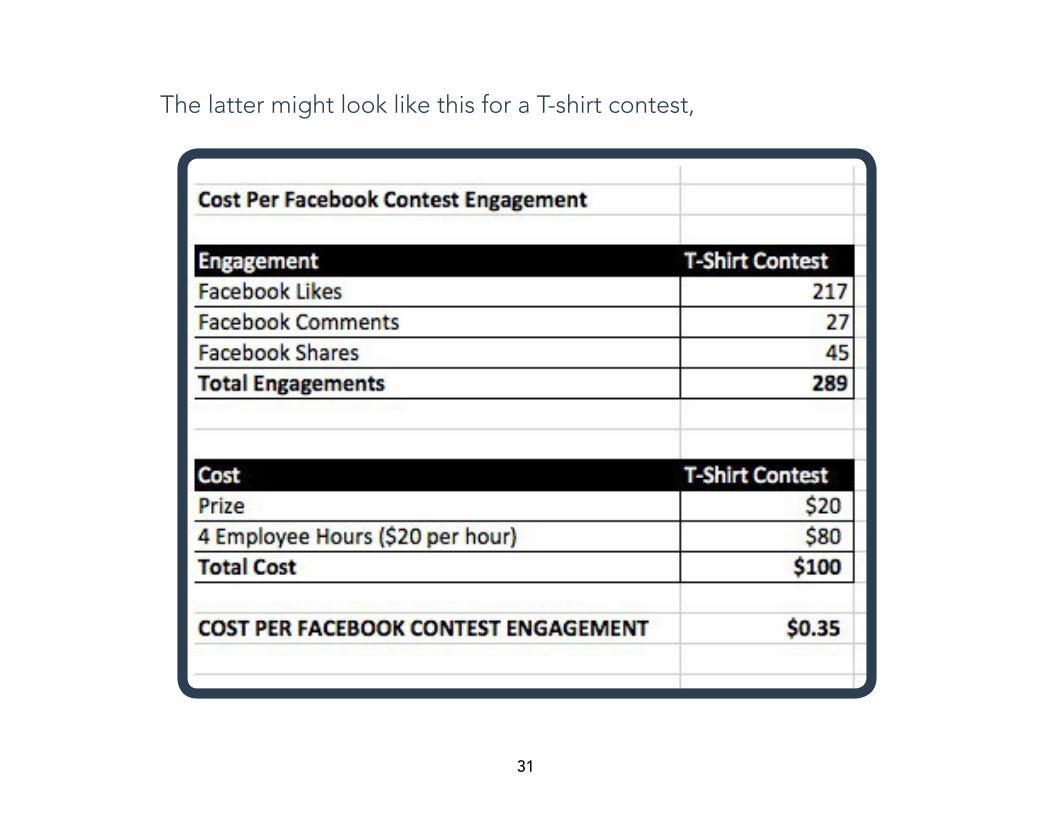
The latter might look like this for a T-shirt contest,
31
32
Hmmm… this contest cost only 35 cents per engagement while the
overall Cost Per Engagement from social media is 75 cents. Maybe
we should run more contests. When you start comparing across
channels, time periods and tactics you will be able to make informed
business decisions like,
Should I pay an agency $2000 per month to manage our
Twitter account?
Did adding the graphic designer in November improve
our social media engagement?
Should I run more contests on our Facebook page?
32

CONCLUSION
And that’s what it’s all about folks. We measure so that we can make decisions that affect our revenue and costs.
Measuring the impact of any marketing tactic isn’t perfect.
It never will be.
But a bit of elbow grease and a spreadsheet will get you to actionable data.


