Popik, Maser, Holzschuher Page 1 USING HIGH-SPEED GROUND PENETRATING RADAR FOR EVALUATION OF ASPHALT DENSITY MEASUREMENTS Mark Popik Applied Research Associates Inc. 5401 Eglinton Avenue West, Suite 105, Toronto, ON, Canada, M9C 5K6 Tel: 416-621-9555, fax: 416-621-4917, email: [email protected]Dr. Ken Maser Infrasense Inc. 14 Kensington Road, Arlington, MA 02476 Phone: 781-648-0440, Fax: 781-648-1778, email: [email protected]Charles Holzschuher, P.E. Nondestructive Testing, FDOT State Materials Office 5007 N.E. 39 th Avenue, Gainesville, FL, 32609 Tel: 352-955-6341, fax: 352-955-6341, email: [email protected]. Technical Paper Abstract Submitted for the 2010 Annual Conference & Exhibition of the Transportation Association of Canada Session: Development of New Technologies for Classification of Materials The objective of the study was to determine the practicality of using ground penetrating radar (GPR) based devices for post-construction HMA density measurements. Non-nuclear density measurement techniques such as GPR are of interest to state highway agencies as substitutes to nuclear gauges primarily for safety concerns and to eliminate costs associated with radioactive material licensing. In addition, GPR has the ability to obtain 100% coverage of the section being tested. The work on this project was carried out using the Florida Department of Transportation (FDOT) 2.0 GHz Horn Antenna GPR system, and included an assessment of its capabilities and limitations, and determination of optimal operational parameters for asphalt density measurement. Key elements of this work were the implementation of automated software for processing the GPR data and a laser trigger system to automatically mark the start and end of the GPR survey sections. A GPR survey protocol, established from test track surveys at FDOT's state materials office test facility, was applied to the field validation trials. Validation and companion testing of the FDOT GPR system was completed on an active construction project. The new construction project was located in District 2, on State Road 20 (SR20). Along various lengths of this project, multiple areas were surveyed, cored, and tested to determine if GPR is suitable for determining asphalt densities. The data collection methodology involves collecting data over a series of longitudinal lines on the pavement surface. Analysis of the collected GPR information is completed using the customized GPRQA software application. The results were mapped using a contour plotting program. The surface dielectric map is used to locate high, low, and mid-range areas for density calibration cores. Selected locations were then cored and tested in accordance with FM-1-T 166, “Florida Method of Test for Bulk Specific Gravity of Compacted Bituminous Mixtures.” Using the obtained, or determined, maximum theoretical specific gravity for the asphalt mixture, the individual density measurements can be converted to determine the compaction effort (in percent) of the contractor. .
Transcript
Popik, Maser, Holzschuher Page 1
USING HIGH-SPEED GROUND PENETRATING RADAR FOR EVALUATION OF ASPHALT DENSITY MEASUREMENTS
Mark Popik
Applied Research Associates Inc. 5401 Eglinton Avenue West, Suite 105, Toronto, ON, Canada, M9C 5K6
Technical Paper Abstract Submitted for the 2010 Annual Conference & Exhibition of the Transportation Association of Canada
Session: Development of New Technologies for Classification of Materials
The objective of the study was to determine the practicality of using ground penetrating radar (GPR) based devices for post-construction HMA density measurements. Non-nuclear density measurement techniques such as GPR are of interest to state highway agencies as substitutes to nuclear gauges primarily for safety concerns and to eliminate costs associated with radioactive material licensing. In addition, GPR has the ability to obtain 100% coverage of the section being tested.
The work on this project was carried out using the Florida Department of Transportation (FDOT) 2.0 GHz Horn Antenna GPR system, and included an assessment of its capabilities and limitations, and determination of optimal operational parameters for asphalt density measurement. Key elements of this work were the implementation of automated software for processing the GPR data and a laser trigger system to automatically mark the start and end of the GPR survey sections.
A GPR survey protocol, established from test track surveys at FDOT's state materials office test
facility, was applied to the field validation trials. Validation and companion testing of the FDOT GPR system was completed on an active construction project. The new construction project was located in District 2, on State Road 20 (SR20). Along various lengths of this project, multiple areas were surveyed, cored, and tested to determine if GPR is suitable for determining asphalt densities.
The data collection methodology involves collecting data over a series of longitudinal lines on the
pavement surface. Analysis of the collected GPR information is completed using the customized GPRQA software application. The results were mapped using a contour plotting program. The surface dielectric map is used to locate high, low, and mid-range areas for density calibration cores. Selected locations were then cored and tested in accordance with FM-1-T 166, “Florida Method of Test for Bulk Specific Gravity of Compacted Bituminous Mixtures.” Using the obtained, or determined, maximum theoretical specific gravity for the asphalt mixture, the individual density measurements can be converted to determine the compaction effort (in percent) of the contractor. .
Popik, Maser, Holzschuher Page 2
INTRODUCTION Recently, there has been a significant increase in the development and application of NDT (non-destructive testing) technologies, such as ground penetrating radar (GPR), seismic techniques, and infrared thermography, in testing pavement materials. NDT test methods offer a good alternative to traditional tests; they reduce coring only for calibration, and provide immediate test results. However, these benefits are useless if the NDT devices do not produce accurate measurements. Several agencies have initiated studies to evaluate the effectiveness and practicality of using NDT technologies in QC/QA practices. Currently, the most widely evaluated NDT device in HMA testing is the non-nuclear density gauge. Non-nuclear density gauges are being considered as a viable substitute to nuclear gauges primarily for safety concerns and to eliminate costs associated with radioactive material licensing.
Perhaps the most studied non-nuclear density measuring devices are the PaveTracker and the Pavement Quality Indicator (PQI) devices manufactured by Troxler and Transtech Systems, Inc, respectively. The PaveTracker operates on the principle of electromagnetic sensing while the PQI estimates density by measuring the electrical impendence of the material. While these devices continue to be improved upon, studies to date have found biases and sensitivities to certain factors described in the next section.
The purpose of this research was to determine the practicality of using GPR based devices for post-construction HMA density measurements. The first step of the study was to determine if GPR based data could be calibrated to density measurements obtained from cores with a level of accuracy and reliability similar to, or better than other non-nuclear technologies. Secondly, a test protocol was developed to evaluate numerous variables with the end goal of developing a standardized procedure for collecting GPR based HMA density measurements.
LITERATURE REVIEW Non-nuclear gauges have been evaluated under many projects with varying results. Three previous FDOT studies have shown that both nuclear and electrical impedance devices have not proven to be reliable when measuring density on Superpave HMA mixes (1, 2, and 3). The variability of the density data was too high in comparison to the actual core densities. In general, both types of gauges did not exhibit superior performance on fine graded mixes as compared to the coarse graded mixes. This would prevent such a device from being used for acceptance where pay factors are determined based on the in-place density of the mix. The most extensive evaluation was performed in an FHWA pooled fund study by Romero et al. (2002), which included 144 projects in six States (4). In general a consistent bias was observed between the non-nuclear density tests and conventional tests, emphasizing the need for appropriate calibration procedures for accurate density predictions. Other studies found a good correlation between PQI and core-measured density, and recommend its use in contractor QC testing (5, 6, and 7). However, some studies have also found the results to be very sensitive to moisture conditions introduced by the rolling operations (8).
Ground penetrating radar (GPR) has been growing in acceptance among highway agencies and industry as a means to non-destructively provide continuous pavement information. GPR technology has been most successfully used to determine pavement layer thickness, but has also been used to identify subsurface voids, assist with forensic investigations, locate utilities and reinforcement, evaluate degradation of bridge decks, and estimate volumetric properties of asphalt pavements.
As part of NCHRP 10-65, thickness/density studies were conducted on newly placed asphalt pavements for six projects located in Alabama, Minnesota, and Texas (9). These projects involved collecting multiple passes of GPR data on each newly paved section, calculating the dielectric constant at each measurement point, and calibrating the dielectric values using laboratory measured air void data at selected locations. Results of this study showed that, even without calibration to density, the dielectric values themselves can reveal density deficiencies.
Popik, Maser, Holzschuher Page 3
Extensive research was also completed in Finland (10), which verified the ability to measure asphalt air void content with GPR. The "air voids GPR" values were obtained from GPR-based dielectric measurements using a small number of cores for calibration. The results showed a very strong correlation between the GPR-based air void measurements and the laboratory measurements (R2 = 0.92). Based on these results, the GPR method is now an accepted standard for asphalt quality control in Finland.
Recent work in the United States sponsored by the Texas Highway Department and the Federal Highway Administration has confirmed the Finnish approach, and has demonstrated the ability to map air content variations on a two dimensional plan view of the newly constructed pavement (11). Another study sponsored by Caltrans compared the dielectric versus design density at the NCAT test track facility in Auburn, AL (12). Results showed reasonably good correlation for those asphalt pavement sections comprised of granite aggregate, but a relatively poor correlation for sections with slag aggregate.
RESEARCH STUDY APPROACH FDOT has been at the forefront of GPR research among highway agencies and initially began investigating GPR as a tool to derive pavement information in the early 1990’s. FDOT has recently implemented a high-speed GPR to determine the surface layer thickness of flexible pavement rehabilitation projects. Layer thickness information, along with FWD data, is collected and analyzed by the SMO in Gainesville, Florida and submitted to the design engineer. FDOT has also used both high speed and ground-coupled GPR systems to assist with forensic investigations, determine the extent of sinkhole activity, locate subsurface voids below rigid pavements and identify buried utilities.
The objective of this project is to evaluate the capabilities and limitations of the FDOT GPR system to estimate the in-place density of asphalt pavement for construction and rehabilitation projects. Techniques to accomplish measurement of density and a plan to implement the methodology were developed. The investigation protocol was completed as follows:
• Evaluation of FDOT’s GPR System • Identifying Promising Techniques • Develop Survey Methodology • Field Validation Testing
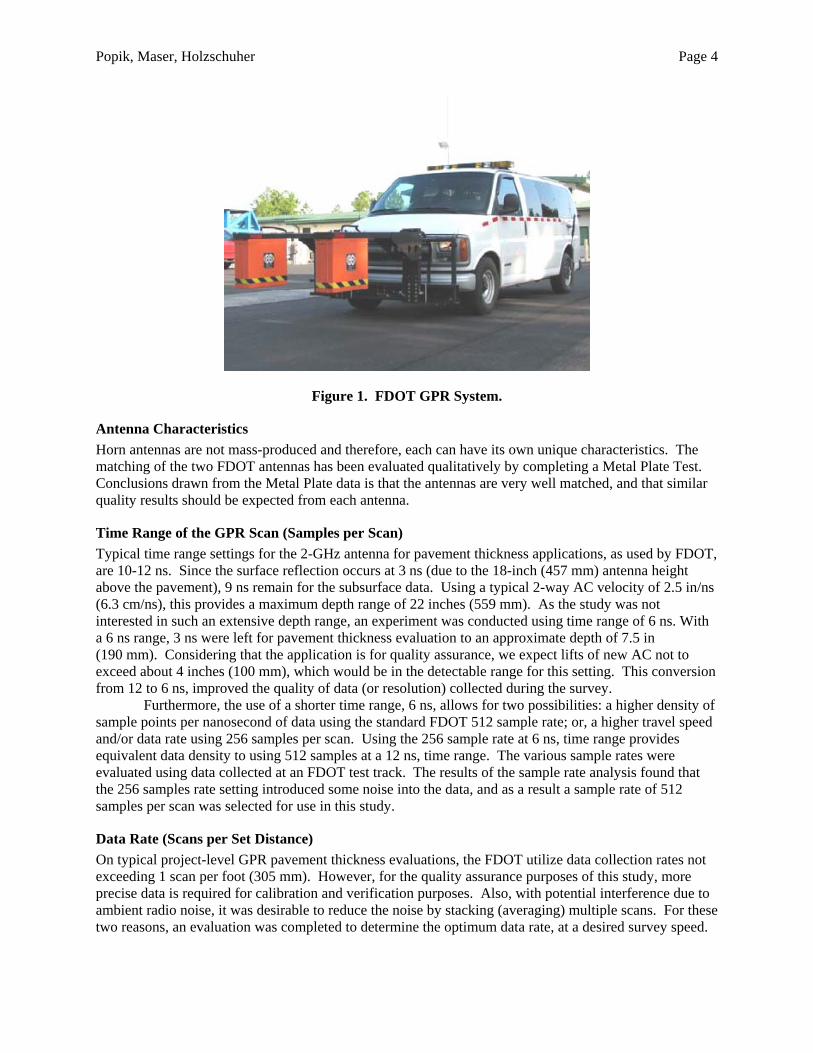
EVALUATION OF FDOT’S GPR SYSTEM The objective of this task was to evaluate the FDOT GPR system and assess its capabilities and limitations as well as define optimal operational parameters for asphalt density determination. The FDOT GPR system consists of a GSSI Subsurface Interface Radar (SIR) 20 and two 2 GHz air-launched antennas (13). The antennas can be mounted from the front or rear of a customized van, as shown in Figure 1. The mounting system allows the antennas to slide and lock in place so that they can be positioned at any lateral location along the roadway. The antennas are normally positioned along the inside and outside wheel paths in the front of the van.
Performance and operational aspects of the FDOT GPR system was reviewed to ensure that the capabilities of the FDOT system are fully utilized and the limitations are completely understood during the course of this study. As part of this task, GPR data was collected with the FDOT system at two locations. The first set of data was collected at the FDOT test track located at the SMO facility in Gainesville, while the second set of information was collected on US 441, where radio interference has posed a problem in the past. The following parameters and issues were considered in this evaluation.
Popik, Maser, Holzschuher Page 4
Figure 1. FDOT GPR System.
Antenna Characteristics Horn antennas are not mass-produced and therefore, each can have its own unique characteristics. The matching of the two FDOT antennas has been evaluated qualitatively by completing a Metal Plate Test. Conclusions drawn from the Metal Plate data is that the antennas are very well matched, and that similar quality results should be expected from each antenna.
Time Range of the GPR Scan (Samples per Scan) Typical time range settings for the 2-GHz antenna for pavement thickness applications, as used by FDOT, are 10-12 ns. Since the surface reflection occurs at 3 ns (due to the 18-inch (457 mm) antenna height above the pavement), 9 ns remain for the subsurface data. Using a typical 2-way AC velocity of 2.5 in/ns (6.3 cm/ns), this provides a maximum depth range of 22 inches (559 mm). As the study was not interested in such an extensive depth range, an experiment was conducted using time range of 6 ns. With a 6 ns range, 3 ns were left for pavement thickness evaluation to an approximate depth of 7.5 in (190 mm). Considering that the application is for quality assurance, we expect lifts of new AC not to exceed about 4 inches (100 mm), which would be in the detectable range for this setting. This conversion from 12 to 6 ns, improved the quality of data (or resolution) collected during the survey.
Furthermore, the use of a shorter time range, 6 ns, allows for two possibilities: a higher density of sample points per nanosecond of data using the standard FDOT 512 sample rate; or, a higher travel speed and/or data rate using 256 samples per scan. Using the 256 sample rate at 6 ns, time range provides equivalent data density to using 512 samples at a 12 ns, time range. The various sample rates were evaluated using data collected at an FDOT test track. The results of the sample rate analysis found that the 256 samples rate setting introduced some noise into the data, and as a result a sample rate of 512 samples per scan was selected for use in this study.
Data Rate (Scans per Set Distance) On typical project-level GPR pavement thickness evaluations, the FDOT utilize data collection rates not exceeding 1 scan per foot (305 mm). However, for the quality assurance purposes of this study, more precise data is required for calibration and verification purposes. Also, with potential interference due to ambient radio noise, it was desirable to reduce the noise by stacking (averaging) multiple scans. For these two reasons, an evaluation was completed to determine the optimum data rate, at a desired survey speed.
Popik, Maser, Holzschuher Page 5
With a selected travel speed not to exceed 10 mph (16.1 kph), a data rate of four scans per foot (305 mm) was found to provide the best results for this study.
Sensitivity to Ambient Noise Previous experience with the FDOT 2-GHz horn antenna system indicated that the system was sensitive to ambient radio noise, to the point that might render it ineffective in high radio noise areas. To quantify this sensitivity, stationary measurements were made on State Highway 441 in the vicinity of a radio tower. The sensitivity was quantified by looking at the coefficient of variation (COV) for measurements taken over a period of 10 seconds, while collecting 78 scans per second. The COV was calculated two ways, once using density calculated from the raw data points (one measurement per scan) and once using a 10-point moving average.
The COV of the raw density points is at the radio tower location was measured at 12.1%, while the COV for the averaged data is was 5.9%. Corresponding values of 3.5% and 2.2% respectively were measured at the SMO test track. While the averaging significantly reduces the noise-related error, the test indicates that the error level in these high-noise areas might be too high for effective evaluation of density variations. Since these high noise levels occur occasionally, it was recommended that for the density QA application, FDOT conduct a noise sensitivity test at each site prior to proceeding with the GPR data collection. If the COV exceeds a prescribed threshold of 10 percent, then the noise levels would be determined to be excessive and data collection should be aborted.
It is understood that since the initiation of this project, the antenna manufacturer have developed and begun supplying a filtered version of the 2-GHz horn antenna that is significantly less sensitive to ambient radio noise. Thus it is anticipated that ambient noise will be less of an issue in future applications.
INDENTIFY PROMISING TECHNIQUES As part of this study the research team was also tasked with identifying new technologies that would aid in collecting and analyzing the data. One technology implemented in this project was the automated processing of the GPR data in the field to produce color-coded maps of asphalt surface dielectric. Since the surface dielectric is proportional to the density, these on-site maps provide a means for rapidly locating cores at high, low, and average density values for correlation and confirmation. The software was tested and revised to ensure harmonization of the results generated from the two antennas, so that the results from either antenna over the same area of pavement were identical.
A part of the implementation of the automated processing is the identification of the start and end of the surveyed section in each collected data file. This identification was implemented in the field using a laser trigger system that automatically placed a mark within the GPR data that corresponds to reflective markers placed at the survey limits.
The GPR results presented in the following sections were generated using the automated software, and the data collection included the laser trigger.
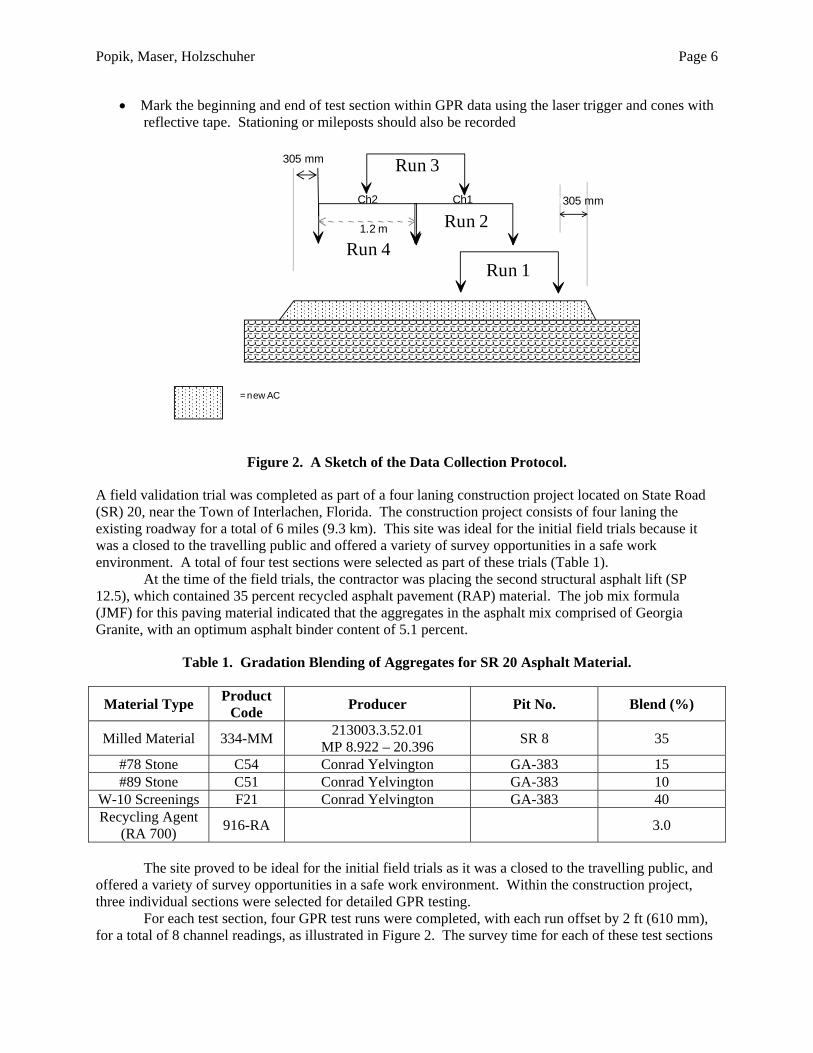
FIELD VALIDATION Based on measurements collected on the test strip and during the GPR evaluation, the research team has developed a preliminary survey protocol for the field validation trials. The proposed survey protocol consists of the following parameters (Figure 2):
• Transverse spacing: 2 feet (610 mm) • Longitudinal spacing: four scans per foot (305 mm) • Time range: 6 ns • Sample rate: 512 samples per scan • Travel speed: No greater than 10 mph (16.1 kph)
Popik, Maser, Holzschuher Page 6
• Mark the beginning and end of test section within GPR data using the laser trigger and cones with reflective tape. Stationing or mileposts should also be recorded
Run 41.2 m
= new AC
305 mm
305 mm Run 3
Run 2
Run 1
Ch2 Ch1
Figure 2. A Sketch of the Data Collection Protocol.
A field validation trial was completed as part of a four laning construction project located on State Road (SR) 20, near the Town of Interlachen, Florida. The construction project consists of four laning the existing roadway for a total of 6 miles (9.3 km). This site was ideal for the initial field trials because it was a closed to the travelling public and offered a variety of survey opportunities in a safe work environment. A total of four test sections were selected as part of these trials (Table 1).
At the time of the field trials, the contractor was placing the second structural asphalt lift (SP 12.5), which contained 35 percent recycled asphalt pavement (RAP) material. The job mix formula (JMF) for this paving material indicated that the aggregates in the asphalt mix comprised of Georgia Granite, with an optimum asphalt binder content of 5.1 percent.
Table 1. Gradation Blending of Aggregates for SR 20 Asphalt Material.
Material Type Product Code Producer Pit No. Blend (%)
Milled Material 334-MM 213003.3.52.01 MP 8.922 – 20.396 SR 8 35
#78 Stone C54 Conrad Yelvington GA-383 15 #89 Stone C51 Conrad Yelvington GA-383 10
The site proved to be ideal for the initial field trials as it was a closed to the travelling public, and
offered a variety of survey opportunities in a safe work environment. Within the construction project, three individual sections were selected for detailed GPR testing.
For each test section, four GPR test runs were completed, with each run offset by 2 ft (610 mm), for a total of 8 channel readings, as illustrated in Figure 2. The survey time for each of these test sections
Popik, Maser, Holzschuher Page 7
(up to 800 ft (243 m) in length) was approximately 20 minutes. Upon completion of the GPR survey, the information was analyzed to select the pavement core locations. In general, six cores were extracted from each section, with two cores taken from areas where lower density was suspected, two core locations in higher density areas, and two cores in an average density area. Only five cores were extracted from Trial Section 3 (temperature comparison), due to coring equipment problems.
Bulk Specific Gravities (Gmb) were determined in the laboratory for all core samples, and the theoretical maximum Specific Gravity (Gmm) was determined on the two core samples in the average mat density area. The pavement coring and laboratory testing was completed by FDOT State Materials Office (SMO) staff. Laboratory results were compared to the testing completed by the contractor during the paving operation. As the Gmm of the core samples were found to be more variable then those determined during construction, the results of the plant samples were used in calculating the percent Gmm.
A fourth section was selected such that it extended a total of 7,000 ft and shared the same starting location as two of the previously cored sections. This longer section was completed on an asphalt mat placed within the same previous day. The GPR survey for this longer section was completed following the same protocol as the previous sections, using the same vehicle guide setup as in the previous sections.
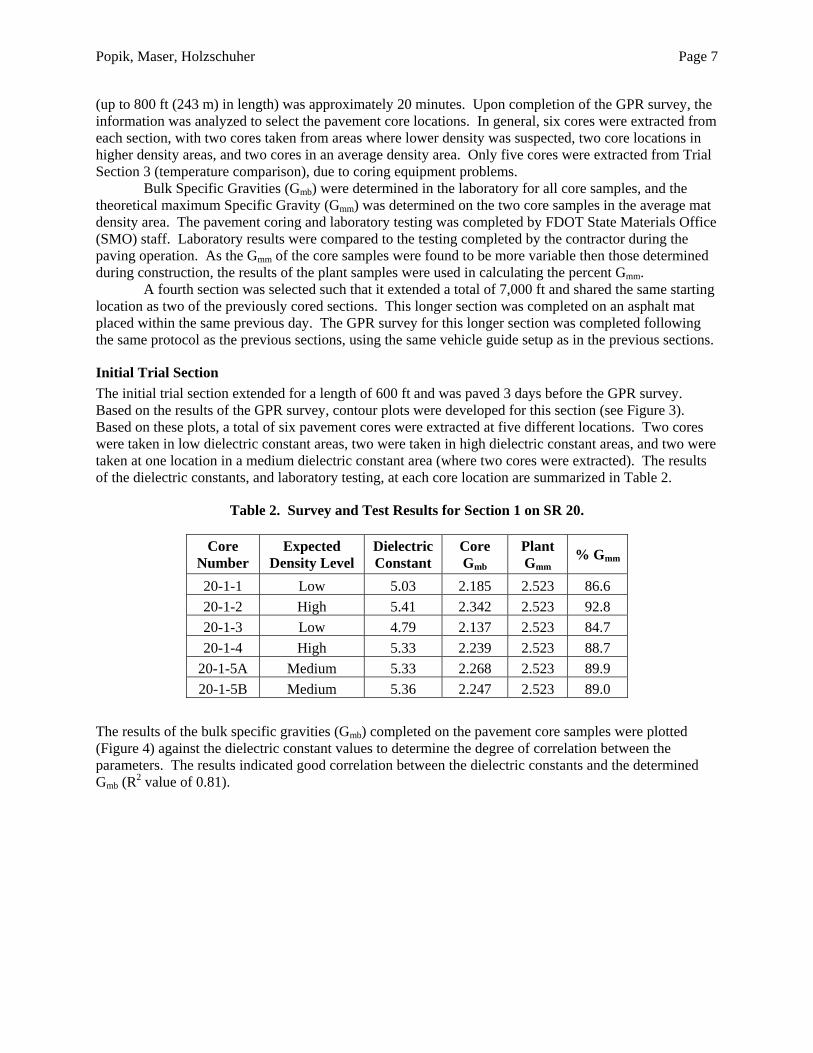
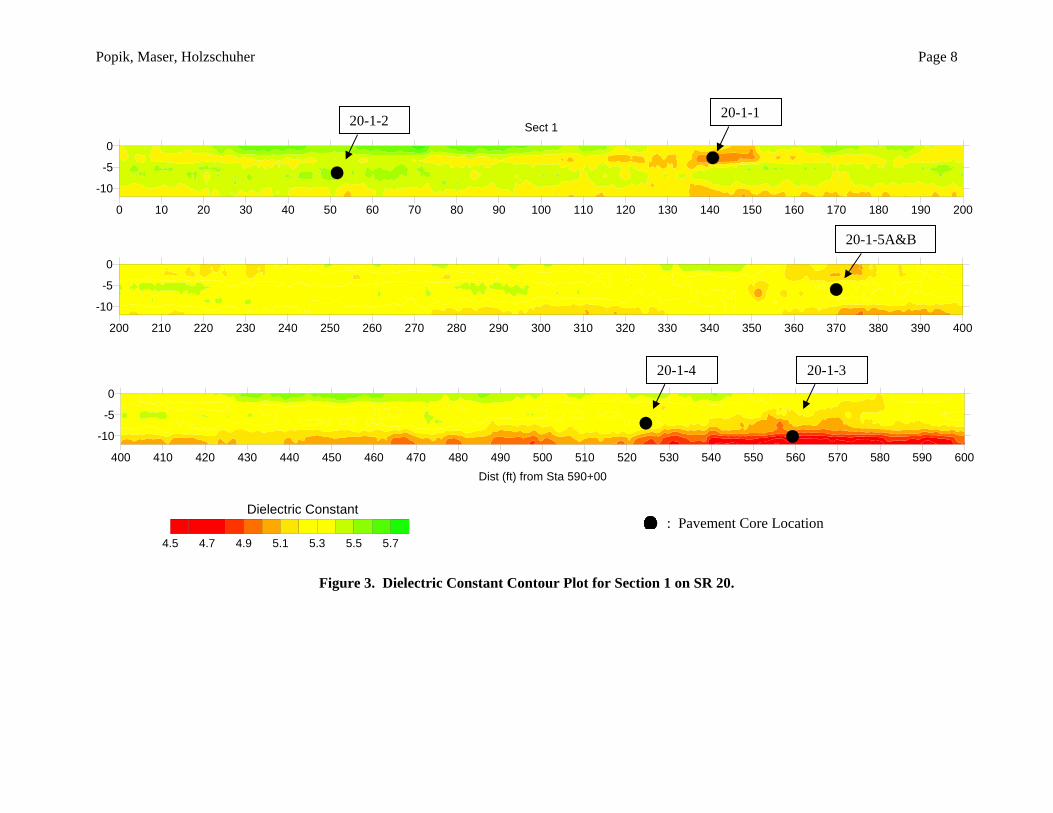
Initial Trial Section The initial trial section extended for a length of 600 ft and was paved 3 days before the GPR survey. Based on the results of the GPR survey, contour plots were developed for this section (see Figure 3). Based on these plots, a total of six pavement cores were extracted at five different locations. Two cores were taken in low dielectric constant areas, two were taken in high dielectric constant areas, and two were taken at one location in a medium dielectric constant area (where two cores were extracted). The results of the dielectric constants, and laboratory testing, at each core location are summarized in Table 2.
Table 2. Survey and Test Results for Section 1 on SR 20.
20-1-5A Medium 5.33 2.268 2.523 89.9 20-1-5B Medium 5.36 2.247 2.523 89.0
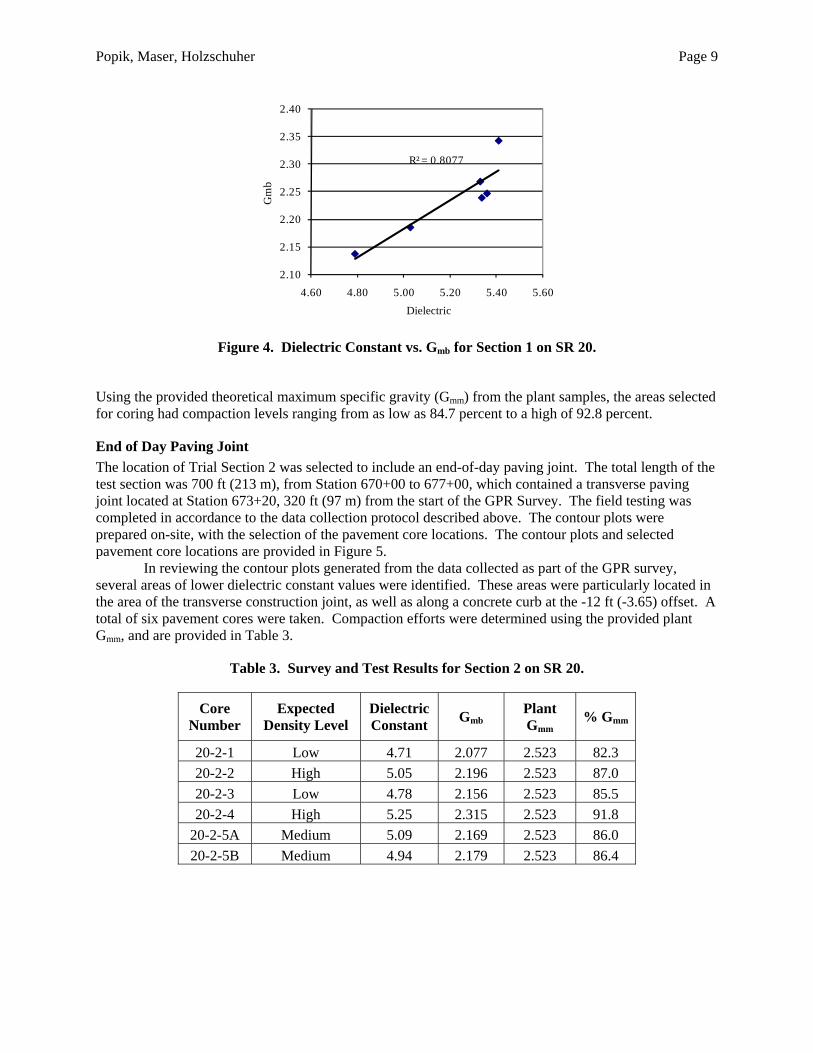
The results of the bulk specific gravities (Gmb) completed on the pavement core samples were plotted (Figure 4) against the dielectric constant values to determine the degree of correlation between the parameters. The results indicated good correlation between the dielectric constants and the determined Gmb (R2 value of 0.81).
Figure 3. Dielectric Constant Contour Plot for Section 1 on SR 20.
4.5 4.7 4.9 5.1 5.3 5.5 5.7
Dielectric Constant: Pavement Core Location
20-1-1 20-1-2
20-1-5A&B
20-1-4 20-1-3
Popik, Maser, Holzschuher Page 9
R² = 0.8077
2.10
2.15
2.20
2.25
2.30
2.35
2.40
4.60 4.80 5.00 5.20 5.40 5.60
Gm
b
Dielectric
Figure 4. Dielectric Constant vs. Gmb for Section 1 on SR 20.
Using the provided theoretical maximum specific gravity (Gmm) from the plant samples, the areas selected for coring had compaction levels ranging from as low as 84.7 percent to a high of 92.8 percent.
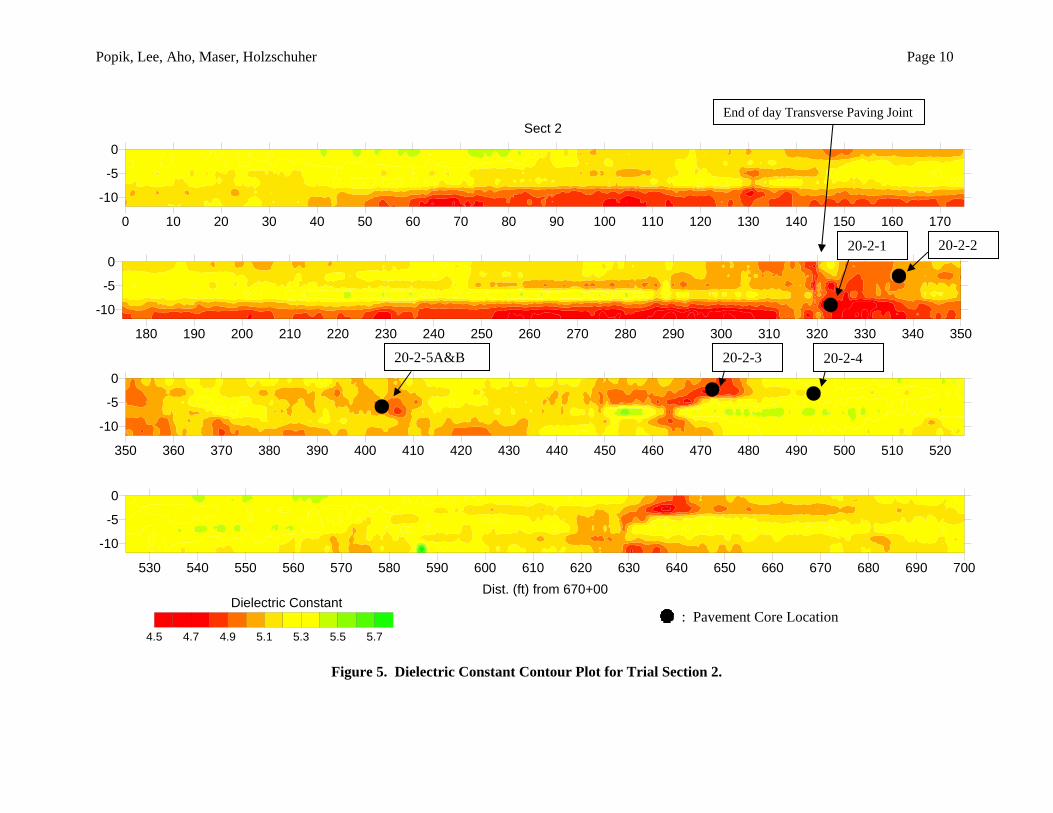
End of Day Paving Joint The location of Trial Section 2 was selected to include an end-of-day paving joint. The total length of the test section was 700 ft (213 m), from Station 670+00 to 677+00, which contained a transverse paving joint located at Station 673+20, 320 ft (97 m) from the start of the GPR Survey. The field testing was completed in accordance to the data collection protocol described above. The contour plots were prepared on-site, with the selection of the pavement core locations. The contour plots and selected pavement core locations are provided in Figure 5.
In reviewing the contour plots generated from the data collected as part of the GPR survey, several areas of lower dielectric constant values were identified. These areas were particularly located in the area of the transverse construction joint, as well as along a concrete curb at the -12 ft (-3.65) offset. A total of six pavement cores were taken. Compaction efforts were determined using the provided plant Gmm, and are provided in Table 3.
Table 3. Survey and Test Results for Section 2 on SR 20.
Figure 5. Dielectric Constant Contour Plot for Trial Section 2.
4.5 4.7 4.9 5.1 5.3 5.5 5.7
Dielectric Constant: Pavement Core Location
20-2-5A&B 20-2-4
20-2-2 20-2-1
20-2-3
End of day Transverse Paving Joint
Popik, Lee, Aho, Maser, Holzschuher Page 11
Correlation plots for Section 2 are provided in Figure 6 and show a fairly good correlation between the dielectric constant values and the corresponding Gmb (R2=0.79). At the pavement coring locations, the AC compaction varied from as low as 82.3 percent to a high of 91.8 percent.
R² = 0.7956
2.05
2.10
2.15
2.20
2.25
2.30
2.35
4.50 4.70 4.90 5.10 5.30 5.50
Gm
b
Dielectric Figure 6. Dielectric Constant vs. Gmb Plot for Section 2 on SR 20.
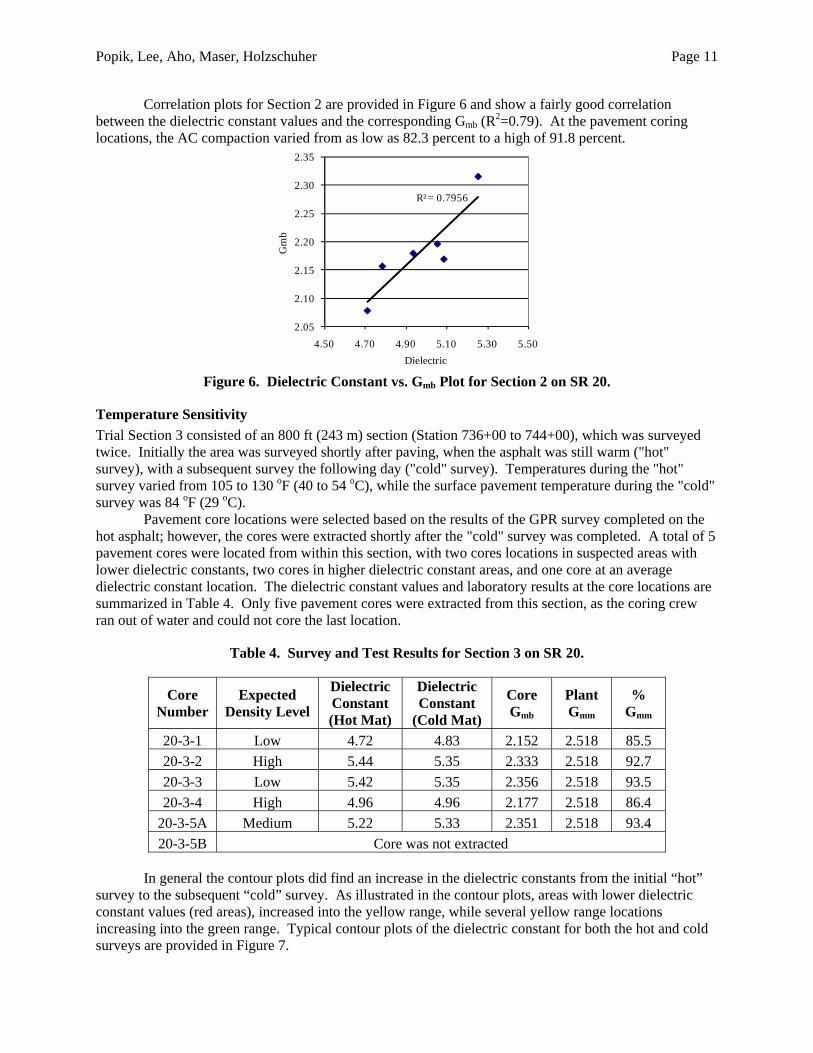
Temperature Sensitivity Trial Section 3 consisted of an 800 ft (243 m) section (Station 736+00 to 744+00), which was surveyed twice. Initially the area was surveyed shortly after paving, when the asphalt was still warm ("hot" survey), with a subsequent survey the following day ("cold" survey). Temperatures during the "hot" survey varied from 105 to 130 oF (40 to 54 oC), while the surface pavement temperature during the "cold" survey was 84 oF (29 oC).
Pavement core locations were selected based on the results of the GPR survey completed on the hot asphalt; however, the cores were extracted shortly after the "cold" survey was completed. A total of 5 pavement cores were located from within this section, with two cores locations in suspected areas with lower dielectric constants, two cores in higher dielectric constant areas, and one core at an average dielectric constant location. The dielectric constant values and laboratory results at the core locations are summarized in Table 4. Only five pavement cores were extracted from this section, as the coring crew ran out of water and could not core the last location.
Table 4. Survey and Test Results for Section 3 on SR 20.
20-3-5A Medium 5.22 5.33 2.351 2.518 93.4 20-3-5B Core was not extracted
In general the contour plots did find an increase in the dielectric constants from the initial “hot”
survey to the subsequent “cold” survey. As illustrated in the contour plots, areas with lower dielectric constant values (red areas), increased into the yellow range, while several yellow range locations increasing into the green range. Typical contour plots of the dielectric constant for both the hot and cold surveys are provided in Figure 7.
Figure 7. Dielectric Constant Contour Plots for Trial Section 3 (600 to 800 ft).
4.5 4.7 4.9 5.1 5.3 5.5 5.7
Dielectric Constant: Pavement Core Location
20-3-3 20-3-4
20-3-5
Popik, Maser, Holzschuher
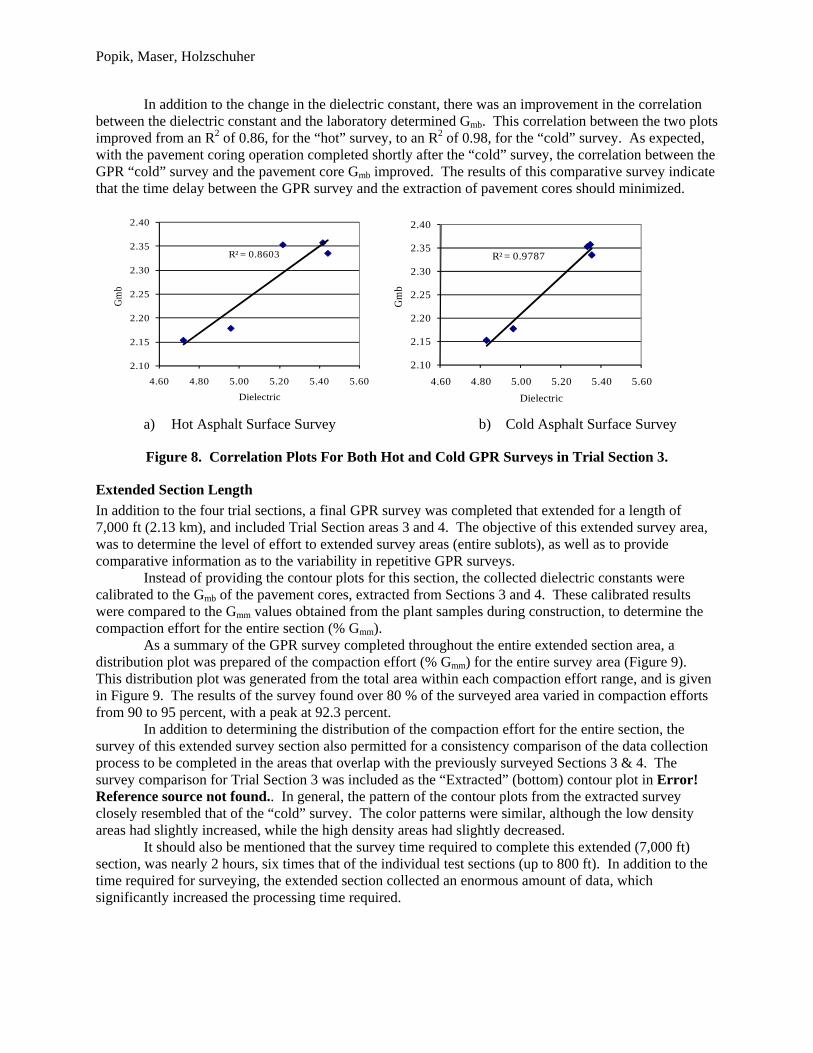
In addition to the change in the dielectric constant, there was an improvement in the correlation between the dielectric constant and the laboratory determined Gmb. This correlation between the two plots improved from an R2 of 0.86, for the “hot” survey, to an R2 of 0.98, for the “cold” survey. As expected, with the pavement coring operation completed shortly after the “cold” survey, the correlation between the GPR “cold” survey and the pavement core Gmb improved. The results of this comparative survey indicate that the time delay between the GPR survey and the extraction of pavement cores should minimized.
a) Hot Asphalt Surface Survey b) Cold Asphalt Surface Survey
Figure 8. Correlation Plots For Both Hot and Cold GPR Surveys in Trial Section 3.
Extended Section Length In addition to the four trial sections, a final GPR survey was completed that extended for a length of 7,000 ft (2.13 km), and included Trial Section areas 3 and 4. The objective of this extended survey area, was to determine the level of effort to extended survey areas (entire sublots), as well as to provide comparative information as to the variability in repetitive GPR surveys.
Instead of providing the contour plots for this section, the collected dielectric constants were calibrated to the Gmb of the pavement cores, extracted from Sections 3 and 4. These calibrated results were compared to the Gmm values obtained from the plant samples during construction, to determine the compaction effort for the entire section (% Gmm).
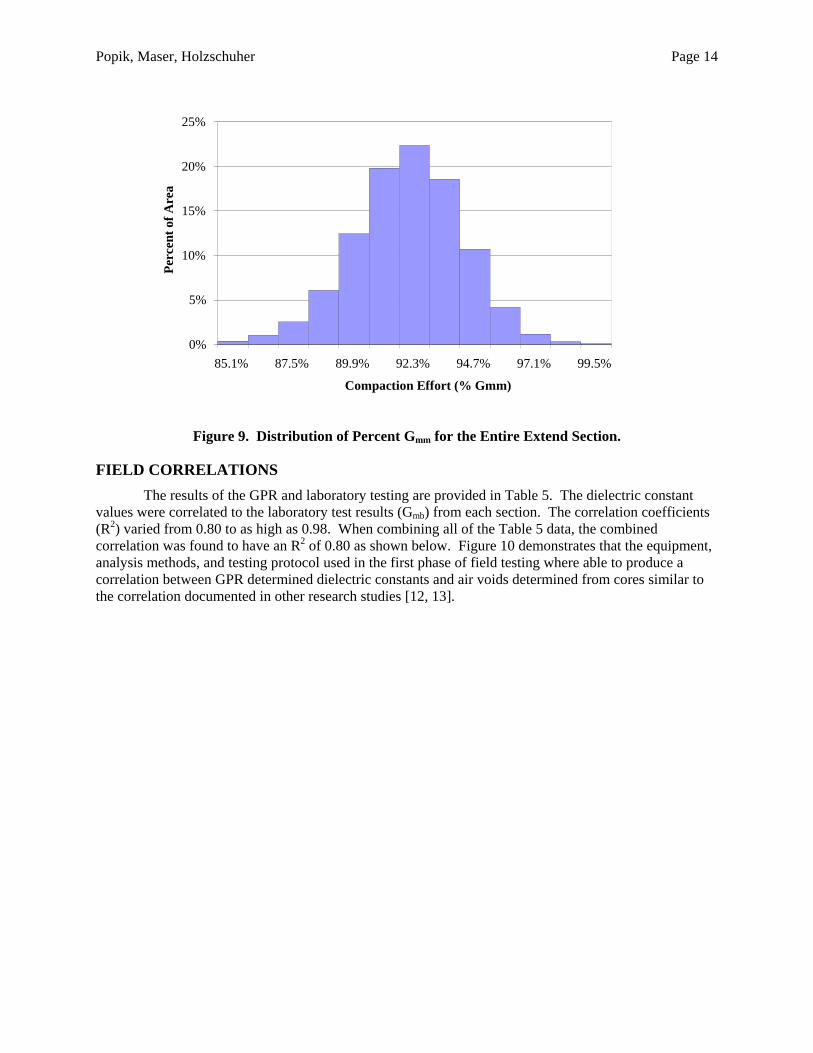
As a summary of the GPR survey completed throughout the entire extended section area, a distribution plot was prepared of the compaction effort (% Gmm) for the entire survey area (Figure 9). This distribution plot was generated from the total area within each compaction effort range, and is given in Figure 9. The results of the survey found over 80 % of the surveyed area varied in compaction efforts from 90 to 95 percent, with a peak at 92.3 percent.
In addition to determining the distribution of the compaction effort for the entire section, the survey of this extended survey section also permitted for a consistency comparison of the data collection process to be completed in the areas that overlap with the previously surveyed Sections 3 & 4. The survey comparison for Trial Section 3 was included as the “Extracted” (bottom) contour plot in Error! Reference source not found.. In general, the pattern of the contour plots from the extracted survey closely resembled that of the “cold” survey. The color patterns were similar, although the low density areas had slightly increased, while the high density areas had slightly decreased.
It should also be mentioned that the survey time required to complete this extended (7,000 ft) section, was nearly 2 hours, six times that of the individual test sections (up to 800 ft). In addition to the time required for surveying, the extended section collected an enormous amount of data, which significantly increased the processing time required.
R² = 0.8603
2.10
2.15
2.20
2.25
2.30
2.35
2.40
4.60 4.80 5.00 5.20 5.40 5.60
Gm
b
Dielectric
R² = 0.9787
2.10
2.15
2.20
2.25
2.30
2.35
2.40
4.60 4.80 5.00 5.20 5.40 5.60G
mb
Dielectric
Popik, Maser, Holzschuher Page 14
0%
5%
10%
15%
20%
25%
85.1% 87.5% 89.9% 92.3% 94.7% 97.1% 99.5%
Compaction Effort (% Gmm)
Perc
ent o
f Are
a
Figure 9. Distribution of Percent Gmm for the Entire Extend Section.
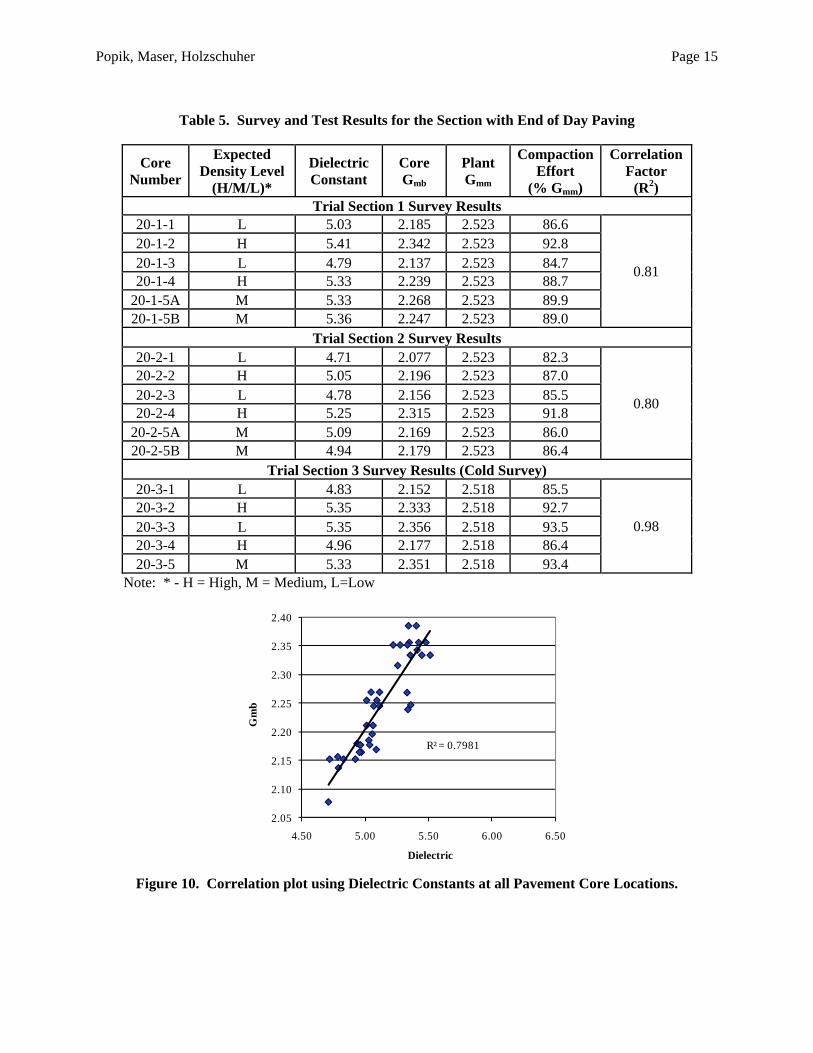
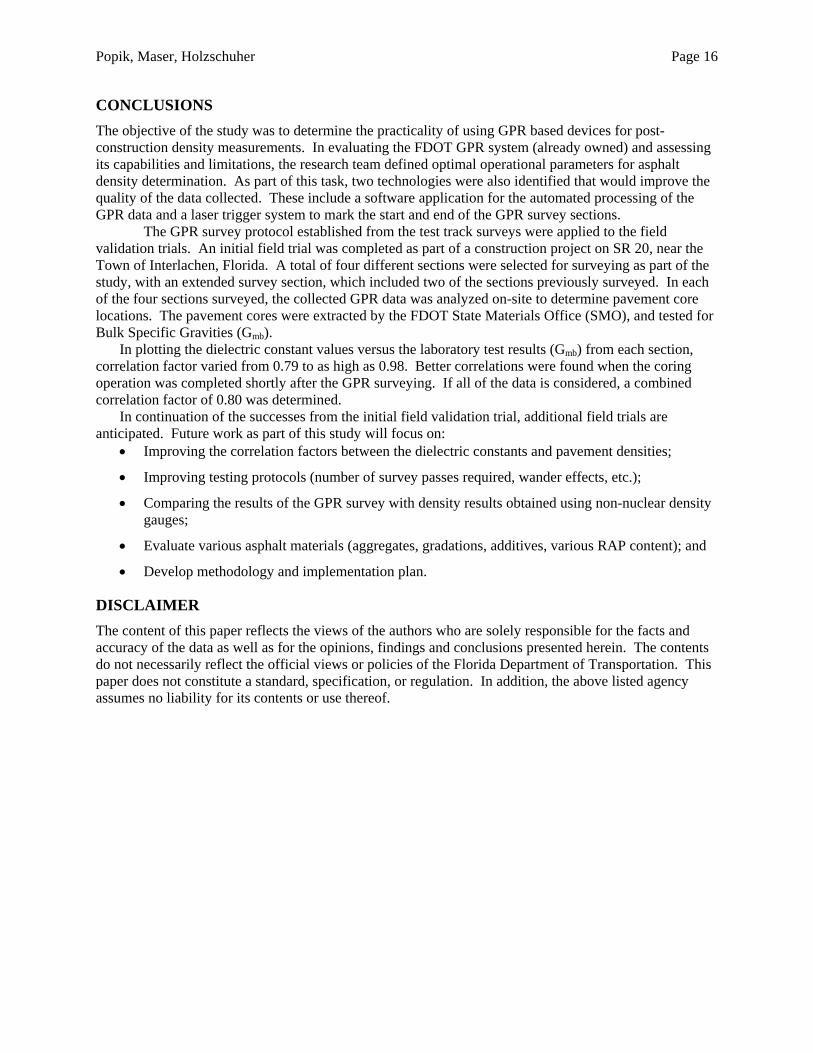
FIELD CORRELATIONS The results of the GPR and laboratory testing are provided in Table 5. The dielectric constant
values were correlated to the laboratory test results (Gmb) from each section. The correlation coefficients (R2) varied from 0.80 to as high as 0.98. When combining all of the Table 5 data, the combined correlation was found to have an R2 of 0.80 as shown below. Figure 10 demonstrates that the equipment, analysis methods, and testing protocol used in the first phase of field testing where able to produce a correlation between GPR determined dielectric constants and air voids determined from cores similar to the correlation documented in other research studies [12, 13].
Popik, Maser, Holzschuher Page 15
Table 5. Survey and Test Results for the Section with End of Day Paving
Core Number
Expected Density Level
(H/M/L)*
Dielectric Constant
Core Gmb
Plant Gmm
Compaction Effort
(% Gmm)
Correlation Factor
(R2) Trial Section 1 Survey Results
20-1-1 L 5.03 2.185 2.523 86.6
0.81
20-1-2 H 5.41 2.342 2.523 92.8 20-1-3 L 4.79 2.137 2.523 84.7 20-1-4 H 5.33 2.239 2.523 88.7
20-1-5A M 5.33 2.268 2.523 89.9 20-1-5B M 5.36 2.247 2.523 89.0
0.98 20-3-2 H 5.35 2.333 2.518 92.7 20-3-3 L 5.35 2.356 2.518 93.5 20-3-4 H 4.96 2.177 2.518 86.4 20-3-5 M 5.33 2.351 2.518 93.4
Note: * - H = High, M = Medium, L=Low
R² = 0.7981
2.05
2.10
2.15
2.20
2.25
2.30
2.35
2.40
4.50 5.00 5.50 6.00 6.50
Gm
b
Dielectric Figure 10. Correlation plot using Dielectric Constants at all Pavement Core Locations.
Popik, Maser, Holzschuher Page 16
CONCLUSIONS The objective of the study was to determine the practicality of using GPR based devices for post-construction density measurements. In evaluating the FDOT GPR system (already owned) and assessing its capabilities and limitations, the research team defined optimal operational parameters for asphalt density determination. As part of this task, two technologies were also identified that would improve the quality of the data collected. These include a software application for the automated processing of the GPR data and a laser trigger system to mark the start and end of the GPR survey sections.
The GPR survey protocol established from the test track surveys were applied to the field validation trials. An initial field trial was completed as part of a construction project on SR 20, near the Town of Interlachen, Florida. A total of four different sections were selected for surveying as part of the study, with an extended survey section, which included two of the sections previously surveyed. In each of the four sections surveyed, the collected GPR data was analyzed on-site to determine pavement core locations. The pavement cores were extracted by the FDOT State Materials Office (SMO), and tested for Bulk Specific Gravities (Gmb).
In plotting the dielectric constant values versus the laboratory test results (Gmb) from each section, correlation factor varied from 0.79 to as high as 0.98. Better correlations were found when the coring operation was completed shortly after the GPR surveying. If all of the data is considered, a combined correlation factor of 0.80 was determined.
In continuation of the successes from the initial field validation trial, additional field trials are anticipated. Future work as part of this study will focus on:
• Improving the correlation factors between the dielectric constants and pavement densities;
• Comparing the results of the GPR survey with density results obtained using non-nuclear density gauges;
• Evaluate various asphalt materials (aggregates, gradations, additives, various RAP content); and
• Develop methodology and implementation plan.
DISCLAIMER The content of this paper reflects the views of the authors who are solely responsible for the facts and accuracy of the data as well as for the opinions, findings and conclusions presented herein. The contents do not necessarily reflect the official views or policies of the Florida Department of Transportation. This paper does not constitute a standard, specification, or regulation. In addition, the above listed agency assumes no liability for its contents or use thereof.
Popik, Maser, Holzschuher Page 17
REFERENCES 1. Choubane, B., P. B. Upshaw, G. A. Sholar, G. C. Page, J. A. Musselman. Nuclear Density Readings
and Core Densities: A Comparative Study. Research report FL/DOT/SMO/98-418, Florida Department of Transportation, Gainesville, Fl., July, 1998.
2. Upshaw. P. B., B. Choubane, G. A. Sholar. Non-Published Report Comparing Cores to PQI 100 and
Troxler 3430 Gauges. Florida Department of Transportation, Gainesville, Fl., September, 1998. 3. Sholar, G. A., J. A. Musselman, , G. C. Page, P. B. Upshaw. An Evaluation of Field Density
Measuring Device. Research report FL/DOT/SMO/99-437, Florida Department of Transportation, Gainesville, Fl., December 1999.
4. Romero, P. Evaluation of Non-Nuclear Gauges to Measure Density of Hot-Mix Asphalt Pavements.
Pooled Fund Study, Final Report, University of Utah, July 18, 2002. 5. Allen, D.L., Schultz, D.B., Willett, D.A. Evaluation of Non-nuclear Density Gauges. Kentucky
Transportation Center, University of Kentucky, Lexington, Kentucky, 2003. 6. Rogge D.F. Compaction and Measurement of Field Density for Oregon Open-Graded (F-mix)
Asphalt Pavement. Final Report, Oregon State University, Corvallis, Oregon, 1999. 7. Sully-Miller Contracting Company. A Summary of Operational Differences Between Nuclear and
Non-nuclear Density Measuring Instruments. TransTech Systems, Inc., 2000. 8. Henault, J.W. Field Evaluation of a Non-nuclear Density Pavement Quality Indicator. Report No.
2227-F-01-3, Connecticut Department of Transportation, Newington, Connecticut, 2001. 9. Von Quintus, H., Rao, C., Minchen, E., Maser, K. R., Nazarian, S., and Prowell, B. (2006)
Nondestructive Testing Technology for Quality Control and Acceptance of Flexible Pavement Construction. Interim Report, Project 10-65, prepared for the National Cooperative Highway Research Program, National Research Council, Washington, D.C.
10. Saarenketo, T. and Roimela, P. (1998). Ground Penetrating Radar Technique in Asphalt Pavement
Density Quality Control. Proceedings of the 7th International Conference on Ground Penetrating Radar, Lawrence, KS, pp. 461-466, May 27-30, 1998.
11. Sebesta, S. and T. Scullion (2003). Application of Infrared Imaging and Ground-Penetrating Radar
for Detecting Segregation in Hot-Mix Asphalt Overlays. Paper No. 03-3406 Transportation Research Board, 82nd Annual Meeting, January 12-16, 2003, Washington, D.C