39
Using Near-Infrared Light to Image how the Brain Rewires after Injury and Rehabilitation George Alexandrakis Department of Bioengineering University of Texas at Arlington
| Date post: | 14-Dec-2015 |
| Category: |
Documents |
| Upload: | damian-esworthy |
| View: | 214 times |
| Download: | 0 times |
Using Near-Infrared Light to Image how the Brain Rewires after Injury and Rehabilitation
George AlexandrakisDepartment of Bioengineering University of Texas at Arlington
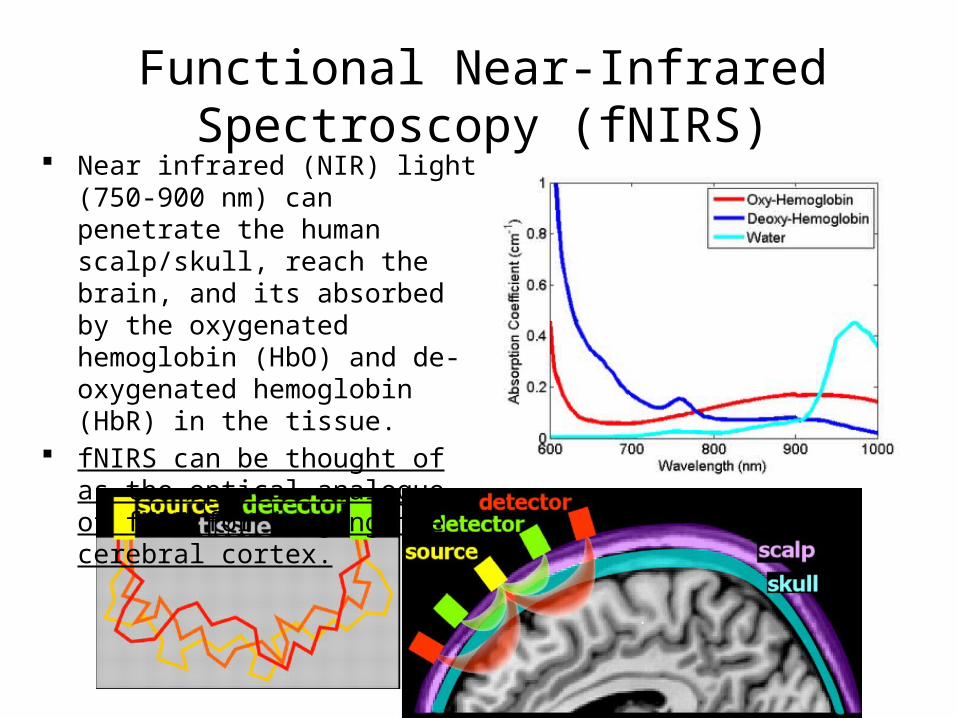
Functional Near-Infrared Spectroscopy (fNIRS)
Near infrared (NIR) light (750-900 nm) can penetrate the human scalp/skull, reach the brain, and its absorbed by the oxygenated hemoglobin (HbO) and de-oxygenated hemoglobin (HbR) in the tissue.
fNIRS can be thought of as the optical analogue of fMRI for imaging the cerebral cortex.

Physiological Basis of the fNIRS Signal: Changes in Brain Oxygenation
• The neuronal firing occurring when the brain does work results into an oversupply of oxygen in areas that doe the work – this is known as neurovascular coupling
• The increase in cerebral blood oxygenation during functional activation is mostly due to an increase in blood flow velocity, and occurs without a significant swelling of the blood vessels.
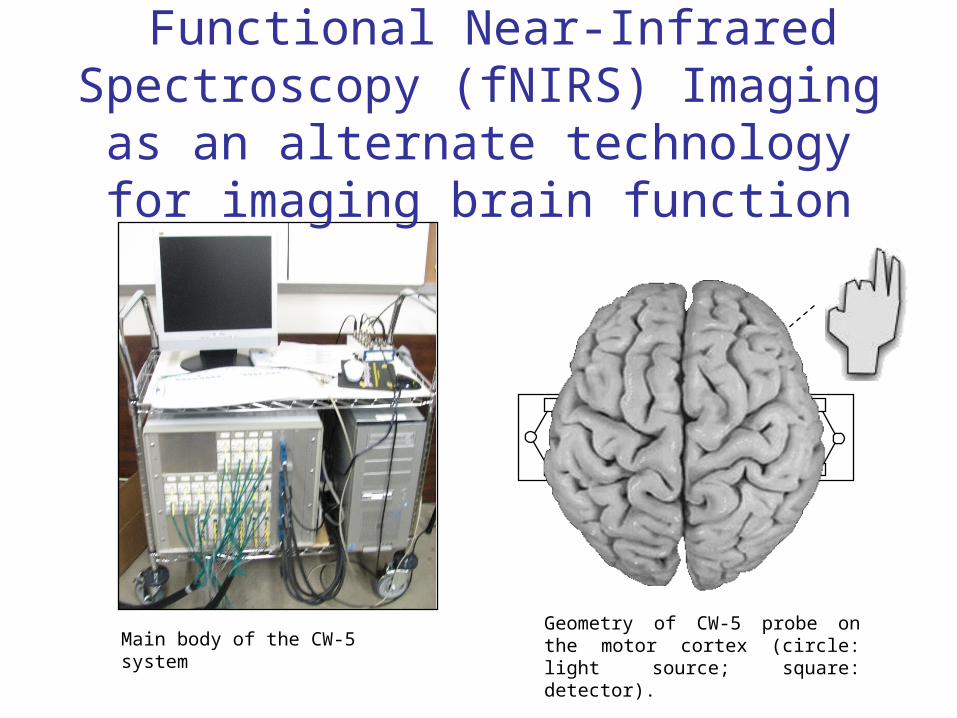
Main body of the CW-5 systemGeometry of CW-5 probe on the motor cortex (circle: light source; square: detector).
Functional Near-Infrared Spectroscopy (fNIRS) Imaging as an alternate
technology for imaging brain function

0 10 20 40seconds
100 200 300 400seconds
What does an fNIRS measurement look like?
Source-detector geometry on head
3030
Full time-series
Average time-series
Tapping
fNIRS Image
∆HbO
∆HbO

Patient with Right HemiparesisRight Finger Tapping
Time series (5sec/frame)
Block average (30 sec)
What do fNIRS images look like?
fMRI
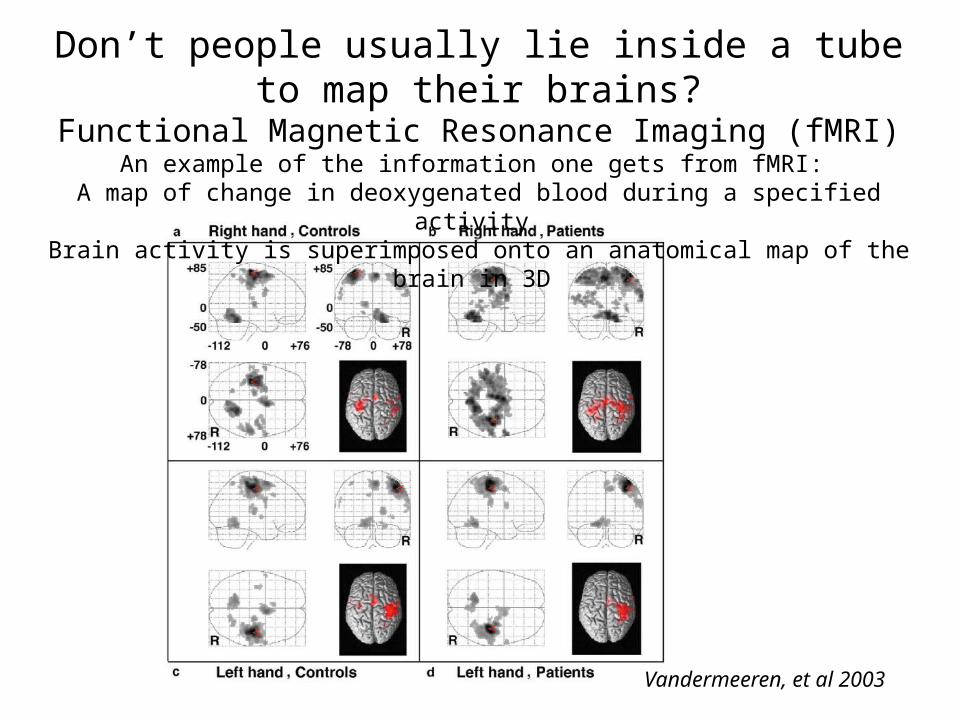
Vandermeeren, et al 2003
Don’t people usually lie inside a tube to map their brains?Functional Magnetic Resonance Imaging (fMRI)
An example of the information one gets from fMRI: A map of change in deoxygenated blood during a specified activity
Brain activity is superimposed onto an anatomical map of the brain in 3D
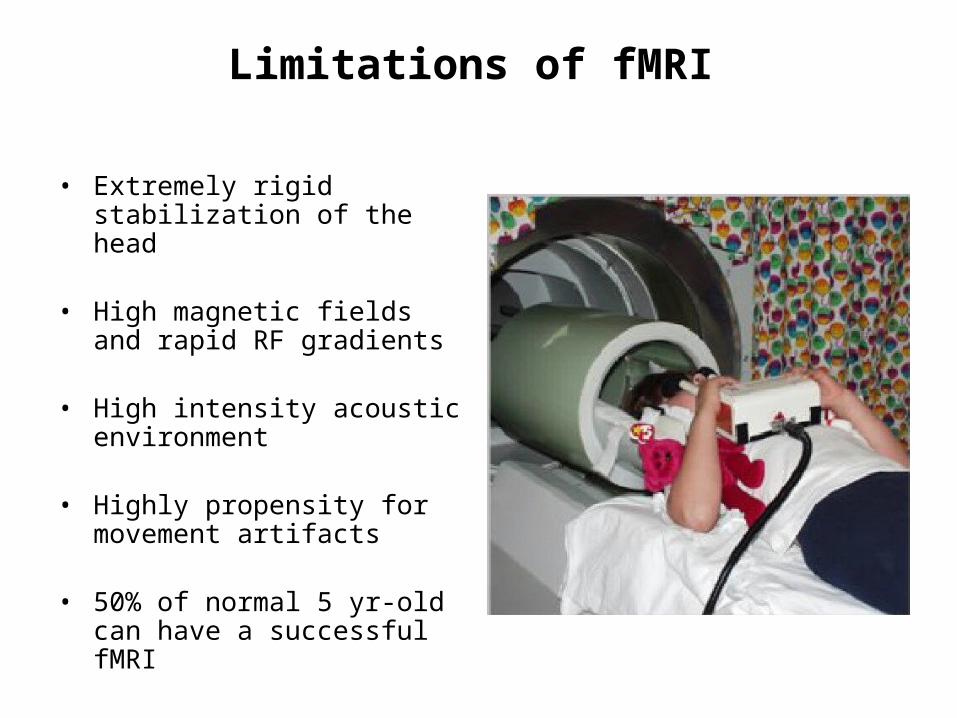
Limitations of fMRI
• Extremely rigid stabilization of the head
• High magnetic fields and rapid RF gradients
• High intensity acoustic environment
• Highly propensity for movement artifacts
• 50% of normal 5 yr-old can have a successful fMRI
Wilke, et al 2003

(b)
O17
O18
O19
O16
O16
X2
X2
X3X4
HbO
x1 x2 x3 x4 x5
o1o2o3o4o5o6o7o8o9 o10 o11 o12 o13 o14
o15 o16 o17 o18 o19 o200 5 10
-6
-4
-2
0HbR
x1 x2 x3 x4 x5
o1o2o3o4o5o6o7o8o9 o10 o11 o12 o13 o14
o15 o16 o17 o18 o19 o200 5 10
-6
-4
-2
0HbT
x1 x2 x3 x4 x5
o1o2o3o4o5o6o7o8o9 o10 o11 o12 o13 o14
o15 o16 o17 o18 o19 o200 5 10
-6
-4
-2
0
-1 0 1 2
x 10-5
-1 0 1 2
x 10-5
-1 0 1 2
x 10-5
(a)
(a) fNIR and (b) fMRI images, showing good spatial correlation during a 15-second finger tapping task. The data were averaged over 10 blocks. Specifically, (a) shows HbO, HbR, and HbT activation maps that are reconstructed from fNIR measurement: x represents sources and o represents detectors; (b) shows axial (left panel), coronal (middle), and sagittal (right) views of fMRI images during finger tapping.
Validation of fNIRS Imaging with fMRI
Limitations: • Can only see the cortical surface of the brain but not deeper• Lower spatial resolution (~1 cm)
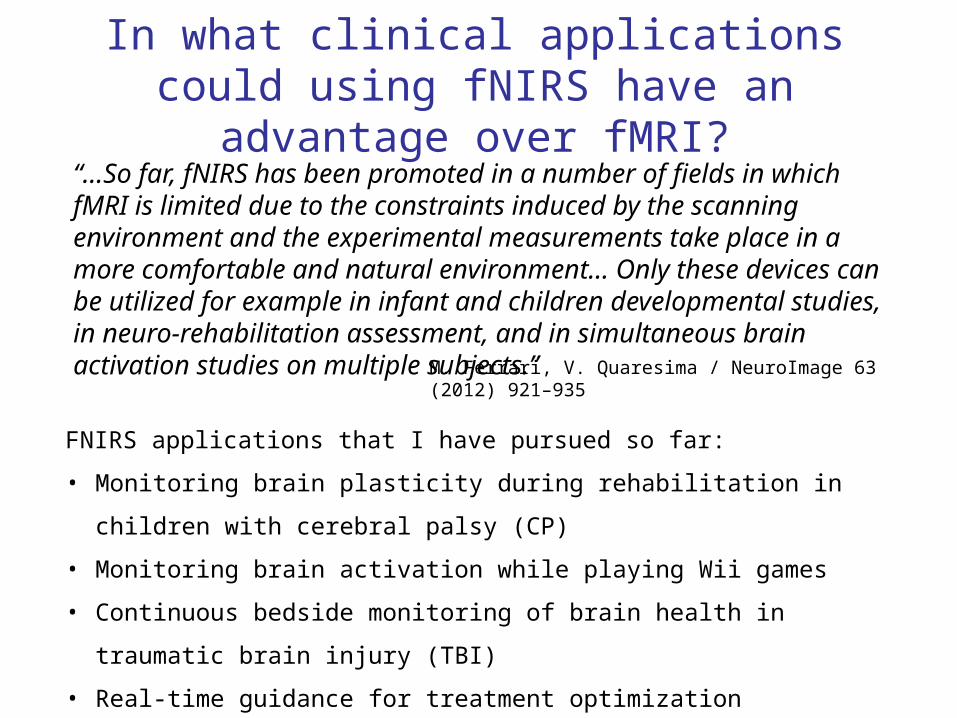
In what clinical applications could using fNIRS have an advantage over fMRI?
“…So far, fNIRS has been promoted in a number of fields in which fMRI is limited due to the constraints induced by the scanning environment and the experimental measurements take place in a more comfortable and natural environment… Only these devices can be utilized for example in infant and children developmental studies, in neuro-rehabilitation assessment, and in simultaneous brain activation studies on multiple subjects.”
M. Ferrari, V. Quaresima / NeuroImage 63 (2012) 921–935
FNIRS applications that I have pursued so far:
• Monitoring brain plasticity during rehabilitation in children with cerebral palsy (CP)
• Monitoring brain activation while playing Wii games
• Continuous bedside monitoring of brain health in traumatic brain injury (TBI)
• Real-time guidance for treatment optimization (electrical stimulation) in stroke

Cerebral Palsy (CP)• What is Cerebral Palsy?
– Lesion or stroke in the cortex or in the subcortex caused before or during birth.
– Results in damage to the motor control areas of the brain which leads to restricted movements.
– Affects 1 in 500 children• Currently Used Functional
Assessments– Physical Assessments
• Measures refined motion• Measures ability to perform daily activities
– EEG measures neuronal activity– fMRI measures hemodynamic activity
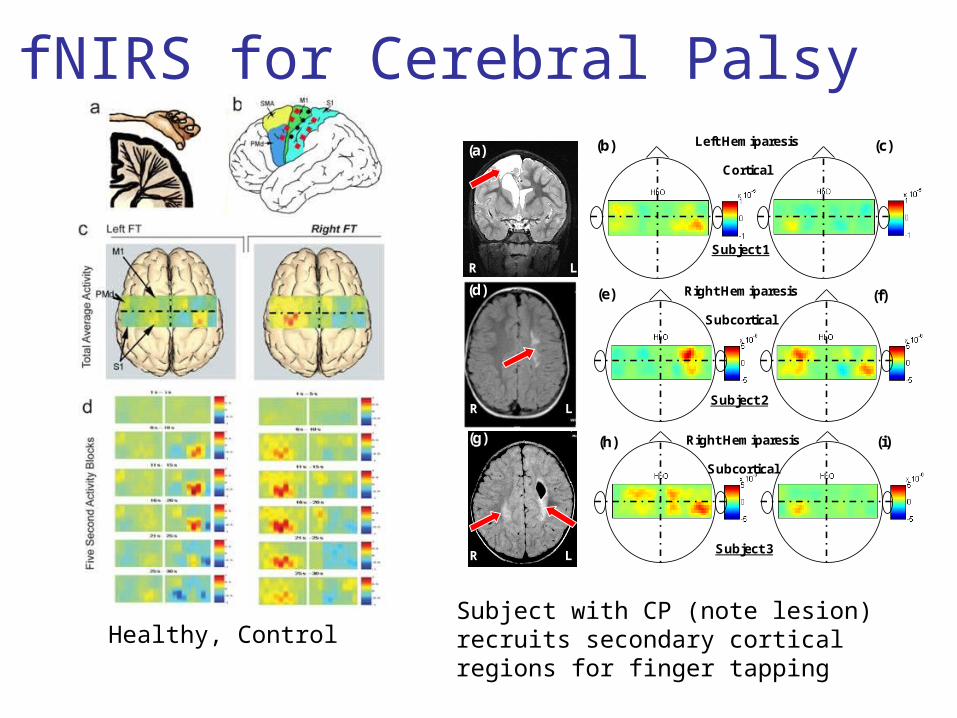
fNIRS for Cerebral Palsy
R L
(a)
Subject 1
(b) (c)Left Hemiparesis
Cortical
R L
(d)
Subject 3
Right Hemiparesis
Subcortical
(h) (i)
Subject 2
(e) (f)Right Hemiparesis
Subcortical
R L
(g)
Healthy, ControlSubject with CP (note lesion) recruits secondary cortical regions for finger tapping
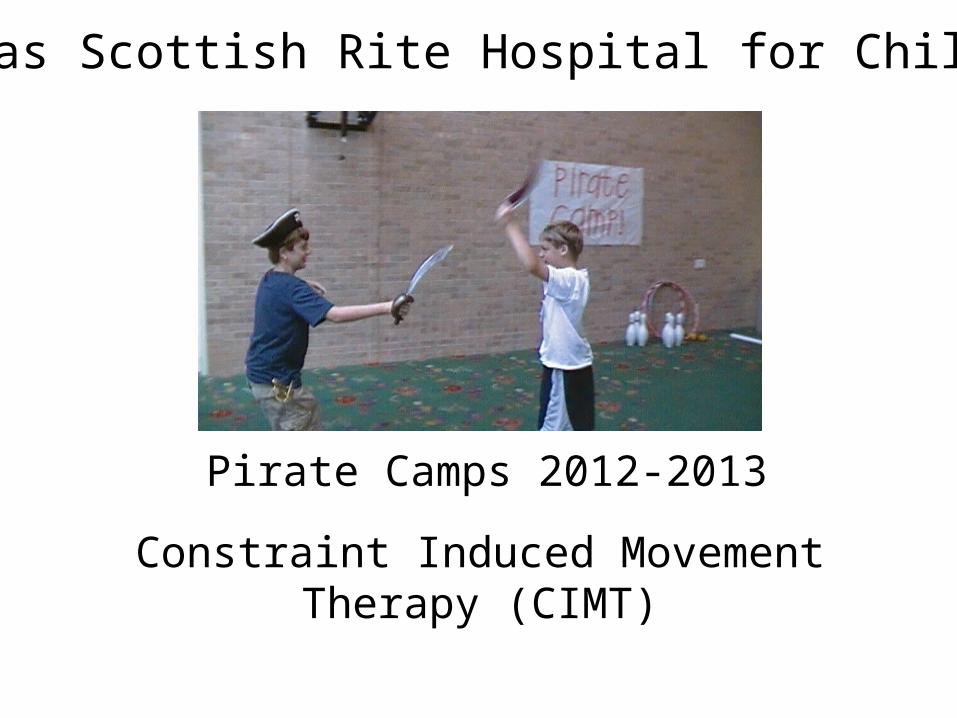
Pirate Camps 2012-2013
Constraint Induced Movement Therapy (CIMT)
Texas Scottish Rite Hospital for Children
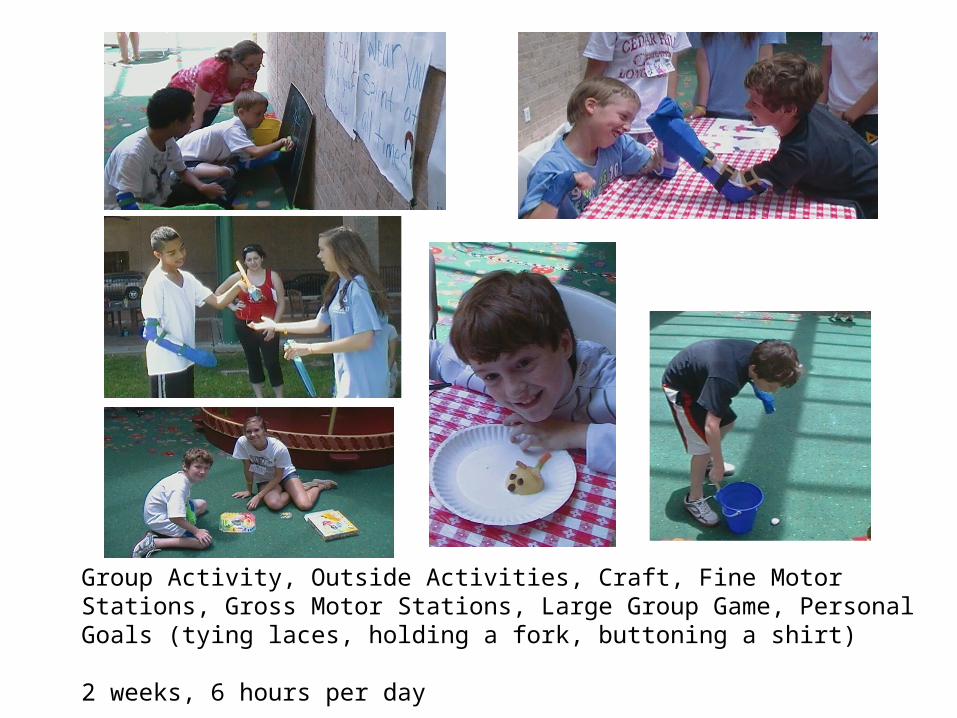
Group Activity, Outside Activities, Craft, Fine Motor Stations, Gross Motor Stations, Large Group Game, Personal Goals (tying laces, holding a fork, buttoning a shirt)
2 weeks, 6 hours per day
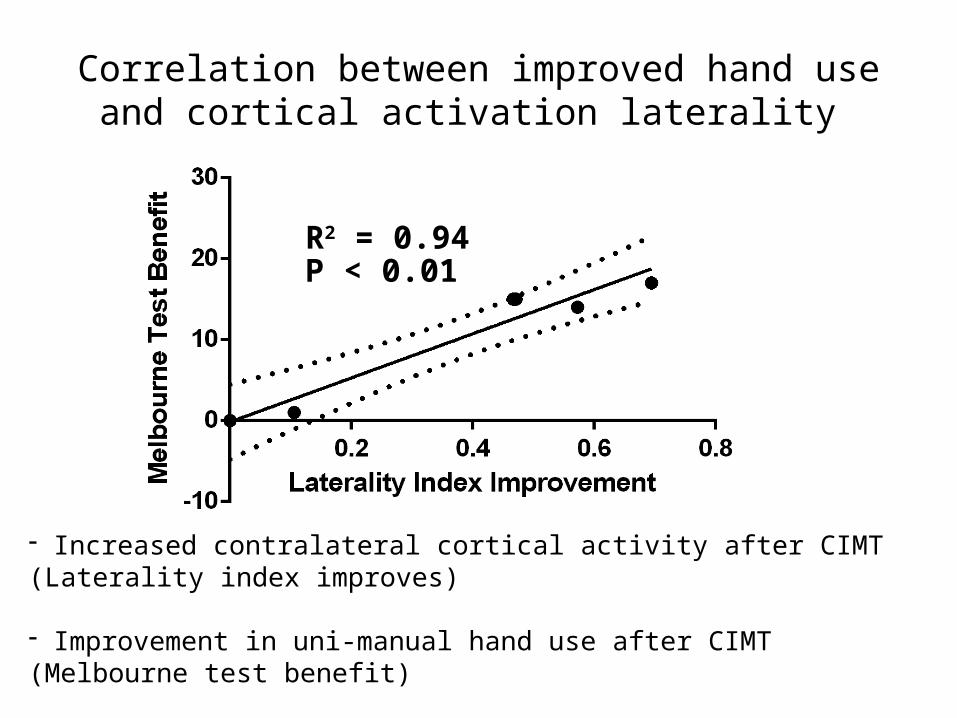
R2 = 0.94P < 0.01
Correlation between improved hand use and cortical activation laterality
- Increased contralateral cortical activity after CIMT (Laterality index improves) - Improvement in uni-manual hand use after CIMT (Melbourne test benefit)
- Increase laterality and hand use significantly correlate (p < 0.01)
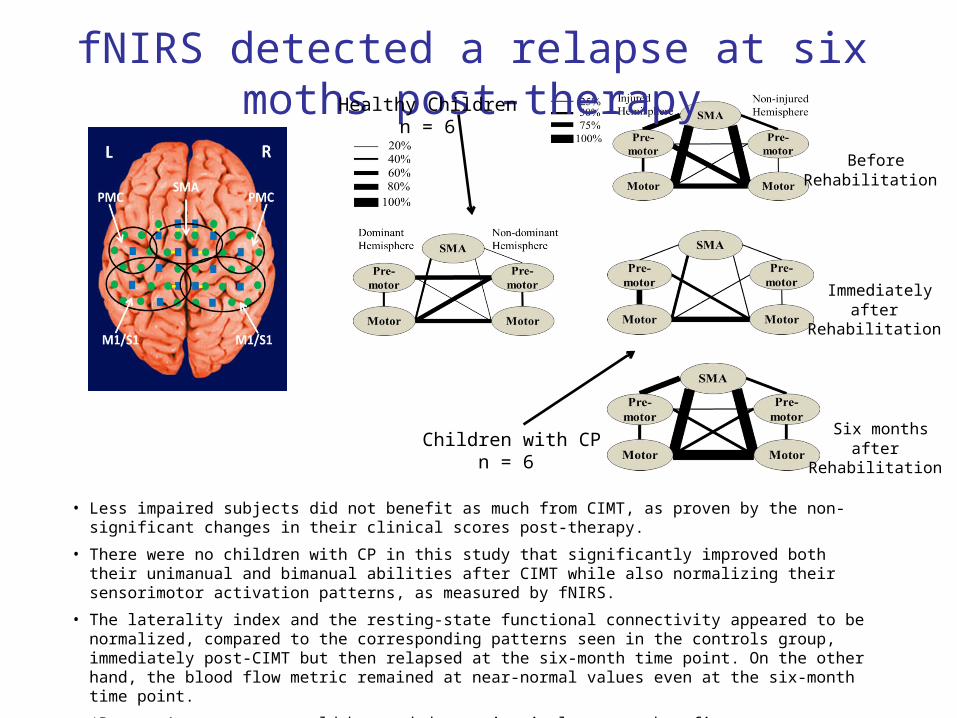
• Less impaired subjects did not benefit as much from CIMT, as proven by the non-significant changes in their clinical scores post-therapy.
• There were no children with CP in this study that significantly improved both their unimanual and bimanual abilities after CIMT while also normalizing their sensorimotor activation patterns, as measured by fNIRS.
• The laterality index and the resting-state functional connectivity appeared to be normalized, compared to the corresponding patterns seen in the controls group, immediately post-CIMT but then relapsed at the six-month time point. On the other hand, the blood flow metric remained at near-normal values even at the six-month time point.
• ‘Booster’ treatments would be needed to maintain long term benefits.
fNIRS detected a relapse at six moths post-therapyHealthy Children
n = 6
Children with CPn = 6
Before Rehabilitation
Immediately after Rehabilitation
Six months after Rehabilitation

Measuring Brain Activity While Playing Nintendo Wii and I-Pad

Probe Configuration
SMA
PMC
M1 M1
S1PPCPPC S1
SMA
PMC
M1 M1
S1
PPCPPC
S1
Right Handed MovementsRL
PMC
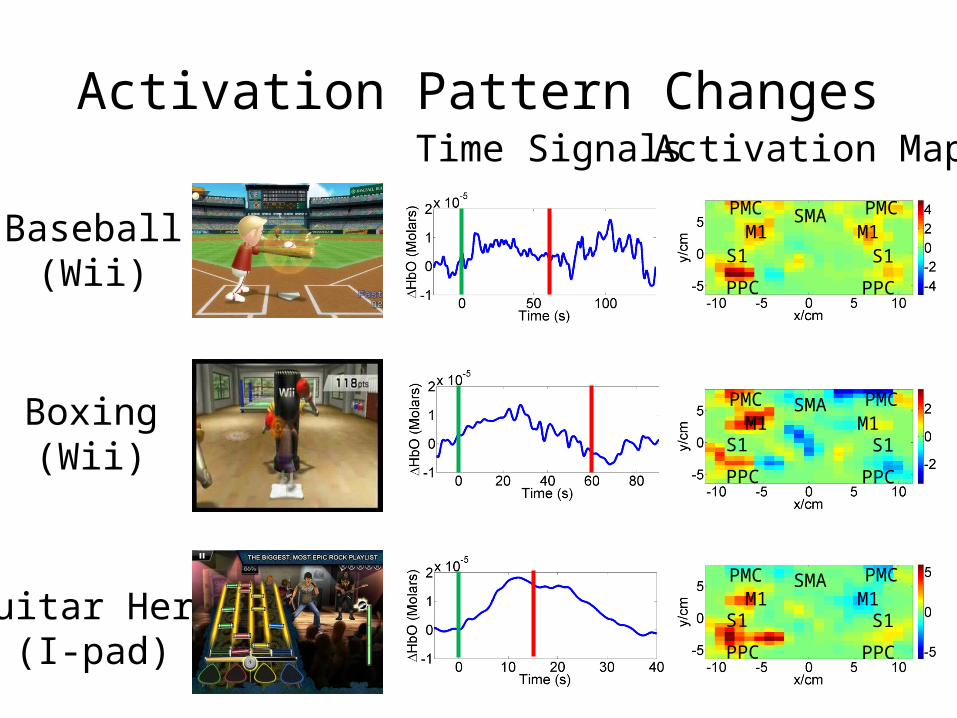
Activation Pattern Changes
Baseball(Wii)
Boxing(Wii)
Guitar Hero(I-pad)
Time Signals Activation MapsP M C
PMCS M A
SMAM 1
M1S 1
S1P P C
PPC
P M C
PMCM 1
M1S 1
S1P P C
PPC
PMC SMAM1
S1
PPC
PMCM1
S1
PPC
PMC SMAM1
S1
PPC
PMCM1
S1
PPC
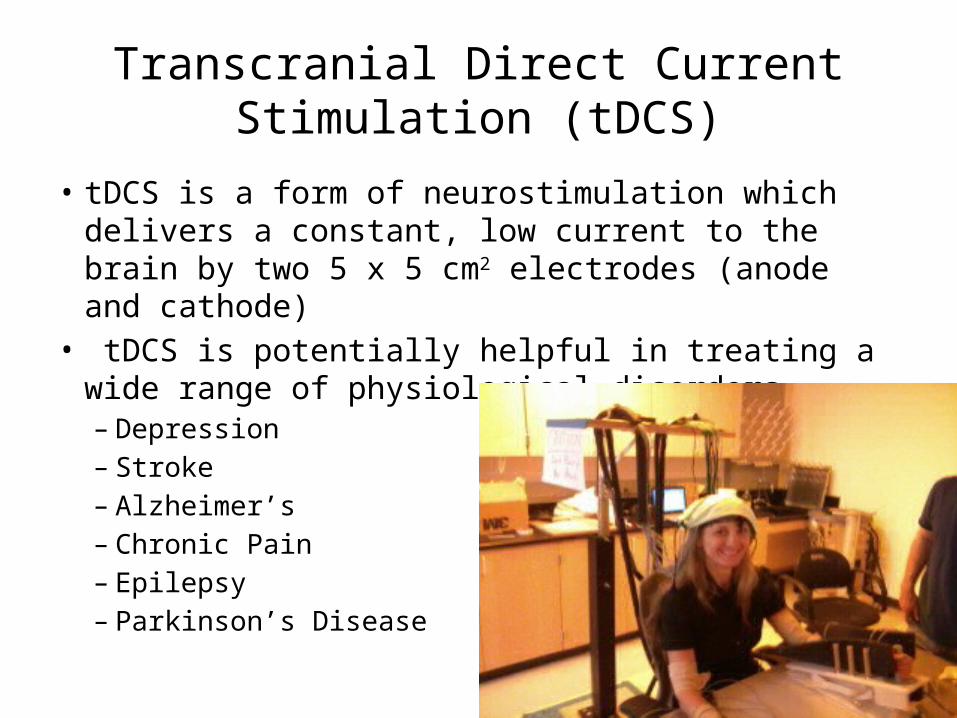
Transcranial Direct Current Stimulation (tDCS)
• tDCS is a form of neurostimulation which delivers a constant, low current to the brain by two 5 x 5 cm2 electrodes (anode and cathode)
• tDCS is potentially helpful in treating a wide range of physiological disorders– Depression– Stroke– Alzheimer’s– Chronic Pain– Epilepsy– Parkinson’s Disease

How Does tDCS Work?
• tDCS stimulation modulates brain function by changing the neuron membrane polarization.
• A change in the membrane polarization leads to changes in neuron, synaptic, and network activity.
• The membrane polarization will either increase or decrease depending on the current direction.
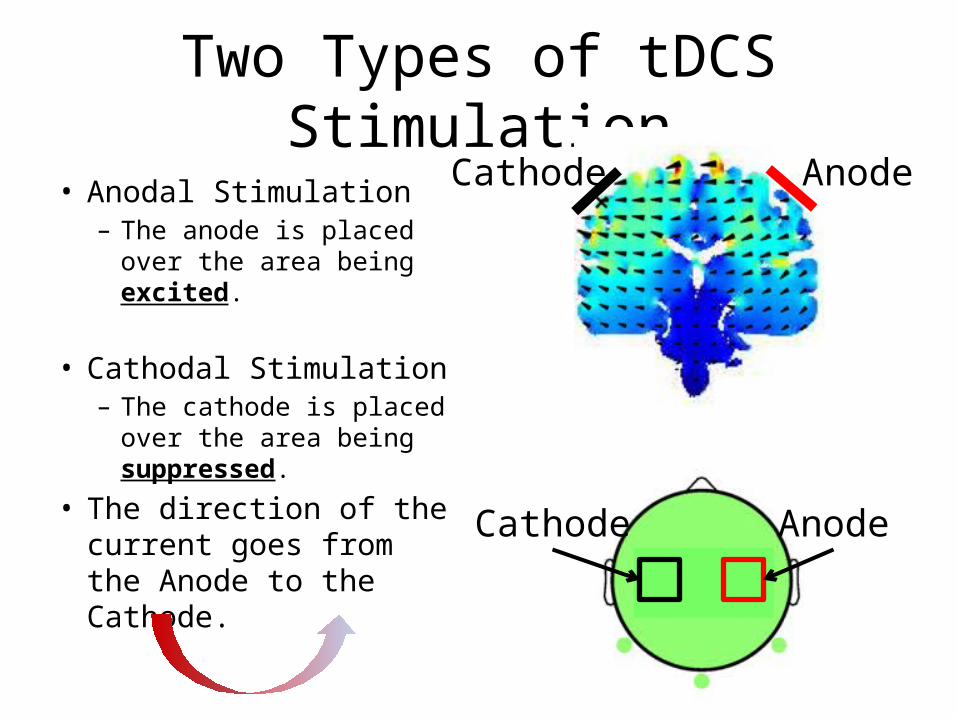
Two Types of tDCS Stimulation
• Anodal Stimulation– The anode is placed over
the area being excited.
• Cathodal Stimulation– The cathode is placed
over the area being suppressed.
• The direction of the current goes from the Anode to the Cathode.
AnodeCathode
AnodeCathode
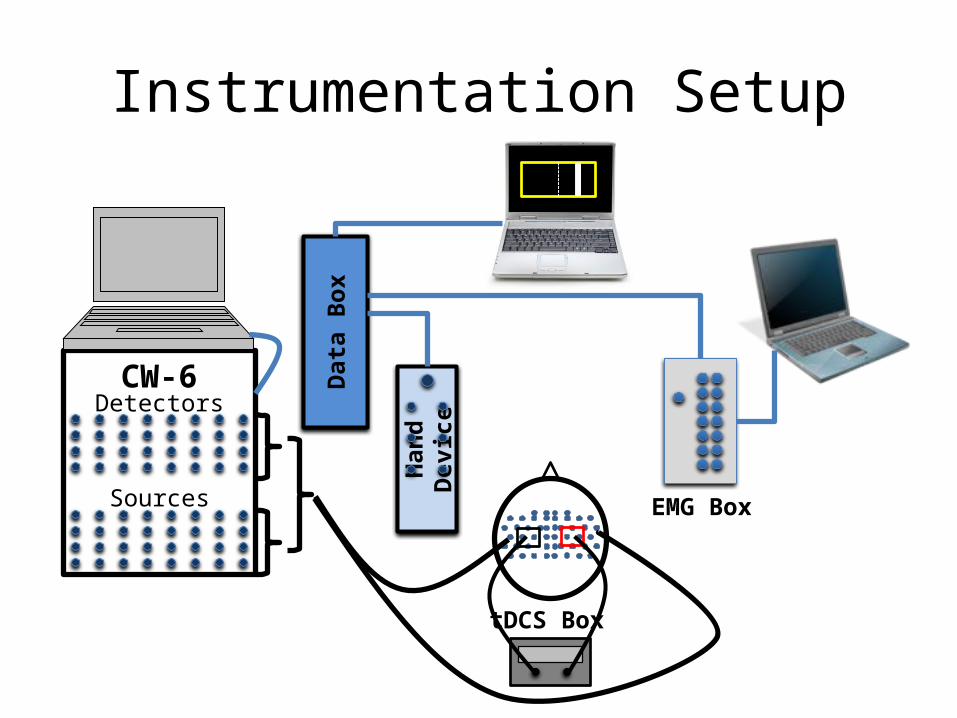
Instrumentation Setup
Han
d D
evic
e
Dat
a Bo
x
Detectors
Sources
CW-6
EMG Box
tDCS Box
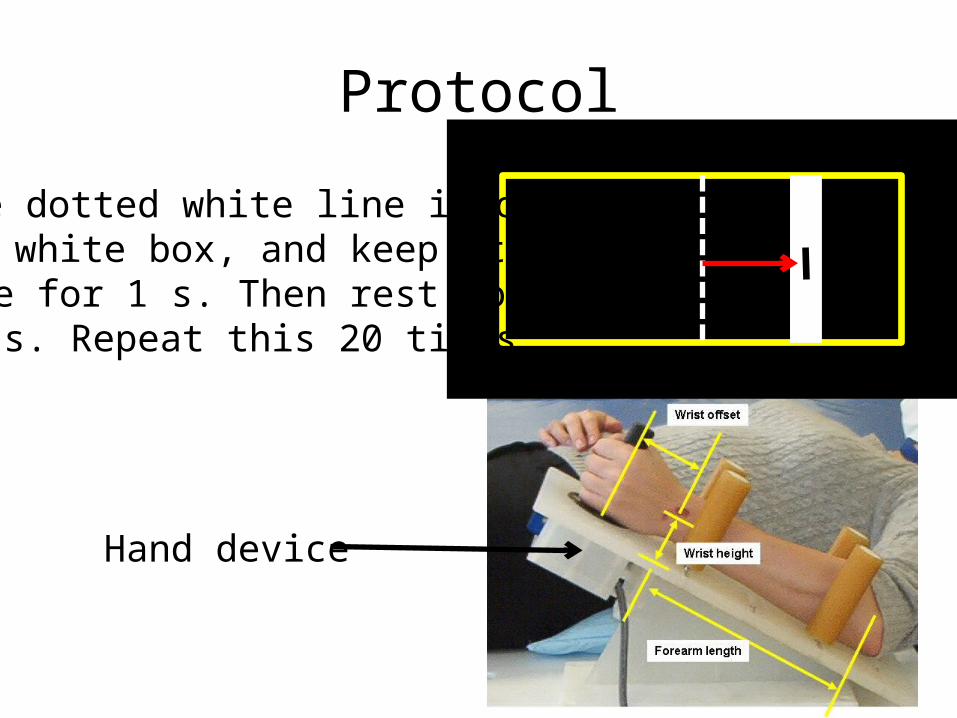
Protocol
Move dotted white line into the white box, and keep it there for 1 s. Then rest for ~12 s. Repeat this 20 times.
Hand device

FNIRS Probe Configuration
SMA
PMC
M1 M1
S1
PPCPPC
S1
RLPMC
tDCS ElectrodefNIRS Source LocationfNIRS Detector Location

Suppression of critical motor control centers creates transient ‘virtual’ brain lesions
Excited
tDCS Anode Electrode
tDCS Cathode Electrode
fNIRS Source Location
fNIRS Detector Location
Indicated ROI
Suppressed SuppressedExcited
Suppressing the cortical region in use, resulted in
activity in both hemispheres.
Exciting the cortical region in use, increased the
activity in that hemisphere
Befo
reD
urin
gAft
er

WE
WF
Suppressed
WE
WF
Excited SuppressedExcited
Changes in arm muscle excitability and wrist flexion performance after tDCS

The perturbation tDCS (ptDCS) concept: A novel, fast method to derive a personalized tDCS electrode arrangement that yields
maximal improvements in upper extremity performance
Typical tDCS protocol uses a current of 1 – 2mA for a period of 20 minutes. Effects can last up to a week.
ptDCS applies current at 0.5 mA for 40 s. This reduced the effects to ~3 minutes.
Schematic of the 20 different electrode montages measured during a ptDCS protocol. Red squares indicate anodal (excitation) and black squares cathodal (suppression) stimulation. All were done in a single ~2 hour session.
ptDCS Protocol

Shortening tDCS Effects
• tDCS applied with current of 0.5 mA for 40 s• ΔHbO returned to pre-tDCS baseline levels within 3 minutes• Allows 20 stimulations to be applied within a 2 hour period.
tDCStDCS +Flexion
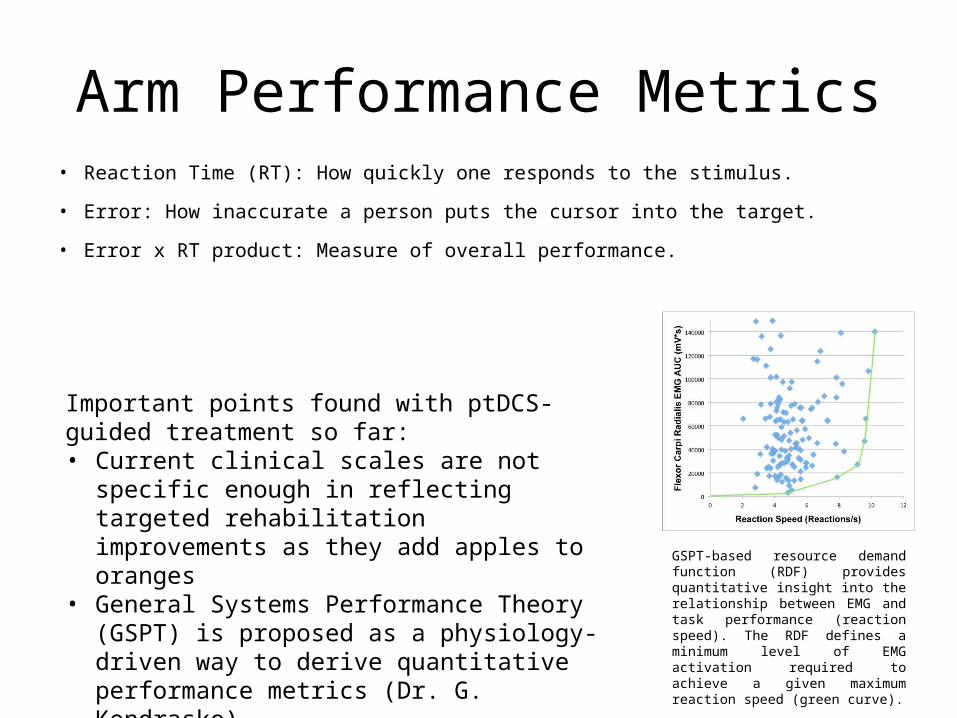
Arm Performance Metrics• Reaction Time (RT): How quickly one responds to the stimulus.
• Error: How inaccurate a person puts the cursor into the target.
• Error x RT product: Measure of overall performance.
GSPT-based resource demand function (RDF) provides quantitative insight into the relationship between EMG and task performance (reaction speed). The RDF defines a minimum level of EMG activation required to achieve a given maximum reaction speed (green curve).
Important points found with ptDCS-guided treatment so far:• Current clinical scales are not specific enough in
reflecting targeted rehabilitation improvements as they add apples to oranges
• General Systems Performance Theory (GSPT) is proposed as a physiology-driven way to derive quantitative performance metrics (Dr. G. Kondraske)

Inter-Subject Variability in Healthy Subjects
The typically studied tDCS montages (A and M) do not help improve any healthy subjects.
Two tDCS montages (C and K) cause 3 healthy subjects to worsen (p < 0.01).
A never before used dual PMC montage (O) presented significant (p < 0.01) improvement in all healthy subjects.
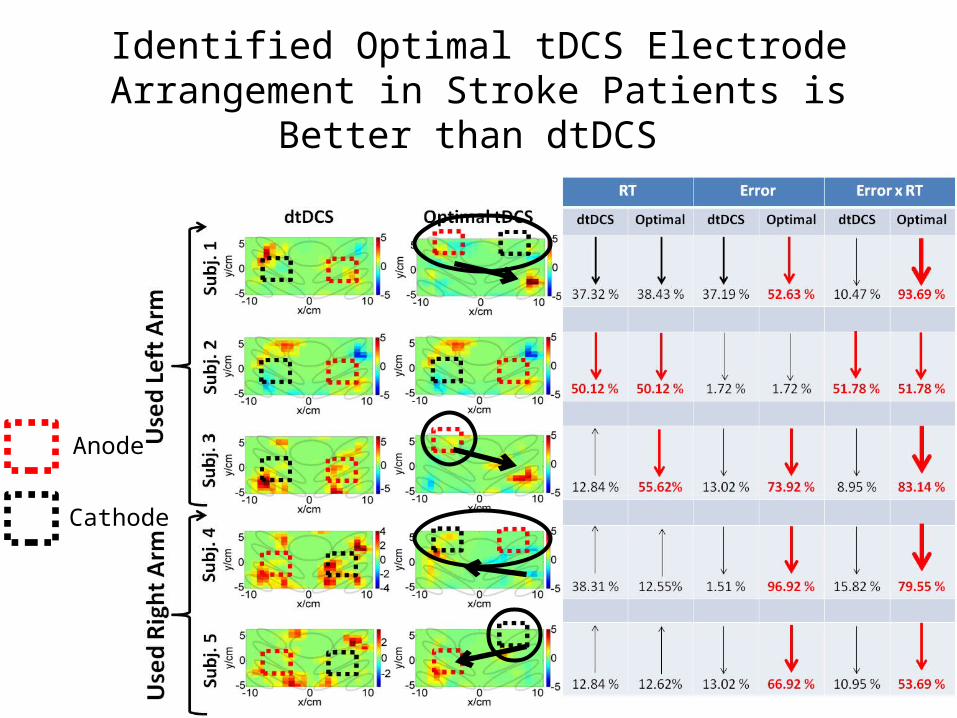
Identified Optimal tDCS Electrode Arrangement in Stroke Patients is Better than dtDCS
Anode
Cathode
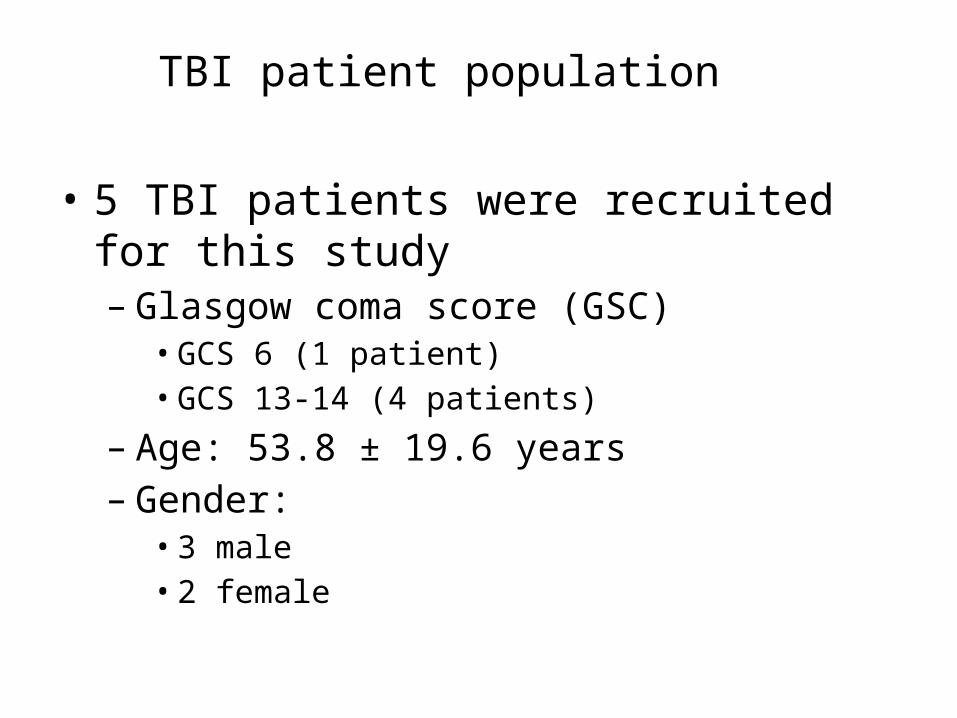
TBI patient population
• 5 TBI patients were recruited for this study– Glasgow coma score (GSC)
• GCS 6 (1 patient)• GCS 13-14 (4 patients)
– Age: 53.8 ± 19.6 years– Gender:
• 3 male• 2 female

Fluctuation amplitudePatient 1 (GCS 14) Patient 4 (GCS 6)Healthy Subject (GCS 15)
Ampl
itude
CT Im
ages
RL RL
Indicate lesions or subdural/subarachnoid hemorrhages

Resting-state connectivity of healthy subjectsHealthy 1 (GCS 15) Healthy 2 (GCS 15)
Com
pone
nt 1
Com
pone
nt 2
Com
pone
nt 4
Com
pone
nt 3
17 %
14 %
19 %
24 %
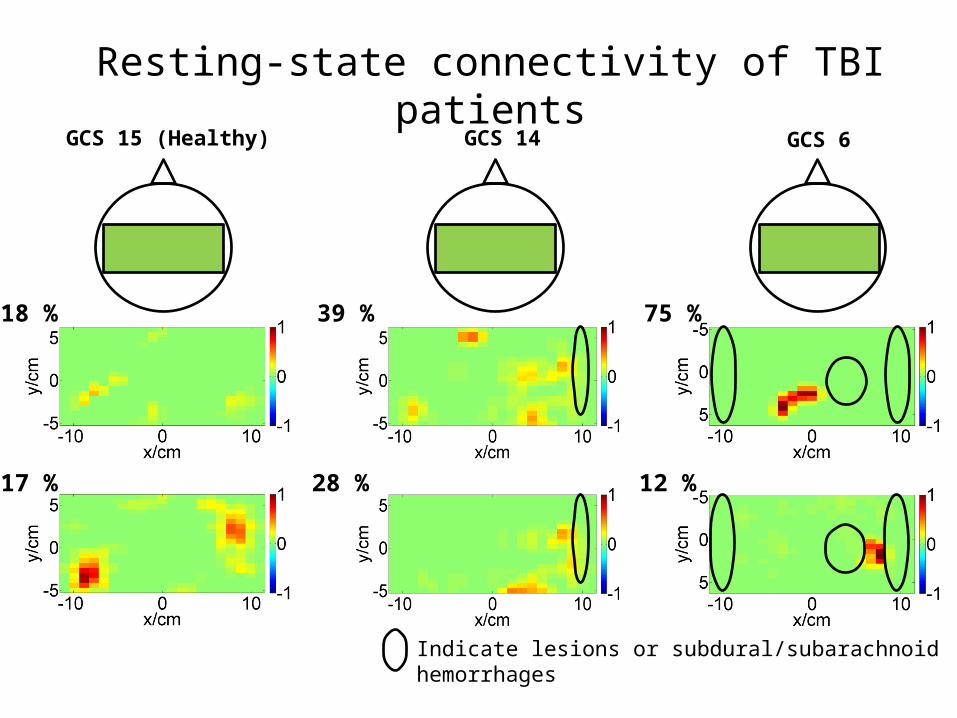
Resting-state connectivity of TBI patientsGCS 15 (Healthy) GCS 6
17 %
18 %
28 %
39 %
12 %
75 %
GCS 14
Indicate lesions or subdural/subarachnoid hemorrhages
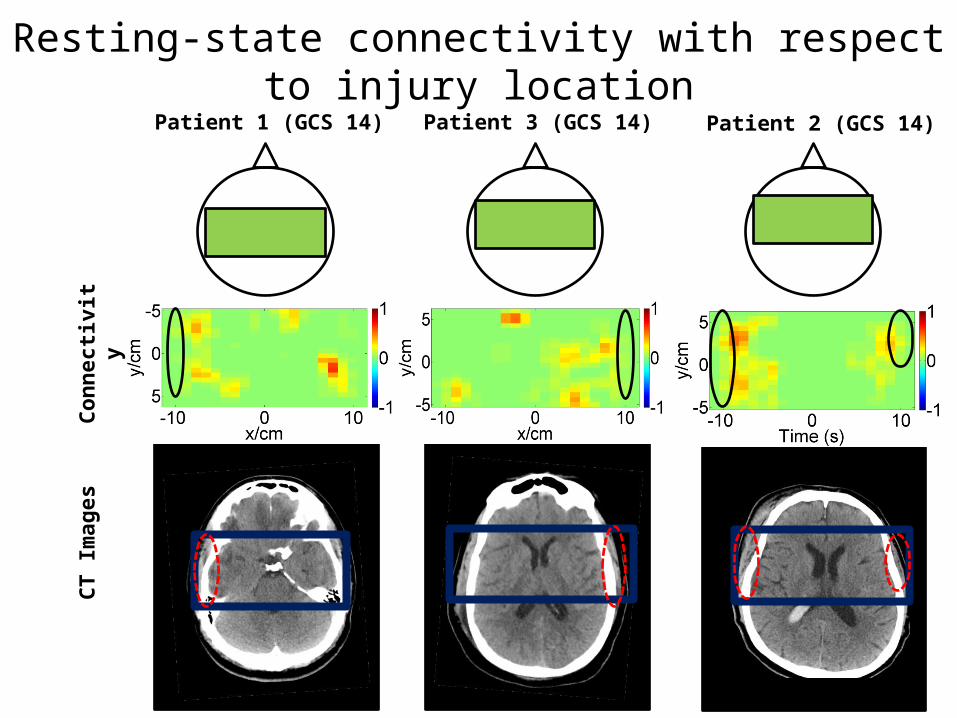
Resting-state connectivity with respect to injury locationPatient 1 (GCS 14) Patient 3 (GCS 14) Patient 2 (GCS 14)
Conn
ectiv
ityCT
Imag
es
GrantsCurrentNIH/NIBIB 1R01EB013313-01 (Alexandrakis), Near Infrared Brain Imaging for Guiding Treatment in Children with Cerebral PalsyUTA – UTD – THR Collaborative Research Program (Alexandrakis), A Near-Infrared Brain Imaging System for the Continual Bedside Monitoring of Hemorrhagic Progression of Contusions after Traumatic Brain Injury
Recently CompletedUT Arlington – UT Dallas & Texas Health Resource Collaborative Research Program (Alexandrakis), A Near-Infrared Brain Imaging System for the Continuous Bedside Monitoring of Intracranial Pressure Buildup in Patients with Traumatic Brain Injury
NSF/CPS 1125441 (Makedon), A Novel Human Centric CPS to Improve Motor/Cognitive Assessment and Enable Adaptive Rehabilitation
UT Arlington – UT Dallas & Texas Health Resource Collaborative Research Program (Alexandrakis), A Breakthrough Probe Technology for Translating Near-Infrared Brain Imaging into a Routine Clinical Tool for Assessing Motor Deficits in Children with Cerebral Palsy
United Cerebral Palsy Research & Educational Foundation (Delgado), Assessment of Neuroplasticity in Children with CP: A Multi-Source-Detector Near Infrared Spectroscopy Imaging Study
CollaboratorsUT ArlingtonDr. Hanli Liu (BME)Dr. Fillia Makedon (CSE)Dr. Fenghua Tian (BME)
UT DallasDr. Duncan MacFarlane (EE)
IndustryDr. Chester Wildey (MRRA Inc)Mr. Robert Francis (Raytheon)
UT Southwestern Medical Center at DallasDr. Timea Hodics (Neurology)Dr. Anne Stowe (Neurology)
Texas Scottish Rite Hospital for ChildrenDr. Mauricio Delgado (Pediatric Neurology)
Current Graduate StudentsMr. Bilal Khan (UT Arlington)Mr. Nathan Hervey (UT Arlington)Mrs. Jianwei Cao (UT Arlington)
Past Graduate StudentsMs. Ankita Chainani (UT Arlington)Ms. Laura Shagman (UT Dallas)

Recent Publications Hodics T*, Khan B*, Hervey N, Stowe A, Kondraske GV, Alexandrakis G. Functional near-infrared spectroscopy
maps cortical plasticity underlying altered motor performance induced by transcranial direct current stimulation. J Biomed Opt. (Accepted October 2, 2013; *equal first authorship).
B. Khan, C. Wildey, R. Francis, F. Tian, M.I. Romero, M.R. Delgado, N.J. Clegg, L. Smith, H. Liu, D.L. MacFarlane, G. Alexandrakis, “Improving optical contact for functional near infrared brain imaging with brush optodes,” Biomed. Opt. Express, 3(5):878–898 (2012).
B. Khan, P. Chand, G. Alexandrakis, “Spatiotemporal relations of primary sensorimotor and secondary motor activation patterns mapped by fNIR imaging,” Biomed. Opt. Express, 2(12):3367–3386 (2011).
F. Tian, M.R. Delgado, S.C. Dhamne, B. Khan, G. Alexandrakis, M.I. Romero, L. Smith, D. Reid, N.J. Clegg, H. Liu, “Quantification of Functional Near Infrared Spectroscopy to Assess Cortical Reorganization in Children with Cerebral Palsy,” Opt. Express 18(25):25973-25986, (2010).
B. Khan, F. Tian, K. Behbehani, M.I. Romero-Ortega, M.R. Delgado, N. Clegg, L. Smith, D. Reid, H. Liu, G. Alexandrakis, “Identification of abnormal motor cortex activation patterns in children with cerebral palsy by functional near infrared spectroscopy,” J. Biomed. Opt. 15(3):036008-1 – 14, (2010).
http://www.sciencecodex.com/the_hair_brush_that_reads_your_mindhttp://news.cnet.com/8301-27083_3-20020193-247.html (High-tech hair brush improves optical brain scans)
Publicity


