250
Using Primavera Project Planner Ver. 3.1 Courseware
| Date post: | 11-Apr-2015 |
| Category: |
Documents |
| Upload: | saran1947into |
| View: | 4,299 times |
| Download: | 1 times |

Using Primavera Project Planner Ver. 3.1 Courseware

Version 1.0, 2004 © All rights reserved. No part of this publication may be reproduced or used in any form or by any means – graphic, electronic or mechanical, including photocopying, mimeographing, recording, taping or in information storage and retrieval systems – without the permission of the author or the publisher. Primavera Project Planner is a trademark of Primavera Systems, Inc. Other trademarks are for their relative owners

Courseware Purpose & Objectives This courseware is for new and novice users of Primavera Project Planner (P3) Ver. 3.1. It covers the beginners and intermediate levels. The courseware demonstrates – in a very simple step-by-step procedure – the building up of project while the Planning phase (before the actual start of the project) listing all the data needed to complete the plan. The last module discusses the Monitoring phase, which takes place after the actual start of the project, and all of its data, and calculation. At the completion of this course, the trainee will be able to:
Differentiate between the project’s phases
Create a new project
Create Activity Codes dictionary, and link them to activities
Input activity list
Input logical Relationships
Run Schedule command and understand the results
Input activity calendars
Create Resource/Cost Account dictionaries, and assign resources and costs to activities
Formatting P3, and creating Layouts
Printing Layouts
Creating Targets
Updating projects

Table of Contents
Module 1 Introduction to Primavera Project Planner Ver. 3.1 What is Primavera Project Planner?………………………………………………………………….. 1-3 How to Start P3?…………………………………………………………………………………....... 1-5 Opening a Project in P3…………….………………………………………………….……………... 1-6 P3 Bar Chart Screen………………………………………………………………………………….. 1-8 P3 PERT Screen……………………………………………………………………………………… 1-9 Method of Working…………………………………………………………………………………... 1-10 Creating a New Project……………………………………………………………………………….. 1-10 Workshop 1…………………………………………………………………………………………... 1-12 Module Review………………………………………………………………………………………. 1-13 Module Review Answers…………………………………………………………………………….. 1-14
Module 2 Classification Using Activity Codes and IDs The Importance of Classification…………………………………………………………………….. 2-3 Before You Start……………………………………………………………………………………… 2-3 Activity Code Command……………………………………………………………………………... 2-5 Activity ID tab in Activity Code……………………………………………………………………... 2-7 Set the Order for Codes and IDs……………………………………………………………………... 2-9 Validate Against Dictionary and Refresh…………………………………………………………….. 2-10 Printing Activity Code Dictionary…………………………………………………………………… 2-11 Transferring Activity Code Dictionary………………………………………………………………. 2-13 Notes………………………………………………………………………………………………….. 2-14 Workshop 2…………………………………………………………………………………………... 2-15 Module Review………………………………………………………………………………………. 2-17 Module Review Answers…………………………………………………………………………….. 2-18
Module 3 Inputting Basic Activity Data What is Activity?................................................................................................................................... 3-3 Activity ID……………………………………………………………………………………………. 3-4 Activity Description………………………………………………………………………………….. 3-4 Activity Original Duration (OD)……………………………………………………………………... 3-5 Activity Type…………………………………………………………………………………………. 3-6 Before You Start……………………………………………………………………………………… 3-8 Adding Activities…………………………………………………………………………………….. 3-9 Deleting Activities……………………………………………………………………………………. 3-10 Editing Activities……………………………………………………………………………………... 3-10 Copying Activities……………………………………………………………………………………. 3-12 Linking Activities with Codes………………………………………………………………………... 3-13 Workshop 3…………………………………………………………………………………………... 3-14 Module Review………………………………………………………………………………………. 3-17 Module Review Answers…………………………………………………………………………….. 3-18

Module 4 Inputting Logic Relationships What is Logic Relationship?.................................................................................................................. 4-3 Predecessor and Successor……………………………………………………………………………. 4-4 Types of Relationships………………………………………………………………………………... 4-5 Relationships with Lag………………………………………………………………………………... 4-7 Examples of Relationships with Lag………………………………………………………………….. 4-8 Inputting Relationships Using Bar Chart View: Step 1………………………………………………. 4-9 Inputting Relationships Using Bar Chart View: Step 2………………………………………………. 4-10 Inputting Relationships Using Bar Chart View: Step 3………………………………………………. 4-13 Inputting Relationships Using PERT View: Step 1, 2, and 3………………………………………… 4-14 Editing Relationships…………………………………………………………………………………. 4-17 Tracing Logic in PERT View…………………………………………………………………………. 4-19 Link and Unlink Activities……………………………………………………………………………. 4-19 Autolink Activities……………………………………………………………………………………. 4-20 Workshop 4…………………………………………………………………………………………… 4-21 Module Review……………………………………………………………………………………….. 4-23 Module Review Answers……………………………………………………………………………... 4-24
Module 5 First Schedule Run Introduction…………………………………………………………………………………………… 5-3 Automatic Schedule vs. Manual Schedule……………………………………………………………. 5-3 The Schedule Passes…………………………………………………………………………………... 5-6 Total Float…………………………………………………………………………………………….. 5-8 Free Float……………………………………………………………………………………………… 5-9 Other Data Checked for While Scheduling…………………………………………………………… 5-9 Schedule Command…………………………………………………………………………………… 5-11 Workshop 5…………………………………………………………………………………………… 5-14 The View after Schedule……………………………………………………………………………… 5-15 Schedule Report………………………………………………………………………………………. 5-16 Notes…………………………………………………………………………………………………... 5-19 Workshop 6…………………………………………………………………………………………… 5-20 Module Review……………………………………………………………………………………….. 5-21 Module Review Answers……………………………………………………………………………... 5-22

Module 6 Inputting Activity Calendar Introduction…………………………………………………………………………………………... 6-3 Global Calendar………………………………………………………………………………………. 6-4 Individual Calendar…………………………………………………………………………………... 6-7 Assigning Individual Calendar to an Activity………………………………………………………... 6-10 Imposing a Finish Date on the Project……………………………………………………………….. 6-10 Other Ways to Define Holidays……………………………………………………………………… 6-12 Printing Calendars……………………………………………………………………………………. 6-13 Transferring Activity Calendar………………………………………………………………………. 6-16 Notes………………………………………………………………………………………………….. 6-18 Workshop 7…………………………………………………………………………………………... 6-19 Module Review………………………………………………………………………………………. 6-21 Module Review Answers…………………………………………………………………………….. 6-22
Module 7 Resources and Cost Assignment Introduction…….…………………………………………………………………………………….. 7-3 How to Create Resource Dictionary?.................................................................................................... 7-4 How to Create Cost Account Dictionary?............................................................................................. 7-7 Workshop 8…………………………………………………………………………………………... 7-11 Assigning Resources and Cost to Activities………………………………………………………….. 7-12 Workshop 9…………………………………………………………………………………………... 7-17 Resource and Cost Profile (Histograms)……………………………………………………………... 7-18 Resource and Cost Tabular Reports………………………………………………………………….. 7-23 Notes………………………………………………………………………………………………….. 7-28 Workshop 10…………………………………………………………………………………………. 7-29 Module Review………………………………………………………………………………………. 7-31 Module Review Answers…………………………………………………………………………….. 7-32
Module 8 Layout and Formatting Options What is Layout in P3?............................................................................................................................ 8-3 Formatting Columns…………………………………………………………………………………... 8-5 Workshop 11………………………………………………………………………………………….. 8-7 Formatting Selected Bars……………………………………………………………………………... 8-8 Workshop 12………………………………………………………………………………………….. 8-10 Global Bar Formatting………………………………………………………………………………... 8-11 Workshop 13………………………………………………………………………………………….. 8-16 Module Review………………………………………………………………………………………. 8-17 Module Review Answers…………………………………………………………………………….. 8-18

Module 9 More Formatting Options Formatting Options…………………………………………………………………………………... 9-3 Timescale Formatting………………………………………………………………………………… 9-4 Sight Lines Formatting……………………………………………………………………………….. 9-6 Screen Colors Formatting…………………………………………………………………………….. 9-8 Fonts Formatting……………………………………………………………………………………... 9-9 Dates Formatting……………………………………………………………………………………... 9-10 Organizing……………………………………………………………………………………………. 9-11 How P3 Calculates the Dates If Totals are Displayed?......................................................................... 9-13 Reorganize Now……………………………………………………………………………………… 9-13 Summarize……………………………………………………………………………………………. 9-14 Filters…………………………………………………………………………………………………. 9-16 Selecting Using Filters……………………………………………………………………………….. 9-19 Workshop 14…………………………………………………………………………………………. 9-20 Module Review………………………………………………………………………………………. 9-23 Module Review Answers…………………………………………………………………………….. 9-24
Module 10 Printing Layouts Introduction….....……………………………………………………………………………………... 10-3 Printer Setup…………………………………………………………………………………………... 10-3 Page Setup…………………………………………………………………………………………….. 10-6 Print Preview………………………………………………………………………………………….. 10-11 Print Command……………………………………………………………………………………….. 10-13 Workshop 15………………………………………………………………………………………….. 10-15 Module Review………………………………………………………………………………………. 10-17 Module Review Answers…………………………………………………………………………….. 10-18
Module 11 Project Updating Before the Actual Start of the Project………………………………………………………………… 11-3 Workshop 16………………………………………………………………………………………….. 11-4 Actual Work Started What Should I Do?............................................................................................... 11-5 Updating Using Progress Spotlight…………………………………………………………………… 11-9 Earned Value………………………………………………………………………………………….. 11-10 Workshop 17………………………………………………………………………………………….. 11-13 Making Backup of Your Project……………………………………………………………………… 11-15 Restoring Your Project………………………………………………………………………………... 11-16 Creating Updating Layouts…………………………………………………………………………… 11-17 Creating Tabular Reports……………………………………………………………………………... 11-18 Workshop 18………………………………………………………………………………………….. 11-25 Module Review………………………………………………………………………………………. 11-27 Module Review Answers…………………………………………………………………………….. 11-28

Preface Primavera Project Planner (P3) is a tool for Planners, Project
Managers, and any person needs to plan-control a project
This courseware is perfect for new and novice users of P3. It is a very handy tool for teachers in colleges and universities whom they are teaching P3
This courseware will not teach the reader Project (Construction) Management. It is a pre-requisite to know the science behind PM or CM by at least reading a book, or taking a course
This courseware can be used as instructor-led courseware, or teach-your-self courseware:
• As for the first option, the estimated time would be 3 days, 8 hours a day
• As for the second option, the reader can take it up to his/her convenience
There are 18 workshops, which will complete a full (small) project starting from creating the project, up until the updating process. Solving all workshops will lead to:
• Simulate a real life project from beginning to end, hence putting the reader in the practical mode
• Organize the information in a very logical order
• Not overlooking any of the basic and necessary commands and functions in P3
This courseware will cover the basic and intermediate levels of knowledge in P3
This courseware is covering P3 Ver. 3.1

1-1
Module 1:
Introduction to Primavera Project Planner Ver. 3.1 This module contains:
What is Primavera Project Planner (P3)?
How to deal with P3 file commands?
P3 screens
Method of working
How to create a new project

Using Primavera Project Planner Ver. 3.1
1-2

Module 1: Introduction to Primavera Project Planner Ver. 3.1
1-3
What is Primavera Project Planner?
Primavera Project Planner is the flagship product of Primavera Systems, Inc. the leader in the management software since 1982
Primavera Project Planner is abbreviated P3
P3 is specialized in managing all types of projects: small, medium, and large
Big projects through the world were planned and controlled using P3
P3 is used in almost all countries of the world
Mainly there are two stages in Project Management to manage any project:
• Planning stage
• Monitoring stage
In Planning stage, which takes place before the practical start of the project, the management team will plan for the following factors:
• Time
• Resources
• Cost
To mention few things takes place in Planning stage:
• Calculating activity duration based on work demanded, productivity, and efficiency of the different resources
• Understanding the logic sequence of the project
• Assigning Resources and Costs to activity, hence, view the Resource/Cost histograms
• Generating a Procurement plan
• Anticipating problems may take place in all parts of the project

Using Primavera Project Planner Ver. 3.1
1-4
Planning team will use:
• Previous management experiences
• Previous practical experiences of similar projects
• Historical data collected actually from the field
The plan generated should be practical and doable, and not ideal, and impossible to be accomplished
In the Monitoring stage, the management team will:
• Specify the type of data to be collected from the field
• Decide on which forms should be used in collecting data (you can use international pre-defined forms, or customize your own)
• Collect actual data from the field, in daily basis
• The data collected should cover the three main areas planned for, namely; Time, Resources, and Cost
P3 has the sufficient functions to help the user plan for the time, resources, and cost, and then later monitor them
P3 has enormous pre-made reports to aid the user producing all the necessary information about the project in either phase of the project
Also, P3 has the ability to customize layouts with tables and graphics (controlling colors, fonts, etc.) and produce very handsome and colorful reports

Module 1: Introduction to Primavera Project Planner Ver. 3.1
1-5
How to start P3?
You have two ways to start P3:
• If there is a shortcut in the desktop simply double-click it
• From Windows taskbar, click Start / Programs / Primavera / Primavera Project Planner
P3 will start with no projects open, like the following:
Using Primavera Project Planner Ver. 3.1
1-6
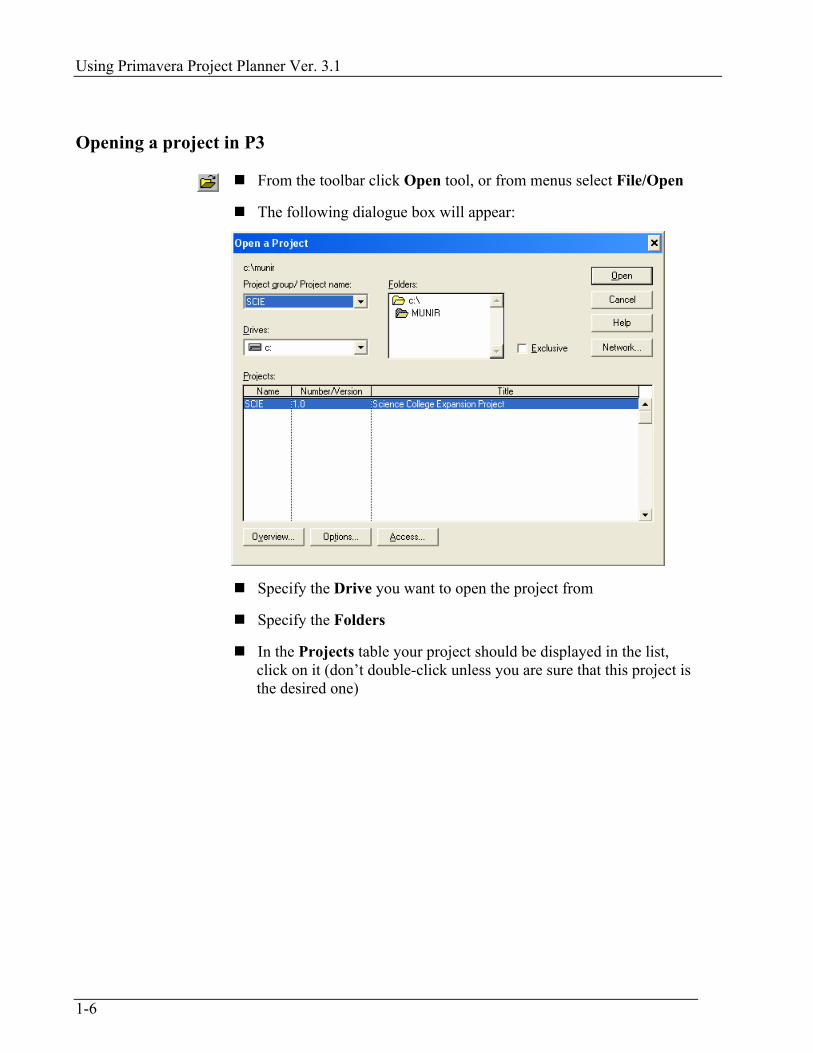
Opening a project in P3
From the toolbar click Open tool, or from menus select File/Open
The following dialogue box will appear:
Specify the Drive you want to open the project from
Specify the Folders
In the Projects table your project should be displayed in the list, click on it (don’t double-click unless you are sure that this project is the desired one)
Module 1: Introduction to Primavera Project Planner Ver. 3.1
1-7
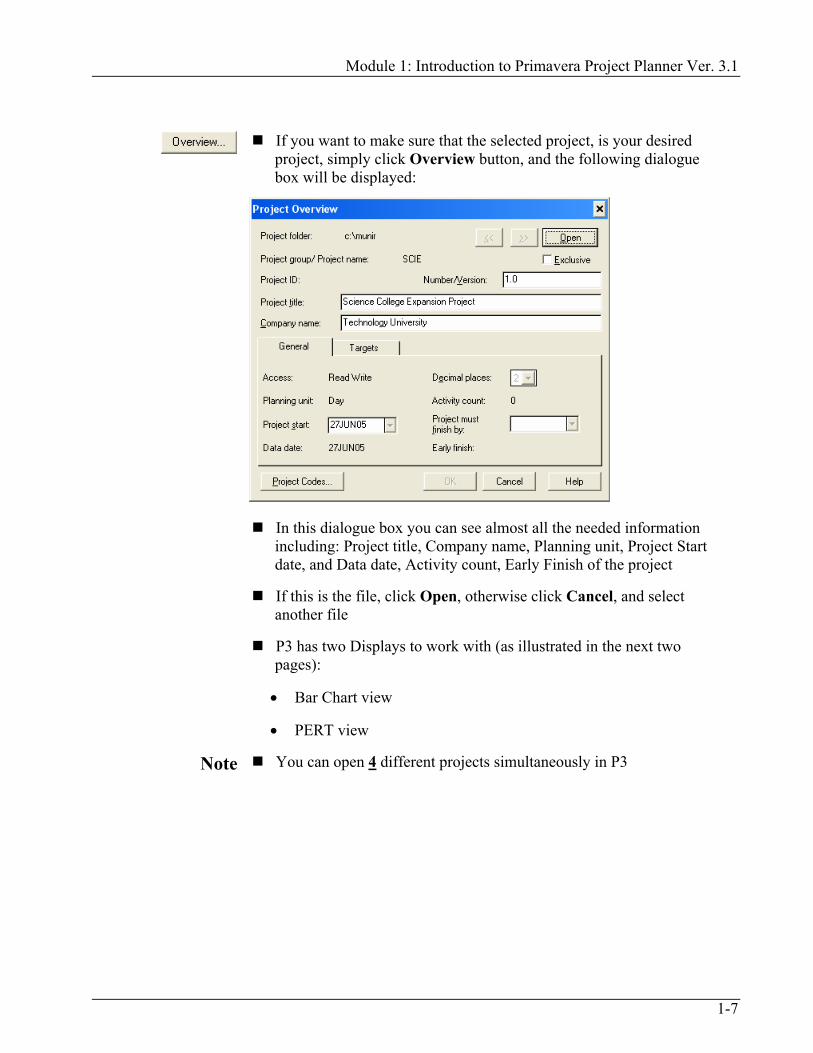
If you want to make sure that the selected project, is your desired project, simply click Overview button, and the following dialogue box will be displayed:
In this dialogue box you can see almost all the needed information including: Project title, Company name, Planning unit, Project Start date, and Data date, Activity count, Early Finish of the project
If this is the file, click Open, otherwise click Cancel, and select another file
P3 has two Displays to work with (as illustrated in the next two pages):
• Bar Chart view
• PERT view
Note You can open 4 different projects simultaneously in P3
Using Primavera Project Planner Ver. 3.1
1-8
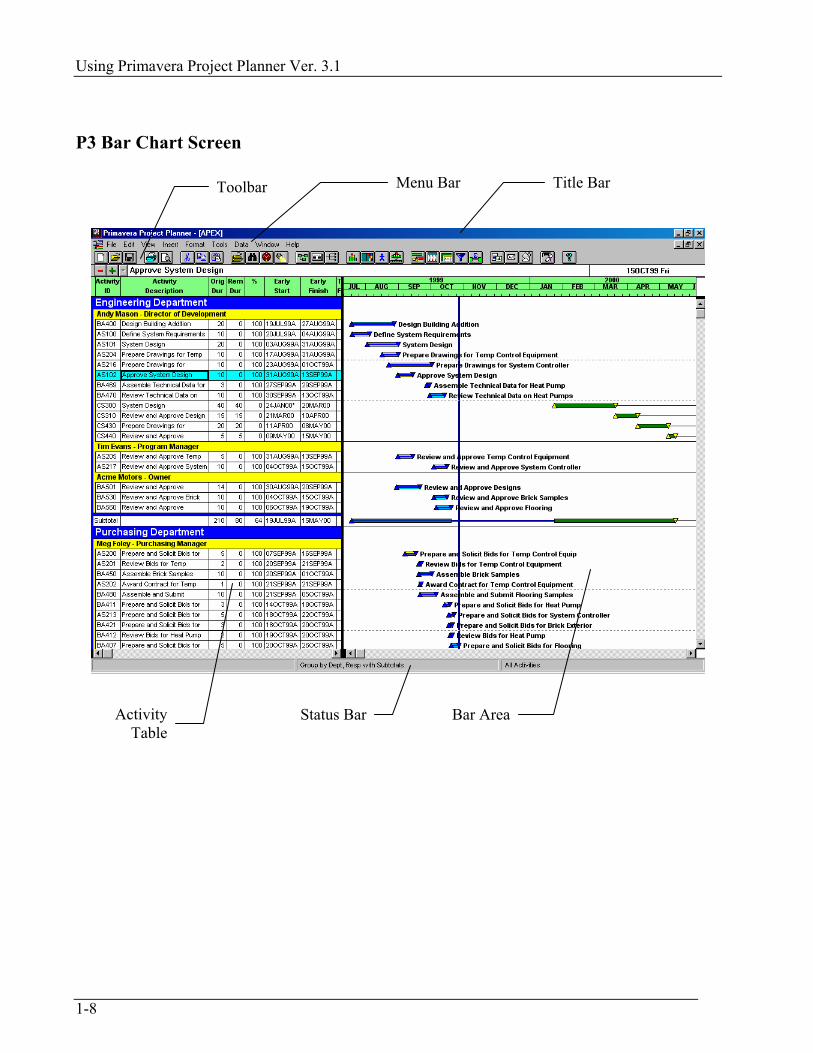
P3 Bar Chart Screen
Title Bar Menu Bar Toolbar
Status Bar Bar AreaActivity Table

Module 1: Introduction to Primavera Project Planner Ver. 3.1
1-9
P3 PERT Screen

Using Primavera Project Planner Ver. 3.1
1-10
Method of Working
P3 is using Critical Path Method (CPM) in calculating the dates and floats of the activities
P3 is using Precedence Diagramming Method (PDM) in presenting the network
P3 will calculate the schedule reference to the Data Date (DD), which is defined as Time Now:
• If you are in the Planning phase DD is the Start Date of the Project
• If you are in Monitoring phase, it will be the date of the day you will run the Schedule command in
Creating a New project
From the toolbar click New button, or from menus select File/New
The following dialogue box will appear:
Module 1: Introduction to Primavera Project Planner Ver. 3.1
1-11
Input the Project name (should be always 4 characters)
Input Number/Version, if you want to signify the trial number
Input the Project title, and Company name
Input the Planning unit (You have four choices, Hour, Day, Week, and Month). Accordingly, the Activities will be measured using the selected planning unit
Input Workdays/week, which is the number of working days per a given week
Input Week starts on, you have the choice of starting the week from any day you would like
Input the Project start date
Input when the Project must finish by date. This piece of information is optional, hence we prefer, if you leave it empty, and we will later input it
Once you are done, click Add, a new empty project will be opening

Using Primavera Project Planner Ver. 3.1
1-12
Creating New Project
Workshop 1
Our workshops are built around a medium project issued by Technology University. The project is to construct two new buildings, and to renovate an existing one. Technology University wants to build up a new building, which will be devoted for Classrooms (it will be a concrete structure), another building is a Gymnasium with high modern standards (it will be steel structure), and finally wants to renovate the existing lab building. 1. Create a new folder holding your name (this is a non-professional way
to name a folder, but we will use it for its easiness)
2. Start P3
3. Create a new file and save it in your folder
4. Input the following data:
a. Project Name: SCIE
b. Number/Version: 1.0
c. Project Title: Science College Expansion Project
d. Company Name: Technology University
e. Planning Unit: Day
f. Work days/Week: 5
g. Week Starts On: Monday
h. Project Starts: 27 JUN 2005
5. Leave the rest of data as is, and click Add

Module 1: Introduction to Primavera Project Planner Ver. 3.1
1-13
Module Review
1. P3 means:
a. Primavera software version 3
b. Primavera software goes through 3 stages of work
c. Primavera Project Planner
d. All of the above
2. Project Management goes through two main stages: _____________ and ____________
3. P3 can deal with:
a. 1 file at a time
b. 2 files at a time
c. 3 files at a time
d. 4 files at a time
4. You input actual data in the Planning stage:
a. True
b. False
5. DD definition is:
a. Start Date
b. Time Now
c. Data Date
d. B & C
6. CPM means ______________________________________________________________.
Using Primavera Project Planner Ver. 3.1
1-14
Module Review Answers 1. c
2. Planning and Monitoring
3. d
4. b
5. d
6. Critical Path Method
2-1
Module 2:
Classification Using Activity Codes and IDs This module contains:
The importance of Classification in projects
The difference between Activity Codes and Activity IDs
Steps to create Activity Code Dictionary
Printing and Sharing Activity Code Dictionary

Using Primavera Project Planner Ver. 3.1
2-2

Module 2: Classification Using Activity Codes and IDs
2-3
The Importance of Classification
Activities are the main component of a project
Mid-sized projects may reach 1000 to 4000 activities
Dealing with such big number of Activities needs from the user to classify the activities to achieve all/any of the following:
• Organize and group the activities according to common code which will lead to produce good looking Layouts (will be discussed later)
• Produce complex reports fast and accurate
• Answer urgent questions (e.g. in meetings) using simple steps
Classification of Activities can be done using:
• Activity Codes (Code or ID)
• WBS (Work Breakdown Structure)
We will discuss in this courseware the Activity Codes
Before You Start
Before you start inputting data to P3, go through the following steps:
• Draw diagram (or diagrams, depends on your case) to show the types of classifications and their expected values, like the diagram below:
Internal Finishing External Finishing Construction
Phase

Using Primavera Project Planner Ver. 3.1
2-4
Then type a code for each classification and its values:
From the diagram above, we can see the following:
• The classification (we will call it Activity Code) is Phase, and its abbreviation is PHAS
• The expected values for this Activity Code are: Construction CN, Internal Finishing IF, and External Finishin EF
• The number of characters for each value is 2
Repeat the same steps for other classifications
Internal FinishingIF
External FinishingEF
ConstructionCN
PhasePHAS

Module 2: Classification Using Activity Codes and IDs
2-5
Activity Code Command
From menus select Data/Activity Codes, the following dialogue box will appear:
In the Activity Code tab you will find actvitiy codes defined in your project (these are the default activity codes, and they will be copied to any new project automatically) so the first step will be to delete the existing codes
Input the Activity Codes taking into consideration the following:
• The Name of the code shouldn’t exceed 4 characters
• The Length, which is the number of characters for the values of this code (i.e. in our previous example it was 2). Sum of all lenghts shouldn’t exceed 64 characters
• The Description, which is a brief description of the code

Using Primavera Project Planner Ver. 3.1
2-6
You will get something like the dialogue box shown below:
Now input the values for each Activity Code, like below:
Repeat the same steps for other Activity Codes

Module 2: Classification Using Activity Codes and IDs
2-7
Activity ID tab in Activity Code
In the Activity Code dialogue box there is a tab titled Activity ID:
What is the significance of Activity ID in P3? To answer this question, we have to know that each and every activity in P3 should have an Activity ID (which is the Activity Name), which may be anything you wish, like:
• AA1, AA2, AA3, etc.
• 123, 124, 125, etc.
• AAA, AAB, AAC, etc.
But as you can see the above IDs don’t reflect any meaning or any type of information
P3 suggests to utilize the Activity ID part to do two things:
• Name our activities intelligently
• Calssify our activities just like we did in Activity Codes
You can have up to four classifications as Activity ID
Click on the Activity ID tab, and do as you did in the Activity Code tab:
• The Name of the ID shouldn’t exceed 4 characters
• The Length, which is the number of characters for the values of this ID. The sum of all lenghts shouldn’t exceed 10 characters
• The Description, which is a brief description of the ID
Using Primavera Project Planner Ver. 3.1
2-8
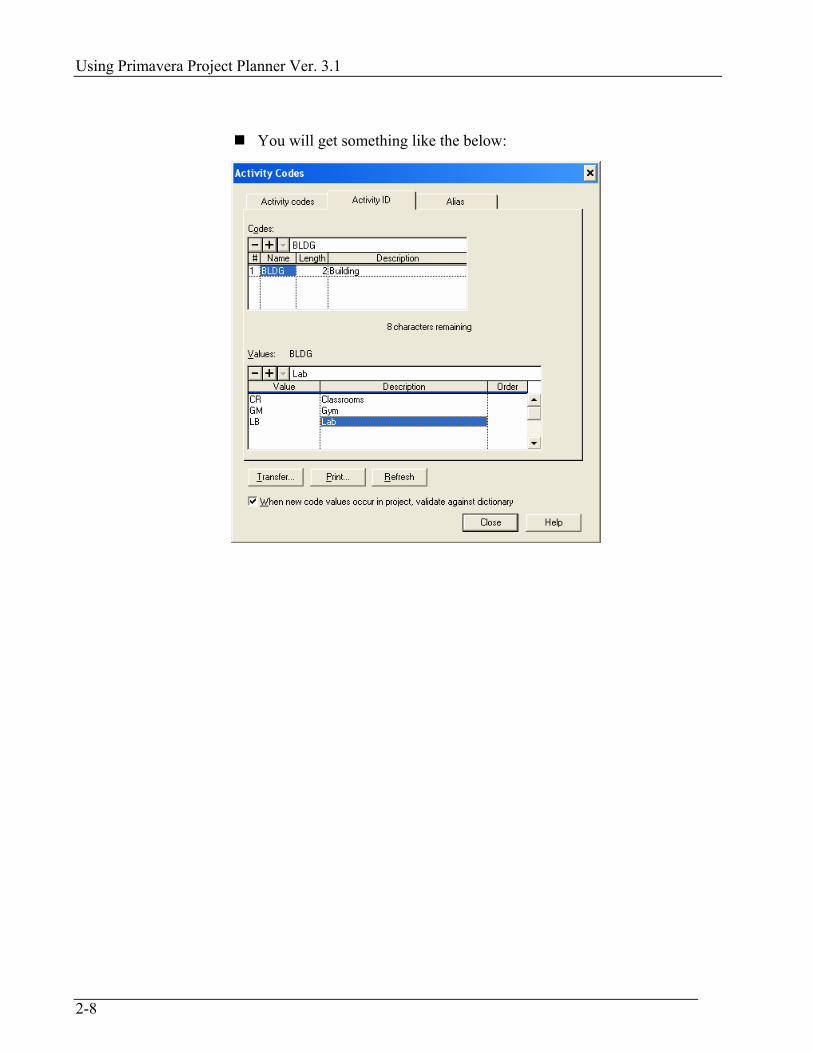
You will get something like the below:
Module 2: Classification Using Activity Codes and IDs
2-9
Set the Order for Codes and IDs
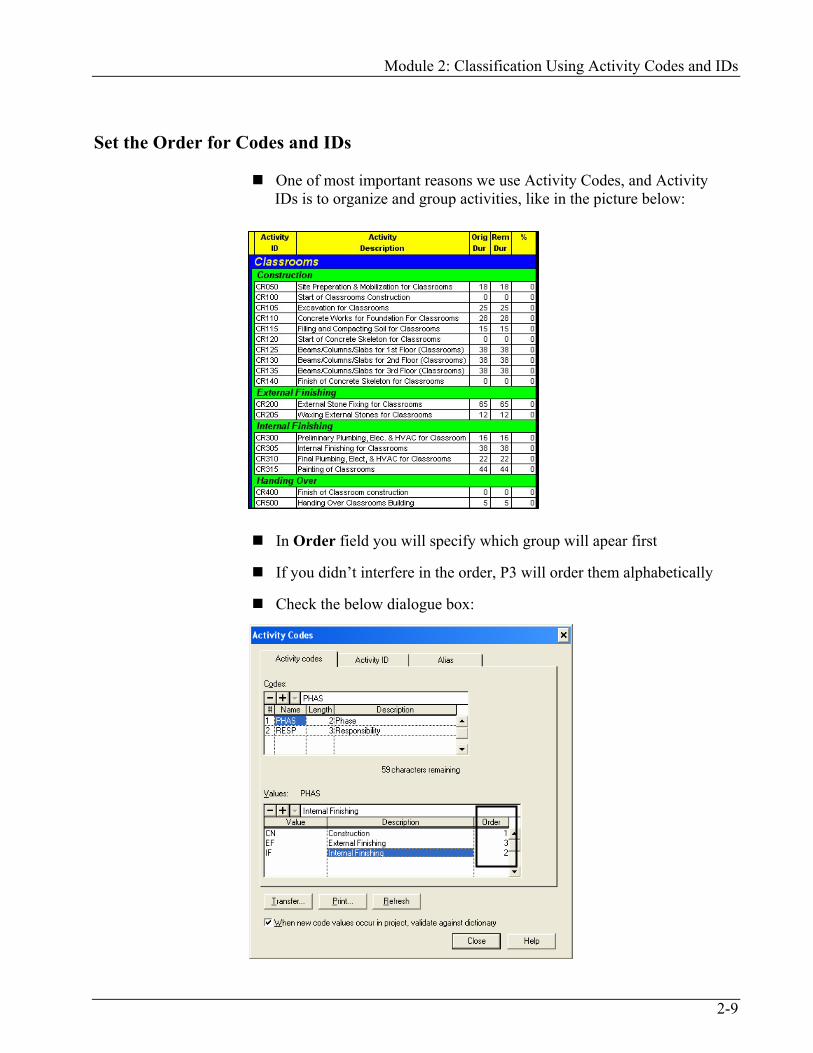
One of most important reasons we use Activity Codes, and Activity IDs is to organize and group activities, like in the picture below:
In Order field you will specify which group will apear first
If you didn’t interfere in the order, P3 will order them alphabetically
Check the below dialogue box:

Using Primavera Project Planner Ver. 3.1
2-10
Validate Against Dictionary and Refresh
If the planner while linking Activity Codes (or Activity ID) to an activity input a value that doesn’t exist in the dictionary, how P3 will react?
It depends on your project settings. There are two methods:
• Automatic method
• Manual method
Automatic method
From menus select Data/Activity Codes
In the bottom portion of dialogue box, there is a checkbox says: “When new code values occurs in project, validate against dictionary”
Click this checkbox on
From now on, whenever the user input any value that doesn’t exist in the dictionary, P3 will add this value
User should later input the the description, and order
Manual method From menus select Data/Activity Codes
Click off the checkbox says: “When new code values occurs in project, validate against dictionary”
From now on, whenever the user input any value that doesn’t exist in the dictionary, P3 will not add this value to the dictionary, but rather will wait for the user to do that manaully
To do that manually, click Refresh button

Module 2: Classification Using Activity Codes and IDs
2-11
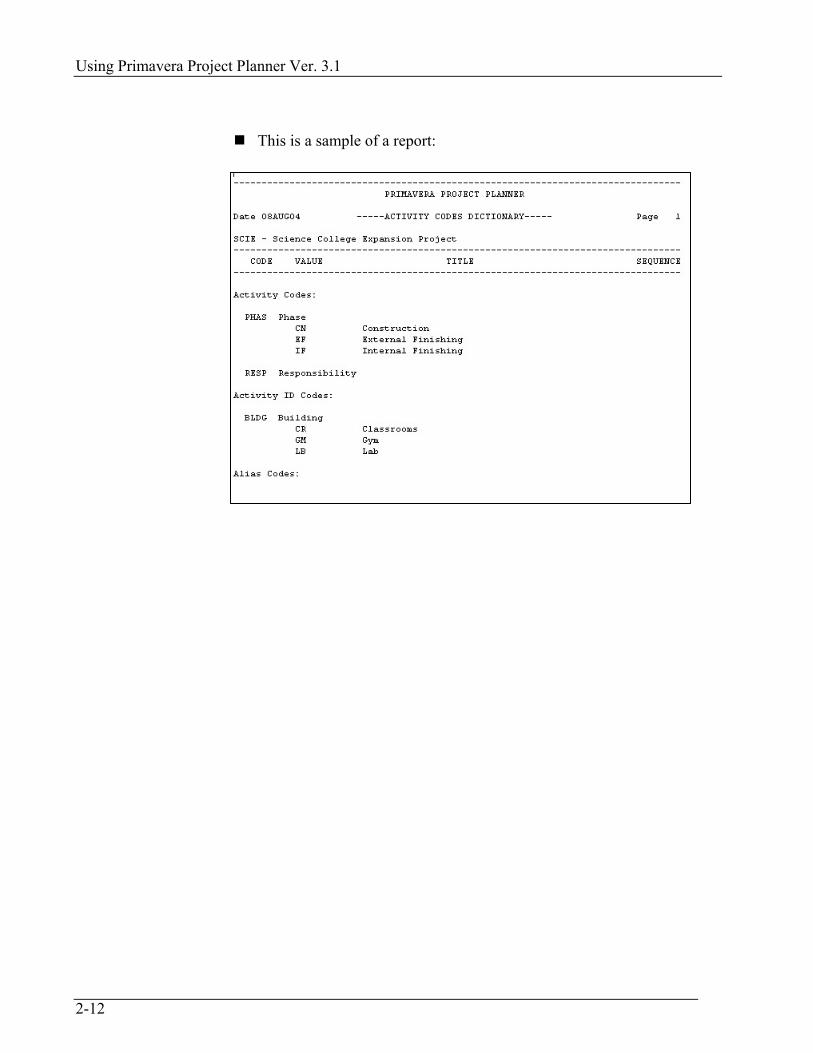
Printing Activity Code Dictionary
In order to include the classifiaction hierarchy with your project papers, so other out-siders would understand the coding structure of your project, you can print a report and save it
Click the Print button, P3 will give you the following warning message:
Click OK, the following dialgoue box will appear:
A report will be produced, just like the one on the next page
Using Primavera Project Planner Ver. 3.1
2-12
This is a sample of a report:

Module 2: Classification Using Activity Codes and IDs
2-13
Transferring Activity Code Dictionary
You can transfer Activity Code Dictionary between projects
Go to the new project you want to transfer to
From menus select Data/Activity Codes
Click the Transfer button, the following warning message will appear:
Click OK. The following dialogue box will appear:
Specify the Driver and Folder which the desired project you want to copy from resides in, then at the top portion of the dialogue box specify the project. Now click Transfer
The dictionary will be copied to your project

Using Primavera Project Planner Ver. 3.1
2-14
Notes

Module 2: Classification Using Activity Codes and IDs
2-15
Creating And Inputting Activity Codes and IDs
Workshop 2
1. Open SCIE project
2. Delete the existing Activity Codes
3. Using the following diagram, create Activity Code PHAS and its values in the Activity Code tab (Use numbers for Order):
4. Using the following diagram, create Activity Code RESP and its values in the Activity Code tab:
Tom HunterTH (2)
Liza MorrottoLM (3)
Michael MannMM (1)
ResponsibilityRESP
Internal Finishing IF (3)
External Finishing EF (2)
ConstructionCN (1)
Phase PHAS
Handing Over HO (4)

Using Primavera Project Planner Ver. 3.1
2-16
5. Using the following diagram, create Activity ID BLDG and its values in
the Activity ID tab:
6. Produce a print out of your dictionary
GymGM (3)
LabLB (2)
ClassroomsCR (1)
BuildingBLDG

Module 2: Classification Using Activity Codes and IDs
2-17
Module Review
1. We need Activity Codes to:
a. Classify our activities
b. Organize and Group our activities
c. Produce Layouts
d. All of the above
2. The Name of Activity Code should not exceed _____________ characters
3. One of the following statements are true about Activity Code Order
a. Affect the activities grouping
b. Affect whether this code is useable or not
c. Differentiate between Activity Code and Activity ID
d. Specify the maximum length of code value
4. The number of values for any Activity Code or ID is limited by 10
a. True
b. False
5. The only difference between Activity Code and Activity ID is:
a. There is no difference
b. Activity ID coding will appear as part of the Activity ID
c. Activity code will appear as part of the Activity ID
d. Both will appear as part of the Activity ID
6. If you transfer an Activity Code Dictionary from project to another project, the transferred Dictionary will _________.the existing one.

Using Primavera Project Planner Ver. 3.1
2-18
Module Review Answers 1. d
2. 4
3. a
4. b
5. b
6. Overwrite

3-1
Module 3:
Inputting Basic Activity Data This module contains:
What is activity?
The basic activity data needed to input an activity
Preparation before you input an activity
Adding/Deleting/Editing Activities
Copying activities
Linking activities with Activity Codes

Using Primavera Project Planner Ver. 3.1
3-2

Module 3: Inputting Basic Activity Data
3-3
What is Activity?
Activity is the basic component of any project
We can define activity as “any work you want to accomplish”
Work is a very loose word, each one of us can look at it from different angle
For instance, one will consider “Constructing First Floor Slab” as a single activity
Another will consider:
• Formwork for First Floor Slab as an activity
• Re-baring for First Floor Slab as an activity
• Concrete Placement for First Floor Slab as an activity
It is a common knowledge that if two planners were given the same project, the activity list will be very different
This will highlight the fact that “Activity List writing is not exact science”
We can input lots of information pieces for an activity, but initially we need only four:
• Activity ID
• Activity Description
• Activity Original Duration (abbreviated as OD)
• Activity Type

Using Primavera Project Planner Ver. 3.1
3-4
Activity ID
Activity ID is the Activity Name
It is the only compulsory piece of information P3 asks for, other data either can be left empty, or there is a default value for it
In Module 2, we selected the Building to be our Activity ID, with expected values Classrooms CR, Gym GM, and Lab LB
Now, each activity ID in our project will start with either CR, GM, or LB, example would be CR100, GM205, and LB303
The numbers after the two characters would be sequential number, which would be left to the user
Activity ID could be as long as 10 characters (spaces are allowed and counted)
Activity Description
This piece of information is devoted for the user to write a short description about the activity
You can leave it empty if you wish (P3 will not generate any error messages)
You can type up to 48 characters (including spaces)

Module 3: Inputting Basic Activity Data
3-5
Activity Original Duration (OD)
Activity Original Duration can be either input by the user, or calculated by P3
It depends on the type of resources which will be assigned to it:
• If the resources were Non-Driving, the user will assign the duration
• If the resources were Driving, P3 will calculate the duration
In this courseware, we will tackle only the first type of activities, hence we need to calculate the OD manually then input the value to P3
Some guidelines to help calculating OD would be:
• Prepare for each activity a worksheet (this can be a piece of paper or MS Excel® sheet)
• List the resources which will work on the activity
• List the amount of work in which each resource can accomplish
• Specify the productivity, and estimated count of each resource to be assigned
• With the above information available the user can produce correct OD which is based on real calculation
Using Primavera Project Planner Ver. 3.1
3-6
Activity Type
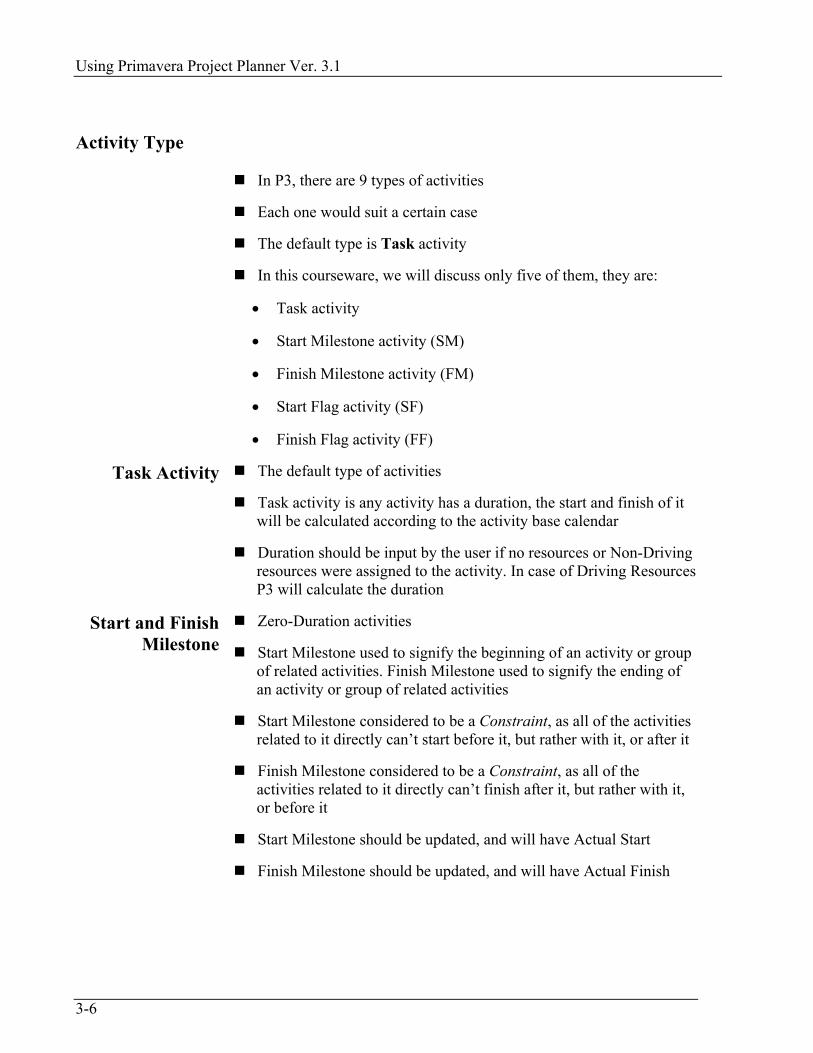
In P3, there are 9 types of activities
Each one would suit a certain case
The default type is Task activity
In this courseware, we will discuss only five of them, they are:
• Task activity
• Start Milestone activity (SM)
• Finish Milestone activity (FM)
• Start Flag activity (SF)
• Finish Flag activity (FF)
Task Activity The default type of activities
Task activity is any activity has a duration, the start and finish of it will be calculated according to the activity base calendar
Duration should be input by the user if no resources or Non-Driving resources were assigned to the activity. In case of Driving Resources P3 will calculate the duration
Start and Finish Milestone
Zero-Duration activities
Start Milestone used to signify the beginning of an activity or group of related activities. Finish Milestone used to signify the ending of an activity or group of related activities
Start Milestone considered to be a Constraint, as all of the activities related to it directly can’t start before it, but rather with it, or after it
Finish Milestone considered to be a Constraint, as all of the activities related to it directly can’t finish after it, but rather with it, or before it
Start Milestone should be updated, and will have Actual Start
Finish Milestone should be updated, and will have Actual Finish

Module 3: Inputting Basic Activity Data
3-7
Start and Finish
Flag Zero-Duration activities
Start Flag used to signify the beginning of an activity or group of activities. Finish Flag used to signify the ending of an activity or group of activities
Start Flag considered to be a Constraint, as all of the activities related to it directly can’t start before it, but rather with it, or after it
Finish Flag considered to be a Constraint, as all of the activities related to it directly can’t finish after it, but with it, or before it
Start Flag, and Finish Flag are always Successors to other Activities and never considered as Predecessors to other Activities. Accordingly, SF will accept neither Start-To-Finish, nor Finish-To-Finish relationships. In addition, FF will accept neither Finish-To-Start, nor Start-To-Start relationships.
Start Flag, and Finish Flag will not be updated by the user, but P3 will update them according to the activities linked to them
Example of Milestones
Activity A StartMilestone Activity C
Activity D
Activity B
Activity E
Activity F
FinishMilestone

Using Primavera Project Planner Ver. 3.1
3-8
Example of Flags
Before You Start
Before you start inputting basic activity data, from menus select Tools/Options/Activity Inserting, the following dialogue box will appear:
You have three choices to select from:
• To Automatically number activities without showing the Actvitiy Form
• To Automatically number activities and showing the Actvitiy Form
• To show the Activity Form only
Using the Activity Form only will give you more control over the process of inputting activities. Consequently, do the following:
• Click off Automatically number activities
• Click on Use activity form when inserting an activity
Activity A Activity C
Activity D
Activity B
Activity E
Activity F
Start Flag
Finish Flag

Module 3: Inputting Basic Activity Data
3-9
Adding Activities
From the Edit Bar, click the button with “plus sign”
The Activity Form will appear automatically:
You will find the cursor blinking in the ID part, type in the Activity ID, then press Tab key, or click the next field (don’t press Enter, as this means that you are done with inputting)
Next field is Activity Description, type in the activity description, press Tab key
The cursor will go directly to the OD field, input the estimated origianl duration of your activity
Specify the Activity Type, you have two choices:
• If your activity is Task, click OK, or press Enter
• If your activity is SM, FM, SF, or FF, right-click on the Type field, the following menu will appear:
Select the desired activity type
Click OK, or press Enter, the Activity Form will disappear
To add another activity click below the last activity in the activity table, or click “plus sign” again

Using Primavera Project Planner Ver. 3.1
3-10
Deleting Activities
Select the activity (or activities) to be deleted
From Edit bar, click “minus sign”, or from menus click Edit/Delete
The following dialogue box will appear:
If you are sure of what you are doing click Yes, the activity will be deleted
If not click No, the deleting process will stop
Editing Activities
There are two methods to edit the activity data:
• Editing all types of data
• Editing single data
Editing all activity data
Double-Click on any activity, the Activity Form will appear, then you can edit whatever data you would like
The same can happen if you select from menus Edit/Edit Activity
Editing single activity data
Select the cell which contains the data you want to edit (the cell selector is a bold frame appears around the cell required), just like the below example:
The contents of the cell will appear in the Edit bar
Click the Edit bar, or press F2 to edit the contents

Module 3: Inputting Basic Activity Data
3-11
Note Other ways to show the Activity Form permenantly are:
• From menus select View/Activity Form
• Press F7
• From toolbar click Activity Form icon
These 3 ways are ON/OFF functions, which means they will show or hide the Activity Form
Using the baove methods of editing activites is applicable to all types of data except two types:
• All the data calculated by P3 (like ES, EF, LS, LF, TF, etc.) which we will discuss later
• Activity ID, unless you opened your project as Exclusive (which is a checkbox in the Open dialogue box)

Using Primavera Project Planner Ver. 3.1
3-12
Copying Activities
Copying activities means copying the whole data of single activity or activities
Copying can be done from a project to the same project, or across projects
Select the desired activity (or activities)
From menues select Edit/Copy, Ctrl+C, or right-click and select Copy
Go to the desired place (the same project, or open another project)
From menus select Edit/Paste, Ctrl+V, or right-click and select Paste
In order for P3 to make sure that no duplication of the same activity ID will take place, the following dilaogue box will appear:
You can select one of the four choices available:
• Rename duplicates only
• Rename all
• Prefix or suffix
• Auto-increment

Module 3: Inputting Basic Activity Data
3-13
Rename
duplicates only P3 will select the coming activities with maching IDs only to be
renamed, the rest will be pasted without any change
Rename All P3 will show all activities to be renamed
Prefix or suffix It is a fast way to rename activities, by suggesting a character (or characters) to appear to the left of the coming activities IDs (this is prefix) or appear to the right of the coming activities IDs (this is suffix)
Auto-increment It is another fast way to rename activities, by suggesting a base name (for instance GM100) and then an increment number (for instance 10) this will allow P3 to rename all the coming activites easily
Also you can make sure that the coming activities are the desired ones, by clicking Contents buttom which will display the names of the coming activities
Linking Activities with Codes
In Module 2 we created Activity Code Dictionary
In this Module we will link each activity with the proper code value
The lower left part Activity Form contains the Activity Codes defined and its value
Right-click on the desired code, a list of the available values will be displayed, select the desired value
Do the same for the other codes
Using Primavera Project Planner Ver. 3.1
3-14
Inputting Basic Activity Data
Workshop 3
1. Open SCIE project
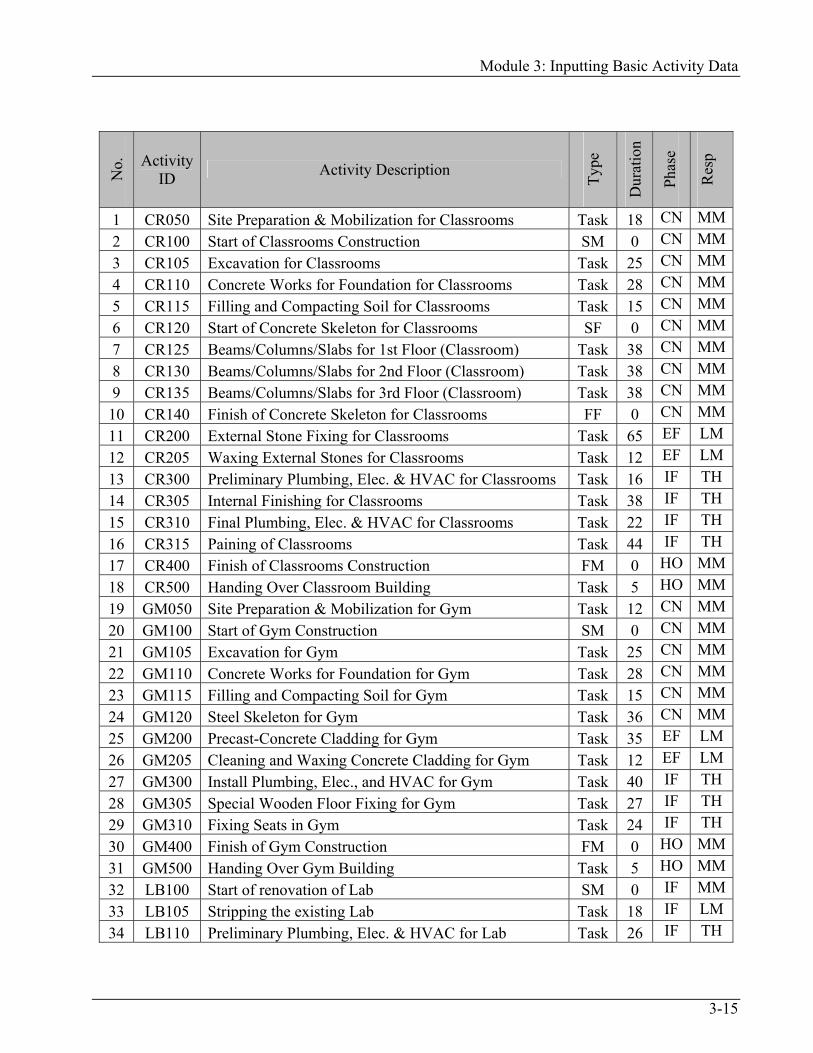
2. Input the activities from next pages
3. Taking into consideration the following notes:
a. Read the whole list first, and identify the similarity between the IDs, and description of different activities
b. Utilize Activity Copying utility, which will minimize the time of data input. Also, utilize of renaming of activities
Module 3: Inputting Basic Activity Data
3-15
N
o. Activity
ID Activity Description
Type
Dur
atio
n
Phas
e
Res
p
1 CR050 Site Preparation & Mobilization for Classrooms Task 18 CN MM2 CR100 Start of Classrooms Construction SM 0 CN MM3 CR105 Excavation for Classrooms Task 25 CN MM4 CR110 Concrete Works for Foundation for Classrooms Task 28 CN MM5 CR115 Filling and Compacting Soil for Classrooms Task 15 CN MM6 CR120 Start of Concrete Skeleton for Classrooms SF 0 CN MM7 CR125 Beams/Columns/Slabs for 1st Floor (Classroom) Task 38 CN MM8 CR130 Beams/Columns/Slabs for 2nd Floor (Classroom) Task 38 CN MM9 CR135 Beams/Columns/Slabs for 3rd Floor (Classroom) Task 38 CN MM10 CR140 Finish of Concrete Skeleton for Classrooms FF 0 CN MM11 CR200 External Stone Fixing for Classrooms Task 65 EF LM 12 CR205 Waxing External Stones for Classrooms Task 12 EF LM 13 CR300 Preliminary Plumbing, Elec. & HVAC for Classrooms Task 16 IF TH 14 CR305 Internal Finishing for Classrooms Task 38 IF TH 15 CR310 Final Plumbing, Elec. & HVAC for Classrooms Task 22 IF TH 16 CR315 Paining of Classrooms Task 44 IF TH 17 CR400 Finish of Classrooms Construction FM 0 HO MM18 CR500 Handing Over Classroom Building Task 5 HO MM19 GM050 Site Preparation & Mobilization for Gym Task 12 CN MM20 GM100 Start of Gym Construction SM 0 CN MM21 GM105 Excavation for Gym Task 25 CN MM22 GM110 Concrete Works for Foundation for Gym Task 28 CN MM23 GM115 Filling and Compacting Soil for Gym Task 15 CN MM24 GM120 Steel Skeleton for Gym Task 36 CN MM25 GM200 Precast-Concrete Cladding for Gym Task 35 EF LM 26 GM205 Cleaning and Waxing Concrete Cladding for Gym Task 12 EF LM 27 GM300 Install Plumbing, Elec., and HVAC for Gym Task 40 IF TH 28 GM305 Special Wooden Floor Fixing for Gym Task 27 IF TH 29 GM310 Fixing Seats in Gym Task 24 IF TH 30 GM400 Finish of Gym Construction FM 0 HO MM31 GM500 Handing Over Gym Building Task 5 HO MM32 LB100 Start of renovation of Lab SM 0 IF MM33 LB105 Stripping the existing Lab Task 18 IF LM 34 LB110 Preliminary Plumbing, Elec. & HVAC for Lab Task 26 IF TH
Using Primavera Project Planner Ver. 3.1
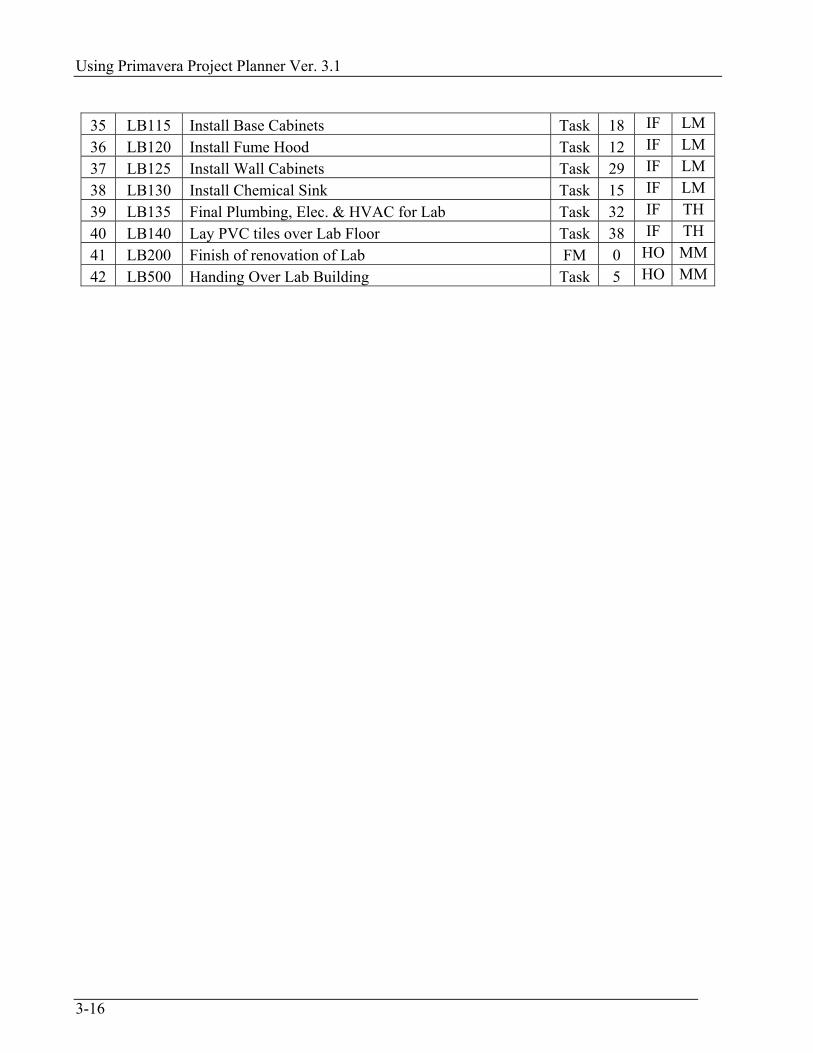
3-16
35 LB115 Install Base Cabinets Task 18 IF LM 36 LB120 Install Fume Hood Task 12 IF LM 37 LB125 Install Wall Cabinets Task 29 IF LM 38 LB130 Install Chemical Sink Task 15 IF LM 39 LB135 Final Plumbing, Elec. & HVAC for Lab Task 32 IF TH 40 LB140 Lay PVC tiles over Lab Floor Task 38 IF TH 41 LB200 Finish of renovation of Lab FM 0 HO MM42 LB500 Handing Over Lab Building Task 5 HO MM

Module 3: Inputting Basic Activity Data
3-17
Module Review
1. How many activity types available in P3:
a. 8
b. 9
c. 7
d. 5
2. ____________ should not have a successor
3. One of the following is considered an intelligent Activity ID:
a. 123, 124, 125
b. A125, A126, A127
c. CR105, GM110, LB200
d. All of the above
4. I can edit the Activity ID of a certain activity
a. True
b. False
5. P3 will not permit to have two activities with the same ID in the same project
a. True
b. False
6. Using _________________, or ______________________ I can edit the all types of data for certain activity

Using Primavera Project Planner Ver. 3.1
3-18
Module Review Answers 1. b
2. Flags
3. c
4. a
5. a
6. Double-click, or Edit/Edit Activity

4-1
Module 4:
Inputting Logic Relationships This module contains:
What is logic relationship?
Predecessor and Successor
Types of relationship
Inputting relationships using Bar Chart view
Inputting relationships using PERT view
Editing relationships
Tracing relationships
Link and unlink activities
Using Autolink function

Using Primavera Project Planner Ver. 3.1
4-2

Module 4: Inputting Logic Relationships
4-3
What is Logic Relationship?
In Module 1 it was mentioned that P3 uses PDM (Precedence Diagramming Method) in representing the network
There are mainly two methods to represent a network:
• Activity-On-Arrow
• Activity-On-Node
Activity-On-Arrow
Also known ADM (Arrow Diagramming Method)
The old method of representing the network
To go from event A to event B, you will do certain thing:
Almost none of the software in the current market is offering this method for representing the network
Activity-On-Node Also known as PDM
The activities are at the two nodes of a logic relationship
Logic relationship is a link which ties two activities in a sequence manner, for instance:
The name Logic indicates that the relationship is not compulsory but rather it represents how the planner is viewing the sequence of the project, hence any delay in start or end, is acceptable
A B CExcavation Foundation
Excavation Foundation Filling

Using Primavera Project Planner Ver. 3.1
4-4
Predecessor and Successor
Based on the above each activity will have:
• Predecessor (or Predecessors)
• Successor (or Successors)
Predecessor Is any activity takes place in time before a given activity
There could be more than one predecessor for a given activity
Successor Is any activity takes place in time after a given activity
There could be more than one successor for a given activity
One of the common practices is to prepare a table called either the Successor table or Predecessor table, depends on the way you want to take it:
• If you want to start with the first activity and go all the way to the right, you should produce a Successor table
• If you want to start with the last activity and go all the way to the left, you should produce a Predecessor table
• A successor table may look something like the following:
Activity Successor CR050 CR100, GM050, LB100 CR100 CR105 CR105 CR110 … …
Module 4: Inputting Logic Relationships
4-5
Types of Relationships
P3 supports four types of relationships:
• Finish-To-Start (known as FS)
• Start-To-Start (known as SS)
• Finish-To-Finish (known as FF)
• Start-To-Finish (known as SF)
Note When we say Start, that means the start of a working day
When we say Finish, that means the finish of working day
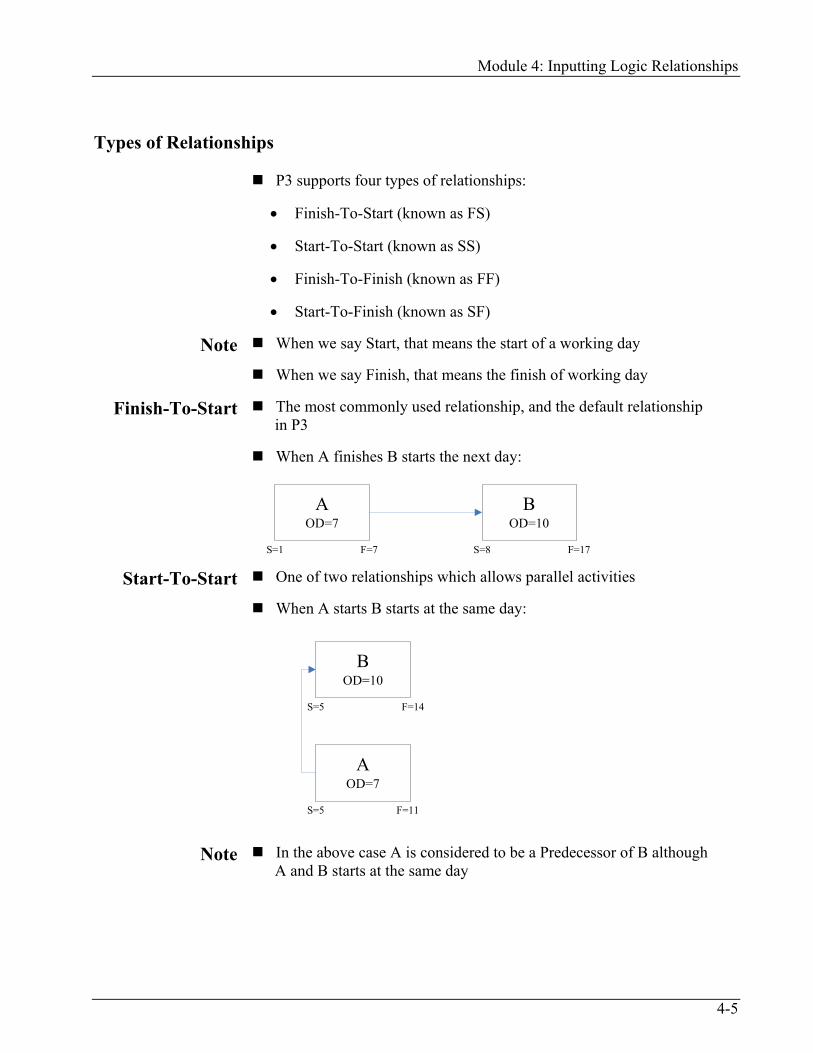
Finish-To-Start The most commonly used relationship, and the default relationship in P3
When A finishes B starts the next day:
Start-To-Start One of two relationships which allows parallel activities
When A starts B starts at the same day:
Note In the above case A is considered to be a Predecessor of B although A and B starts at the same day
AOD=7
BOD=10
S=1 F=7 S=8 F=17
BOD=10
S=5 F=14
AOD=7
S=5 F=11

Using Primavera Project Planner Ver. 3.1
4-6
Finish-To-Finish The second relationship which allows parallel activities
When A finishes B finishes at the same day:
Note In the above case A is considered to be a Predecessor of B although A and B finishes at the same day
Start-To-Finish This relationship is seldom used by planners
It can be used effectively with flags
If you want to link a start of an activity with a Finish Flag you can use Start-To-Finish relationship
When A starts B finishes
BOD=10
F=14
AOD=7
F=14
A
B
Module 4: Inputting Logic Relationships
4-7
Relationships with Lag
Normally the following applies to relationship:
• In FS relationship if the predecessor finishes in day 5 (for instance) the successor will start at day 6
• In SS relationship if the predecessor starts at day 5, the successor will start at day 5
• In FF relationship if the predecessor finishes at day 11, the successor will finish at day 11
The above shows that relationships dictate immediate start or finish for the successor. If you don’t want immediate start or finish for the relationship, you have to use the Lag time
Lag time is the number of time-periods (days in our case) which you delay the successor from its predecessor. Lag time can be positive, or negative, check the following examples in the next page:
Using Primavera Project Planner Ver. 3.1
4-8
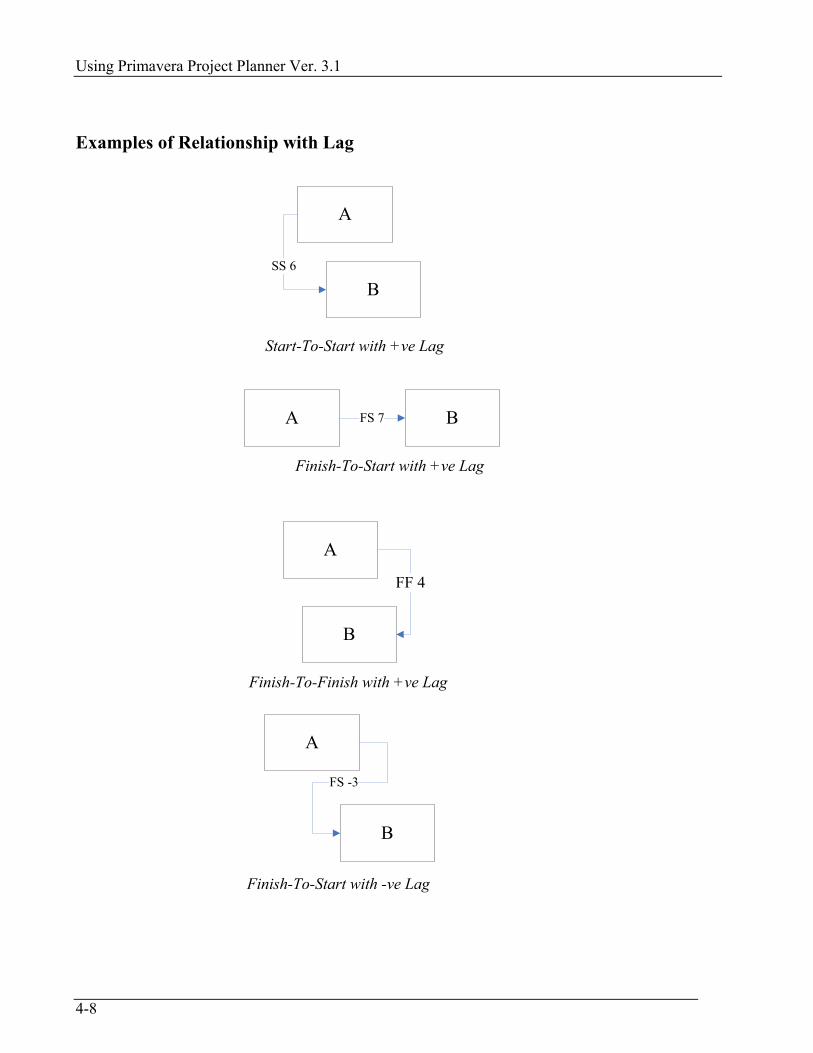
Examples of Relationship with Lag
A BFS 7
Finish-To-Start with +ve Lag
A
B
FF 4
Finish-To-Finish with +ve Lag
A
B
Finish-To-Start with -ve Lag
FS -3
A
BSS 6
Start-To-Start with +ve Lag

Module 4: Inputting Logic Relationships
4-9
Inputting Relationships Using Bar Chart View: Step 1
Draw your network on paper first:
• The biggest mistake a planner can do is to start inputting relationships without preparing it on paper first
• The management team should have more than one meeting discussing the logic of the network
Drawing the network and the logic sequence is not an easy job, it needs:
• Huge field experience
• Team work and discussion (even sometimes needs Brain Storming)
• Deciding which is more important to the planner (it differs from owner point-of-view, to contractor point-of-view) the completion time, or the expenditure of money and resources. Hence creating more serial fashion relationships, or parallel (or overlapping) fashion relationships
Using Primavera Project Planner Ver. 3.1
4-10
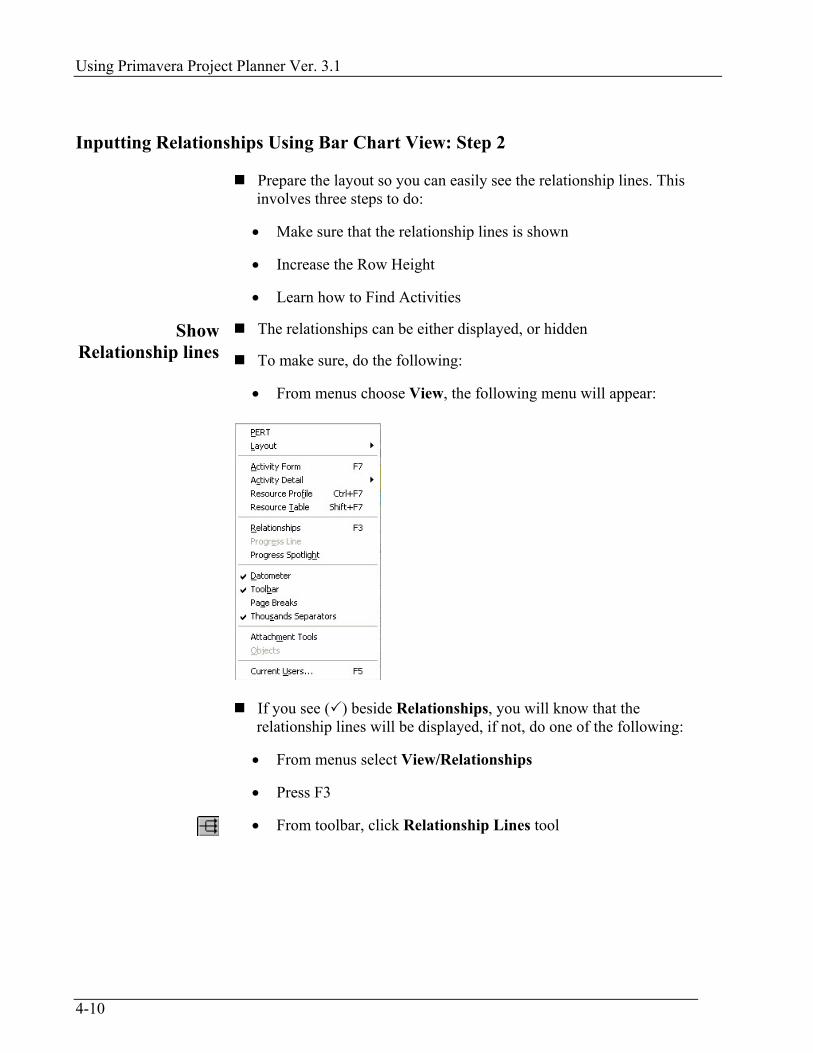
Inputting Relationships Using Bar Chart View: Step 2
Prepare the layout so you can easily see the relationship lines. This involves three steps to do:
• Make sure that the relationship lines is shown
• Increase the Row Height
• Learn how to Find Activities
Show Relationship lines
The relationships can be either displayed, or hidden
To make sure, do the following:
• From menus choose View, the following menu will appear:
If you see ( ) beside Relationships, you will know that the relationship lines will be displayed, if not, do one of the following:
• From menus select View/Relationships
• Press F3
• From toolbar, click Relationship Lines tool
Module 4: Inputting Logic Relationships
4-11
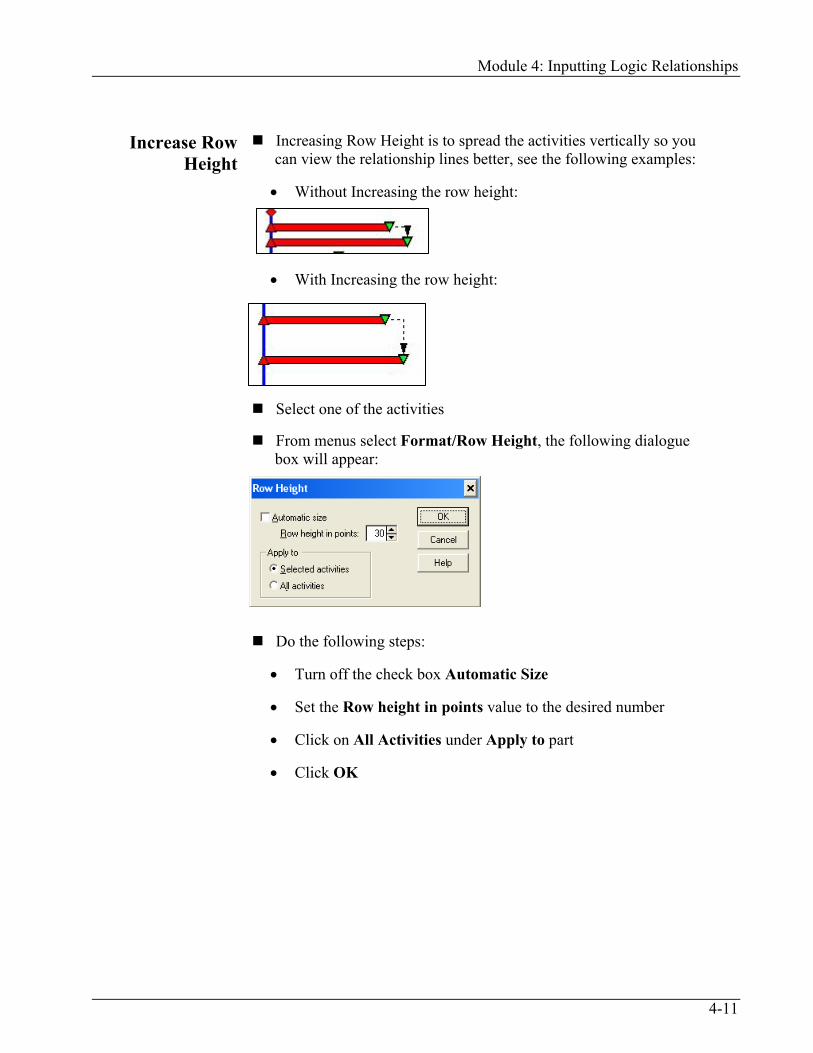
Increase Row
Height Increasing Row Height is to spread the activities vertically so you
can view the relationship lines better, see the following examples:
• Without Increasing the row height:
• With Increasing the row height:
Select one of the activities
From menus select Format/Row Height, the following dialogue box will appear:
Do the following steps:
• Turn off the check box Automatic Size
• Set the Row height in points value to the desired number
• Click on All Activities under Apply to part
• Click OK

Using Primavera Project Planner Ver. 3.1
4-12
Find activity This function is very important, as sometimes you need to locate an
activity to start defining its successor(s)
Do one of the following:
• From menus select Edit/Find Activity
• Press Ctrl+F
• From toolbar, click Find Activity tool
Using any of the above the following dialogue box will appear:
Type in the Activity ID, select All activities, then click Find

Module 4: Inputting Logic Relationships
4-13
Inputting Relationships Using Bar Chart View: Step 3
You can input the relationships using:
• Activity Form
• Graphically
Using Activity Form
Select (or Find) the activity you want to define either successor(s), or predecessor(s) for
Press F7
Click either Pred, or Succ buttons
The following dialogue box will appear
Click (+) sign, type in the predecessor (or successor) ID
Specify the Rel (which is the relationship). The default is FS
If there is any Lag, specify it
You can define more than one predecessor, or successor
Select one of the predecessors, or successors, and click Jump, to go to it. Then continue defining relationships
This what you may get:

Using Primavera Project Planner Ver. 3.1
4-14
Using
Graphically method
Specify the end (Start, or Finish) you want to start with for a certain activity
Get closer to it, up until the cursor change to Relationship cursor
Now click and hold. The relationship line will appear
Go to the other desired end, and drop the relationship line
The relationship line will be created
Inputting Relationships Using PERT View: Step 1, 2, and 3
All the notes we highlighted in the Bar Chart for Step 1, applies to PERT
From menus select View/PERT
The following view will appear:
Module 4: Inputting Logic Relationships
4-15
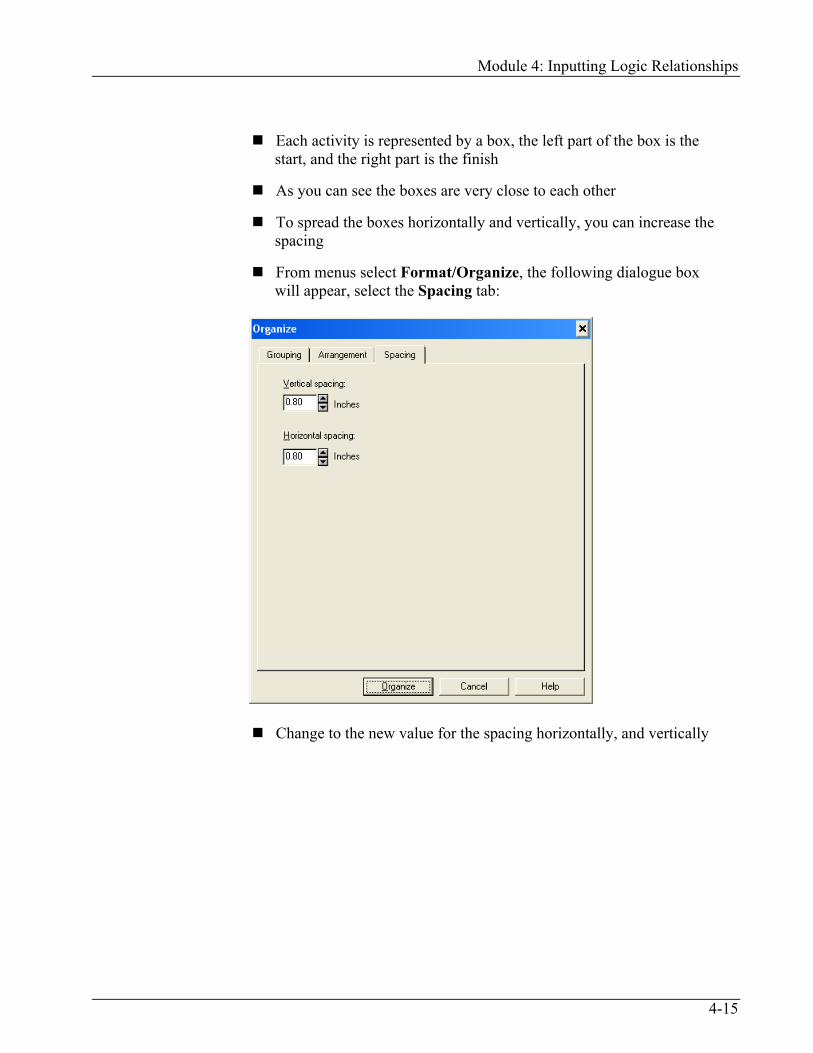
Each activity is represented by a box, the left part of the box is the
start, and the right part is the finish
As you can see the boxes are very close to each other
To spread the boxes horizontally and vertically, you can increase the spacing
From menus select Format/Organize, the following dialogue box will appear, select the Spacing tab:
Change to the new value for the spacing horizontally, and vertically

Using Primavera Project Planner Ver. 3.1
4-16
The result may look something like the following:
The relationship lines are by default shown
But still we need to find activities, like we did in the Bar chart view
To input relationships, use one of the two methods mentioned in Bar chart view (namely; using the Activity Form, or the Graphical method)
Module 4: Inputting Logic Relationships
4-17
Editing Relationships
For both Bar chart view, and PERT view, the editing methods are the same
Available editing methods are:
• Using Activity Form
• Graphical method
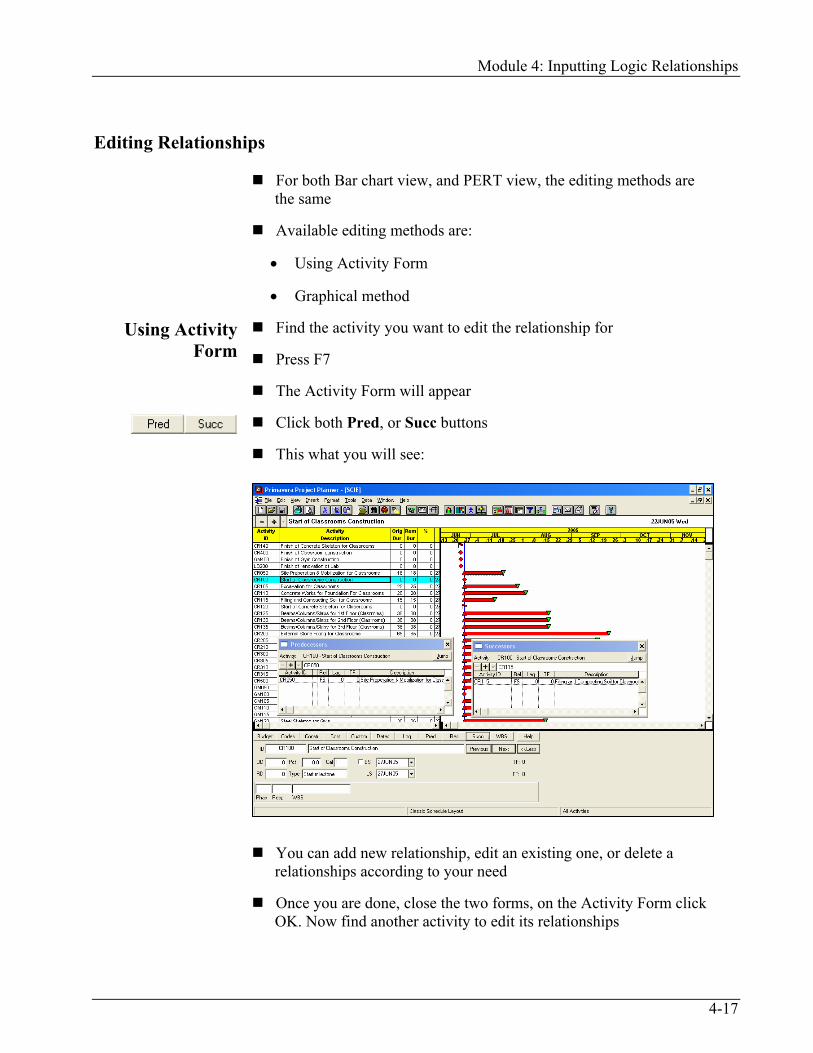
Using Activity Form
Find the activity you want to edit the relationship for
Press F7
The Activity Form will appear
Click both Pred, or Succ buttons
This what you will see:
You can add new relationship, edit an existing one, or delete a relationships according to your need
Once you are done, close the two forms, on the Activity Form click OK. Now find another activity to edit its relationships

Using Primavera Project Planner Ver. 3.1
4-18
Graphical
method It is better to do it in the PERT view, as the relationship lines appear
clearer in this view
Go to PERT view
Find the desired relationship to be edited
Click the relationship line, the following dialogue box will appear:
The dialogue box will show the following information:
• The current Predecessor (un-editable)
• The current Successor (un-editable)
• The relationship type
• The Lag
Change either the relationship type, or the lag
Or you can delete the relationship by clicking the Delete button
Module 4: Inputting Logic Relationships
4-19
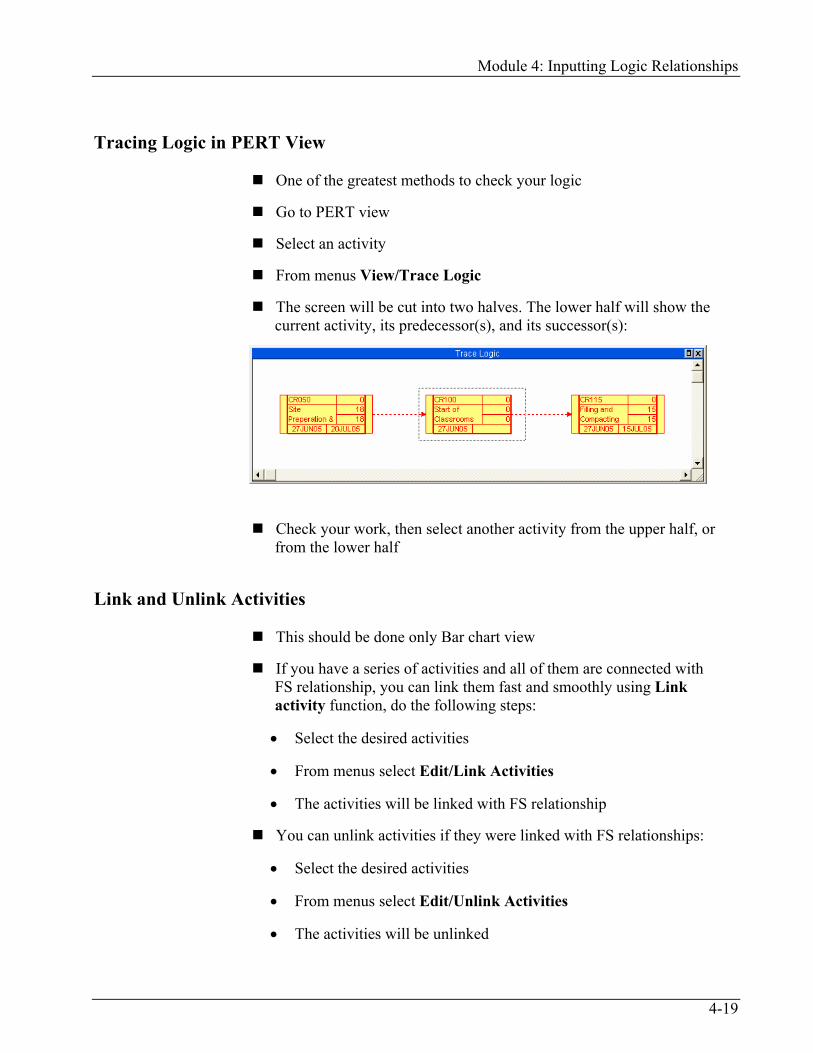
Tracing Logic in PERT View
One of the greatest methods to check your logic
Go to PERT view
Select an activity
From menus View/Trace Logic
The screen will be cut into two halves. The lower half will show the current activity, its predecessor(s), and its successor(s):
Check your work, then select another activity from the upper half, or from the lower half
Link and Unlink Activities
This should be done only Bar chart view
If you have a series of activities and all of them are connected with FS relationship, you can link them fast and smoothly using Link activity function, do the following steps:
• Select the desired activities
• From menus select Edit/Link Activities
• The activities will be linked with FS relationship
You can unlink activities if they were linked with FS relationships:
• Select the desired activities
• From menus select Edit/Unlink Activities
• The activities will be unlinked

Using Primavera Project Planner Ver. 3.1
4-20
Autolink Activities
This facility is an automatic method of linking activities as you input them
From menus select Insert/Autolink
Select an activity (this is a very important step) which will be the predecessor of the coming activities
Start adding activities
Whenever you are done, an FS relationship will be added to the new activity
To stop this facility, from menus select Insert/Autolink again

Module 4: Inputting Logic Relationships
4-21
Inputting Logic Relationship
Workshop 4
1. Open SCIE project
2. Choose whether you want to input the relationships using Bar chart view, or PERT view
3. Accordingly, setup the activities in a way to help you do your job better
4. Input the relationships as indicated in the next page, taking into consideration the following points:
a. The graphical is more convenient if you are dealing with PERT view
b. If there are lots of activities connected with FS relationship, utilize Link, and Unlink
c. After you are done, make sure to use Trace Logic function, to check the network accuracy

Using Primavera Project Planner Ver. 3.1
4-22
CR
050
OD
=18
CR
100
CR
105
OD
=25
CR
110
OD
=28
CR
115
OD
=15
CR
125
OD
=38
CR
120
SS
CR
135
OD
=38
CR
130
OD
=38
CR
200
OD
=65
CR
140
FF
CR
205
OD
=12
CR
300
OD
=16
SS14
CR
305
OD
=38
CR
310
OD
=22
CR
315
OD
=44
CR
400
CR
500
OD
=5
GM
050
OD
=12
GM
100
GM
105
OD
=25
GM
110
OD
=28
GM
115
OD
=15
GM
120
OD
=36
GM
200
OD
=35
GM
205
OD
=12
GM
300
OD
=40
SS14
GM
305
OD
=27
GM
310
OD
=24
GM
400
GM
500
OD
=5
LB10
0LB
105
OD
=18
LB11
0O
D=2
6LB
115
OD
=18
LB12
0O
D=1
2LB
125
OD
=29
LB13
0O
D=1
5LB
135
OD
=32
LB14
0O
D=3
8LB
200
LB50
0O
D=5
Module 4: Inputting Logic Relationships
4-23
Module Review
1. Almost all of the management software in the world are using
a. PDM
b. ADM
c. Both PDM and ADM
d. None of the above
2. _______ is the default relationship type
3. I can link activities as I add them up using Autolink function
a. True
b. False
4. Which is true about Trace Logic:
a. Used only in PERT view
b. You should select an activity first
c. To trace the predecessor(s) and the successor(s) of a selected activity
d. All of the above
5. In PERT there is no need to make sure that relationship lines are shown or hidden, as they are always shown
a. True
b. False
6. From menus select _____________________ to spread the activity boxes horizontally and vertically in PERT view

Using Primavera Project Planner Ver. 3.1
4-24
Module Review Answers 1. a
2. FS
3. a
4. d
5. a
6. Format/Organize

5-1
Module 5:
First Schedule Run This module contains:
Automatic vs. Manual Scheduling
Schedule Passes
Total and Free Float
The Schedule command
The view after Scheduling
Schedule report

Using Primavera Project Planner Ver. 3.1
5-2
Module 5: First Schedule Run
5-3
Introduction
Schedule is to calculate the start and finish dates for each activity, hence will produce the finish date of the project
Normally in Planning phase, the planner will perform scheduling several times, and the first one should be after finishing inputting activities and relationships
The purpose of the first run, is to get the initial dates, so it can be used in the coming meetings
Also, the initial dates may be submitted to Procurement department so they will have some sort of deadlines they can include in their RFQ to be issued
Automatic Schedule vs. Manual Schedule
In P3 there are two types of scheduling:
• Automatic
• Manual
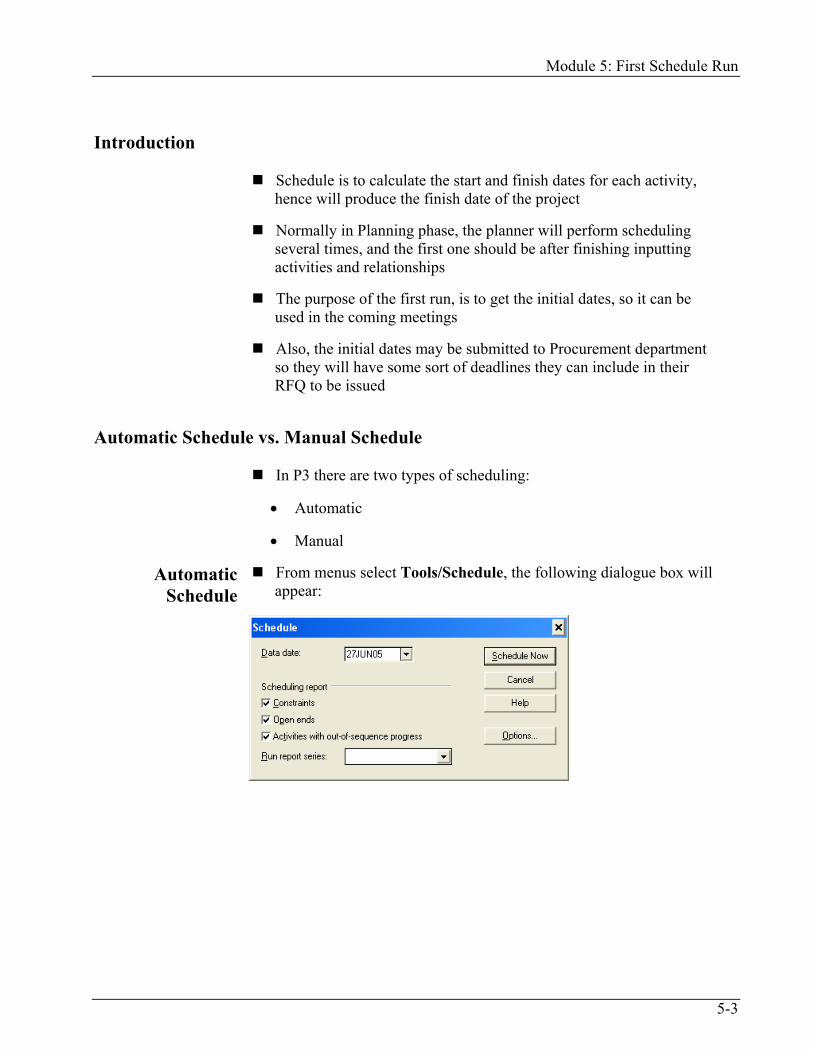
Automatic Schedule
From menus select Tools/Schedule, the following dialogue box will appear:

Using Primavera Project Planner Ver. 3.1
5-4
Click the Options button, the following dialogue box will appear:
Under Automatic scheduling and leveling, make sure that Schedule automatically is selected, then click OK
If you turn the automatic schedule on, that means, P3 will always recalculate the dates if any new data and/or editing took place in your project
This method will not produce any schedule reports, which will deprive the user from knowing and documenting the changes happened on the dates through out the development of the plan
We don’t recommend this method
Module 5: First Schedule Run
5-5
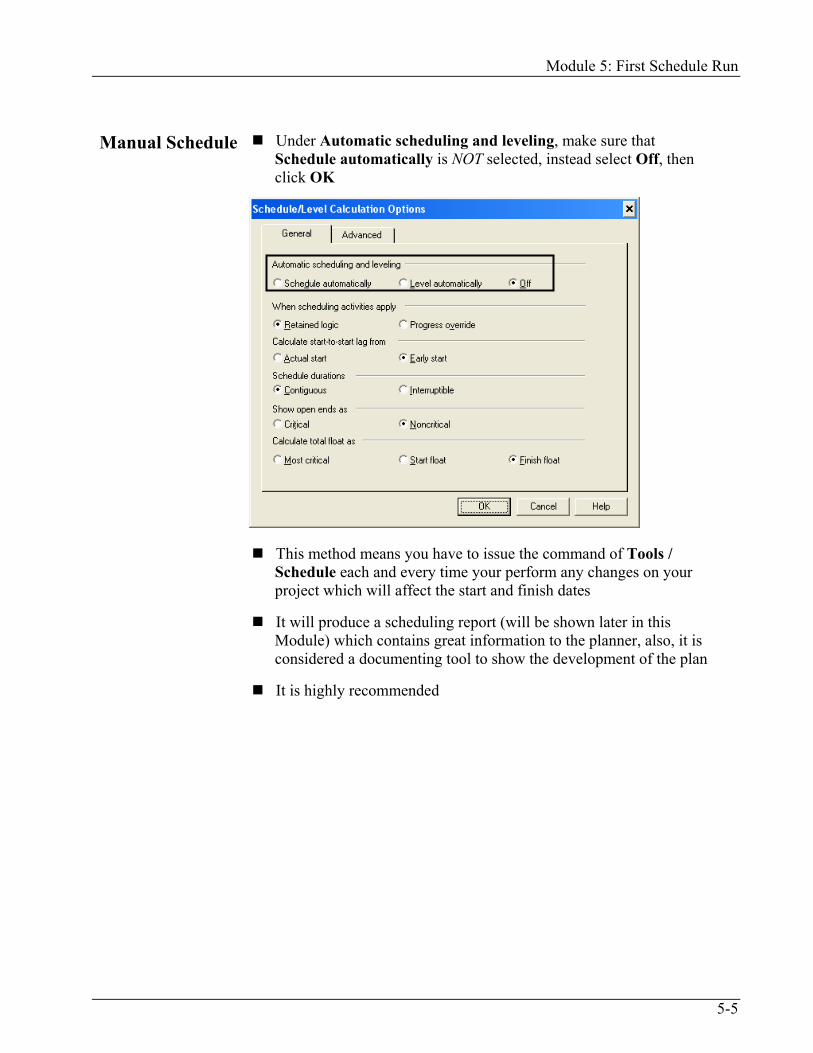
Manual Schedule Under Automatic scheduling and leveling, make sure that
Schedule automatically is NOT selected, instead select Off, then click OK
This method means you have to issue the command of Tools / Schedule each and every time your perform any changes on your project which will affect the start and finish dates
It will produce a scheduling report (will be shown later in this Module) which contains great information to the planner, also, it is considered a documenting tool to show the development of the plan
It is highly recommended

Using Primavera Project Planner Ver. 3.1
5-6
The Schedule Passes
When the user issue the Schedule command, P3 will perform two passes:
• Forward Pass, which will start from the first activity with no predecessor, all the way to the last activity with no successor
• Backward Pass, which will start from the last activity with no successor, all the way to the first activity with no predecessor
Forward Pass To calcualte the Early Start (ES), and the Early Finish (EF), which we call them Early dates
Early dates are the earliest dates an activity can start and finish after the finish of its predecessor(s)
P3 will first locate the first activity with no predecessor. It could be more than one activity
The ES of the first activity is the start date of the project (which you input when you created the project)
To calcualte the EF, P3 will use the following EF=ES+Dur-1
Why the -1? Comparing to the text books in management, this formula is different. The formula used there is EF=ES+Dur. The answer to that question is; text books starts at day 0, which is not practical. Yet in P3 we start at day 1, and hence we have to deduct 1 from the duration
See the following example:
OD=4 EF=4ES=1
Activity A
OD=16 EF=24ES=9
Activity C
OD=8 EF=8ES=1
Activity B

Module 5: First Schedule Run
5-7
Note Activity C, waited for all of its predecessors to finish, hence started
at day 9
The calculated finish date of this small project derived from the EF of the last activity, which is 24 days
Backward Pass To calcualte the Late Start (LS), and the Late Finish (LF), which we call them Late dates
Late dates are the latest dates an activity can start and finish without delaying the calculated finish date of the project
P3 will locate the last activity with no successor. It could be more than one activity
The LF of the last activity is the calcualted EF which was produced in the Forward Pass
To calcualte the LS, P3 will use the following LS=LF-Dur+1
As we deduct 1 in the Forward Pass, we have to add 1 in the Backward Pass, so we can finish with day 1
See the following example:
OD=4 EF=4
LS=5 LF=8
ES=1
Activity A
OD=16 EF=24
LS=9 LF=24
ES=9
Activity C
OD=8 EF=8
LS=1 LF=8
ES=1
Activity B
Note LF of activity A, and B is the day before LS of activity C, hence the LF is day 8

Using Primavera Project Planner Ver. 3.1
5-8
Total Float
As a result of the Forward Pass, and Backward Pass, four dates will be produced (namely; ES, EF, LS, and LF)
In view of that, P3 will calculate the Total Float (TF)
Total Float is the number of days you can delay the start of an activity without starting at ES, but without delaying the whole project
TF = LF – EF
Accordingly the Backward Pass will be:
OD=4 EF=4
LS=5 TF=4 LF=8
ES=1
Activity A
OD=16 EF=24
LS=9 TF=0 LF=24
ES=9
Activity C
OD=8 EF=8
LS=1 TF=0 LF=8
ES=1
Activity B
If there is no Imposed Finish Date (dicussed in the next Module), or any type of Constraint the lowest TF for any activity would be 0 (zero)
We call the activities with TF = 0 Critical activities
We call the activities with TF > 0 Non-Critical activities
We call the path that links the Critical activities; the Critical Path
Critical Path is the longest path in the netwrok
A given network may have more than one Critical Path
We call the above method of calculation, the Critical Path Method (CPM)
Module 5: First Schedule Run
5-9
Free Float
P3 also will calculate the Free Float (FF)
Free Float is the number of days you can delay the start of an activity without starting at ES, but without delaying the successor
TF = ES of the successor - EF of the activity - 1
FF can be equal to TF, and can be different
Other Data Checked for While Scheduling
As you can see from the previous discussion, when the user issues the Schedule command, P3 will calculate six types of data, which they are:
• Two Early Dates (ES, EF)
• Two Late Dates (LS, LF)
• Two Floats (TF, FF)
Other data checked for, while scheduling are:
• Circular Loops
• Constraints Activities
• Open Ends Activities
• Out-of-Sequence Activities
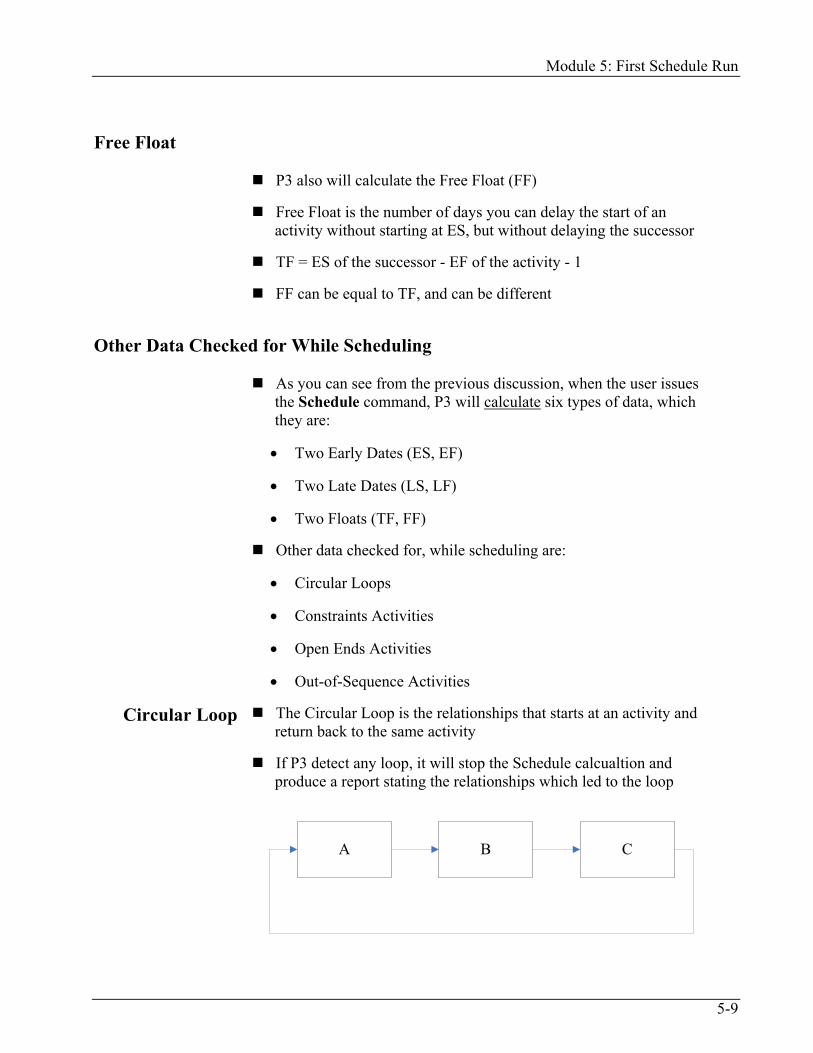
Circular Loop The Circular Loop is the relationships that starts at an activity and return back to the same activity
If P3 detect any loop, it will stop the Schedule calcualtion and produce a report stating the relationships which led to the loop
A B C
Using Primavera Project Planner Ver. 3.1
5-10
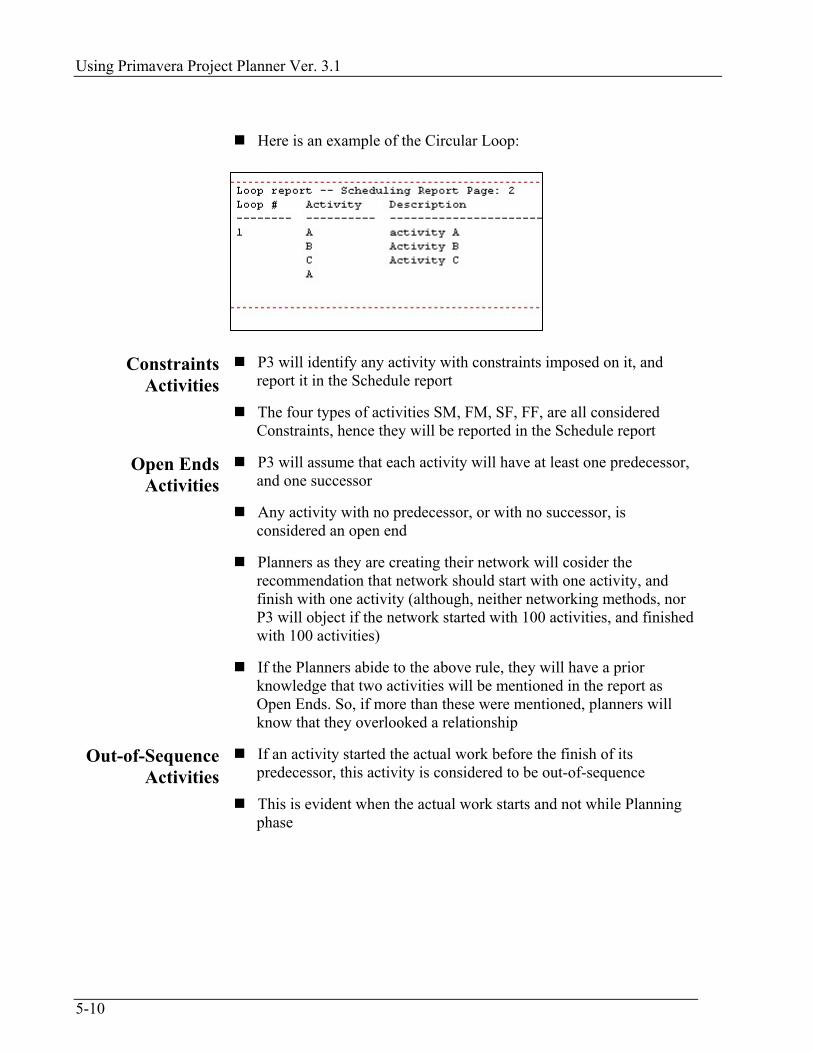
Here is an example of the Circular Loop:
Constraints Activities
P3 will identify any activity with constraints imposed on it, and report it in the Schedule report
The four types of activities SM, FM, SF, FF, are all considered Constraints, hence they will be reported in the Schedule report
Open Ends Activities
P3 will assume that each activity will have at least one predecessor, and one successor
Any activity with no predecessor, or with no successor, is considered an open end
Planners as they are creating their network will cosider the recommendation that network should start with one activity, and finish with one activity (although, neither networking methods, nor P3 will object if the network started with 100 activities, and finished with 100 activities)
If the Planners abide to the above rule, they will have a prior knowledge that two activities will be mentioned in the report as Open Ends. So, if more than these were mentioned, planners will know that they overlooked a relationship
Out-of-Sequence Activities
If an activity started the actual work before the finish of its predecessor, this activity is considered to be out-of-sequence
This is evident when the actual work starts and not while Planning phase

Module 5: First Schedule Run
5-11
Schedule Command
From menus select Tools/Schedule
Or from toolbar, click Schedule button, the following dialogue box will appear:
Specify Data Date, as mentioned in Module 1, Data Date definition is Time Now:
• In the Planning phase the Data Date is always the first day of the project as defined when the project was created
• Once you start inputting actual data, Data Date will be the day of which you performed the schedule in
If you want to include in you report:
• Constraint listing, click this checkbox on
• Open Ends listing, click this checkbox on
• Out-of-Sequence activities listing, click this checkbox on
Click Schedule Now button, the following dialogue box will appear:
Using Primavera Project Planner Ver. 3.1
5-12
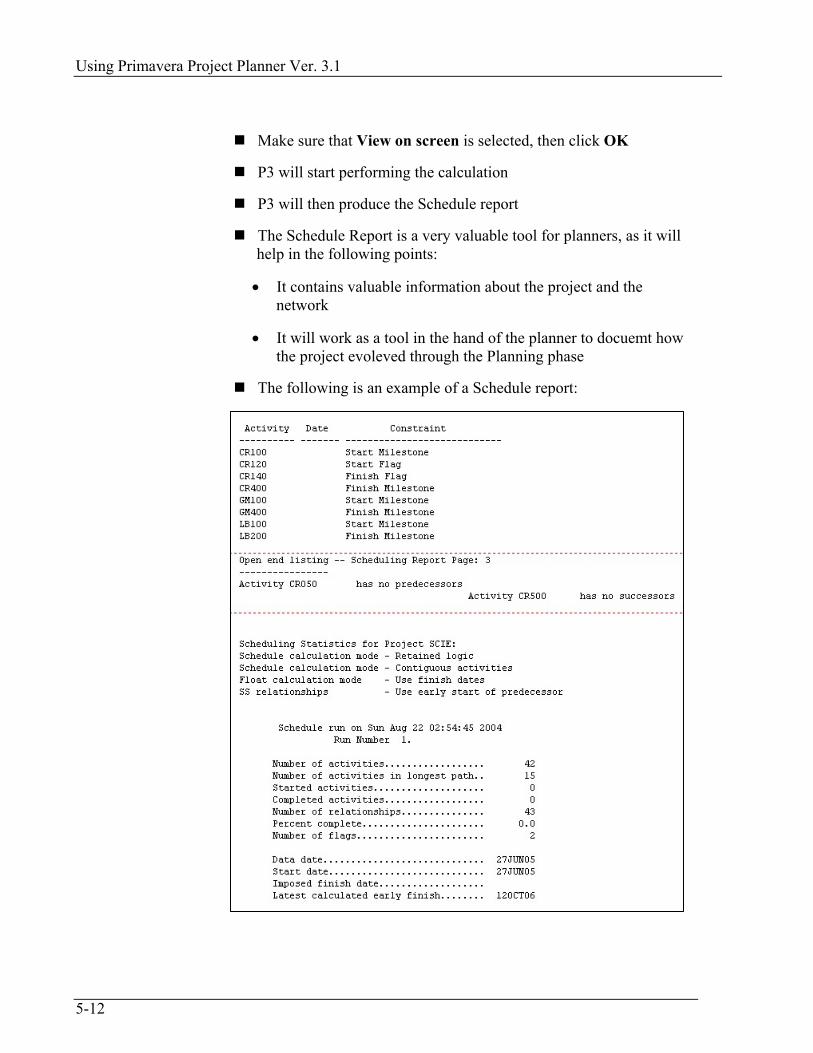
Make sure that View on screen is selected, then click OK
P3 will start performing the calculation
P3 will then produce the Schedule report
The Schedule Report is a very valuable tool for planners, as it will help in the following points:
• It contains valuable information about the project and the network
• It will work as a tool in the hand of the planner to docuemt how the project evoleved through the Planning phase
The following is an example of a Schedule report:

Module 5: First Schedule Run
5-13
Note If you press F9 the following dialogue box will appear:
This is identical to the command above except it will not produce the report

Using Primavera Project Planner Ver. 3.1
5-14
Calculate the Schedule
Workshop 5
1. Open SCIE project
2. Using Tools/Schedule calculate the schedule using the default Data Date, making sure that all the checkboxes are on. Click Schedule Now
3. From the Schedule report answer the following questions:
a. How many activities in your project? ______________ (42)
b. How many critical activities do you have in your project? ______________ (15)
c. How many relationships are there in your project? ______________(43) (Hint: the number 43 is excluding the two relationships of the two Flags)
d. How many Flags defined in your project?____________ (2)
e. When the project will finish? _______________(12OCT06)

Module 5: First Schedule Run
5-15
The View after Schedule
We recommend, that immediately you close your project and re-open it again, so the sorting will take place
You will see two groups of activities:
• Red Activities, which means Critical activities
• Green Activities, which means Non-Critical activities
Activities will be sorted according to their ES, and then TF, therefore the list of activities will be different

Using Primavera Project Planner Ver. 3.1
5-16
Schedule Report
P3 is equipped with lots of pre-defined tabular reports, One of these is the Schedule Report
From menus select Tools/Tabular Reports/Schedule, the following dialogue box will appear:
Click the Add button, the following dialogue box will appear:
Each Schedule report will have an ID, starting with the letters SR, then a sequential number (which is given by P3), click Add, to accept the number. The dialogue box in the next page will be displayed

Module 5: First Schedule Run
5-17
Type in the Title of the report (highly recommended), so you can utilize it
In Content tab, and under Include the following data, the following applies:
• Leave Activity Code line there. This line shows the basic activity data
• You can add to this basic data other information like Predecessor, Successor, and lots of other types
In Content tab, and under Show these codes on activity code line, you can specify up to five different codes for each activity

Using Primavera Project Planner Ver. 3.1
5-18
Click the Format tab, you will see the following:
Set the Sort by criteria
Select the information to be displayed
Once you are done, click Run button, accordingly the report will be produced, hence you can print it, or save it

Module 5: First Schedule Run
5-19
Notes
Using Primavera Project Planner Ver. 3.1
5-20
Schedule Report
Workshop 6
1. Open SCIE project
2. Produce Schedule report using the following points
a. Title: First Schedule Report
b. In Content tab, and under Activity code line, add Predecessor activity, and Successor activity, make sure to put Skip Lines to 1 for all three of the entries
c. In Format tab, make sure that activities are sorted according to ES, and then TF using Ascending fashion
d. Don’t include in the report Calendar, and Activity Codes
3. Click Run to produce the report
4. Save it under the name Sched01.out
Module 5: First Schedule Run
5-21
Module Review
1. In Schedule, P3 calculates:
a. 6 types of data
b. 5 types of data
c. 2 types of data
d. 4 types of data
2. __________ is the other type of floats after Total Float
3. Total Float is calculated after the Forward Pass
a. True
b. False
4. ES+Duration-1 is the formula to calculate
a. Late Start
b. Late Finish
c. Early Start
d. Early Finish
5. The calculated finish date of the project is
a. Late Finish of the last activity
b. Early Finish of the last activity
c. Late or Early they are equal
d. Imposed Finish Date by the user
6. The activity with _________ color is considered critical activities, but with _______ color they will be non-critical

Using Primavera Project Planner Ver. 3.1
5-22
Module Review Answers 1. a
2. FF
3. b
4. d
5. b
6. Red, Green

6-1
Module 6:
Inputting Activity Calendar This module contains:
What is global calendar
What is individual calendar
Assigning calendars to activities
Imposing a Finish date on the project
Defining Holidays
Printing calendars
Transferring calendars

Primavera Project Planner Ver. 3.1 Level 1
6-2

Module 6: Inputting Activity Calendar
6-3
Introduction
When we created the project, P3 asked two questions:
• Workdays/Week
• Weeks starts on
Let us assume that you answered the first question with 5, and the second question with Monday
Accordingly P3 will create an individual calendar, and its ID is 1, which contains that the working days of the week are Monday, Tuesday, Wednesday, Thursday, and Friday, and the two weekends are Saturday and Sunday
All of the 42 activities we input in our workshop were assigned Calendar 1, hence the Finish date of the project (i.e. 12OCT06) was calculated also based on Calendar 1
However, not all activities will work the same working days. Also, Calendar 1, does not contain any holidays
Activity calendar means calendar attached to an activity, affecting the Schedule calculation of this activity
Schedule will not calculate an ES (for instance) in a day that considered as holiday or weekend in the calendar of an activity
So sometimes one of the techniques to decrease the total duration of projects is to assign the critical activities to calendars with more working days per week

Primavera Project Planner Ver. 3.1 Level 1
6-4
Global Calendar
P3 has a unique calendar called Global calendar
This calendar contains information which will affect the whole project and the other individual calendars
Global Calendar can’t be assigned to activities
From menus select Data/Calendars, the following dialogue box will appear:

Module 6: Inputting Activity Calendar
6-5
From the upper list, click on Global Calendar
Click the Standard button, the following dialogue box will appear:
You can change the following data:
• In which day the week will start
• When the calendar will start (always P3 will assume that calendar will start a year before the starting date of the project)
• When the project will start
• When is the Data Date
• Imposed Finish Date (will be discussed later in this Module)
• If a holiday occurs in a weekend, how should P3 treats it. It is either by turining this rule off, and hence you do it manually. Or turning this rule on, and let P3 handles it, by making the nearest workday as a holiday

Primavera Project Planner Ver. 3.1 Level 1
6-6
Click the Holidays button, the following dialogue box will appear:
The holidays will be defined here will affect all individual calendars, for that reason, we call it Global Holidays
In the table titled Nonworkperiods, specify the holidays. The following rules apply:
• If you have one day holiday, define it in the Start field
• If you have multiple uninterrupted holiday, define the Start field and the Finish field
• If this holiday occurs at the same period every year, make this holiday Repeating
• If you have an interrupted holiday, simply specify the whole holiday in the Nonworkperiods table, then specify the working days within the holiday in the Exceptions table
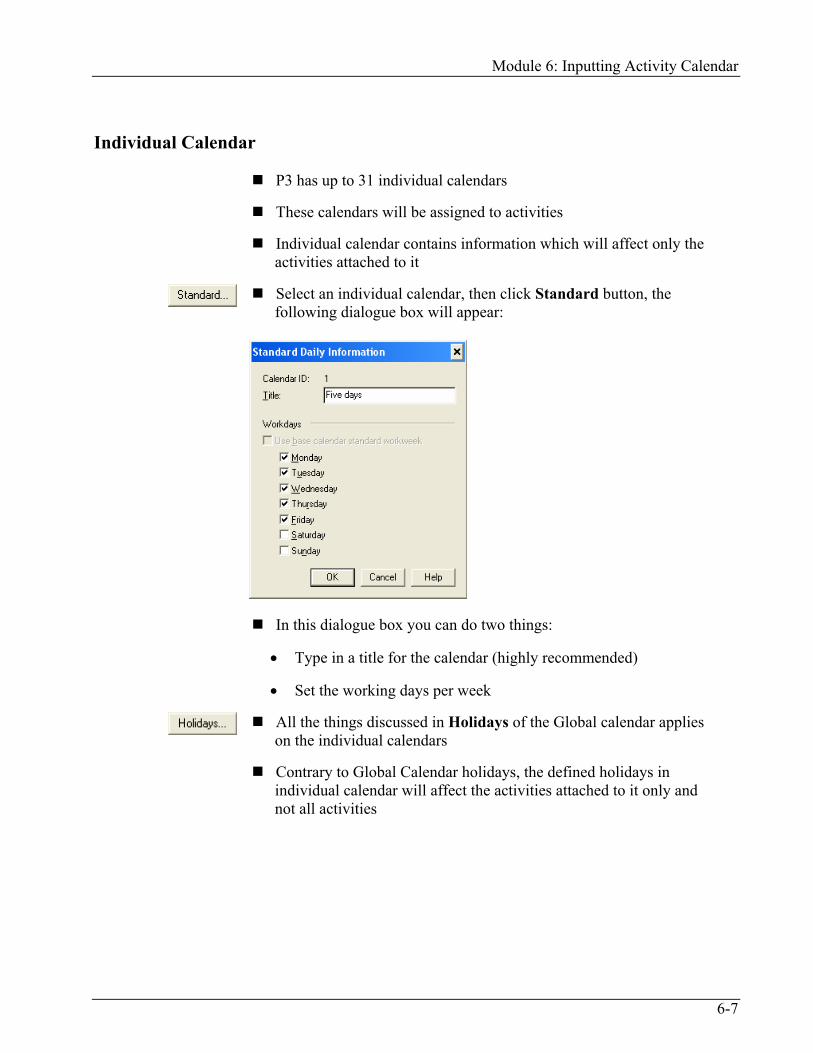
Module 6: Inputting Activity Calendar
6-7
Individual Calendar
P3 has up to 31 individual calendars
These calendars will be assigned to activities
Individual calendar contains information which will affect only the activities attached to it
Select an individual calendar, then click Standard button, the following dialogue box will appear:
In this dialogue box you can do two things:
• Type in a title for the calendar (highly recommended)
• Set the working days per week
All the things discussed in Holidays of the Global calendar applies on the individual calendars
Contrary to Global Calendar holidays, the defined holidays in individual calendar will affect the activities attached to it only and not all activities

Primavera Project Planner Ver. 3.1 Level 1
6-8
How to create
New Individual Calendar
From menus select Data/Calendars, the following dialogue box will appear:
Click Add button, the following dialogue box will appear:
P3 will give it a new ID, which you can change it
Type in the desired title, and click OK

Module 6: Inputting Activity Calendar
6-9
You can see that a new calendar is shown in the list
Make sure it is selected, and click Standards, you will see the following dialogue box:
As you can see from above, when you create a new individual calendar, all of the days will be considered workdays
Click off the desired weekends, and click OK
How to delete an existing calendar
From menus select Data/Calendars
Select the desired calendar
Click Delete button, the following warning message will appear:
If you are sure of what you are doing click Yes, if not click No to stop the precess of deletion

Primavera Project Planner Ver. 3.1 Level 1
6-10
Assigning Individual Calendar to an Activity
Either double-click on the desired activity, or select the activity and press F7
The Activity Form will appear:
Right Click on Cal field, a list of the available individual calendars will be shown, select the desired calendar, and click OK
Imposing a Finish Date on the Project
In Global calendar at the Standard dialogue box, we saw that we can impose a finish date on the project
Most likely this will be the contractual finish date of the project
We need to input it in our project, so we can compare the calculated finish to the imposed finish
It will replace the LF of the last activity:
OD=4 EF=4
LS=3 TF=2 LF=6
ES=1
Activity A
OD=16 EF=24
LS=7 TF=-2 LF=22
ES=9
Activity C
OD=8 EF=8
LS=-1 TF=-2 LF=6
ES=1
Activity B
Module 6: Inputting Activity Calendar
6-11
The difference between the Imposed finish date and Calculated
finish date may be:
• Zero, if they are equal (rare cases)
• Negative, if the Calculated > Imposed (most likely)
• Positive, if the Calculated < Imposed (rare cases)
As you can see in the above example, the TF of the critical path equals to -2, and that is because Calculated > Imposed
The negative TF tells us how many days we need to compress our critical path to meet the contractual finish date of the project
By default negative TF, LS, or LF is not acceptable
We will accept it right now for the sake of completing the rest of data (like resources and costs), and after we are done, we can sit and try to find a solution to compress our critical path
So don’t try to find a definition, or explanation, of negative TF, LS, or LF

Primavera Project Planner Ver. 3.1 Level 1
6-12
Other ways to define Holidays
The method mentioned above to define holidays is the most practical method, but there are other methods
All of the methods applies to the Global holidays, and Individual holidays as well
Double-Clicking Choose a single day, and double click it
It will become hatched indicating it became a holiday
If you are inside the Global calendar, you will see the letter G at the top left of the day:
If you double-click it again, you will turn a holiday to a workday
Using Nonwork button
Select multiple days (consecutive by clicking and dragging, or non-consecutive by using Ctrl key and clicking)
Click Nonwork button, the selected days will become holidays

Module 6: Inputting Activity Calendar
6-13
Also, if you double-click the heading of a day, just like below:
Then you click Nonwork button, this day in the current month will become a holiday
At any moment select a holiday, and click Work button, you will turn it into workday
Printing Calendars
Unfortunately, you can’t preview calendars before printing them
This command will print all your calendars
You have two modes:
• Summary printout
• Detailed printout
Summary printout
It will produce a table contains:
• At the horizontal; list of the calendars
• At the vertical; list of days starting from the start of the project
• At the core of the table the holidays

Primavera Project Planner Ver. 3.1 Level 1
6-14
Example of Surramry printout:
Detailed printout It will print a wall-like calendar, indicating the holidays in each month, starting from the start date of the project

Module 6: Inputting Activity Calendar
6-15
Example of Deatiled printout:

Primavera Project Planner Ver. 3.1 Level 1
6-16
From the Calendars dialogue box, click Print, the following dialogue box will appear:
Select the desired Style, whether Summary, or Details
Select the time Span, and click OK
Transferring Activity Calendars
You can transfer Activity Calendars between projects
Go to the new project you want to transfer to
From menus select Data/Calendars
Click the Transfer button, the following dialogue box will appear:

Module 6: Inputting Activity Calendar
6-17
Transfer
Individual calendar
If you want to copy an individual calendar to another calendar within the same project
Specify the source calendar and the target calendar, then click Transfer
Transfer All calendars
Click All calendars choice, the dialogue box will change to:
Specify the Driver and Folder which the desired project you want to copy from resides in, then specify the project. Now click Transfer
The calendars will be copied to your project

Primavera Project Planner Ver. 3.1 Level 1
6-18
Notes:

Module 6: Inputting Activity Calendar
6-19
Inputting Activity Calendars
Workshop 7
1. Open SCIE project
2. In Global calendar, define the following holidays:
Start End Repeating 17JAN05 21FEB05 17MAR 15MAY05 30MAY05 04JUL 05SEP05 10OCT05 31OCT 02NOV05 11NOV 24NOV05 24DEC05 08JAN06 16JAN06 20FEB06 21MAY06 29MAY06 04SEP06 09OCT06 23NOV06
3. Input the following Exceptions:
Start End Repeating
29DEC05 30DEC05

Primavera Project Planner Ver. 3.1 Level 1
6-20
4. From the Global calendar, impose a Finish date of 15AUG06
5. Type in a new title for Calendar 1 “Five Days Cal”
6. Define the following holidays only for Calendar 1:
Start End Repeating
08MAY06 14JUN 24OCT
7. Create a new individual calendar, which will be assigned ID=2, and give
it the following title “Six Days Cal”, and set the weekend to be only Sunday
8. Assign Calendar 2 to all activates starting with CR (all the Classroom activities) (Hint: Select the first activity which is CR050, press F7, change the calendar, then click Next button on the Activity Form, if the activity starts with CR, change the calendar, if not click Next again, and so on)
9. Run the Schedule command (without changing the DD) to see the effect of the changes you made, reading the report, answer the following questions:
a. What is the Imposed Finish Date of the Project? (15AUG06)
b. What is the Latest Calculated Early Finish of the Project? ____________ (25AUG06)
10. Close the Scheduling report, without saving
11. Select one of the critical activities, double-click on it, and check the value of TF? ___________ (-9)

Module 6: Inputting Activity Calendar
6-21
Module Review
1. You can exchange Calendars between Projects in P3
a. True
b. False
2. __________ can’t be assigned to activities
3. Imposed finish date will replace:
a. ES of the first activity
b. EF of the first activity
c. LF of the first activity
d. LF of the last activity
4. I can preview the calendar printout before printing:
a. True
b. False
5. Negative values of LS, LF, or TF are:
a. Not acceptable, and should be solved before the end of the Planning phase
b. Acceptable
c. If you saw a negative TF, change the value to 0
d. There is no way on earth the value of LS, LF, or TF will be negative
6. I can set the Imposed finish date using Global Calendar, clicking the ____________ button

Primavera Project Planner Ver. 3.1 Level 1
6-22
Module Review Answers 1. a
2. Global Calendar
3. d
4. b
5. a
6. Standard

7-1
Module 7:
Resources and Cost Assignment This module contains:
How to create Resource dictionary?
How to create Cost Account dictionary?
Assigning resources and cost to activity
Viewing resources and cost profiles
Producing tabular resources and cost reports

Using Primavera Project Planner Ver. 3.1
7-2

Module 7: Resources and Cost Assignment
7-3
Introduction
Resources and cost assignment goes into two main steps:
• Creating the Resource Dictionary, and Cost Account Dictionary (or transferring them from other projects)
• Assignment of resources
Most likely you have to create the Resource Dictionary and Cost Account Dictionary once, and then you can transfer them from project to another
For resources, the first step is to create a list of the resources available to complete any project taking into consideration the following:
• Resource name
• Resource unit of measure
• Resource description
• Resource availability (Normal and Maximum)
• Resource unit cost
For cost accounts, create a hierarchy showing the relationship between the different cost accounts, taking into consideration the following:
• Cost account number
• Cost account description
• Cost Category
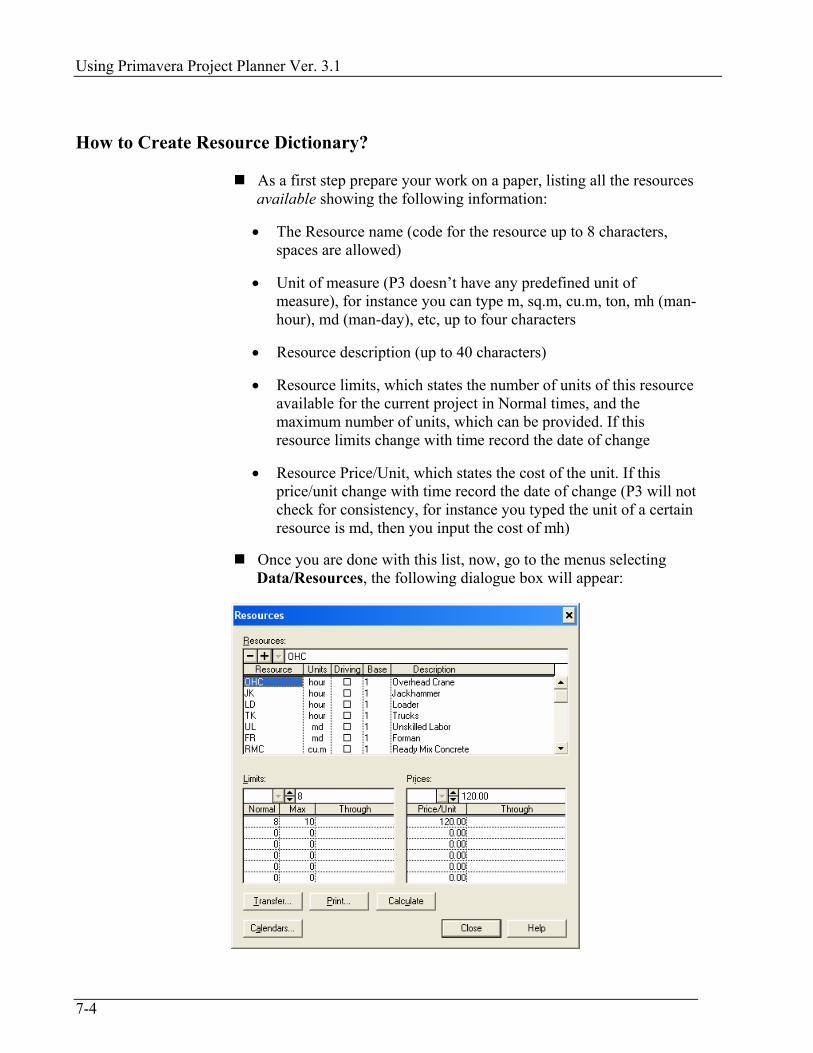
Using Primavera Project Planner Ver. 3.1
7-4
How to Create Resource Dictionary?
As a first step prepare your work on a paper, listing all the resources available showing the following information:
• The Resource name (code for the resource up to 8 characters, spaces are allowed)
• Unit of measure (P3 doesn’t have any predefined unit of measure), for instance you can type m, sq.m, cu.m, ton, mh (man-hour), md (man-day), etc, up to four characters
• Resource description (up to 40 characters)
• Resource limits, which states the number of units of this resource available for the current project in Normal times, and the maximum number of units, which can be provided. If this resource limits change with time record the date of change
• Resource Price/Unit, which states the cost of the unit. If this price/unit change with time record the date of change (P3 will not check for consistency, for instance you typed the unit of a certain resource is md, then you input the cost of mh)
Once you are done with this list, now, go to the menus selecting Data/Resources, the following dialogue box will appear:

Module 7: Resources and Cost Assignment
7-5
It is preferable to do the inputting as follows:
• Input the resource name, the unit, and the description for all of the resources
• Then select the first resource, and specify the limits and price for it, now select the second one and so on
To print the Resource Dictionary, click Print button, the following dialogue box will appear:
Click OK, and produce the report on the screen, you will get something like the following:
To bring a Resource Dictionary from another project, click the Transfer button, the following dialogue box will appear:
The message means, if the resources to come have an idenatical match in the host, they will update them, whereas, the resources with no matching they will be appended
Click OK, the following dialogue box will appear

Using Primavera Project Planner Ver. 3.1
7-6
Specify the Driver and Folder which the desired project you want to copy from resides in, then, at the top portion of the dialogue box specify the project. Now click Transfer
The dictionary will be copied to your project

Module 7: Resources and Cost Assignment
7-7
How to Create Cost Account Dictionary?
First draw the Cost Account tree, which shows how the cost will be broken down, just like below tree:
Expansion
ProjectEP
FinishingCostEP02
ConstructionCostEP01
ConcreteEP0101
Mech/ElecEP0102
SteelEP0103
InternalEP0201
ExternalEP0202
Give for each level of your tree a code
Each code should not exceed 11 characters
Also, develop a one-character (alpha numeric) category code, which will categorize the cost, example may be:
• 1 – Labor
• 2 – Machine
• 3 – Material
You can have up to 36 categories (0-9, and A-Z)
The cost category is considered the 12th character of the cost account, hence cost account can be 11 characters, and can be 12 characters
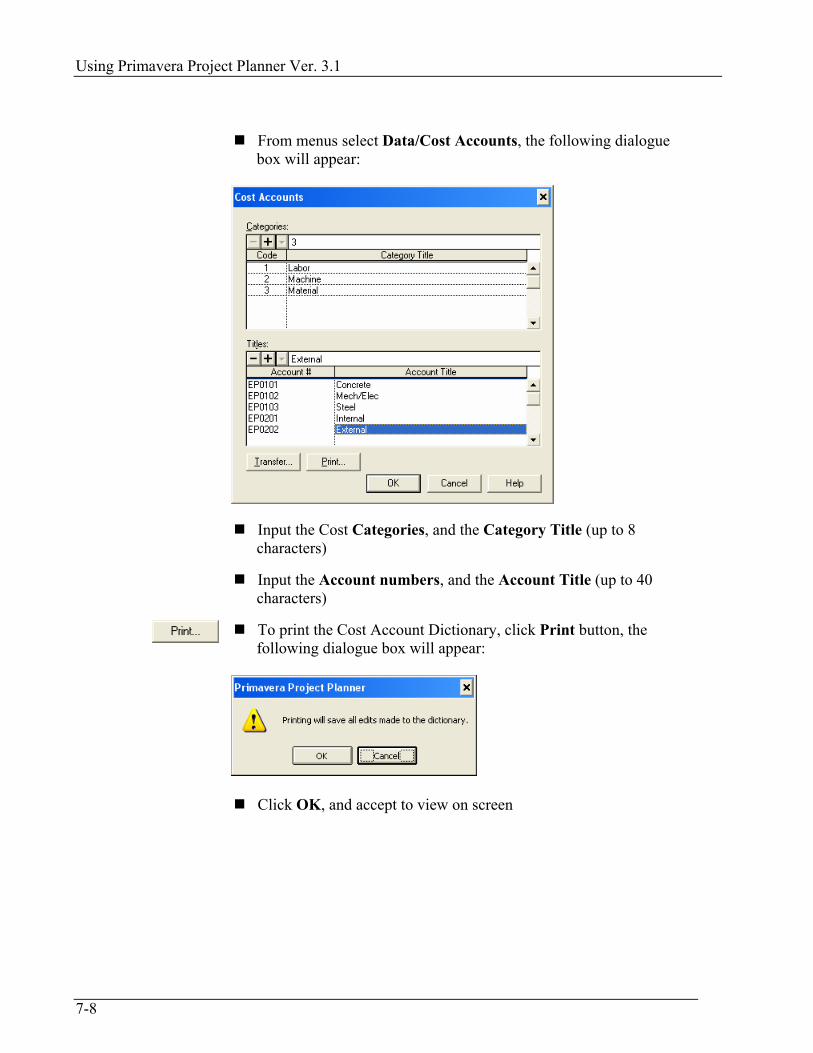
Using Primavera Project Planner Ver. 3.1
7-8
From menus select Data/Cost Accounts, the following dialogue
box will appear:
Input the Cost Categories, and the Category Title (up to 8 characters)
Input the Account numbers, and the Account Title (up to 40 characters)
To print the Cost Account Dictionary, click Print button, the following dialogue box will appear:
Click OK, and accept to view on screen

Module 7: Resources and Cost Assignment
7-9
The following is an example of what you may get:
To bring Cost Account Dictionary from another project, click the Transfer button, the following dialogue box will appear:
Click OK, the following dialogue box will appear

Using Primavera Project Planner Ver. 3.1
7-10
Specify the Driver and Folder which the desired project you want to
copy from resides in, then at the top portion of the dialogue box specify the project. Now click Transfer
The dictionary will be copied to your project

Module 7: Resources and Cost Assignment
7-11
Inputting Resource and Cost Account Dictionaries
Workshop 8
1. Open SCIE project
2. Define the following Resources in Resource Dictionary:
Res Unit Description Nor Max Through Price Through
OHC Hour Overhead Crane 8 10 120 JH Hour Jackhammer 8 10 75 LD Hour Loader 16 24 01SEP05 95 24 32 TK Hour Truck 40 48 55 FR MD Foreman 2 3 20 UL MD Unskilled labor 20 30 8 RMC Cu.m Ready mix Concrete 0 0 50 01OCT05 45
Note Ready Mix Concrete Nor = 0, Max = 0 means it is available with any
quantity desired
3. Define the following Cost Categories in Cost Account Dictionary:
a. 1 – Labor
b. 2 – Machine
c. 3 – Material
4. Define the following Cost Accounts in Cost Account Dictionary:
Cost Account Account Title EP0005 Misc EP0101 Concrete EP0102 Mech/Elec EP0103 Steel EP0201 Internal EP0202 External

Using Primavera Project Planner Ver. 3.1
7-12
Assigning Resources and Cost to Activities
There are two methods to assign cost to activities:
• Assignment of defined resource to an activity with number of units per day, P3 accordingly will multiply the number of days with the number of units with unit price, which will generate a cost assigned to this activity
• Assignment of cost right away without any resources in the middle
We will discuss both methods in this Module
When you assign a resource, P3 will need the following information:
• Resource name
• Resource UPT = Units Per Timeperiod (in our case Units Per Day)
• Cost Account number
• Cost Category
Calculation The first value will be calculated is BQ = Budgeted Quantity which will be based on the following formula:
• BQ = OD * UPT (OD here is Original Duration)
Other values can be calculated based on the following:
• The fist formula is QTC = RD * UPT
• The second formula is QAC = QTC + ATD
• QTC = Quantity of certain resource To Complete certain activity
• RD = Remaining Duration
• UPT = Unit Per Timeperiod
• QAC = Quantity of certain resource At the Completion of certain activity
• ATD = Actual quantity of certain resource from the beginning of certain activity To Date
Module 7: Resources and Cost Assignment
7-13
As for Cost the following formulas apply:
• BC = BQ * Unit Price
• CTC = QTC * Unit Price
• CAC = QAC * Unit Price
• BC = Budgeted Cost
• CTC = Cost To Complete
• CAC = Cost At Completion
Example Assume we have an activity with OD = 6 days, and you assign 2 units per day from a certain resource, which has Unit Price of 10, what are the resource and cost values P3 will calculate:
• BQ = 6 * 2 = 12 units
• BC = 12 * 10 = 120
• QTC = 6 * 2 = 12 units
• CTC = 12 * 10 = 120
• QAC = 12 + 0 = 12 units
• CAC = 12 * 10 = 120
As you can see BQ = QTC = QAC, this is true only in the Planning phase
Also, BC = CTC = CAC which is true only in the Planning phase
Another Way of calculation
Another way would be to input BQ right away without inputting UPT, hence P3 will calculate the values as follows:
• UPT = BQ/OD
The rest will be the same
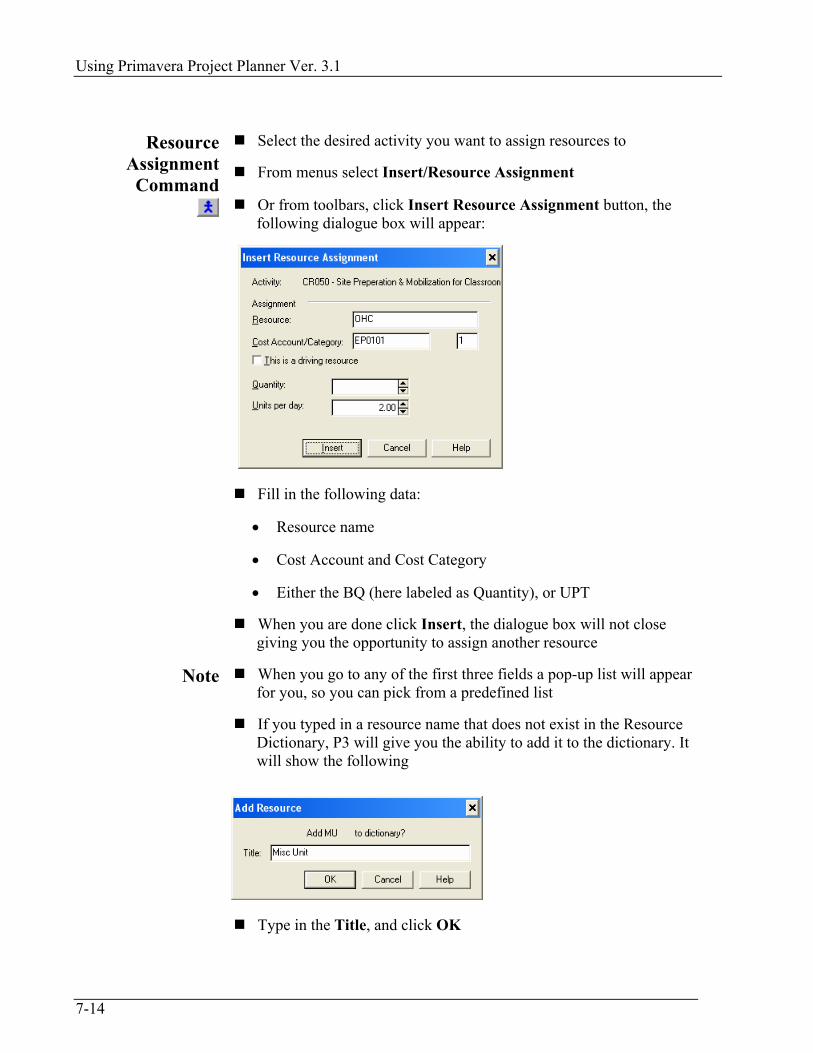
Using Primavera Project Planner Ver. 3.1
7-14
Resource
Assignment Command
Select the desired activity you want to assign resources to
From menus select Insert/Resource Assignment
Or from toolbars, click Insert Resource Assignment button, the following dialogue box will appear:
Fill in the following data:
• Resource name
• Cost Account and Cost Category
• Either the BQ (here labeled as Quantity), or UPT
When you are done click Insert, the dialogue box will not close giving you the opportunity to assign another resource
Note When you go to any of the first three fields a pop-up list will appear for you, so you can pick from a predefined list
If you typed in a resource name that does not exist in the Resource Dictionary, P3 will give you the ability to add it to the dictionary. It will show the following
Type in the Title, and click OK

Module 7: Resources and Cost Assignment
7-15
Another Way of
Assignment Double-click the desired activity
Or select the activity and press F7
Click the Res button, the following form will appear:
From top to bottom input the same types of data we mentioned
Note The only advantage in this method is to see the results right away
Cost Assignment Double-click the desired activity
Or select the activity and press F7
Click Cost button, the following dialogue box will appear:

Using Primavera Project Planner Ver. 3.1
7-16
As you can see from the upper dialogue box, there are two types of
costs:
• Cost generated from resource assignment (the first two)
• Cost NOT generated from resource assignment (the third)
For the second type do the following:
• DON’T input the Resource name
• Input Cost Account and Cost Category
• Input BC
Unit Price change after Resource
Assignment
What if you changed the resource unit price after resource Assignment:
• Go to Resource Dictionary command, and change any resource unit price
• Once you click Close, P3 will produce the following message:
Click Yes, to recalcualte the resource and cost values based on the new prices.
Some Results You can see dierct results of what you are doing, if you go to the activity table, and check the Last two columns at the right, which they are Resource column, and Budgeted Cost column

Module 7: Resources and Cost Assignment
7-17
Assigning Resources and Costs
Workshop 9
1. Open SCIE project
2. Assign the following resources to the following activities (not listed activities means either Milestone or Flag)
Activity Res Cost Account
Cost Category UPT BC
OHC EP0005 2 8 UL EP0005 1 10 CR050 FR EP0005 1 1 LD EP0101 2 16 JH EP0101 2 8 TK EP0101 2 40 FR EP0101 1 1 UL EP0101 1 10
CR105
- EP0101 3 400 OHC EP0005 2 8 UL EP0005 1 10 GM050 FR EP0005 1 1 FR EP0201 1 1 LB105 UL EP0201 1 10 LD EP0101 2 16 JH EP0101 2 8 TK EP0101 2 40 FR EP0101 1 1
GM105
UL EP0101 1 10
3. From the Budgeted Cost column what is the BC for activity CR105? _____________ (110,900)
4. Go to the Resource Dictionary to correct the unit price of TK to be 25
5. What is the new cost of CR105? _______ (80,900)

Using Primavera Project Planner Ver. 3.1
7-18
Resource and Cost Profiles (Histograms)
After you assign resources, and costs you have to take a look at the Resource/Cost Profiles
From menus select View/Resource Profile
Or, from toolbar click Resource/Cost Profile button, the following view will appear:
As you can see there are two scales:
• At the left, the scale is for the histogram
• At the right, the scale is for the cumulative curve
The yellow horizontal line stands for Normal limit, whereas the red line represents the Maximum limit (from the above view you can see the changing limit through the time)

Module 7: Resources and Cost Assignment
7-19
The histogram contains 3 colors:
• Green, which is within the Normal limit
• Yellow, which is between Normal and Maximum limit
• Red, which is above Maximum (overloaded)
When the histogram appears, a small dialogue box appears also:
By default P3 will sort the resources according to alphabetic order, hence the pop-up list will show them in this manner, click pop-up list to select the resource you want to display the histogram for:
Or you can use the Previous and Next button to browse the resources one-by-one
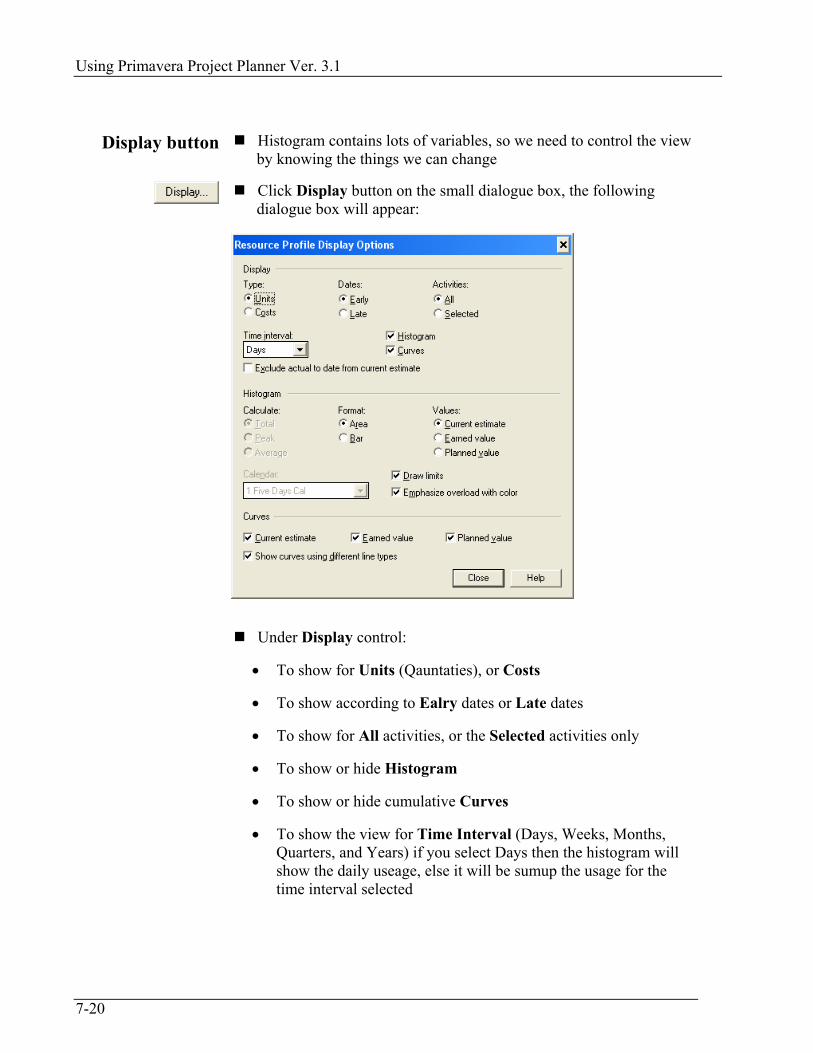
Using Primavera Project Planner Ver. 3.1
7-20
Display button Histogram contains lots of variables, so we need to control the view
by knowing the things we can change
Click Display button on the small dialogue box, the following dialogue box will appear:
Under Display control:
• To show for Units (Qauntaties), or Costs
• To show according to Ealry dates or Late dates
• To show for All activities, or the Selected activities only
• To show or hide Histogram
• To show or hide cumulative Curves
• To show the view for Time Interval (Days, Weeks, Months, Quarters, and Years) if you select Days then the histogram will show the daily useage, else it will be sumup the usage for the time interval selected

Module 7: Resources and Cost Assignment
7-21
Under Histogram control:
• Calculate options, whether Total, Peak, or Average
• Calculate depends on the Time Interval selected in the previous page, it will work only if the Time Interval is not Days
• If you selected to show the Time Interval of Weeks, then select to Calculate the Total usage of the week, or the Peak quantity of the week, or the Average usage of the week
• To show Bars or Area
• To show values for Current Estimate, Earned Value, or Planned Values (we will discuss this later in the Updating Module)
• To Draw Normal and Maximum limits as horizontal lines (yellow and red). This is important if you want to compare availabe to needed resources
• To Emphesize overload with colors (to show green, yellow, and red areas)
• Curves will be discussed in the Module 11
Clicking Bar in Histogram
If you select a Bar format for your display, clicking the bar will display its value
You may get something like:
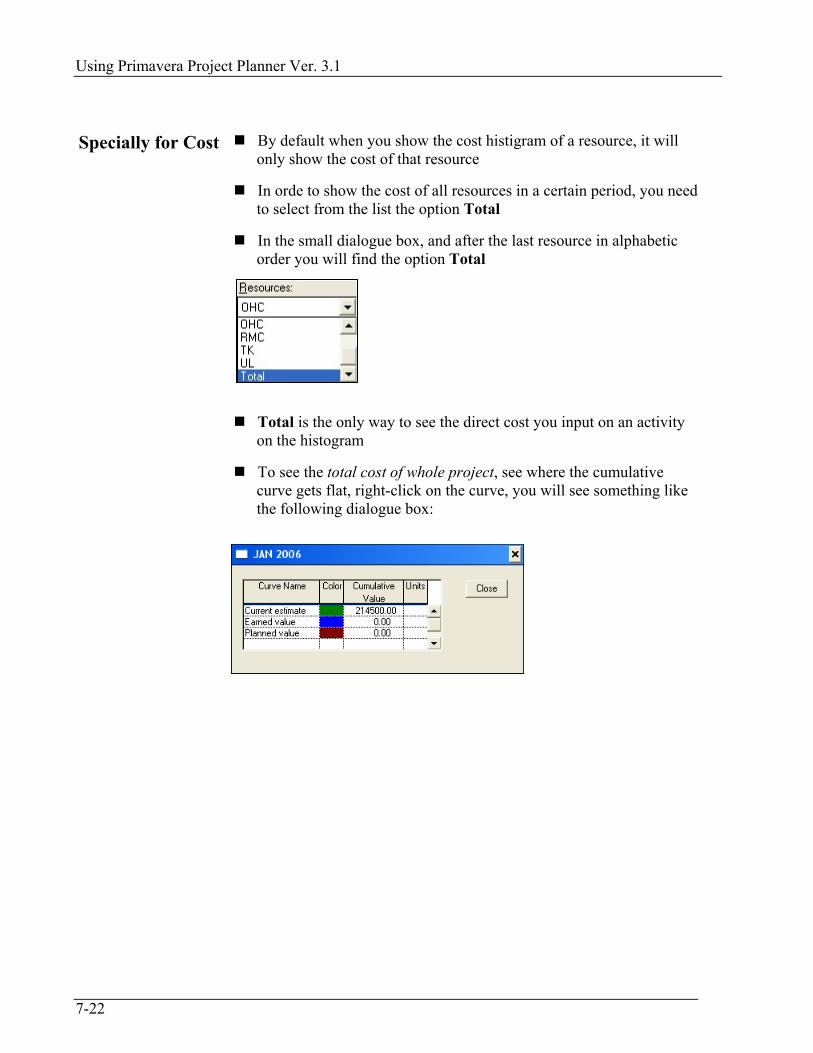
Using Primavera Project Planner Ver. 3.1
7-22
Specially for Cost By default when you show the cost histigram of a resource, it will
only show the cost of that resource
In orde to show the cost of all resources in a certain period, you need to select from the list the option Total
In the small dialogue box, and after the last resource in alphabetic order you will find the option Total
Total is the only way to see the direct cost you input on an activity on the histogram
To see the total cost of whole project, see where the cumulative curve gets flat, right-click on the curve, you will see something like the following dialogue box:

Module 7: Resources and Cost Assignment
7-23
Resource and Cost Tabular Reports
P3 has more than one pre-defined report for resources and costs
If you are working using a method states “resources are the primary cost generator”, then the resources and costs reports will be look-alike
Resource Loading Report
This report will show how the resources were distributed over the time
From menus select Tools/Tabular Reports/Resource/Loading, the following dialogue box will appear:
Click Add button, the following dialogue box will appear:
Accept the default sequential number, and click Add again

Using Primavera Project Planner Ver. 3.1
7-24
The following dialogue box will appear:
Type a good title for your report
Make sure that you are in Resource Selection tab:
• Under Profile if, reight-click, and select EQ
• Under Low Value Resource right-click and select the desired resource to generate report for
Click Format tab:

Module 7: Resources and Cost Assignment
7-25
• Select to Organize the report according to which criteria
• Select to Truncate activity description or not
• Select to Repeat activity title on all horizontal sheets or not
• Select to Display row totals at the Left or at the Right of the page
Click the Timescale tab:
• Select the Date range you want to include in the report, by specifying the Start date and the End date
• Select the Display Unit (Day, Week, Month, Quarter, Year, and 4 weeks period), accordingly select the Usage (Total, Peak or Average)
Click Run, and select to see the report on the screen,

Using Primavera Project Planner Ver. 3.1
7-26
The following is an example of Resource Loading report:
The Cost Loading report is identical to the above except it will
display the cost of the resource and not the quantity
From menus select Tools/Tabular Reports/Cost/Loading, and follow the same procedure you did in the Resource Loading report

Module 7: Resources and Cost Assignment
7-27
The following is an example of Cost Loading report:

Using Primavera Project Planner Ver. 3.1
7-28
Notes:

Module 7: Resources and Cost Assignment
7-29
View Resource/Cost Profiles, and Producing Reports
Workshop 10
1. Open SCIE project
2. Show the Resource Profile, changing the following things:
a. Make sure it is showing Units, Early, All
b. Time interval = Days
c. Show Histogram, and Curves
d. Format = Bar, and Values = Current Estimate
e. Draw Limits = ON
f. Emphasize overload with color = ON
3. From the resource histogram answer the following questions:
a. Is Resource LD overloaded?____________(Yes)
b. What is the approximate timeperiod of overloading? ____________ (within August)
c. What is the maximum limit? And what is the maximum demand in the overloading period? ______________ (24), ____________ (32)
4. Change the following things:
a. Show Cost instead of Units
b. Months instead of Days
c. Make sure that Calculate = Total
d. From the resource list select Total

Using Primavera Project Planner Ver. 3.1
7-30
5. From the cost histogram answer the following questions:
a. What is the total cost in August 2005? _____________(129,384) (Hint: Click the bar representing August)
b. What is the total cost of the whole project up until this moment? ____________________ (214,500) (right-click on the flat part of the curve)
6. Produce a Cost Loading report based on the following inputs:
a. Resource = UL
b. Organize by BLDG
c. Display row totals at the Left
d. Date range = from 27JUN05 to 27JUL05
e. Display Unit = Day
7. After running the report, answer the following questions:
a. How much spent on UL in 01JUL? __________ (160)
b. How much spent on UL for Classroom in the period of a month? ______________ (2,080)
c. How much spent on UL for all Buildings? __________ (3,200)

Module 7: Resources and Cost Assignment
7-31
Module Review
1. I can assign resources first, then add it to the Resource Dictionary
a. True
b. False
2. Resource name must not exceed ____________ characters
3. Budgeted Quantity BQ is equal to:
a. OD * UPT
b. Equal to QTC in the Planning phase
c. Equal to QAC in the Planning phase
d. All of the above
4. You can’t change the resource unit price after you assigned the resource to an activity
a. True
b. False
5. To know the total cost of the project
a. Right-click on the Total option in the resource list
b. Right-click at any place on the curve
c. Right-click at the flat segment of the curve
d. P3 doesn’t calculate the total cost of the project
6. In ______________ tab, I can specify the Date range of the Cost Loading report

Using Primavera Project Planner Ver. 3.1
7-32
Module Review Answers 1. a
2. 8
3. d
4. b
5. c
6. Timescale

8-1
Module 8:
Layouts and Formatting Options This module contains:
What is layout in P3?
Formatting columns
Formatting selected bars
Global Bar formatting

Using Primavera Project Planner Ver. 3.1
8-2

Module 8: Layouts and Formatting Options
8-3
What is Layout in P3?
Old (DOS) version depended on tabular and graphical reports to produce the output of the scheduling and resource/cost loading
These reports (in general) are poor quality reports, and don’t utilize the current technology of printing (laser, color laser, or inkjet printers)
From the starting of the Windows based versions, P3 adopted the concept of Layouts, which if utilized fully can replace almost all of the tabular and graphical reports
Layout is “What you see on your screen” like:
• The list of activity shown on the screen
• Activity columns
• Bar Area
• Colors used
• Timescale
• Date Format
To save a new layout, do the following steps:
• Change all the desired changes on the layout
• From menus select View/Layout/Save As, the following dialogue box will appear:
P3 will give you a sequential number as layout ID, which starts with LT-number, then type in a good title describing your layout, click Save

Using Primavera Project Planner Ver. 3.1
8-4
To make changes on the current layout, and save it under the same
ID, and name:
• From menus select View/Layout/Save
• Or from toolbar, click Save Layout button
To open an existing layout:
• From menus select View/Layout/Open
• Or from toolbar, click Open Layout button, the following dialogue box will appear:
Select the desired layout and click Open
The name of the current layout will appear at the mid position of the status bar
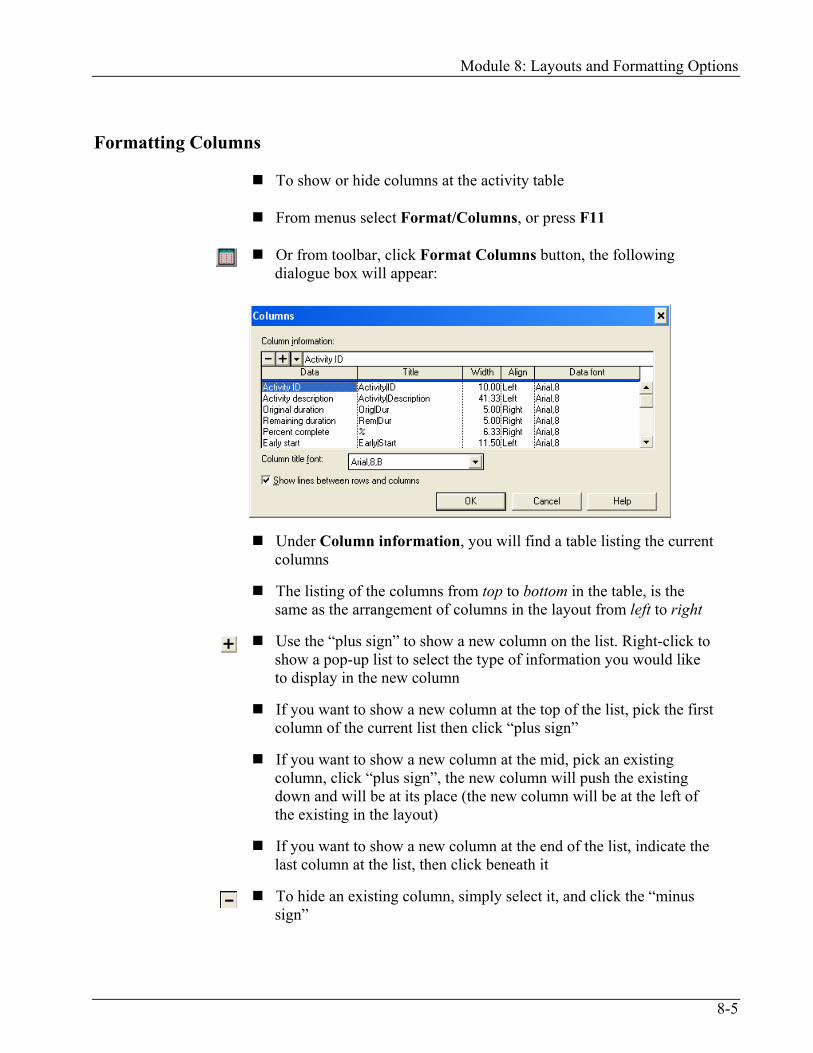
Module 8: Layouts and Formatting Options
8-5
Formatting Columns
To show or hide columns at the activity table
From menus select Format/Columns, or press F11
Or from toolbar, click Format Columns button, the following dialogue box will appear:
Under Column information, you will find a table listing the current columns
The listing of the columns from top to bottom in the table, is the same as the arrangement of columns in the layout from left to right
Use the “plus sign” to show a new column on the list. Right-click to show a pop-up list to select the type of information you would like to display in the new column
If you want to show a new column at the top of the list, pick the first column of the current list then click “plus sign”
If you want to show a new column at the mid, pick an existing column, click “plus sign”, the new column will push the existing down and will be at its place (the new column will be at the left of the existing in the layout)
If you want to show a new column at the end of the list, indicate the last column at the list, then click beneath it
To hide an existing column, simply select it, and click the “minus sign”

Using Primavera Project Planner Ver. 3.1
8-6
While you are in the Columns dialogue box you can change:
• Title of the column (use | to wrap the text to two lines)
• The width of the column
• The aligment of the text in the column (left, center, or right)
• The font which will be used to display the contents of the column
• The font for the titles
• To show or not the lines between rows and columns
Example This is the default column arrangment:
And this is the new arrangment:

Module 8: Layouts and Formatting Options
8-7
Formatting Columns
Workshop 11
1. Open SCIE project
2. Change the columns to look like the following:
3. Take care that Total Float column should display font Size = 9, and Bold
4. Save the layout LT-02, with title My Schedule Layout
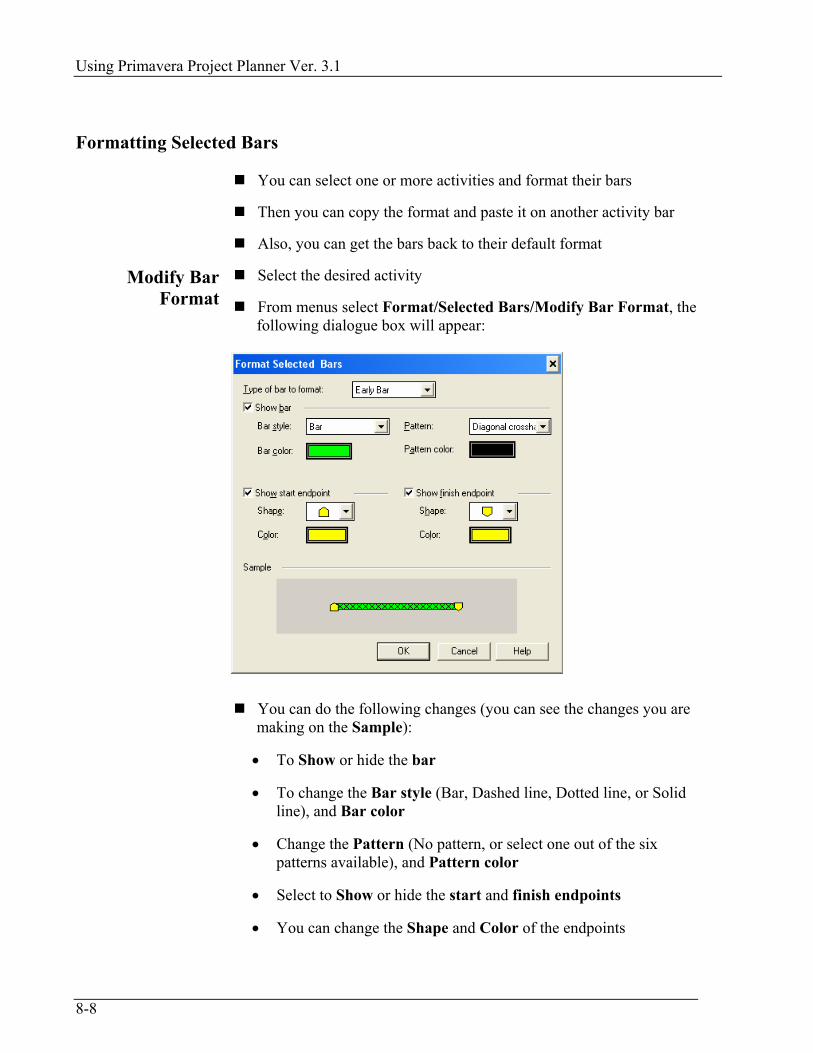
Using Primavera Project Planner Ver. 3.1
8-8
Formatting Selected Bars
You can select one or more activities and format their bars
Then you can copy the format and paste it on another activity bar
Also, you can get the bars back to their default format
Modify Bar Format
Select the desired activity
From menus select Format/Selected Bars/Modify Bar Format, the following dialogue box will appear:
You can do the following changes (you can see the changes you are making on the Sample):
• To Show or hide the bar
• To change the Bar style (Bar, Dashed line, Dotted line, or Solid line), and Bar color
• Change the Pattern (No pattern, or select one out of the six patterns available), and Pattern color
• Select to Show or hide the start and finish endpoints
• You can change the Shape and Color of the endpoints

Module 8: Layouts and Formatting Options
8-9
Copying and Pasting Bar
Format
Select the activity you want to copy the bar format from
From menus select Format/Selected Bars/Copy Bar Format, the following dialogue box will appear:
Select the Bar type, and click Copy
Select the activity you want to copy the bar format to
From menus select Format/Selected Bars/Paste Bar Format, the bar format will change to be identical to the source bar
Use Default Bar Format
To get the bar look exactly as it was by default
Select the activity
From menus select Format/Selected Bars/Use Default Bar Format, the following dialogue box will appear:
Click OK, the bar automatically takes the default bar format
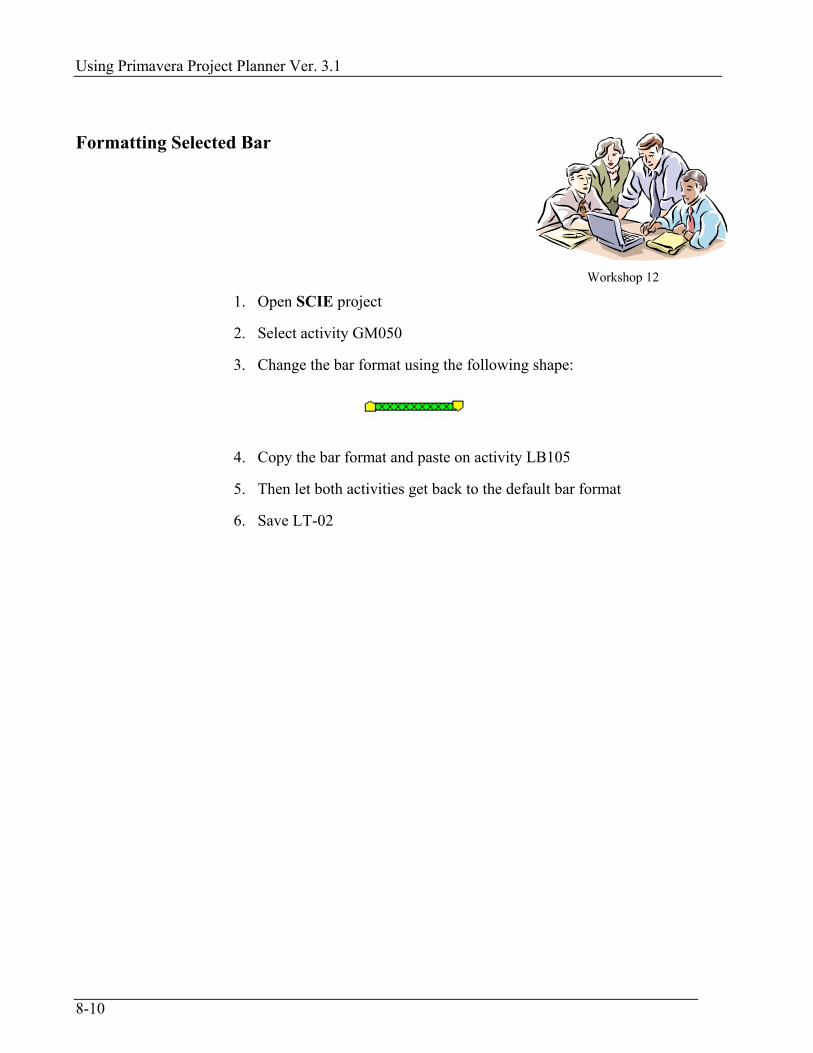
Using Primavera Project Planner Ver. 3.1
8-10
Formatting Selected Bar
Workshop 12
1. Open SCIE project
2. Select activity GM050
3. Change the bar format using the following shape:
4. Copy the bar format and paste on activity LB105
5. Then let both activities get back to the default bar format
6. Save LT-02

Module 8: Layouts and Formatting Options
8-11
Global Bar Formatting
To format all the bars from a certain type (Early, Late, Float, etc.)
From menus select Format/Bars, or press Ctrl+F11
Or from toolbar click Format Bars button, the following dialogue box will appear:
By default P3 created 4 bars for you, they are:
• Early bar at postion 1, Visible
• Float bar at Postion 1, Visible
• Late bar at postion 2, Invisible
• Resource Early bar at postion 3, Invisible
Postion here means the vertical postion of the bar if more than one bar was visible, hence the Eraly, and Float bars, should appear above Late , and Resource Early bars

Using Primavera Project Planner Ver. 3.1
8-12
Choose whether to show or not on the bar , the red color identifying
critical activity
Also select whether you want to show necking on the activity when holiday occurs, chech the shape below:
Under Also neck for, specify where should P3 use necking:
• Both Holidays and Weekends
• Holidays only
• Weekends only
• Neither Holiday nor Weekends
Create New Bar If you want to add new bar to the list do the following steps:
• Click “plus sign”, the following dialogue box will appear:

Module 8: Layouts and Formatting Options
8-13
• Type in a good Desription
• Specify the vertical Postion of the bar
• Specify the Start and End points of the bar (choose from ES, EF, LS, LF, etc.)
• Specify the Bar; choosing from Bar (thick line), Dashed line, Dotted line, and Solid line
• Specify the Size of the Strat, End, and Bar
• Specify the Postion of the endpoints, select from Above, Center, and Below. Check the shape below:
• Select whether you want to outline the two endpoints and the bar with thin black line. Check the shape below:
• Select whether you want to show or hide any of the two endpoints or the bar itself. Check the shape below:
• Also, you can specify the size of the Milestone
• And the color of the bar (avoid using green, or red)
Modifying Existing Bar
To modify an existing bar, follow one of the following methods:
• Double-click the Bar Description
• Or click the Modify button
The rest is the same as creating a new bar

Using Primavera Project Planner Ver. 3.1
8-14
Adding Labels You can add labels in 10 places around the bar, they are:
• Bottom
• Bottom-left
• Bottom-right
• Top
• Top-left
• Top-right
• Left
• Right
• Leftmost
• Rightmost
Whether you are adding a new bar, or modifying an existing bar, select Label tab, you will see the following dialogue box:
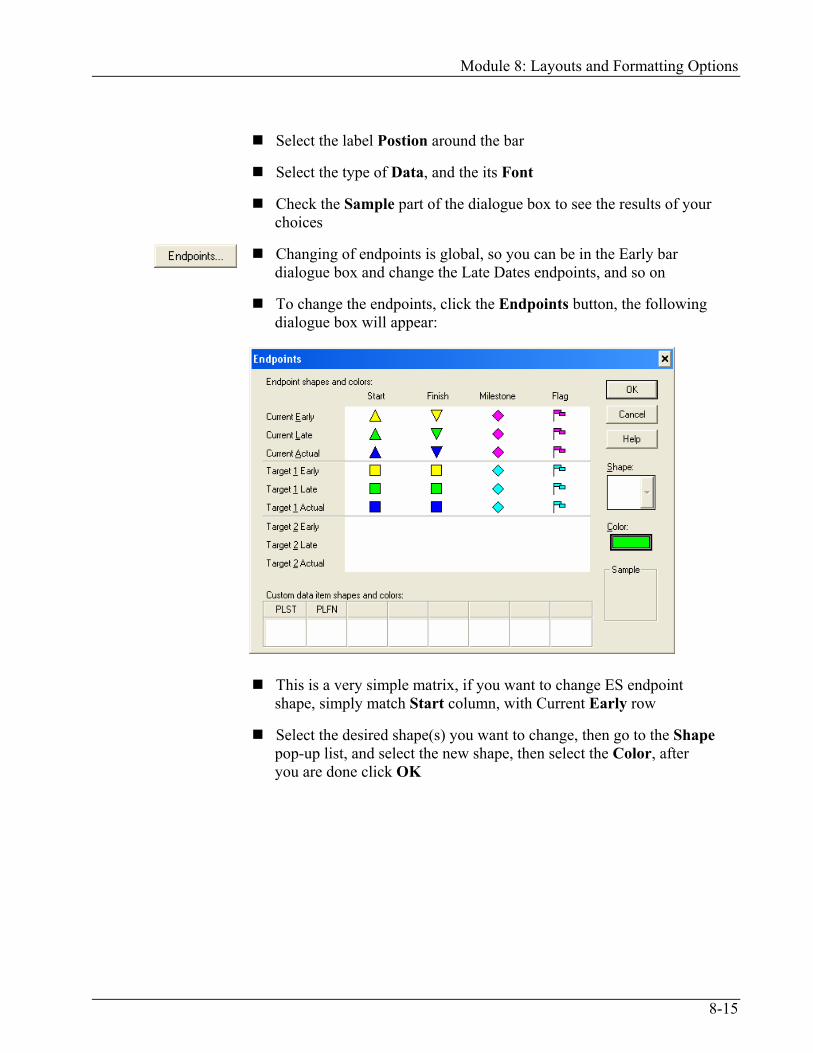
Module 8: Layouts and Formatting Options
8-15
Select the label Postion around the bar
Select the type of Data, and the its Font
Check the Sample part of the dialogue box to see the results of your choices
Changing of endpoints is global, so you can be in the Early bar dialogue box and change the Late Dates endpoints, and so on
To change the endpoints, click the Endpoints button, the following dialogue box will appear:
This is a very simple matrix, if you want to change ES endpoint shape, simply match Start column, with Current Early row
Select the desired shape(s) you want to change, then go to the Shape pop-up list, and select the new shape, then select the Color, after you are done click OK

Using Primavera Project Planner Ver. 3.1
8-16
Formatting Bars
Workshop 13
1. Open SCIE project
2. Make the Row Height Automatic for All activities
3. Make the Float bar invisible, and the Late bar visible
4. Make changes to the bars to look like the following:
5. Taking into consideration the following points:
a. Late bar position is 3
b. Activity ID at the Top of the Early bar (using Bold font)
c. ES at the left, and EF at the right of the Early bar
d. LS at the left, and LF at the right of the Late bar
e. Change the Late bar endpoints to look like the ones in the above display
f. Don’t forget to hide the relationships
6. Save LT-02

Module 8: Layouts and Formatting Options
8-17
Module Review
1. In Layout you may change:
a. Activity table
b. Bar Area
c. Dates
d. All of the above
2. You can access Column formatting using Format/Columns, or press _________________
3. P3 has 4 predefined bars, and I can’t add to the list any new bar:
a. True
b. False
4. You add labels around the bar using:
a. 8 different position
b. 10 different position
c. 4 different position
d. 12 different position
5. You may show both Weekends and Holidays as a neck on the bar
a. True
b. False
6. In order to change the shape of the Start and End point of bar click __________ button from anywhere

Using Primavera Project Planner Ver. 3.1
8-18
Module Review Answers 1. d
2. F11
3. b
4. b
5. a
6. Endpoints

9-1
Module 9:
More Formatting Options This module contains:
Timescale formatting
Sight lines formatting
Screen colors formatting
Fonts formatting
Dates formatting
Organize function in P3
Summarizing activities
Filters in P3

Using Primavera Project Planner Ver. 3.1
9-2

Module 9: More Formatting Options
9-3
Formatting Options
User can utilize more than one function available in P3 to change the shape of the layout
These functions include:
• Timescale
• Sightlines
• Screen Colors
• Fonts
• Dates
• Organize the Activities
• Summarize
• Filters

Using Primavera Project Planner Ver. 3.1
9-4
Timescale Formatting
To change density and contents of the timescale
From menus select Format/Timescale, or right-click the timescale itself, the following dialogue box will appear:
Change the Density of the timescale; if you move the slider to the right the timescale will be expanded, hence you will see more time details. If you move the slider to the left, timescale will be compressed, hence less details of time will be displayed
Control when the timescale will start:
• Current start of timescale = SD – 2W
• SD means Start Date of the project
• W means Week, you can use also, D for Days, M for months
• The formula says the start date of the timescale is 2 weeks earlier than the start date of the project
• If you click SD the small button you will see the following:

Module 9: More Formatting Options
9-5
• So you can choose Data Date, and Finish Date
• But if you choose Calendar Date you have to input the exact date, hence there is no formula
The same thing applies to the End date of timescale, as the formula states End date of timescale = FD + 1M
Control the Font to be used for timescale (by logic this should be the same as the fonts used in the titles of the columns – discussed in the previous Module)
Select what is the Minimum time unit; this feature is useful if used along with Density of the timescale. If you have expanded timescale use Days, and if the timescale is compressed use Months
You can show the timescale using Ordinal dates, like:
Or Calendars dates, like:

Using Primavera Project Planner Ver. 3.1
9-6
Sight Lines Formatting
Sight Lines are the horizontal and vertical gray lines appear in the bar area
From menus select Format/Sight Lines, the following dialogue box will appear:
There are four tabs in the is dialogue box, they are:
• Vertical Sight Lines
• Horizontal Sight Lines
• Data Date
• Progress Line
Vertical Sight Lines
Control the Type, Color, and time interval to Display for Major and Minor vertical sight lines
In Type you have 5 different line types
In Color you have three colors to select from
In Display, select a number first, then select Days, Weeks, Months, Quarters, and Years. For example if you typed 2, and selected Weeks then the sight line will be displayed every 2 weeks

Module 9: More Formatting Options
9-7
Horizontal Sight
Lines If you clicked the Horizontal Sight Lines tab, the following will be
displayed:
All what applies for Vertical Sight Lines applies for Horizontal Sight Lines
Data Date Click Data Date tab, you will see the following:
Specify the Thickness, and the Color of the Date Date line

Using Primavera Project Planner Ver. 3.1
9-8
Screen Colors Formatting
The colors used in the following areas:
• The color of the column titles
• The background color of the columns
• The color of the timescale
• The background color of the bar area, etc.
From menus select Format/Screen Colors, the following dialogue box will appear:
The default Color scheme is called P3 Defaults and you will find it in all of the projects. Also, you can’t delete it
There are another three predefined schemes which can be used
Also, you can change the colors, and then select Save Scheme As button to save your selected colors
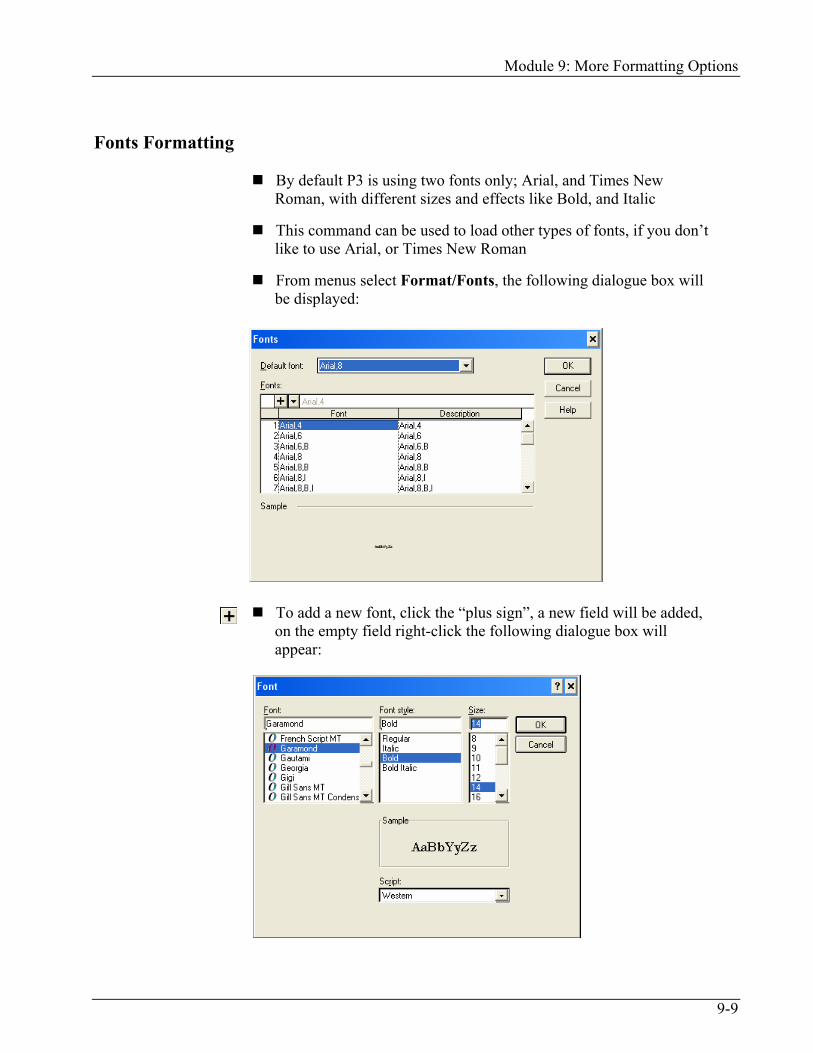
Module 9: More Formatting Options
9-9
Fonts Formatting
By default P3 is using two fonts only; Arial, and Times New Roman, with different sizes and effects like Bold, and Italic
This command can be used to load other types of fonts, if you don’t like to use Arial, or Times New Roman
From menus select Format/Fonts, the following dialogue box will be displayed:
To add a new font, click the “plus sign”, a new field will be added, on the empty field right-click the following dialogue box will appear:

Using Primavera Project Planner Ver. 3.1
9-10
Do the following:
• Select the desired Font
• Select the Font style (Regular, Italic, Bold, or Bold Italic)
• Then select Size
• Click OK
A new font will be available to be used in this project
Dates Formatting
To change how the date looks in all areas of a layout
From menus select Format/Dates, the following dialogue box will appear:
Select one the 8 available Date format
Then select a desired Separator (choose from Space, Dash, Period, or Slash)

Module 9: More Formatting Options
9-11
Organizing
By default P3 will sort activities according to:
• Early Start (in an Ascending order), then
• Total Float (in an Ascending order)
If you want to change the sorting criteria, and re-group activities according to another method, use the organizing feature of P3
From menus select Format/Organize
Or from toolbar, select Organize button, the following dialogue box will appear:
Under Group by, set the following:
• The data you wish to Group the activities according to it
• The Order (Ascending ot Descending)
• The Font
• The color of Background, and Text

Using Primavera Project Planner Ver. 3.1
9-12
• Whether you would like to start each group in a New page or not
• To create Total, at the Bottom, or the Top of the group
The following is an example of what you may get:
Other options You may change the looks of the grouping by clicking “Display all values in one band” checkbox on, this what you may get:

Module 9: More Formatting Options
9-13
If you click Reorganize automatically on, then P3 will make the
necessary changes to the layout once you make any changes to the grouping criteria, like when you add a new activity, or change the value of code attached to that activity
If you click Display unassigned and uncategorized activities on, then any activity which has no value in the current grouping-by criteria, P3 will create a band called Unassigned and group all the unassigned activates under it
Also you can change the sorting method, by changing the Sort by fields
How P3 Calculates the Dates If Totals are Displayed?
When you select to total a certain band, how P3 will calculate the starting, and ending dates of the total bar? and what is its duration?
To know that, assume we are talking about Early bars displayed:
• The start of the total bar is the ES of the first activity in the group
• The finish of the total bar is the EF of the last activity in the group
• The duration of the bar will be the number of working days between the ES and EF
• Based on the above, if you add up the duration of each activity in the group, the summation will not be identical to the number shown at the total band
Reorganize Now
If you are making massive changes to your project, P3 prefers if you turn off the Reorganize automatically checkbox, and make it manually using Reorganize Now command
Also, useful when the Order in Activity Code Dictionary changes
From menus select Format/Reorganize Now
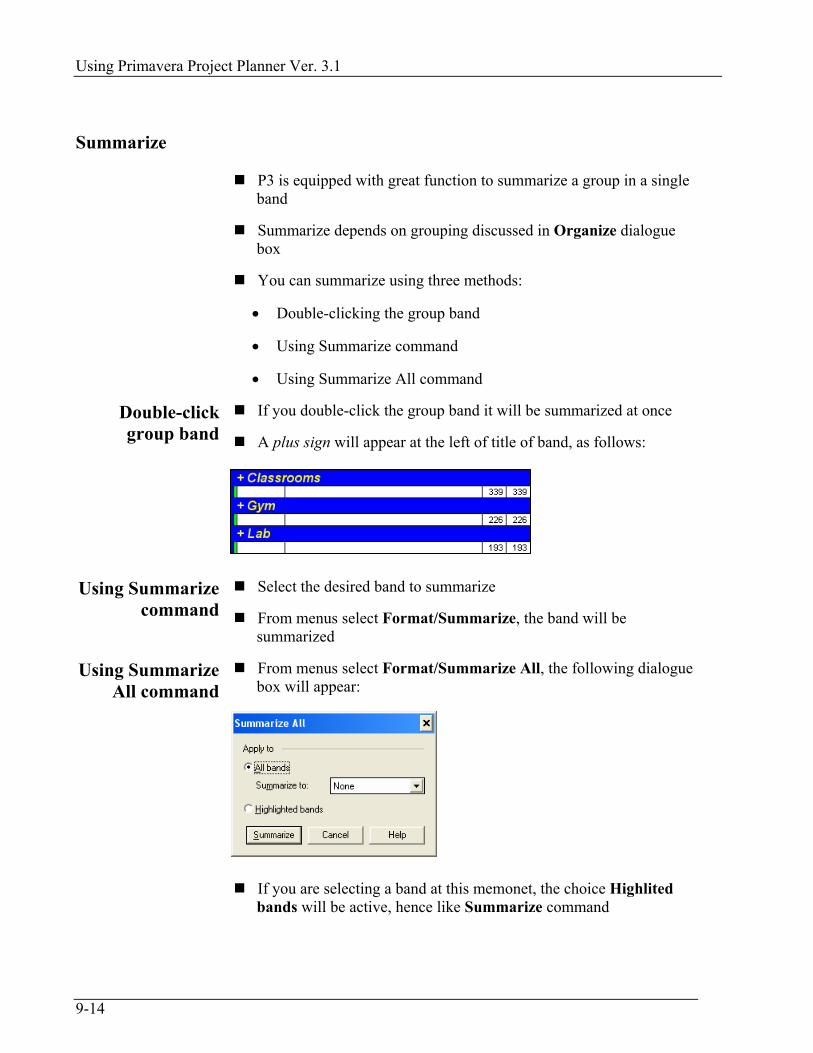
Using Primavera Project Planner Ver. 3.1
9-14
Summarize
P3 is equipped with great function to summarize a group in a single band
Summarize depends on grouping discussed in Organize dialogue box
You can summarize using three methods:
• Double-clicking the group band
• Using Summarize command
• Using Summarize All command
Double-click group band
If you double-click the group band it will be summarized at once
A plus sign will appear at the left of title of band, as follows:
Using Summarize command
Select the desired band to summarize
From menus select Format/Summarize, the band will be summarized
Using Summarize All command
From menus select Format/Summarize All, the following dialogue box will appear:
If you are selecting a band at this memonet, the choice Highlited bands will be active, hence like Summarize command

Module 9: More Formatting Options
9-15
Select All bands choice, then select from the availabe pop-up lis the
band desired to summarize (it depends on the grouping you made before starting this command). Check the following:
Once you selected the band to be summarized, click Summarize, button and all of these bands will be summarized at once, Check the following (we summarized all the Phase bands in one command):
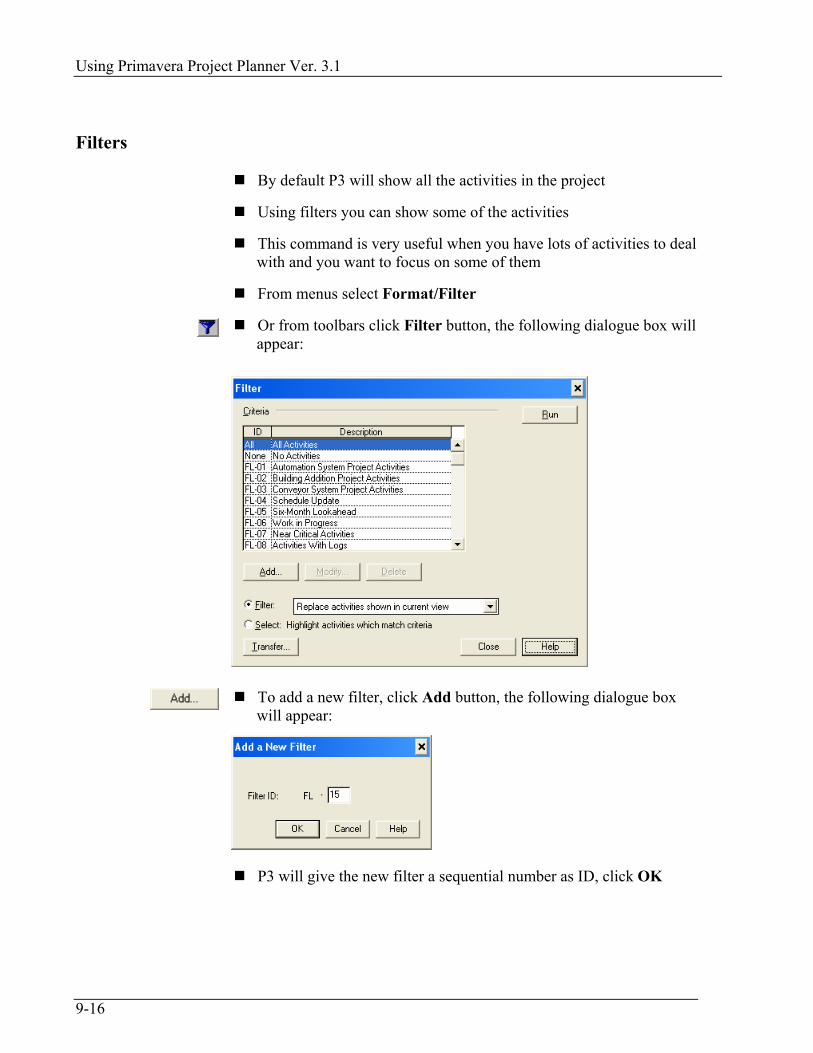
Using Primavera Project Planner Ver. 3.1
9-16
Filters
By default P3 will show all the activities in the project
Using filters you can show some of the activities
This command is very useful when you have lots of activities to deal with and you want to focus on some of them
From menus select Format/Filter
Or from toolbars click Filter button, the following dialogue box will appear:
To add a new filter, click Add button, the following dialogue box will appear:
P3 will give the new filter a sequential number as ID, click OK

Module 9: More Formatting Options
9-17
The following dialogue box will appear:
Type in a good filter title
P3 has 4 levels in each filter. To understand the importance of 4 levels in each filter, assume the following:
• You have 500 activities, you filtered them in level 1, you got 200 activities
• If you defined in your filter level 2, only the 200 actvities will be further filtered in level 2, and so on
Choose which level you want to work with (by default you will be at level 1)
You can have in each level, up to 7 conditions, if this is the case, you have to specify whether P3 uses AND, or OR between the different conditions. All = And, and Any = Or
The table is showing 4 columns, each column should contain a piece of data, as follows:
Select if column Select one of the available P3 data, you will have a pop-up list to select from

Using Primavera Project Planner Ver. 3.1
9-18
Is column Select the logical operator availabe:
• EQ = Equal
• NE = Not Equal
• GT = Greater Than
• LT = Less Than
• WR = Within Range (specially for dates)
• NR = Not within Range
• CN = Contians (specially for text)
• SN = Does not Contain
Low Value column
Can be used with any of the above operators
Right-click to see the availabe values
If date, you can use the formula just like we discussed in the Timescale dialogue box (SD, DD, FD, and Cal)
High Value Used only if WR, or NW
What ever applies to Low Value apply to High Value
Once you are done, click OK
Now click Run
The name of the filter will appear on the right side of the status bar
Note There are a pre-defined filter called All, which can be used to show all activities after user-defined filter showed some of the activities

Module 9: More Formatting Options
9-19
Selecting Using Filters
By default P3 will show only the activities which satisfy the filter conditions
But P3 provides another function for filters, which is to select activities
In the bottom part of the Filter dialogue box:
Select the choice “Select: Highlight activities which match criteria”, then select Run

Using Primavera Project Planner Ver. 3.1
9-20
Formatting Options
Workshop 14
1. Open SCIE project
2. Open LT-01 titled Classic Schedule Layout
3. Make the following changes:
a. Make the Date format as 08.31.04
b. Load Garamond font, size = 10, Bold
c. From Timescale change the font to be Garamond,10,B
d. Do the same thing for the column titles
e. Compress the Timescale a little bit more than the current, and make sure to display Minimum time unit to be Months
f. Make the Major Vertical Sight Line to be displayed each Year, using the Continuous Black line and the Minor each Quarter, using the Small Dashed Light Gray line
4. Group activities according to Building, then Phase, taking into consideration the following points:
a. Font size for Building is Arial, 12, B, I
b. Font size for Phase is Arial, 10, B, I
c. For Building select to show the Total at the Bottom
d. Turn on the Reorganize Automatically
5. Go to Activity Code Dictionary, select the Activity ID tab, change the order of LB to be 3, and GM to be 2
6. Note that nothing changed
7. Select Format/Reorganize Now, and see how the order of the bands changed
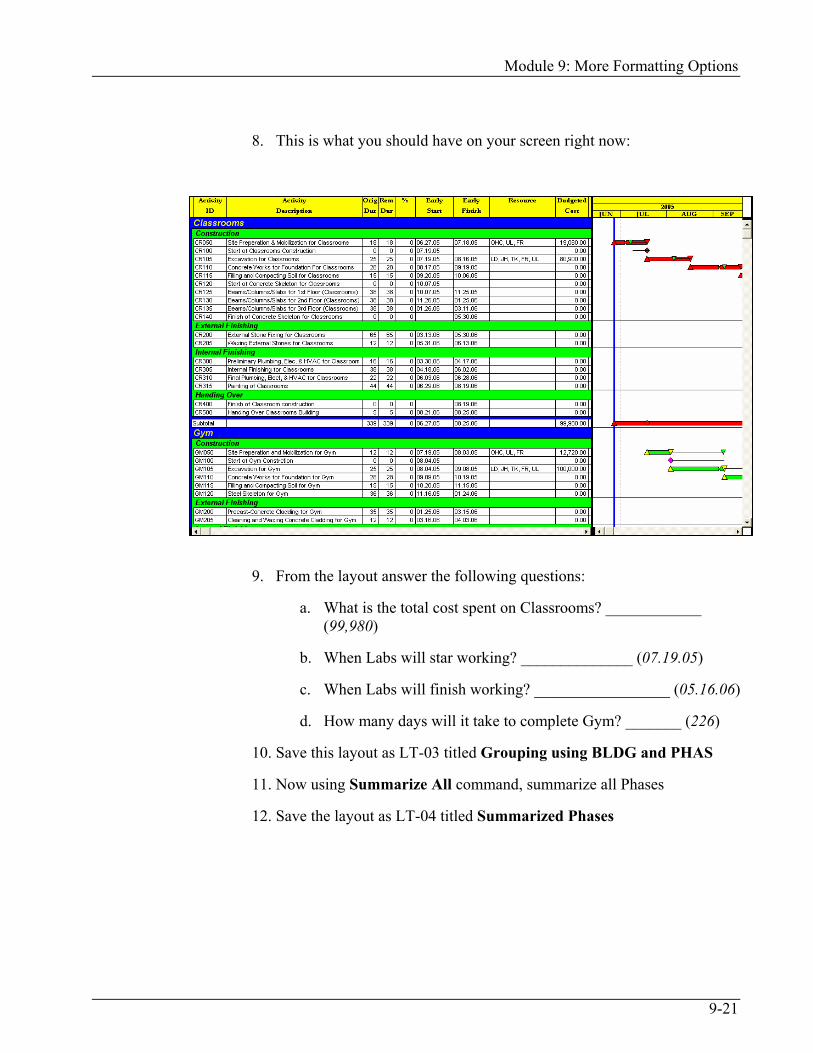
Module 9: More Formatting Options
9-21
8. This is what you should have on your screen right now:
9. From the layout answer the following questions:
a. What is the total cost spent on Classrooms? ____________ (99,980)
b. When Labs will star working? ______________ (07.19.05)
c. When Labs will finish working? _________________ (05.16.06)
d. How many days will it take to complete Gym? _______ (226)
10. Save this layout as LT-03 titled Grouping using BLDG and PHAS
11. Now using Summarize All command, summarize all Phases
12. Save the layout as LT-04 titled Summarized Phases

Using Primavera Project Planner Ver. 3.1
9-22
13. Open LT-01
14. Make and Run a filter to show only the activities matching the following two criteria:
a. Lab activity
b. Starts within the range of SD+00 to SD+2M
15. Save the Layout as LT-05 titled 2 months look ahead

Module 9: More Formatting Options
9-23
Module Review
1. I can change the colors of the screen then save them in a color scheme:
a. True
b. False
2. The only fonts loaded by default in P3 projects are _________________ , ________________
3. In Timescale dialogue box I can change:
a. The minimum time unit displayed in the timescale
b. The Date format
c. The density of the timescale
d. a & c
4. One of the following is not true about Sight Lines
a. There are two types of sight lines horizontal and vertical
b. I can change the thickness of the Data Date line
c. I can control the thickness of the Major vertical line
d. There are two types of vertical sightlines Major, and Minor
5. Reorganize Now is the manual method to let P3 change the layout according to new criteria
a. True
b. False
6. The early start of total bar in grouping is the early start of __________________ in the group
7. Filters can show/hide activities only
a. True
b. False
8. You can summarize lots of similar bands using ___________________ command

Using Primavera Project Planner Ver. 3.1
9-24
Module Review Answers 1. a
2. Arial and Times New Roman
3. d
4. c
5. a
6. the first activity
7. b
8. Summarize All
10-1
Module 10:
Printing Layouts This module contains:
Printer setup
Page setup
Print Preview
Print command

Using Primavera Project Planner Ver. 3.1
10-2

Module 10: Printing Layouts
10-3
Introduction
If you follow the previous two Modules, you will be able to customize layouts as you wish, hence produce lots of reports
The next step will be to print these layouts
Using inkjet printer, B/W laser printers, or colored laser printers, you can produce a very handsome and colorful reports containing activity table and/or activity bar chart
There are four steps to follow to create these printouts:
• Setup your printer
• Setup your page
• Preview and make changes
• Send to printer
Printer Setup
This command will allow you to setup your printer
From menus select File/Print Setup, the following dialogue box will appear:

Using Primavera Project Planner Ver. 3.1
10-4
Check if the default printer is your printer, if not select Specific
Printer and select it from the list (this means your printer should be installed and configured)
If you are using B/W laser printer, it is better to make the choice Use grayscale output on
Select the paper Orientation, you have two choices
• Portrait
• Landscape
Portrait Example The following is Portrait example:

Module 10: Printing Layouts
10-5
Landscape
Example The following is Landscape example:
Now select the paper size you want to use (you will not find any paper size your printer doesn’t support)
Click OK to end the command

Using Primavera Project Planner Ver. 3.1
10-6
Page Setup
Page Setup is the most important command in printing process
In this command you will specify what do you want to print, and how
From menus select File/Page Setup, the following dialogue box will appear:
Under Print, specify the following:
• The Start, and End dates of the printout
• Select the contents of the printout, you have 3 choices; Activity columns, Bars, and Resource/Cost display
Note In order to see the option of Resource/Cost display valid, you should make sure that Resource Profile is displayed on the screen first
You can set the screen separator to show some of the columns and not all columns, then select the option Show visible columns only

Module 10: Printing Layouts
10-7
Under Page settings, specify the following:
• Setup the Margin units, the available choices are; Inches, Centimeters, or Points
• Setup the margins from the four sides; Top, Bottom, Left, and Right
• Select the Timescale placement; the available choices are Top, Bottom, or Both
• Select whether you want to Show timescale/titles on all pages or not
• If you are showing grouping in your layout, what will happen if the page finished before the activity list in this group? Should P3 Repeat group titles in the next page, or just continue listing the rest of activities
• In case of multiple pages printout, what P3 should do with the interior page border? Should P3 Mask (hide) them, to give the user the chance to attach the pages manually? or not?
• By default, P3 will try to deal with the contents of your project versus selected paper size, and get how many pages vertically, and horizontally is needed. If you want to interfere in P3 choices, you can ask P3 to Fit your project in a certain number of pages wide
• The same thing applies for the Resource/Cost profile, as P3 will try to find the best height to fit the displayed profile. You can interfere in this also, by setting the maximum height for the profile

Using Primavera Project Planner Ver. 3.1
10-8
By default the Header is not utilized in P3
We will discuss Footer, and what ever applies for Footer applies for Header
Click the Footer button to setup what will be displayed at the lower part of the printout, the following dialogue box will appear:
Select to Include footer on, the avilabe choices are; First Page, Last Page, All Pages, or No Pages
Input the Height of the Footer (the units displayed depends on Margin units discussed previously)
Define the number of parts the Footer include, you have two chooices either 3, or 5 (the default is 5)
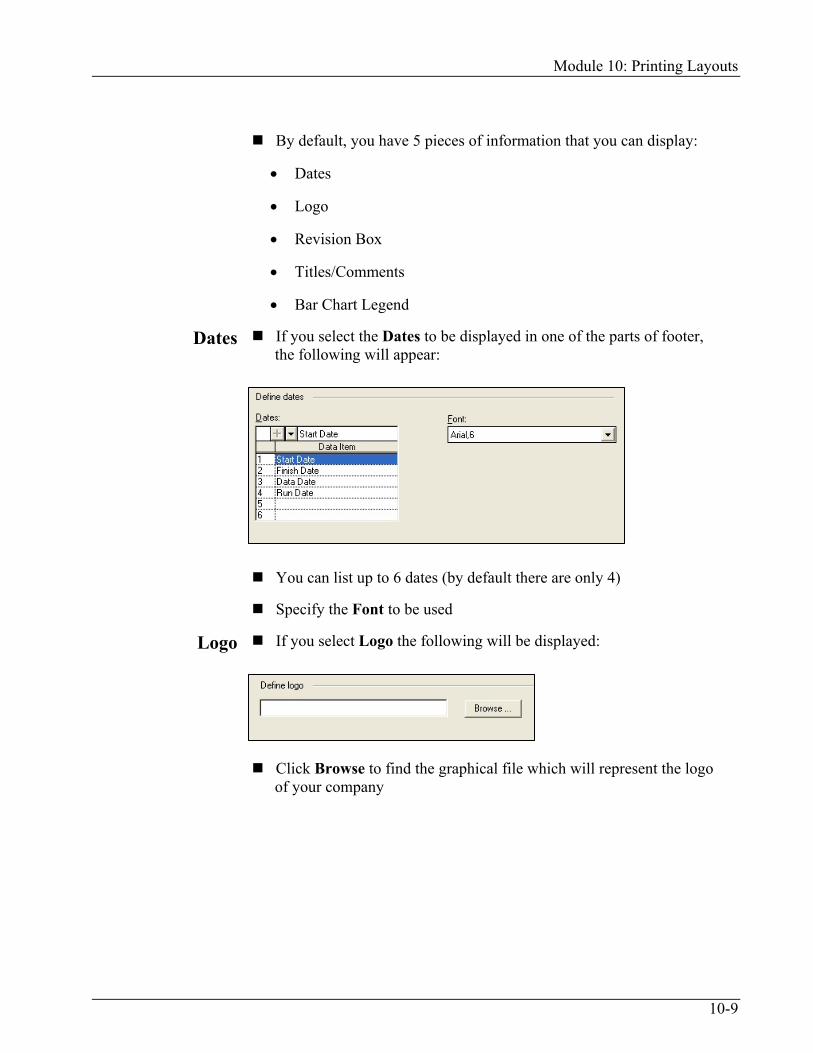
Module 10: Printing Layouts
10-9
By default, you have 5 pieces of information that you can display:
• Dates
• Logo
• Revision Box
• Titles/Comments
• Bar Chart Legend
Dates If you select the Dates to be displayed in one of the parts of footer, the following will appear:
You can list up to 6 dates (by default there are only 4)
Specify the Font to be used
Logo If you select Logo the following will be displayed:
Click Browse to find the graphical file which will represent the logo of your company

Using Primavera Project Planner Ver. 3.1
10-10
Revision Box If you selet Reviosn Box the following will be displayed:
Type in Revision box title
Specify the Font to be used
Fill in the Date of revision, the Revision number, who Checked it, and who Approved it
Title/Comments If you select Title/Comments, the following will be displayed:
In each of the three sections, you can select to Insert a predefined data type, or type your own
Specify the Font to be used in the three sections

Module 10: Printing Layouts
10-11
Bar Chart
Legend If you selected Bar Chart Legend the following will be displayed:
The Bar Chart Legend is predefined. You have to specify the Font which will be used
Print Preview
To see the results of your settings took place in Page Setup command, you have to make the third step which is Print Preview
From menus select File/Print Preview
Or from toolbar click the Print Preview button, the following will be displayed:

Using Primavera Project Planner Ver. 3.1
10-12
At the lower left of the screen you will see how many pages did P3
produce to be printed
Click View All Pages button to view all pages of the printout:
Click View Single Page button to view one page only
Click Zoom button to get closer to the page
In case of multiple pages printout, click the four arrows to navigate through the pages
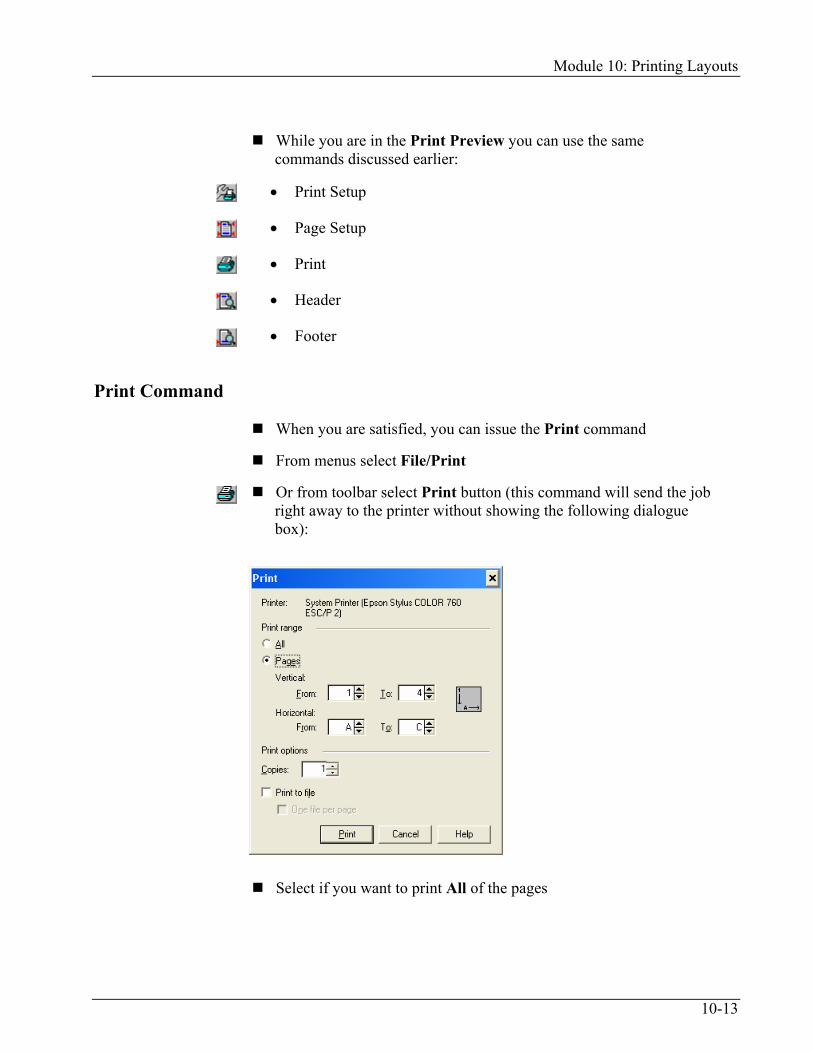
Module 10: Printing Layouts
10-13
While you are in the Print Preview you can use the same
commands discussed earlier:
• Print Setup
• Page Setup
• Header
• Footer
Print Command
When you are satisfied, you can issue the Print command
From menus select File/Print
Or from toolbar select Print button (this command will send the job right away to the printer without showing the following dialogue box):
Select if you want to print All of the pages

Using Primavera Project Planner Ver. 3.1
10-14
If you want to print some of the pages, select Pages, the following
should be specified:
• Specify the Vertical range (from 1 to n)
• Specify the Horizontal range (from A to n)
Specify the number of Copies
Specify if you want to Print to file if the printer is not hooked to your machine

Module 10: Printing Layouts
10-15
Printing
Workshop 15
1. Open SCIE project
2. Open LT-03 (Grouping Using BLDG and PHAS)
3. View the Resource Profile using the following information:
a. Resource = Total
b. Showing Costs
c. Months
d. Calculate = Total
4. In Print Setup, make sure that you are using:
a. Landscape
b. A4 paper size
5. In Page Setup, set the following:
a. Date Range: from 06.27.05 to 12.31.05
b. Show Columns, Bars, and Resource/Cost display
c. Don’t Show visible columns only
d. Timescale placement = Both
e. Margin units = Centimeter
f. Set the four margins = 1 cm
g. Turn on Repeat Group title at page breaks
h. In the Footer, select the 4th section and show Logo in it, go to P3 folder, and select CLIPART folder, and use WORLD1.PMT as your logo

Using Primavera Project Planner Ver. 3.1
10-16
6. Use Print Preview, how many pages is the printout? __________ (3x1)
7. From Print Preview display select Page Setup button, and change the following:
a. Make the Top and Bottom margin = 0.5
b. Turn off Show timescale/titles on all pages
8. What is the new number of pages in the printout? ____________ (2x1)
9. If you have the printer hooked to your machine try to print the second page only

Module 10: Printing Layouts
10-17
Module Review
1. The most important command in printing which you can specify what and how to print is Print
Preview
a. True
b. False
2. From ____________________ I can reach to all other commands
3. I can decide to show Timescale in all pages, first page, or last page
a. True
b. False
4. In Header and Footer you can specify how many sections you want
a. There are only 3 sections
b. There are only 5 sections
c. Either 3 or 5
d. You can specify up to 7 sections
5. Where can I see the total number of pages in a certain printout
a. In Page Setup, the lower left part
b. In Page Setup, the lower right part
c. In Print Preview, the lower right part
d. In Print Preview, the lower left part
6. I can specify the orientation of the paper in __________________ dialogue box

Using Primavera Project Planner Ver. 3.1
10-18
Module Review Answers 1. b
2. Print Preview
3. b
4. c
5. d
6. Print Setup

1
Module 11:
Project Updating This module contains:
What are the steps to end the Planning phase?
Creating target
Actual Work input
Earned Value concept
Backup and Restore your project
Creating updating layouts
Creating Tabular reports

Using Primavera Project Planner Ver. 3.1
11-2

Module 11: Project Updating
11-3
Before the Actual Start of the Project
When the Planning phase is about to finish and the start of the project is getting closer, the planner should wrap up his/her work to be ready for the next phase (i.e. Monitoring):
• First, if you have any negative float this is the proper time to sit and to find a solution
• Second, you have to create a Target for your current project as the Actual dates will replace the early and late dates of your original plan
To find a solution for the negative float, follow the following steps:
• Concentrate on the Critical Path
• Recalculate the duration by increasing the number of resources
• Change the relationships (if logic permits) from serial relationships to overlapping or parallel relationships
• Change the calendar assignment to work more days
After you are done with the above, issue schedule command and make sure that the project will finish at the imposed finish date
Create a Target plan which will be the base for comparison between actual and planned
From menus select Tools/Project Utilities/Targets, the following dialogue box will be displayed:
Type in the name of the target project, and click OK, P3 will create the target in the same folder of the current project

Using Primavera Project Planner Ver. 3.1
11-4
Creating Target
Workshop 16
1. Open SCIE project
2. Open LT-01
3. Create a filter to show only the critical activities (Hint: under the Select if, select Longest path)
4. The critical path has TF = -9
5. To get rid of this negative float do the following
a. The relationship between activity CR105 “Excavation for Classrooms” OD=25 days, and activity CR110 “Concrete Works For Foundation For Classrooms” OD=28 days, is Finish-To-Start
b. After checking the logic we found that we can start working at activity CR110 before the finishing of activity CR105 by 9 days
c. Change the relationship between CR105 and CR110 to be FS -9
d. Run a filter to show All activities
6. Run the Schedule command, and produce the report on the screen, check when is the Latest calculated early finish? ________ (15AUG06)
7. Now create a target from the current schedule and call it SCTG
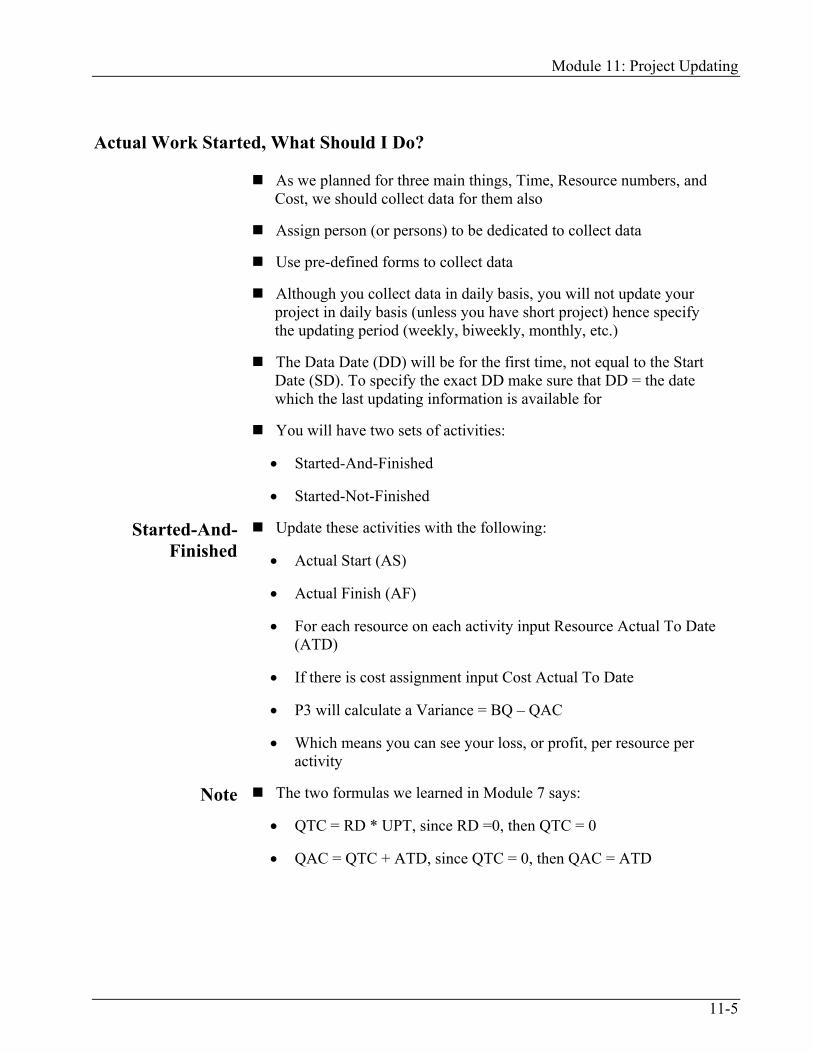
Module 11: Project Updating
11-5
Actual Work Started, What Should I Do?
As we planned for three main things, Time, Resource numbers, and Cost, we should collect data for them also
Assign person (or persons) to be dedicated to collect data
Use pre-defined forms to collect data
Although you collect data in daily basis, you will not update your project in daily basis (unless you have short project) hence specify the updating period (weekly, biweekly, monthly, etc.)
The Data Date (DD) will be for the first time, not equal to the Start Date (SD). To specify the exact DD make sure that DD = the date which the last updating information is available for
You will have two sets of activities:
• Started-And-Finished
• Started-Not-Finished
Started-And-Finished
Update these activities with the following:
• Actual Start (AS)
• Actual Finish (AF)
• For each resource on each activity input Resource Actual To Date (ATD)
• If there is cost assignment input Cost Actual To Date
• P3 will calculate a Variance = BQ – QAC
• Which means you can see your loss, or profit, per resource per activity
Note The two formulas we learned in Module 7 says:
• QTC = RD * UPT, since RD =0, then QTC = 0
• QAC = QTC + ATD, since QTC = 0, then QAC = ATD
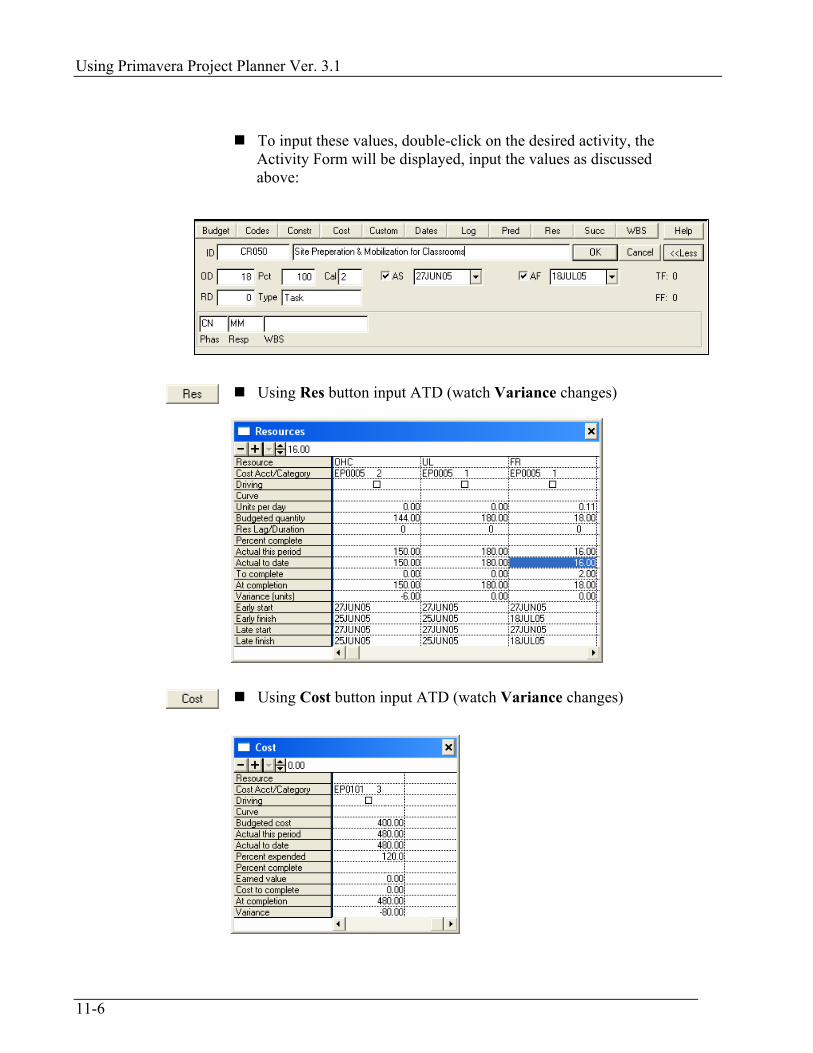
Using Primavera Project Planner Ver. 3.1
11-6
To input these values, double-click on the desired activity, the
Activity Form will be displayed, input the values as discussed above:
Using Res button input ATD (watch Variance changes)
Using Cost button input ATD (watch Variance changes)

Module 11: Project Updating
11-7
Started-Not-
Finished Update these activities with the following:
• Actual Start (AS)
• Remaining Duration (RD) or Percentage Complete (Pct)
• For each resource on each activity input Resource Actual To Date (ATD)
• If there is cost assignment input Cost Actual To Date
• Also you can change QTC if you want to reflect another number than the calculated
• P3 will calculate a Variance = BQ – QAC
Example Assume we have the following case:
• Activity OD = 6 days, assigned resource with UPT =2, therefore BQ = 6 * 2 = 12 units
• Unit Price was 12, hence BC = 12 * 12 = 144
• DD now is at the end of the 4th day of this activity
• The actual usage of this resource was: 1st day = 3 units, 2nd & 3rd days = 2 units, 4th day = 3, this means ATD = 10
• To work with the two formulas, QTC = 2 * 2 = 4
• QAC = 4 + 10 = 14
• Resource Variance = 12 - 14 = -2
• Cost Variance = 144 – 168 = -24
• May be in this case you will be inclined to change the calculated QTC from 4 to 6 as the past four days proved that you will need more units to finish this activity

Using Primavera Project Planner Ver. 3.1
11-8
To input these values, double-click on the desired activity, the
Activity Form will be displayed:
As we did in the Started-And-Finished, we will input ATD for both resources and costs
While you are updating, you may face the following problems:
• One of the activities started, but due to a certain problem the activity stopped
• After a while the activity started again
• You have to tell P3 about the stoppage days or else, P3 will calculate resource numbers and cost as if these days were working days
From Activity Form click Dates button, the following will appear:

Module 11: Project Updating
11-9
Updating Using Progress Spotlight
The above method is totally manual method as it asks the user to input all the data
Updating using Progress Spotlight is automatic updating method
P3 will assume that everything will go according to the plan
Do the following steps:
• Using Timescale change the Minimum time unit to the period of updating (weeks, months, etc.)
• From menus select View/Progress Spotlight, or from toolbar click the Progress Spotlight button, the following can be seen:
• The activities which will start in the period will be selected using yellow marker (this is not ordinary selecting), also the time period in the bar chart will be shaded
• To make the activities progress as planned, select Tools/Update Progress the following dialogue box will appear:
Using Primavera Project Planner Ver. 3.1
11-10
• The New data date will be set for you automatically
• Make sure that All activities is selected
• Click Update button
Note Another method of setting the Progress Spotlight is moving the Data Date line (think blue line) manually to the period desired
To remove the effect of the Progress Spotlight simply issue the command again either using the menus or toolbar
If some of the activities progressed according to plan, and others didn’t, you still can use this method, and change the numbers that P3 assumed to the actual numbers you have
Earned Value
In order to evaluate your project, P3 provides the Earned Value concept
There are 3 values for cost:
• BCWS (Budgeted Cost for Work Scheduled), known as Planned value
• BCWP (Budgeted Cost for Work Performed), known as Earned value
• ACWS (Actual Cost for Work Scheduled)
Schedule Variance is the difference between:
• BCWS and BCWP
• Preferable that BCWP > BCWS
Cost Variance is the difference between:
• BCWP and ACWP
• Preferable that BCWP > ACWP

Module 11: Project Updating
11-11
Example Assume we have the following activity:
Est. 2 2 2 2 2 2 2 2 2 2
Actual 3 2 2 1 2 2 3 3 Data Date
The following information applies:
• OD = 10 days
• UPT = 2, therefore BQ = 10 * 2 = 20
• Unit Price = 12, therefore BC = 20 * 12 = 240
• Data Date now is at the end of the 8th day
• Pct = 70%
• BCWS = 240 * 0.80 = 192
• BCWP = 240 * 0.70 = 168
• ACWP = (3+2+2+1+2+2+3+3) * 12 = 18 * 12 =216
As you can see from above BCWP < BCWS so we are behind schedule
And BCWP < ACWP, so we are over budget
From menus select Tools/Options/Earned Value, the following dialogue box will appear:
Select Target 1 project to use the budget from Target 1, and not from the current project, this budget will be the base for both BCWS, and BCWP
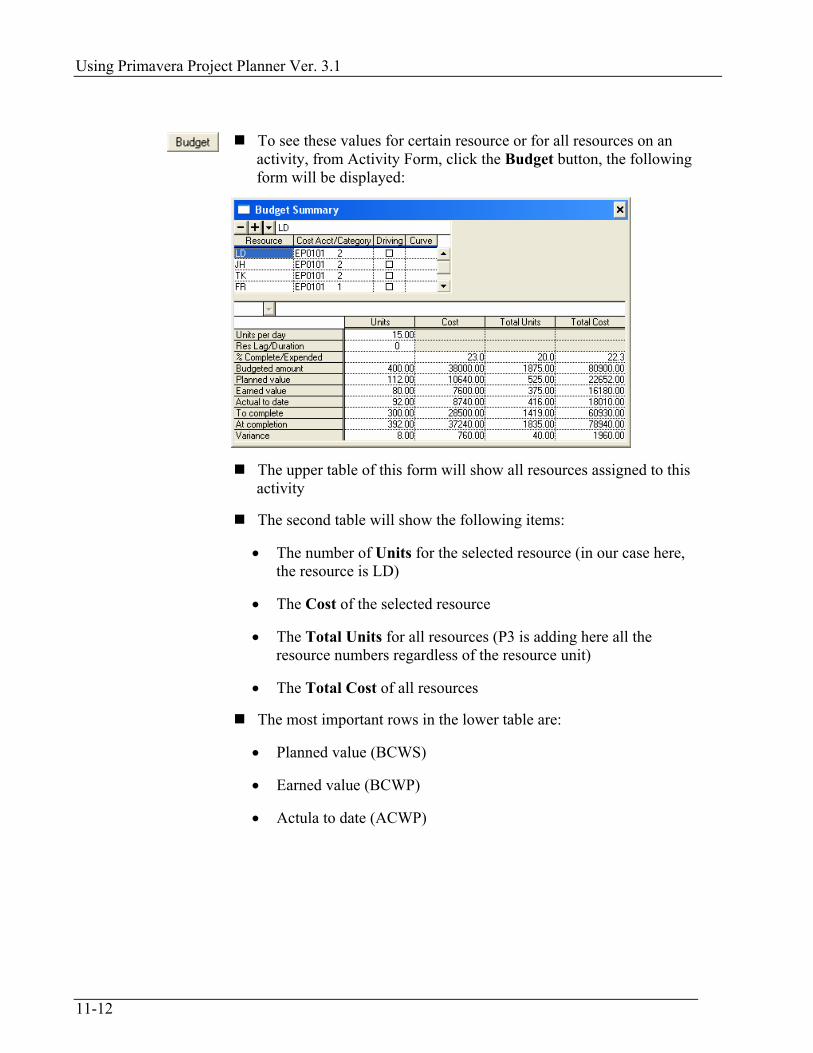
Using Primavera Project Planner Ver. 3.1
11-12
To see these values for certain resource or for all resources on an
activity, from Activity Form, click the Budget button, the following form will be displayed:
The upper table of this form will show all resources assigned to this activity
The second table will show the following items:
• The number of Units for the selected resource (in our case here, the resource is LD)
• The Cost of the selected resource
• The Total Units for all resources (P3 is adding here all the resource numbers regardless of the resource unit)
• The Total Cost of all resources
The most important rows in the lower table are:
• Planned value (BCWS)
• Earned value (BCWP)
• Actula to date (ACWP)
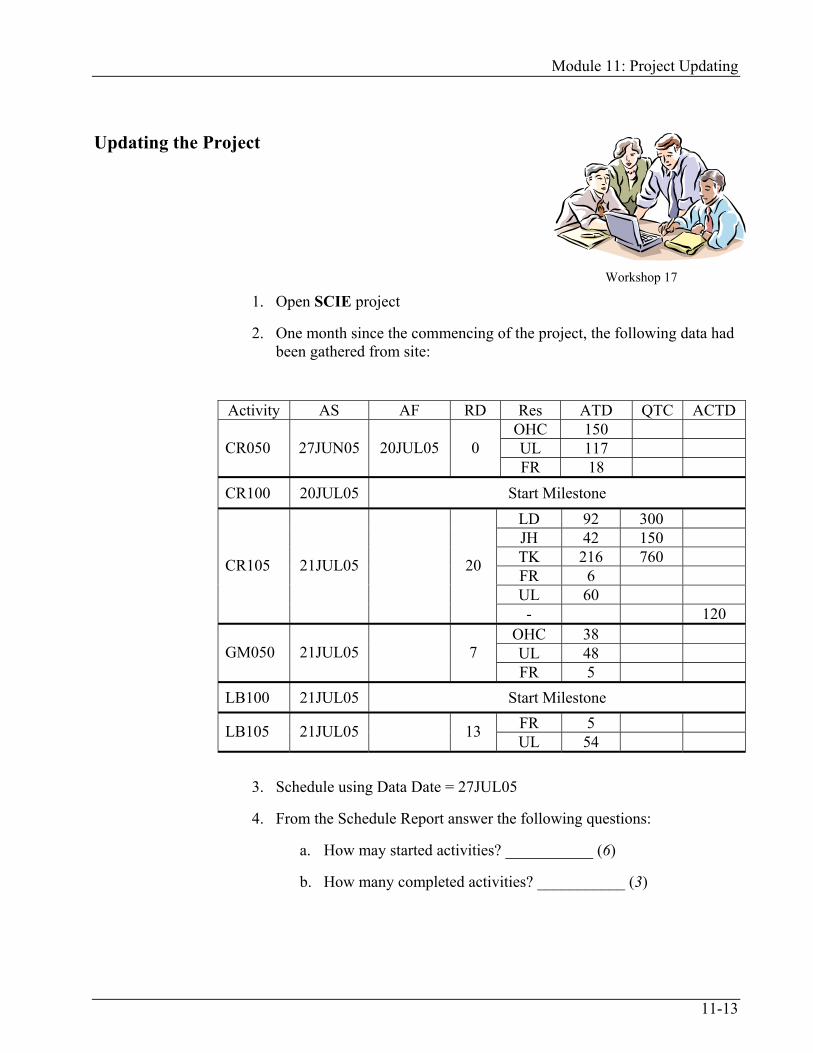
Module 11: Project Updating
11-13
Updating the Project
Workshop 17
1. Open SCIE project
2. One month since the commencing of the project, the following data had been gathered from site:
3. Schedule using Data Date = 27JUL05
4. From the Schedule Report answer the following questions:
a. How may started activities? ___________ (6)
b. How many completed activities? ___________ (3)
Activity AS AF RD Res ATD QTC ACTD OHC 150 UL 117 CR050 27JUN05 20JUL05 0 FR 18
CR100 20JUL05 Start Milestone LD 92 300 JH 42 150 TK 216 760 FR 6 UL 60
CR105 21JUL05 20
- 120 OHC 38 UL 48 GM050 21JUL05 7 FR 5
LB100 21JUL05 Start Milestone FR 5 LB105 21JUL05 13 UL 54

Using Primavera Project Planner Ver. 3.1
11-14
c. When will be the latest calculated early finish of the project?
_____________ (17AUG06)
5. Select activity CR105, using Budget button evaluate the performance of all resources by answering the following questions:
a. What is BCWS? _________ (22,652)
b. What is BCWP? _________ (16,180)
c. What is ACWP? _________ (18,010)
d. What do you think of the performance of this activity? ____________________________________________________

Module 11: Project Updating
11-15
Making Backup of Your Project
Make sure that you will create a backup for your project in a periodical timeperiod
Also make sure to document the date of each backup on the disk/CD so you will know when it was taken
You can take a backup while the project is open or closed (we prefer closed), from menus select Tools/Project Utilities/Backup, the following dialogue box will appear:
Specify the From part, by specifying the folder that contains the project you want to backup, then selecting the desired project (or projects)
Specify the To part, which includes the destination drive (floppy drive, or CD-ROM drive, etc.)
Select whether to Compress files of the projects? or not?
Select whether to Remove access list during backup? or not?
Note If you created a Target to your project, don’t forget to include it always in the backup projects, because your current project will not work without its Target

Using Primavera Project Planner Ver. 3.1
11-16
Restoring Your Project
For any reason your project in your computer was damaged, you can retrieve your latest backup by using Restore command
Get the media contains your latest backup, and insert it in your computer, from menus select Tools/Project Utilities/Restore, the following dialogue box will appear:
Specify the From and To parts, the From part will be the media (floppy disk or CD, etc.) which contains the backup projects, and the To part will be the folder in your hard drive which will host your projects

Module 11: Project Updating
11-17
Creating Updating Layouts
After updating you can make number of comparison layouts using the activity table, and/or bar chart
You can include columns which contains Actual data, beside columns contains Target 1 data
You can add number of Variances columns
You can include two bars one for the actual bar, and one for the Target 1 bar
Note After the first update AS (Actual Start) will replace ES, and AF (Actual Finish) will replace EF
Hence, there is no need to create a new bar and call it Actual bar, but instead the Early bar will be the actual bar
Example Here is an example of Updating Layout:

Using Primavera Project Planner Ver. 3.1
11-18
Creating Tabular Reports
After updating you can produce lots of pre-made tabular reports which will give you information about schedule, resource usage, and cost
Schedule Report As we did in Module 5, creating Schedule report after update will give you an idea about the AS, and AF compared to Target 1 ES, and Target 1 EF
From menus select Tools/Tabular Reports/Schedule
Do as we did in Module 5, except in the Format tab, make the following changes:
• Under Use section, make sure that Target 1 is selected
• Under Display section, make sure that Early dates is selected

Module 11: Project Updating
11-19
Here is an example of Schedule report after update:
Resource Control
& Cost Control Reports
These two reports are identical
The resource control report will show the resource usage
The cost control report will show the cost spending
The two reports will show for a desired resource:
• Budgeted Quantity (Cost)
• Percent Complete
• Actual Quantity (Cost) To Date
• Estimate Quantity (Cost) To Complete
• Estimate Quantity (Cost) At Completion (which is called in the report Forecast)
• The Variance between Budget and Forecast
From menus select Tools/Tabular Reports/Resource/Control (or use Cost/Control)
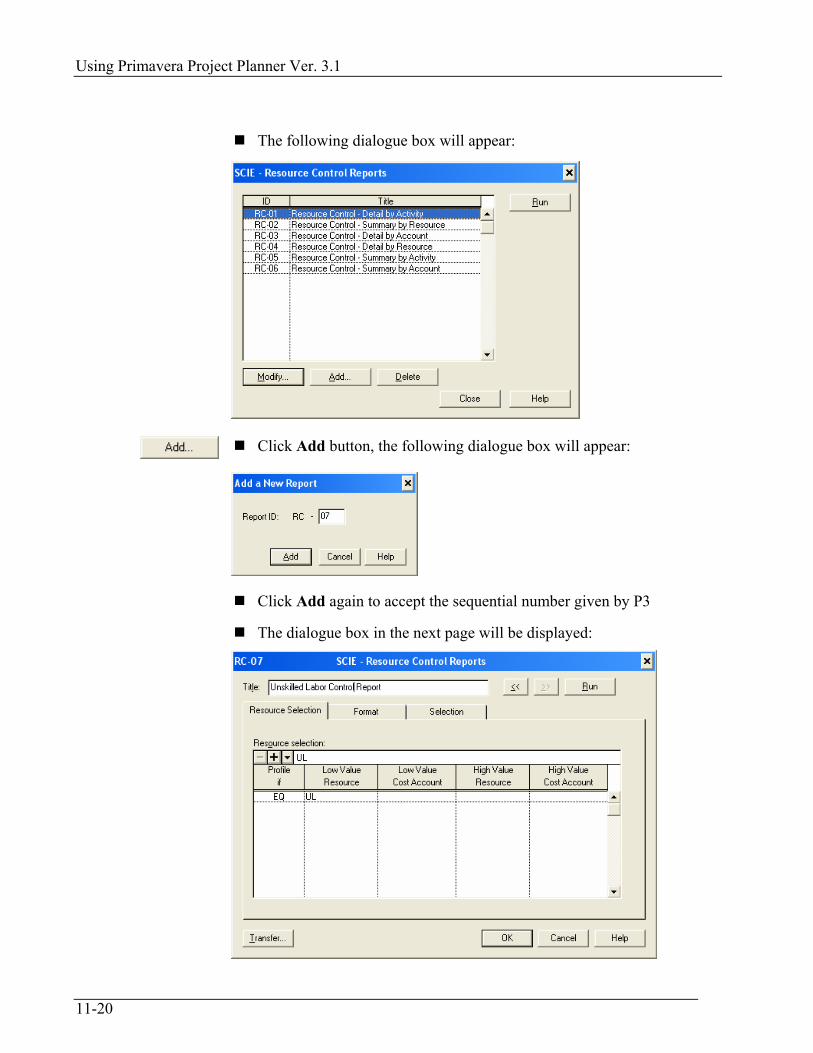
Using Primavera Project Planner Ver. 3.1
11-20
The following dialogue box will appear:
Click Add button, the following dialogue box will appear:
Click Add again to accept the sequential number given by P3
The dialogue box in the next page will be displayed:

Module 11: Project Updating
11-21
There will be three tabs; Resource Selection, in which you will
select either a resource or you leave it empty (this means you need a report for all resources)
The second tab is Format:
In this tab you will specify how you will Organize the activities in the report (by default organized using Activity ID), and whether this will be a summary report or not.
The third tab is Selection, which is the filter
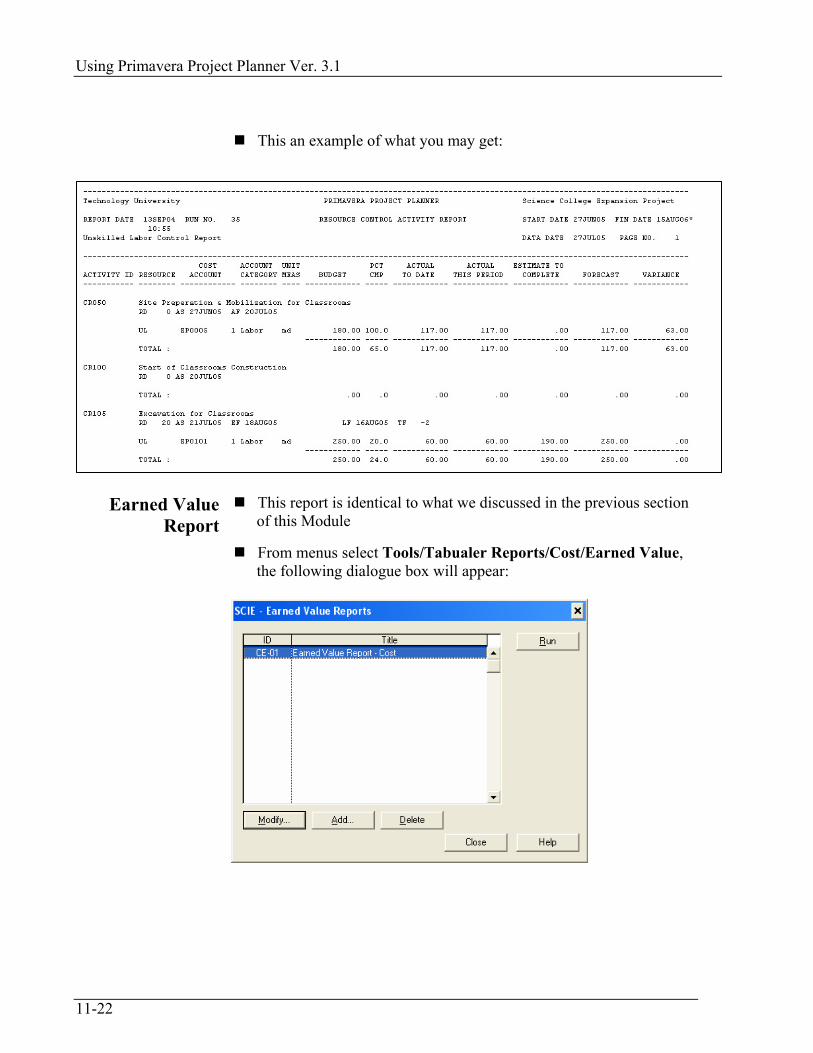
Using Primavera Project Planner Ver. 3.1
11-22
This an example of what you may get:
Earned Value
Report This report is identical to what we discussed in the previous section
of this Module
From menus select Tools/Tabualer Reports/Cost/Earned Value, the following dialogue box will appear:
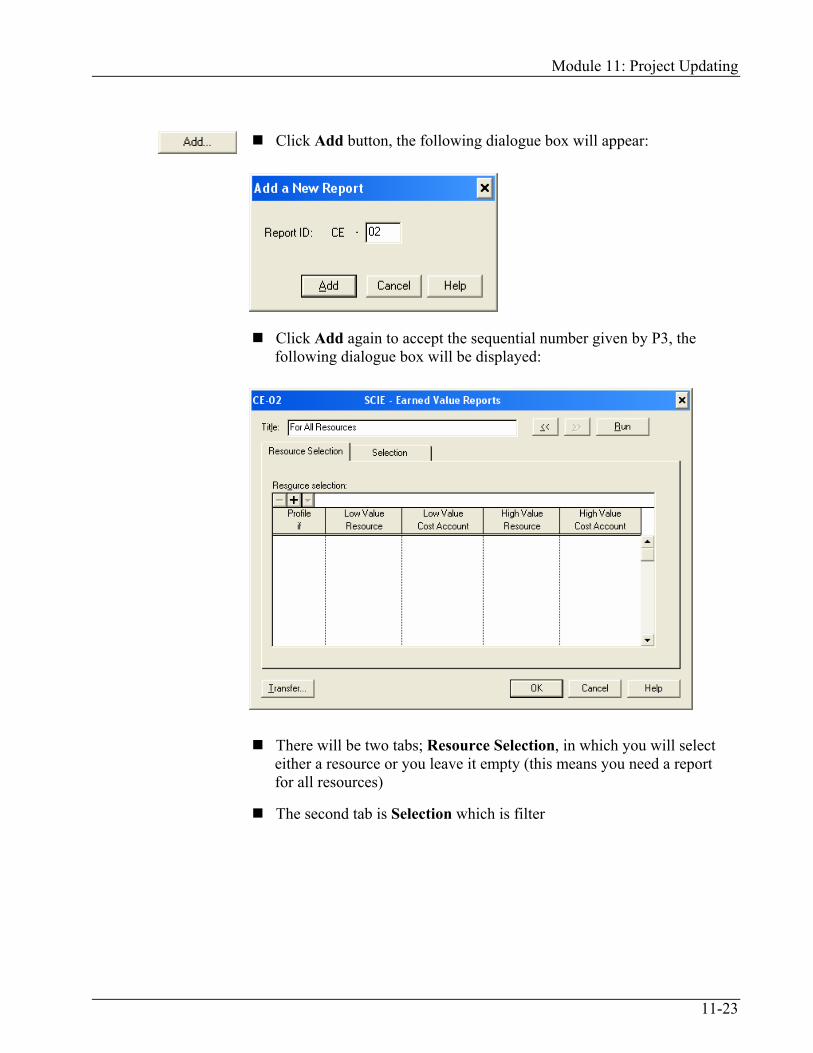
Module 11: Project Updating
11-23
Click Add button, the following dialogue box will appear:
Click Add again to accept the sequential number given by P3, the following dialogue box will be displayed:
There will be two tabs; Resource Selection, in which you will select either a resource or you leave it empty (this means you need a report for all resources)
The second tab is Selection which is filter

Using Primavera Project Planner Ver. 3.1
11-24
This an example of what you may get:

Module 11: Project Updating
11-25
Creating Layouts and Reports
Workshop 18
1. Open SCIE project
2. Produce a layout looks like the below:

Using Primavera Project Planner Ver. 3.1
11-26
3. Use the following data to help produce this layout:
a. Show Activity ID column
b. Show Early Start, and Target 1 Early Start columns
c. Show Early Finish, and Target 1 Early Finish columns
d. Show Budgeted Cost, and Actual Cost To Date columns
e. Using Format/Sight Lines, set the Horizontal sight line for each activity
f. Show two bars, the Early Bar, and Target Bar (starting point is Target 1 ES, and ending point is Target 1 EF), show the EF to the right of the Early Bar, and Target 1 EF to the right of the Target Bar
g. Save As the layout and name it Comparison Layout
4. Produce Cost Control report for All resources, and answer the following questions:
a. For activity CR050 (Started-And-Finished), what is the Total Cost Variance for all resources? __________________ (-216)
b. For activity CR105 (Started-Not-Finished), what is the Total Cost Variance for all resources? __________________ (1,960)
c. What do you think of these two results?
5. Produce Cost Earned Value report for All resources, and answer the following questions:
a. For resource FR, what is the Schedule Variance? ___________ (-79.84)
b. And what is the Cost Variance? ____________ (-19.84)
c. For the total of the resources, what is the Cost Variance? ___________ (-1,777.36)
Module 11: Project Updating
11-27
Module Review
1. For activities Started-Not-Finished, I can input the Actual Finish date
a. True
b. False
2. I have to set the _____________________________________ first to control Progress Spotlight period
3. Part of creating a Target is to create a backup
a. True
b. False
4. In favorable Schedule Variance:
a. ACWP > BCWS
b. ACWP > BCWS
c. BCWP > BCWS
d. BCWP > ACWP
5. One of the following is correct for both Started-And-Finished, and Started-Not-Finished
a. Input AS and ATD for each resource
b. Input AS and AF
c. Input AS, AF, and ATD for each resource
d. All of the above
6. After update AS will replace ____________
Using Primavera Project Planner Ver. 3.1
11-28
Module Review Answers 1. b
2. Timescale minimum time unit
3. b
4. c
5. a
6. ES

1
Test Your Knowledge The main objective of this test is to test-your-knowledge, which you learned from this courseware. The test should be closed book, and without using of the software. How to assess your self:
First don’t look at the answers in the last page
If you score 25 or more out of 30, Excellent
If you score between 20-24, Very good
If you score between 15-19, Good
If you score below 15, Fair

Using Primavera Project Planner Ver. 3.1
2
Name:_______________________________________ Date:_______________________________ Answer All of the following questions: 1. Data Date is:
a. Starting Date of the Project. b. Finishing Date of the Project. c. Time Now. d. All of the above.
2. Resources are: a. Manpower b. Machines c. Materials d. All of the above
3. Activity Codes are for a. Classification of activities b. Sort out resources c. Organizing activities. d. A & C
4. In the Forward Pass, P3 calculates a. Total Float b. Early Dates c. Late Dates d. Free Float
5. Bar Chart View: a. Will show Time-Scaled Bars for each
activity. b. Relationships. c. Endpoints for each activity d. All of the above
6. In opening an existing project the Overview button will help in:
a. Knowing the number of relationships b. Knowing the number of activities c. Listing the activity codes d. TF for the critical path
7. The best definition of Critical Path is a. The path, which includes activities with
negative float. b. The shortest path c. The longest path d. The path, which includes activities with
zero free float 8. By default in P3 the activities are sorted by:
a. ES b. LF c. LS d. FF
9. There are only 3 types of relationships in P3: a. True b. False
10. P3 is using one of the following methods in
representing the network: a. PDM b. EDM c. CPM d. All of the above.
11. P3 is using one of the following methods in scheduling calculation:
a. PDM b. EDM c. CPM d. All of the above.
12. How many project P3 can open simultaneously: a. 3 b. 2 c. 1 d. 4
13. You can summarize any number of activities to a single bar, if they are grouped together:
a. True b. False
14. One of the following you can’t format it to suit your needs:
a. Timescale b. Fonts c. The method of scheduling. d. Bars
15. You can print: a. Only the Layout b. Layout, Tabular, and graphical reports. c. Only Tabular reports d. Only graphical reports
16. If the activity started and finished, you need the following to update it:
a. AS only b. AS, AF, and RD c. AS, and AF d. AS, AF, ATD
17. If the activity started and not finished, you need the following to update it:
a. AS, AF b. AS, RD, and ATD c. AS, RD d. AS, AF, and ATD
18. In the Columns, user can set the Justification and
Font of each column: a. True b. False

Test Your Knowledge
3
19. Data is saved automatically in P3, the only thing you can save is Layout:
a. True b. False
20. In each level of the four levels in a filter you can use AND, or OR between the conditions:
a. True b. False
21. In Organize dialogue box you can: a. Change the background color of the band. b. Change the font and size of font of the text
in the band. c. A & B d. None of the above
22. Progress Spotlight depends on: a. The minimum time unit of the Timescale b. The minimum time unit defined in the
project. c. The minimum time unit defined in the
Progress Spotlight dialogue box d. None of the above
23. You can Add/Remove Columns from Layout using: a. Format/Bars b. Format/Columns c. F11. d. B & C
24. You can change the Data Date from: a. Format/Data Date b. The Schedule dialogue box c. View/Data Date d. If you press F2
25. One of the following statements is true about Calendar:
a. All activities must be linked to Cal 1 b. All activities must be linked to Global
Calendar. c. Each activity should be linked to one of the
calendars. d. Calendars are assumed by P3 for each
activity and user can’t change that. 26. Global Calendar is unique and will affect the
individual calendars in the Holidays: a. True b. False
27. You can impose a finish date on the whole project using:
a. Format/Set Finish Date b. Format/Project Finish Date. c. Format/Organize d. From the Standard button of the Global
Calendar.
28. User can specify to print the Resource/Cost display in the Layout in
a. Print Setup. b. Page Setup. c. Print Preview. d. User can’t print the Resource/Cost Display
in Layout. 29. Page setup will allow you to set the margins:
a. True b. False
30. If you double click on an activity what will happen:
a. Nothing b. Considered Critical activity. c. Show the Activity Form. d. Link with FS relationship to the next
activity.

Using Primavera Project Planner Ver. 3.1
4
Answers 1 C 17 B 2 D 18 A 3 D 19 A 4 B 20 A 5 D 21 C 6 B 22 A 7 C 23 D 8 A 24 B 9 B 25 C 10 A 26 A 11 C 27 D 12 D 28 B 13 A 29 A 14 C 30 C 15 B 16 D


![Using Primavera Project Planner Ver 3[1].1 Courseware](https://static.documents.pub/doc/80x56/55cf97af550346d03392fe35/using-primavera-project-planner-ver-311-courseware.jpg)


