Abstract—Context Management Framework (CMF) for Ubiq-uitous Health (U-Health) Systems should be able to continu-ously gather raw data from observed entities to characterizetheir current situation (context). However, the death of battery-dependent sensors reduce their ability for detecting the context,which directly affects the availability of context-aware u-healthservices. This paper proposes the use of Quality of Context(QoC) integrated with a data reduction approach to minimizethe amount of sensed raw data sent to CMF, reducing the energyconsumption and maximizing the lifetime of sensor-based CMF.The proposed approach rebuilds the gathered raw data takinginto account QoC requirements, avoiding the loss of precision(QoC Indicator precision) and timeliness (QoC Indicator up-to-dateness), which has been integrated into our Context Manage-ment Framework (CxtMF). Experimental results demonstrate theeffectiveness of our approach by reducing the amount of packetssent over network to 3% for the ECG monitoring service.
Index Terms—U-Health systems, Data Reduction, ContextManagement, Context-awareness, Quality of Context.
I. INTRODUCTION
Context Management Framework (CMF) in U-Health Sys-tems is in charge of gathering, processing, and providingcontext information [16], [15] for adapting context-awareapplications, such as health [12], [13], [14], [16] Ubiquitoushealth monitoring services are sensor-based platforms ableto check vital signal of people, at anytime and anywhere[12], [13], [14], [15]. For example, sensor-rich biologicalmonitoring systems can be equipped with eletrocardiogram(ECG) sensor for continuously tracking CardioVascular Dis-eases (CVD). Usually, ECG gathered data is locally storedon the ubiquitous monitoring platform for later analysis, or itis continuously sent for server-side analyzer application builton a CMF. In fact, there is a huge demand for continuousECG monitoring systems, requiring real-time response, highavailability and reliability.
Although there are several proposals of CMF [5], [6], [4],[9], [8], [7], [16], they do not take into account the needof maximizing the availability of the sensor-rich monitoringplatform in order to reduce the probability of unavailability ofcontext-aware u-health services. In this scenario, it is a promis-ing idea to integrate data reduction approaches [11] withCMF for saving energy. However, these approaches should
take into account quality requirements (QoC1) [16], [17],[15] associated with context information generated during thecompression of gathered data, such as precision and up-to-dateness (QoC indicators).
The focus of this work is enhancing the lifetime of sensor-rich CMF by saving communication data energy, taking intoaccount QoC requirements. We propose the use of QoCIndicator for improving a predictive data reduction mechanism(Adaptive Simple Linear Regression - ASLR) to extend thelifetime of sensor-rich CMF, preserving the quality of gatheredcontext data. The proposed ASLR approach compresses datagathered from monitoring platform before sending it to a CMF.The monitoring infrastructure used by our U-health systems isbased on the Arduino Platform2, which was integrated with ourContext Management Framework (CxtMF) for constructingcontext-aware u-health services, such as continuous ECGmonitoring services (for more information about the CxtMF,please refers to [16], [15]).
The quality-aware ASLR uses a prediction mechanismbased on the history of raw data gathered by sensors. By usingthe proposed ASLR approach, the monitoring systems shouldproduce coefficients (parameters) that models the readingsset from the samples window. Thus, instead of send allgathered samples, the monitoring system send to the CxtMFonly the coefficients that represents the line, i.e., the set thatrepresents the reading [18]. The production of the coefficientsis controlled by the error between the real and estimated value,as well as the max size of reading window, i.e., respectingboth QoC threshold: precision and up-to-dateness. The pro-posed data reduction approach can adjust the samples windowused on the model, respecting the max size defined by theup-to-dateness threshold. Based on the received coefficients(models), the CxtMF is able to reconstruct the sample set ofgathered data. The quality of gathered data is enhanced byusing Pearson’s Coefficient (correlation rate) in the proposedASLR approach.
The reminder of the paper is organized as follows: Section 2
1Quality of Context2http://www.libelium.com/130220224710/
2014 IEEE 16th International Conference on e-Health Networking, Applications and Services (Healthcom)
addresses related work about data reduction mechanisms. Sec-tion 3 gives an overview on the case study of our experiments(continuous ECG monitoring services) and section 4 presentsthe proposed data reduction approach. Section 5 describesthe experimental results and, finally, section 6 addresses thediscussion and conclusion of this work.
II. RELATED WORK
Data Reduction for Energy Saving (DRES) is widely used inWireless Sensor Networks (WSN) for decreasing the transmis-sion rate of sensors on the network. The sensor node avoidsthe sending of gathered readings as it can be recovered atthe sink node by means the raw data history. The scientificcommunity has proposed mechanisms that seek to reduce thedata transmission of sensors [22], [24], [23], [25], [26], [27],[24], [28], as well as few survey [11], [10] describes thecharacteristics of such data reduction mechanism.
Prediction of sensor data is often applied to DRES, sinceit allows that only the data model is sent to the sink nodeto be carried out later data recovery [24], [27], [28], [18].The location where the generation of the data model is madedepends on each approach.
Some authors [24] argue that data modeling should be doneby the sink node (e.g., CMF) and the data model must beforwarded to source nodes to performs data recovery. Thesource node checks if data model still holds, i.e., if it is withina previously established threshold. Otherwise, it alerts the sinknode to recalculate a new model. However, Carvalho et al. [18]recommend that data modeling should be done by source nodeand sent to the sink node. That approach enables the sensornode make decisions instantly, regardless of the transmissiondelay of the model.
The mechanism adopted by these approaches can be asimple prediction technique based on statistical, or a morecomplex technique, based on time series. Although the sta-tistical mechanisms are less robust in terms of accuracy, theycan get good results and may be applied to DRES.
In fact, sensor devices have certain peculiarities when areembedded in monitoring platforms. They should have a longlifetime, spending a minimum of energy from the batteries.Therefore, sensors should be in sleep mode when they are notgathering data. Moreover, the processing time of the applieddata reduction technique should be minimized, as well as theactivity of sensor device and monitoring platform. Thus, thedata reduction approach can not store too much data for a longtime, which will require longer time of activity of monitoringplatform, expending more energy.
From this discussion, we can conclude that our data re-duction approach meets the requirements of such limitedembedded systems. The time taken by our approach in realexperiments have been less than the QoC parameter lifeTimefor ECG monitoring. In fact, the QoCP lifeTime of each infor-mation is smaller than the cycle time of one sensor reading,i.e., the sum of sensor activation time, the processing time andsending time of the data model, until the sensor enter in thesleep mode again. Therefore, more complex approaches may
not meet those requirements. Moreover, any of the existingwork takes into account quality requirements of context-awareservices while reducing data (i.e., QoC precision and up-to-dateness).
The proposed quality-aware data reduction approach focuseson statistical mechanisms. Results obtained from experimentsindicate that we can apply the adjustment mechanism fordynamically change the window size, making the proposaladaptive to the correlation of the readings, with low loss ofquality for discrete (e.g., temperature) and waveform (e.g.,ECG) data.
III. CASE STUDY
In order to perform our experiments, we developed acase study for u-health systems: continuous ECG monitoringservice for people with CardioVascular Diseases (CVD). Thisservice was built on the CxtMF illustred in Figure 1.
CxtMF fully support QoC control, including the collection(gathering), measurement, interpretation, access, and deliveryof QoC-enriched context information, as well as other func-tionalities to efficiently handle QoC (e.g., to delivery contextwith a minimum QoC).
In order to implement QoC control, CxtMF performs thefollowing operations: 1) QoC gathering: sensing/profiling QoCparameters from the environment for evaluating QoC indi-cator (QoCI), such as QoCI precision and up-to-dateness;2) QoC Classifying: representing QoC parameters and QoCindicators in an format understandable by ubiquitous systems;3) QoC Evaluating: assessment of QoC indicators by usingQoC measuring methods applied on QoC parameters; 4) QoCverifying: verifying the values of QoC indicators associatedwith context used by context-dependent decisions. We cannote that QoC should be linked to context data deliveredto ubiquitous systems consuming that information. Thus, itshould be included in context models and handled by contextmanagement frameworks.
CxtMF was defined to support context-aware u-health ser-vices, such as ECG monitoring services [16], [15]. The mainidea behind the CxtMF is the quality-aware management ofcontext information to be used by context-dependent servicesand applications (e.g., remote monitoring systems, self moni-toring, emergency services). This means, taking into accountthe quality of context information in all steps of contextmanagement operations.
The main entities of CxtMF are Context Providers (CP)and Context Information Service (CIS) [15]. CP is an agentthat sends CxtObj (an instance of a given context information)associated with some QoC parameters (QoCP) to the ContextInformation Service (CIS) belonging to the same domain, e.g.,ECG signal. Each CP (e.g., Arduino platform) is registeredin a CIS, which is composed by various modules in chargeof context management functions: i) Context Collector (CC),Context Reasoner (CR), Context Obfuscator (CO), QoC Eval-uator (QoCE), and Context View Provider (CVP).
In the CxtMF, context information, QoC, and QoC re-quirements are represented by OWL-DL ontologies. We have
2014 IEEE 16th International Conference on e-Health Networking, Applications and Services (Healthcom)
defined three ontologies to model Context, QoC, QoC require-ments, which provides the semantic interoperability betweenall management layers in the CxtFM. For more details aboutthis architecture, see the work described in [16], [15].
The value of each QoC indicators (e.g., QoCI up-to-datenessand precision) are defined within the range between 0 and1, which means that the closer is the value to 1, more theverified context information is in accordance with the qualityrequirement. QoCI up-to-dateness describes how current thecontext information is for an entity at a given time, for makingcontext-based decisions. QoCI precision describes how exactlythe provided context information mirrors the reality.
For example, if the value of QoCI precision associated witha context information is 1, it means that context informationhas the highest level of precision that the sensing platformis able to provide it. In the case of the QoCI up-to-dateness,the value 1 means that the context information is extremelycurrent and valid for use by a context-sensitive service. Itis important to note that for measuring the QoC indicatorwe need to define the QoC parameter lifeTime. LifeTime isthe period of time after which context information becomesobsolete and it is necessary to take its value again. Eachcontext information has a lifeTime, which is related witheach tuple (sensor, application/service). For more informationabout how to measure the QoC indicator precision and up-to-dateness, please refer to [16], [15].
We are using these two QoC indicator to improve our ALSRalgorithm. In the following, we describe the characteristics ofeach monitoring service to further present experiment results.
A. ECG monitoring overview
ECG is an exam which records electrical pulses generatedduring the cardiac activity and, thus, aids the diagnosis of heartand other diseases, not only related to the circulatory system[21]. Among the main diagnoses, can be highlighted diseases3:arrhythmias, overload, areas electrically inactive, neurologicaland congenital diseases.
3http://www.heart.org/
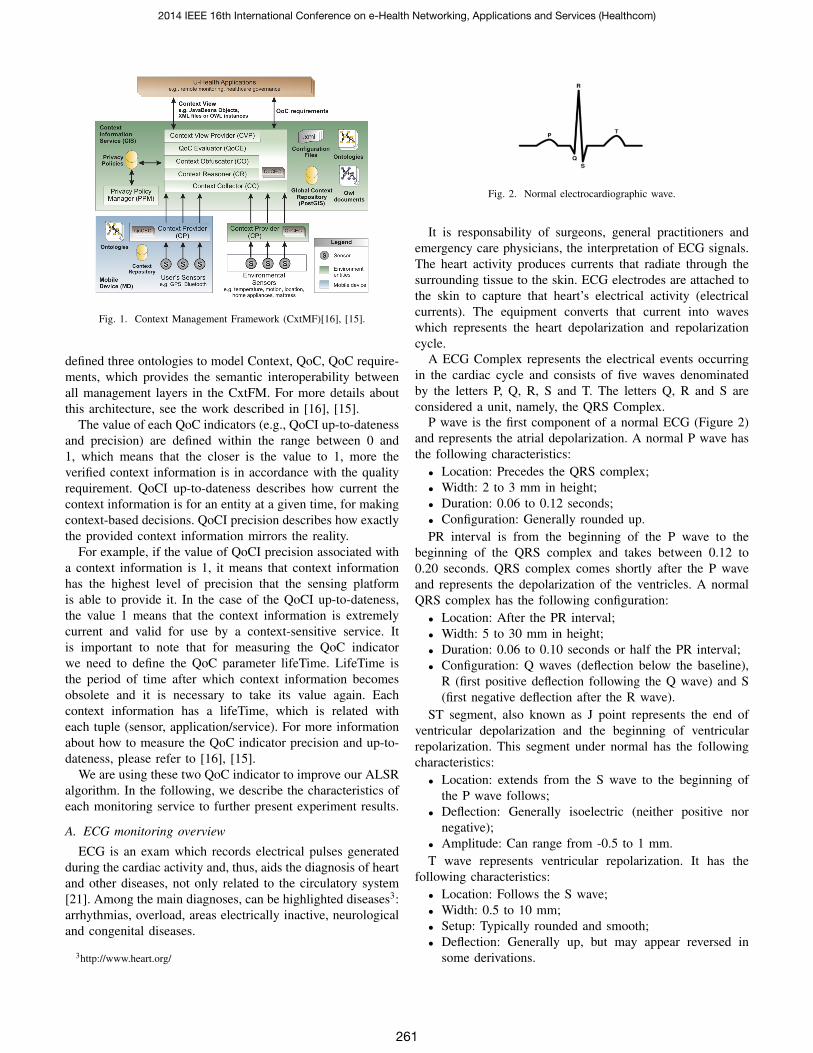
Fig. 2. Normal electrocardiographic wave.
It is responsability of surgeons, general practitioners andemergency care physicians, the interpretation of ECG signals.The heart activity produces currents that radiate through thesurrounding tissue to the skin. ECG electrodes are attached tothe skin to capture that heart’s electrical activity (electricalcurrents). The equipment converts that current into waveswhich represents the heart depolarization and repolarizationcycle.
A ECG Complex represents the electrical events occurringin the cardiac cycle and consists of five waves denominatedby the letters P, Q, R, S and T. The letters Q, R and S areconsidered a unit, namely, the QRS Complex.
P wave is the first component of a normal ECG (Figure 2)and represents the atrial depolarization. A normal P wave hasthe following characteristics:
• Location: Precedes the QRS complex;• Width: 2 to 3 mm in height;• Duration: 0.06 to 0.12 seconds;• Configuration: Generally rounded up.PR interval is from the beginning of the P wave to the
beginning of the QRS complex and takes between 0.12 to0.20 seconds. QRS complex comes shortly after the P waveand represents the depolarization of the ventricles. A normalQRS complex has the following configuration:
• Location: After the PR interval;• Width: 5 to 30 mm in height;• Duration: 0.06 to 0.10 seconds or half the PR interval;• Configuration: Q waves (deflection below the baseline),
R (first positive deflection following the Q wave) and S(first negative deflection after the R wave).
ST segment, also known as J point represents the end ofventricular depolarization and the beginning of ventricularrepolarization. This segment under normal has the followingcharacteristics:
• Location: extends from the S wave to the beginning ofthe P wave follows;
• Deflection: Generally isoelectric (neither positive nornegative);
• Amplitude: Can range from -0.5 to 1 mm.T wave represents ventricular repolarization. It has the
following characteristics:• Location: Follows the S wave;• Width: 0.5 to 10 mm;• Setup: Typically rounded and smooth;• Deflection: Generally up, but may appear reversed in
some derivations.
2014 IEEE 16th International Conference on e-Health Networking, Applications and Services (Healthcom)
261
Fig. 3. ECG monitoring service built on the Arduino platform.
QT interval is from the beginning of the QRS complex tothe end of T wave. This range varies with age, sex and heartrate. Usually takes from 0.36 to 0.44 seconds. From this value,we define the QoC parameter lifeTime for ECG data as 0.45s.Heart rate is the number of times that the complete cycle (thestart of a P wave to the beginning of another wave P) occursper minute. The reference values for adults is 60-100 bpm(beats per minute) and the heart rate is the distance between Rwave peaks from two successive QRS complexes. If all thosedistances are in the same size range, the rhythm is normal.Furthermore, the electrocardiographic wave is diagnosed asnormal if it meets the following five characteristics:
• Regular rhythm;• Normal frequency;• A P wave for every QRS complex and all the P waves
and QRS complexes similar in size and shape;• PR and QT intervals normal;• T waves up and rounded.Figure 3 illustrates the Arduino platform used for sensing
ECG signal. Our data reduction mechanism implemented onthe CxtMF (Context Collector - CC) receives the data from theECG signal and checks the correlation between the readings.If it does not reaches a error threshold, the parameters arecomputed, which represent those data (modeling), and forwardto the CxtMF only the coefficients of the linear equations.Therefore, the original ECG signals are reconstructed at theCxtMF, prior to being provide for context-aware services.We note in the experiments that ALRS approach performsprediction for generating data models for recovering signalsmaintaining the complex characteristics of ECG signal, con-taining all five waves.
IV. USING QOC FOR IMPROVING ENERGY-EFICIENTMONITORING APPROACH
This section outlines the proposed approach of DRES basedon Adaptive Simple Linear Regression (ASLR), which mini-mizes the error generated by Pearson’s Coefficient (correlationrate). Instead of calculate the data model with sample size witha fixed size, the ASLR approximates the predicted values tothe actual values by adjusting the window samples guided bythe Pearson’s Coefficient.
A. Adaptive Simple Linear Regression Based on Pearson’sCoefficient
Simple Linear Regression (SLR) models the relationshipbetween a scalar dependent variable Y and one explanatory orindependent variable named X . SLR is based on least squares[Equations ( 1) and ( 2)].
Each sensor node calculates α and β by using as theindependent variable a counter that represents the time. Themonitored physical variable is the dependent variable tobe predicted (temperature or ECG signals). In our adaptivescheme, the sensor node adjust the samples window based oncorrelation coefficient. In that case, α and β are computed fromsamples based on Pearson’s Coefficient, according to Equation( 3). That coefficient shows the level of intensity between twovariables and the direction from that correlation (positive ornegative). The Value of the coefficient should be in the range[−1,+1].
Value of coefficient can be played as follows: if valueis +1, then there is a perfect positive correlation betweenthe two variables; if value is −1, then there is a perfectnegative correlation between two variables. If the value is 0then there is not correlation or correlation is non-linear. Inour case, the better results on performance evaluation fromprediction (low error) were got when Pearson’s Coefficientranged between [0.6 − 1]. In our proposal, the Pearson’sCoefficient is equivalent to the QoCI precision, i.e., the contextinformation will be acceptable if the value is between the rangeof [0.6− 1].
• Step #1: The sensor node takes one measurement from theinterested variable, for instance, the ECG signals (in thiscase, the dependent variable), and stores the measuredvalue in a internal buffer;
• Step #2: The Pearson coefficient is calculated, based onthe values stored in the buffer;
• Step #3: The Pearson coefficient is evaluated and theQoCI up-to-dateness is verified (considering the lifeTimeof 0.45s for ECG data). If the value of the coefficientand the QoCI up-to-dateness is equal or bigger than apredefined threshold (for example, 0.6 for QoCI precisionand 0.3 for QoCI up-to-dateness), then the values in thebuffer has a stronger correlation and the algorithm goesto Step #7; otherwise, it goes to Step #4;
• Step #4: The Pearson coefficient is below the predefinedthreshold which means that the last value measured wasthe responsible to the decay of the value. In this case,the algorithm calculates α and β coefficients of the linearregression based on the values stored in buffer, withoutthe last value measured. The X variable is representedby a counter, which represents how many measurementswere taken. α and β coefficients and the counter are sentto the sink node (i.e., CxtMF);
• Step #5: The buffer is cleared, and the last value measuredis stored in it;
• Step #6: The α and β coefficients are transmitted to theCxtMF;
2014 IEEE 16th International Conference on e-Health Networking, Applications and Services (Healthcom)
262
β =
∑ni=1
(xi −X
) (yi − Y
)∑ni=1
(xi −X
)2 (1)
α = Y − βX (2)
where β represents a constant that is multiplied by the value of each independent variable. α is a constant added to the previousmultiplication, resulting in the predicted value. X and Y are two one-dimensional vectors, which respectively represent sampleswindow of the independent and dependent variables, with X = x1, x2, ..., xi and Y = y1, y2, ..., yi, where i = 1, ..., n and nis the number of samples. X and Y represent the average of samples of each vector.
r =n∑n
i=1 xiyi − (∑n
i=1 xi)(∑n
i=1 yi)√[n∑n
i=1 x2 − (
∑ni=1 xi)
2] [n∑n
i=1 y2 − (
∑ni=1 yi)
2] (3)
where r represents the relationship between two one-dimensional vectors X and Y , to be compared in terms of its correlation.It contains samples window of two variables, X = x1, x2, ..., xi and Y = y1, y2, ..., yi, where i = 1, ..., n and n is the numberof samples (window size). X and Y represent the average of samples of each variable vector.
• Step #7: End of cycle; Go back to Step #1.
These seven steps are summarized in Algorithm presented inFigure 4. Algorithm is used for predicting ECG signals byapplying DRES. The threshold is defined according to theapplication requirements, which reflects in the performanceof the DRES. By increasing the threshold the accuracy willincrease together, but the algorithm generates more coefficientsα and β to be sent on the network. The challenge is todefine the best configuration for this tradeoff. It should still beanalyzed further, to ensure a better adjust of ASLR approach,but experiments show satisfactory results.
Fig. 4. Algorithm for DRES based on Quality-Aware ASLR
V. EXPERIMENTAL RESULTS
In order to measure performance of our solution, we definemetrics such as amount of packets sent on network (psent) andthe error of prediction (eprediction). psent shows the energysaved of sensor by reducing the communication. epredictioncomputes the accuracy of prediction approach. Experimentswere conducted for both monitoring services, which willdiscussed in the following.
We conducted experiment with 399 ECG signals, usingthreshold = 0.95 (QoCI precision) and QoCP lifeTime 0.45s(for measuring QoCI up-to-dateness). That amount of signalscorresponds to a complete cycle of the heart. A conven-tional application of ECG gets psent = 399. Meanwhile,our approach obtains psent = 13 (3%) and eprediction havebeen 0.0009, saving about 97% of the packets. These resultsare justified because ECG signals are modeled in 13 linearregression functions, which its parameters (coefficients α andβ) must be sent to the CxtMF, instead of the 399 readings.
Fig. 5. The quality-aware ASLR algorithm recovers the gathered ECG signals.
Figure 5 shows prediction results from ECG monitoringservice using the Quality-aware ASLR algorithm and the rawdata. The recovered ECG signal by the CxtMF is well similarwith the original raw signals gathered by sensors, proving thatour approach is precise and effective. Note that the complexityof the ECG signal is maintained even after applying theDRES, since we are using linear regression approximation.The adjustment has been done in the samples window in anadaptive way that enables the creation of multiple data modelsinto a threshold error.
Experimental results show that our approach reduces the
2014 IEEE 16th International Conference on e-Health Networking, Applications and Services (Healthcom)
263
amount of packets sent (psent) on the network. As our ex-periments take into account only the useful application data(payload) of packets, the energy spent for sending a packetis 0.48375 mJ, neglecting the overhead and signaling fromnetwork layer. Considering the psent from ECG service onthe experiments, we obtained the following results: withoutapplying any data reduction mechanism, the energy consump-tion of daily usage was 25,267.56J (i.e., 399 readings/cycleX 0.48375 X 130,909 cycles, every 0.66s). After applyingour data reduction approach, the energy consumption for thisservice was 823.25J (i.e., 13 coefficients/cycle X 0.48375 X130,909 cycles, every 0.66s).
VI. DISCUSSION AND CONCLUSIONS
Context Management for U-Health Systems should bequality-aware and energy efficient in order to maximize thelifetime of monitoring platform and improve the availabil-ity and reliability of context-aware u-health services, suchcontinuous ECG services. This paper proposes a quality-aware data reduction approach that was integrated with theCxtMF [16], [15], [17] in order to gather raw data andsaving energy of sensors, increasing its lifetime. The quality-aware ASLR approach uses prediction of readings gatheredbased on SLR, which performs approximation by generatingvalues by a straight line (linear approximation). We appliedan adaptive mechanism on the window samples that takesinto account the QoC indicator precision and up-to-datenessfor defining the window size. With the quality-aware ASLRproposed in this work, we decreased the noise driven by thecorrelation coefficient. As future work, we plan to investigatean efficient data reduction solution based on wavelet 4 forreducing waveform signal, preserving the quality of data.
REFERENCES
[1] J. Meitalovs, A. Histjaves and E. Stalidzans, Automatic MicroclimateControlled Beehive Observation System, 8th International Scientific Con-ference Engineering for Rural Development, Latvia University of Agri-culture, pp.265-271, 2009.
[2] A. Zacepins, Application of Bee Hive Temperature Measurements forRecognition of Bee Colony State, International Conference on AppliedInformation and Communication Technologies (AICT2012), pp.465-468,Jelgava, Latvia, 2012.
[3] A. Zacepins, J. Meitalovs, V. Komasilovs and E. Stalidzans, Temperaturesensor network for prediction of possible start of brood rearing by indoorwintered honey bees, Carpathian Control Conference (ICCC), 2011 12thInternational, pp.465-468, 2011.
[4] D. Conan, R. Rouvoy, L. Seinturier, Scalable processing of contextinformation with COSMOS. DAIS’07: Proceedings of the 7th IFIP WG6.1 international conference on Distributed applications and interoperablesystems, Springer-Verlag, pp.210-224, 2007.
[5] A.K. Dey, G.D. Abowd, The Context Toolkit: Aiding the Developmentof Context-Aware Applications. Workshop on Software Engineering forWearable and Pervasive Computing, ACM Press, pp.434-441, 1999.
[6] A.K. Dey, Understanding and Using Context Personal Ubiquitous Com-puting, Springer-Verlag, v.5, pp.4-7, 2001.
[7] M. Baldauf, S. Dustdar, F. Rosenberg,A survey on context-aware systems,Int. J. Ad Hoc Ubiquitous Comput., Inderscience Publishers, v.2, pp.263-277, 2007.
[8] T. Gu, H. Pung, D. Zhang, X. Wang,A Middleware for Building Context-Aware Mobile Services, IEEE Vehicular Technology Conference (VTC),2004.
4http://paos.colorado.edu/research/wavelets/
[9] A. Manzoor, H.L. Truong, S. Dustdar, Quality Aware Context InformationAggregation System for Pervasive Environments, 2009 International Con-ference on Advanced Information Networking and Applications Work-shops, IEEE Computer Society, pp.266-271, 2009.
[10] S. Sathe, T.G. Papaioannou, H. Jeung and K. Aberer, A Survey of Model-based Sensor Data Acquisition and Management, Managing and MiningSensor Data, Springer US, pp.9-50, ISBN 978-1-4614-6308-5, 2013.
[11] Q.A. Bakhtiar, K. Makki and N. Pissinou, Data Reduction in Low Pow-ered Wireless Sensor Networks, Wireless Sensor Networks - Technologyand Applications, Chapter 8, pp. 171-186, ISBN 978-953-51-0676-0,Published: July 18, 2012.
[12] J. Smalls; W. Yue; L. Xi; C. Zehuang; K.W. Tang, Health monitoringsystems for massive emergency situations, Systems, Applications andTechnology Conference, 2009, LISAT ’09, IEEE Long Island, pp.1-11.
[13] A. Alahmadi; B. Soh, A smart approach towards a mobile e-healthmonitoring system architecture, Research and Innovation in InformationSystems (ICRIIS), 2011 International Conference on, 2011, pp.1-5.
[14] X. Haitao; T. Li; H. Ogai; Z. Xiaohong; T. Otawa; S. Umeda; T. Tsuji,The health monitoring system based on distributed data aggregationfor WSN used in bridge diagnosis, SICE Annual Conference 2010,Proceedings of, 2010, pp.2134-2138.
[15] J. Bringel Filho, N. AgoulmineEvaluation of Quality of Context Infor-mation in U-Health Smart Homes In: IGI Global. (Org.). Telemedicineand E-Health Services, Policies and Applications: Advancements andDevelopments. Hershey PA: IGI Global, 2012.
[16] J. Bringel Filho, A.D. Miron, I. Satoh, J. Gensel,H. Martin. Modelingand Measuring Quality of Context Information in Pervasive Environ-ments. In: 24th IEEE International Conference on Advanced InformationNetworking and Applications, 2010, Perth, Australia. AINA 2010. LosAlamitos, CA: ACM, 2010. v. 24. p. 690-697. .
[17] J. Bringel Filho, N. Agoulmine. A Quality-Aware Approach for Resolv-ing Context Conflicts in Context-Aware Systems In: 9th IEEE/IFIP Interna-tional Conference on Embedded and Ubiquitous Computing, Melbourne.EUC, 2011.
[18] C.G.N Carvalho; D.G. Gomes; N. Agoulmine; J.N. Souza, ImprovingPrediction Accuracy for WSN Data Reduction by Applying MultivariateSpatio-Temporal Correlation, Sensors, Vol.11, 2011, No11, pp.10010-10037.
[19] G. Anastasi; M. Conti; M.D. Francesco; A. Passarella, Energy conser-vation in wireless sensor networks: A survey, 2009, Ad Hoc Networks,Vol.7, No3, pp.537-568.
[20] J. Yick; B. Mukherjee; D. Ghosal, Wireless sensor network survey,Computer Networks, 2008, Vol.52, pp.2292-2330.
[21] P. Chulsung, P.H. Chou, B. Ying, R. Matthews, A. Hibbs, An ultra-wearable, wireless, low power ECG monitoring system. BiomedicalCircuits and Systems Conference, 2006. BioCAS 2006. IEEE , vol., no.,pp.241,244, Nov. 29 2006-Dec. 1 2006.
[22] J. Li, A. Deshpande and S. Khuller, On computing compression treesfor data collection in wireless sensor networks, Proceedings of the 29thconference on Information communications, INFOCOM’10, ISBN 978-1-4244-5836-3, San Diego, California, USA, pp.2115-2123, IEEE Press,2010.
[23] L. Chong, W. Kui and P. Jian, An Energy-Efficient Data CollectionFramework for Wireless Sensor Networks by Exploiting SpatiotemporalCorrelation, Parallel and Distributed Systems, IEEE Transactions on, Vol.18, No 7, pp.1010-1023, July, 2007.
[24] J. Hongbo, J. Shudong and W. Chonggang, Prediction or Not? AnEnergy-Efficient Framework for Clustering-Based Data Collection inWireless Sensor Networks, Parallel and Distributed Systems, IEEE Trans-actions on, Vol.22, No.6, pp. 1064-1071, 2011
[25] S. Santini and K. Romer, An Adaptive Strategy for Quality-Based DataReduction in Wireless Sensor Networks, Proc. INSS, 2006.
[26] A. Skordylis, A. Guitton and N. Trigoni, Correlation-based data dissem-ination in traffic monitoring sensor networks, Proceedings of the 2006ACM CoNEXT conference, CoNEXT ’06, ISBN 1-59593-456-1, Lisboa,Portugal, ACM, 2006.
[27] C.J. Debono and N.P. Borg, The Implementation of an Adaptive DataReduction Technique for Wireless Sensor Networks, Signal Processing andInformation Technology, ISSPIT 2008, IEEE International Symposiumon, pp.402-406, 2008.
[28] C. Wei and I.J. Wassell, Energy efficient signal acquisition via com-pressive sensing in wireless sensor networks, Wireless and PervasiveComputing (ISWPC), 6th International Symposium on, pp.1-6, 2011.
2014 IEEE 16th International Conference on e-Health Networking, Applications and Services (Healthcom)