105
Using the “Virginia Livestock Watering Systems” Worksheet Designing Pressurized Livestock Watering Systems Prince George Training January 31, 2017 Raleigh Coleman, DCR

Using the “Virginia Livestock
Watering Systems” WorksheetDesigning Pressurized Livestock Watering Systems
Prince George Training
January 31, 2017
Raleigh Coleman, DCR
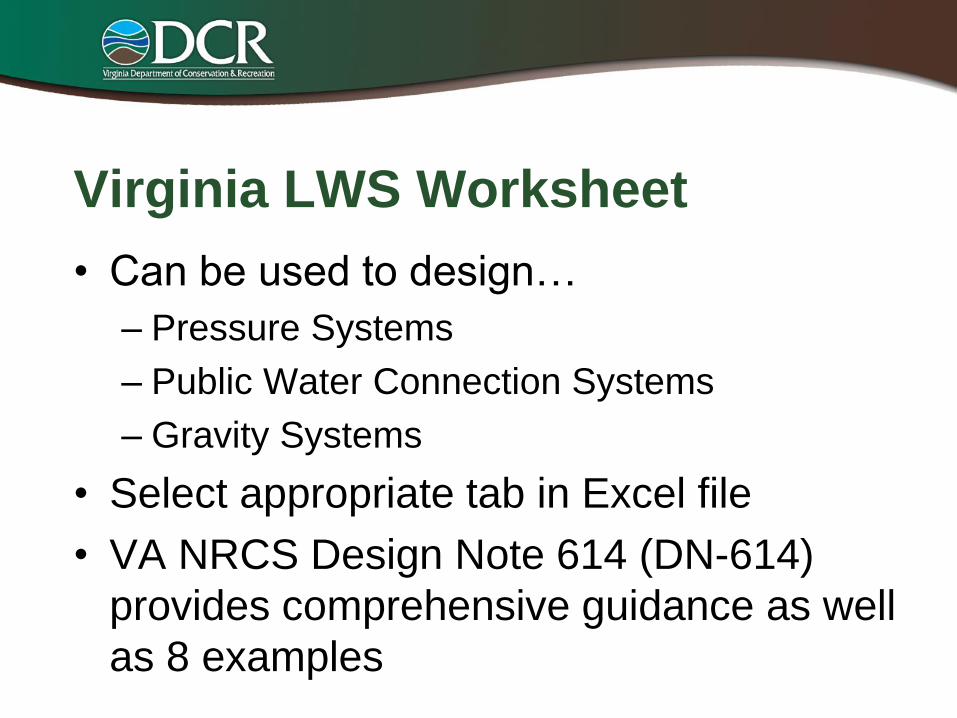
Virginia LWS Worksheet
• Can be used to design…
– Pressure Systems
– Public Water Connection Systems
– Gravity Systems
• Select appropriate tab in Excel file
• VA NRCS Design Note 614 (DN-614)
provides comprehensive guidance as well
as 8 examples

Select Appropriate Tab

Pressure System Design


What is a “Pressure System”?
• Water supplied via a pumping plant– Pump: moves water through the system
– Pressure Tank: maintains pressure when the pump is not
running
– Pump Switch: tells the pump when to run
• Troughs on Float Valves
to contain pressure (and
water)
What is the purpose of the worksheet?
TRUE or FALSE: The purpose of the “Pressure
System Worksheet” is to size the pipeline.
The worksheet has many purposes, not just sizing the
pipeline.

What is the purpose of the worksheet?• Evaluate the “Water Budget”: Is the water source adequate?
• Determine an appropriate design flow rate (pumping rate)
• Determine appropriate minimum pipeline diameter(s)
• Determine the energy requirements for the system Size the pump
Determine the pressure switch settings
• Determine a minimum volume for the pressure tank
• Check for excessive static pressure at the pressure switch and
at the trough float valves (and in the pipeline)
• Indirectly: Determine if components may need to be positioned
differently on the landscape (or if an alternative system should
be used) if energy requirements are excessive
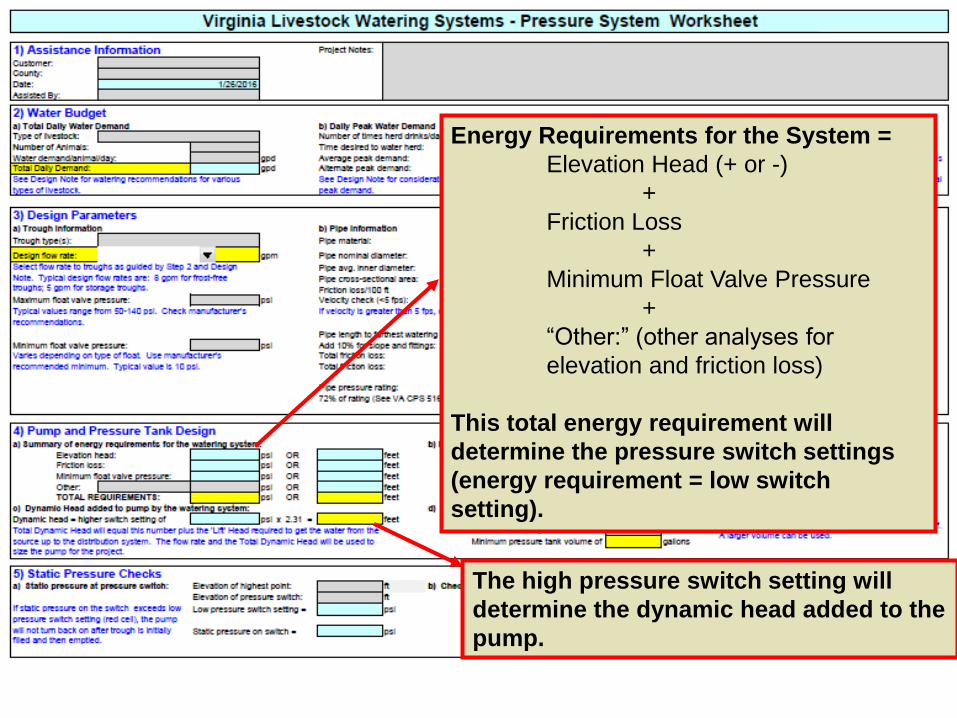
Energy Requirements for the System =
Elevation Head (+ or -)
+
Friction Loss
+
Minimum Float Valve Pressure
+
“Other:” (other analyses for
elevation and friction loss)
This total energy requirement will
determine the pressure switch settings
(energy requirement = low switch
setting).
The high pressure switch setting will
determine the dynamic head added to the
pump.

Dynamic Head• Pressure when water is flowing in the system
• Depends on the initial pressure (determined by the pressure
switch), differences in elevation, and friction loss from the
movement of water through the system
• Importance: We need to determine how much dynamic head will
be needed to make the system work properly (i.e. What is the
minimum amount of pressure energy that will allow the system to
deliver water to the troughs?).
• The energy requirements will determine the pressure switch settings and the
dynamic head added to the pump.
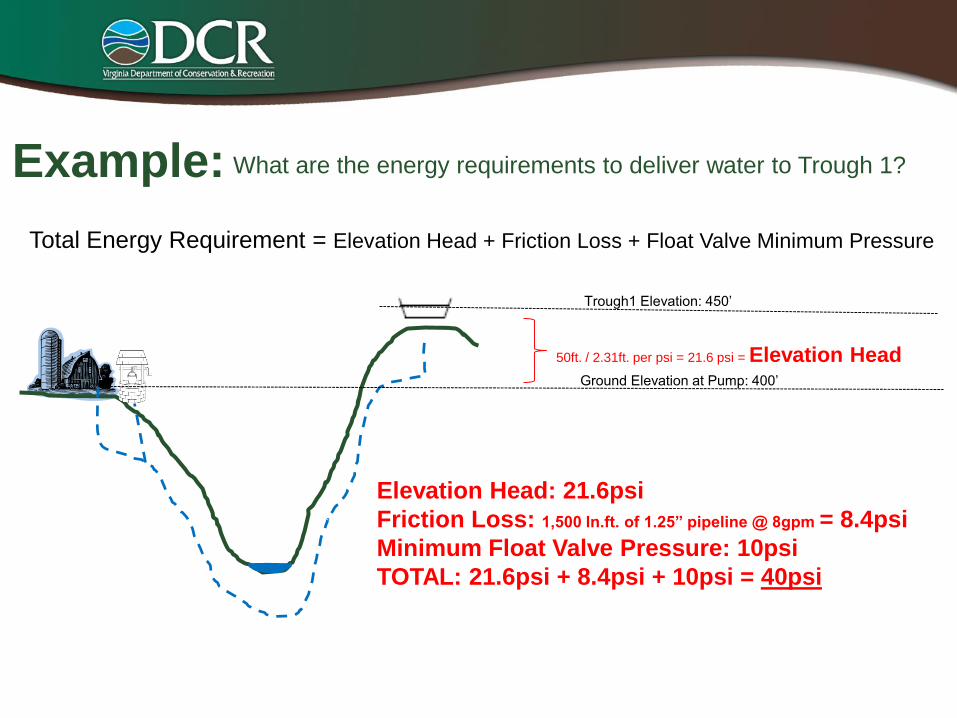
Example:
Trough1 Elevation: 450’
Ground Elevation at Pump: 400’
What are the energy requirements to deliver water to Trough 1?
50ft. / 2.31ft. per psi = 21.6 psi = Elevation Head
Total Energy Requirement = Elevation Head + Friction Loss + Float Valve Minimum Pressure
Elevation Head: 21.6psi
Friction Loss: 1,500 ln.ft. of 1.25” pipeline @ 8gpm = 8.4psi
Minimum Float Valve Pressure: 10psi
TOTAL: 21.6psi + 8.4psi + 10psi = 40psi

Static Pressure• Pressure when the system is at rest
• Friction loss is not a factor (water is not moving)
• Pressure will increase or decrease throughout the system based
on elevation difference at each point from the pressure switch
• 1psi of pressure is gained for each 2.31 feet of elevation in a
column of water
• NOTE: The width of the column of water does not matter! Only the vertical
elevation change affects pressure in the system.
• Importance: We need to check to make sure that static pressure is
not too high at low points in the system.
• Float Valves
• Pipeline
Prevent this from happening:
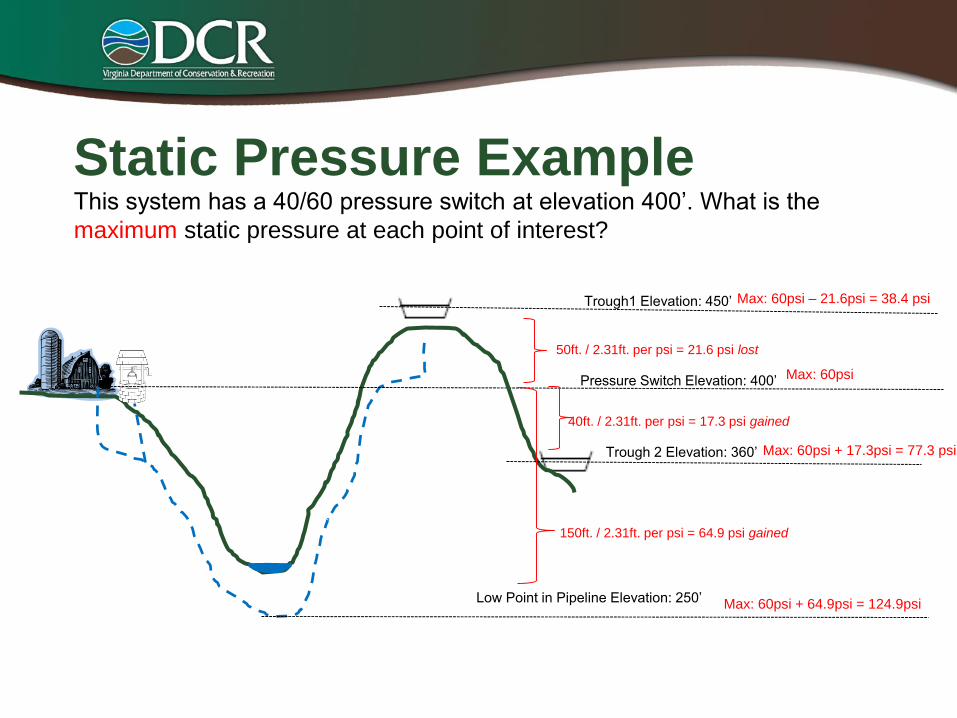
Static Pressure Example
Trough1 Elevation: 450’
Pressure Switch Elevation: 400’
Low Point in Pipeline Elevation: 250’
Trough 2 Elevation: 360’
This system has a 40/60 pressure switch at elevation 400’. What is the
maximum static pressure at each point of interest?
50ft. / 2.31ft. per psi = 21.6 psi lost
Max: 60psi – 21.6psi = 38.4 psi
Max: 60psi
40ft. / 2.31ft. per psi = 17.3 psi gained
Max: 60psi + 17.3psi = 77.3 psi
150ft. / 2.31ft. per psi = 64.9 psi gained
Max: 60psi + 64.9psi = 124.9psi
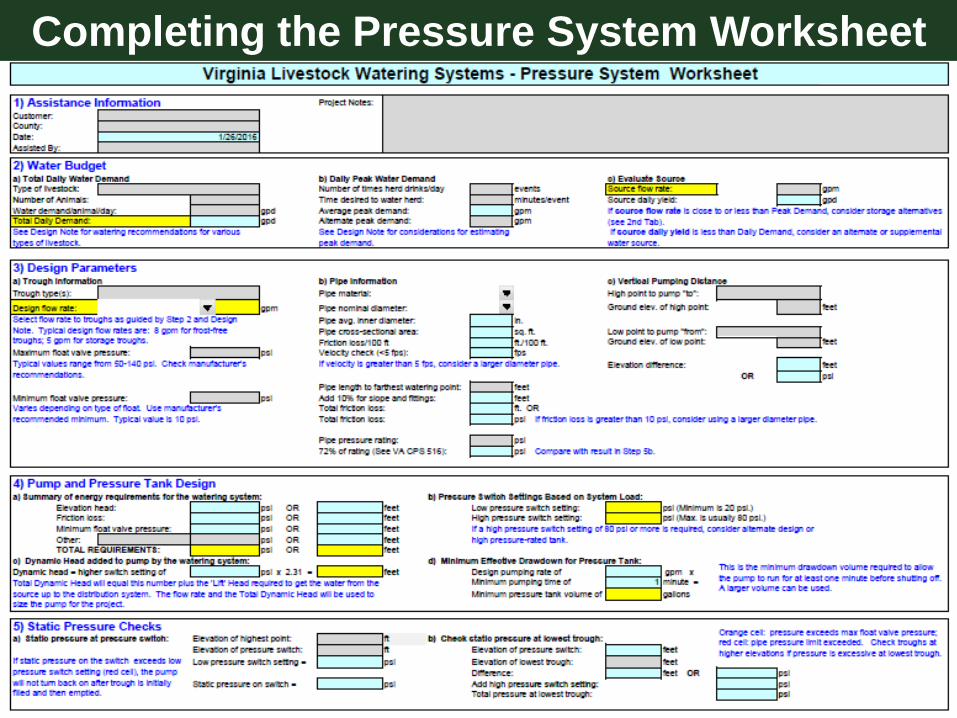
Completing the Pressure System Worksheet

Project Notes
Project Notes: Include a brief description of the project, including any unique
aspects (enough for your engineer, coworker, contractor to understand your inputs
and your plans for the system).
Specifically:
• Is this a completely new system, or is it building off of an existing system?
• Will there be more than one analysis? (e.g., multiple pipeline sizes, remote
pressure tank, adding to existing system, etc.) If so, describe the purpose of this
analysis.
• Is there anything that you would like to highlight for the contractor/landowner?
(e.g. which troughs have excessive pressure, notes on well yield, etc.)
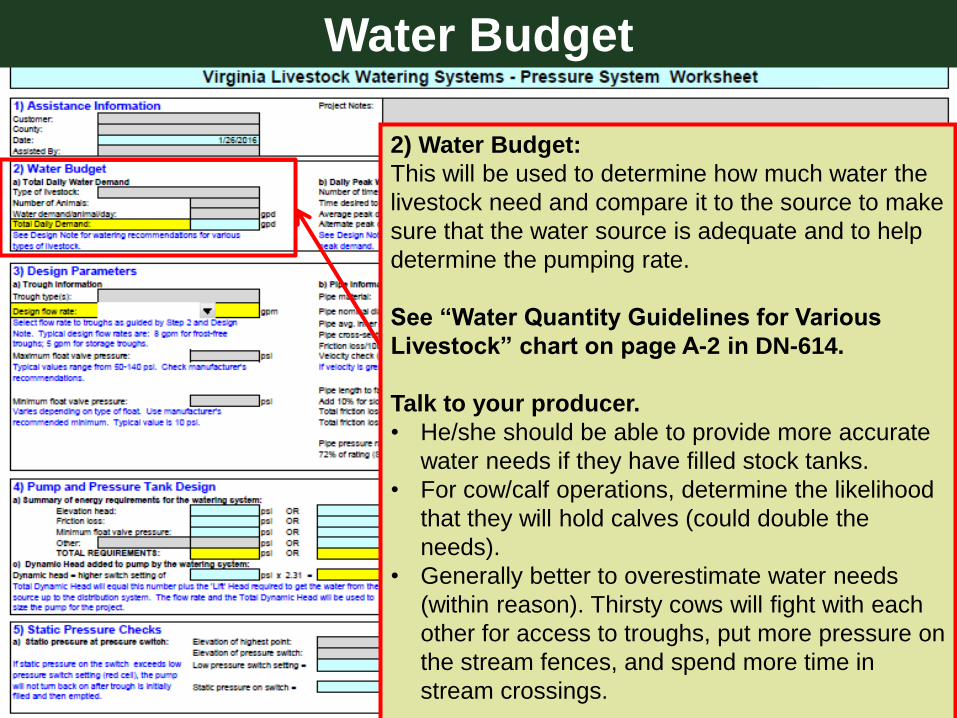
Water Budget
2) Water Budget:
This will be used to determine how much water the
livestock need and compare it to the source to make
sure that the water source is adequate and to help
determine the pumping rate.
See “Water Quantity Guidelines for Various
Livestock” chart on page A-2 in DN-614.
Talk to your producer.
• He/she should be able to provide more accurate
water needs if they have filled stock tanks.
• For cow/calf operations, determine the likelihood
that they will hold calves (could double the
needs).
• Generally better to overestimate water needs
(within reason). Thirsty cows will fight with each
other for access to troughs, put more pressure on
the stream fences, and spend more time in
stream crossings.

DN-614,
Page A-2
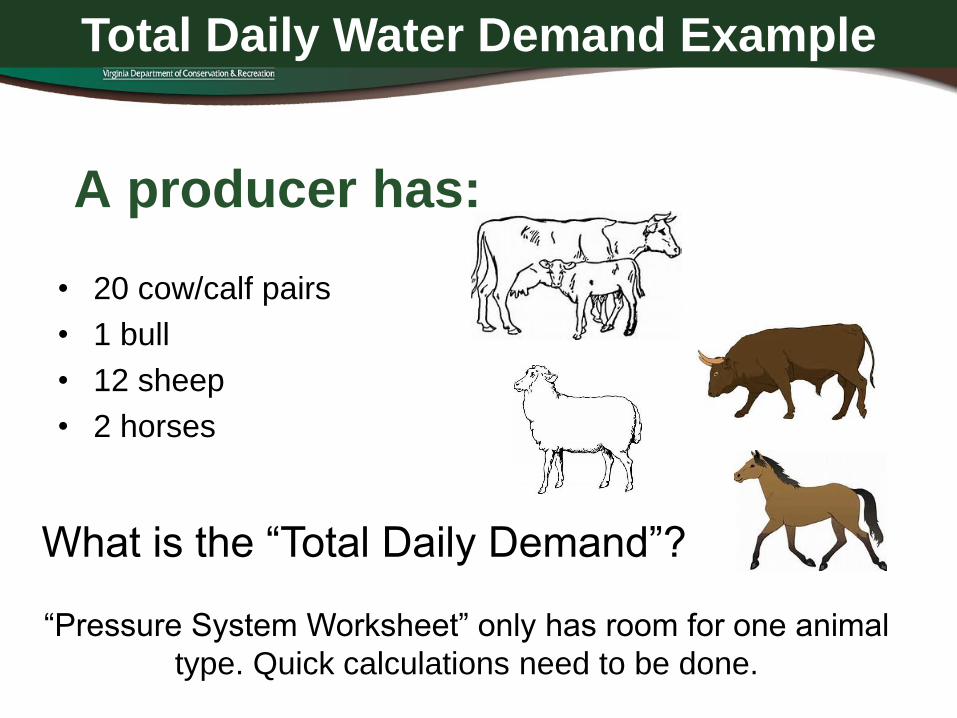
A producer has:
Total Daily Water Demand Example
• 20 cow/calf pairs
• 1 bull
• 12 sheep
• 2 horses
What is the “Total Daily Demand”?
“Pressure System Worksheet” only has room for one animal
type. Quick calculations need to be done.
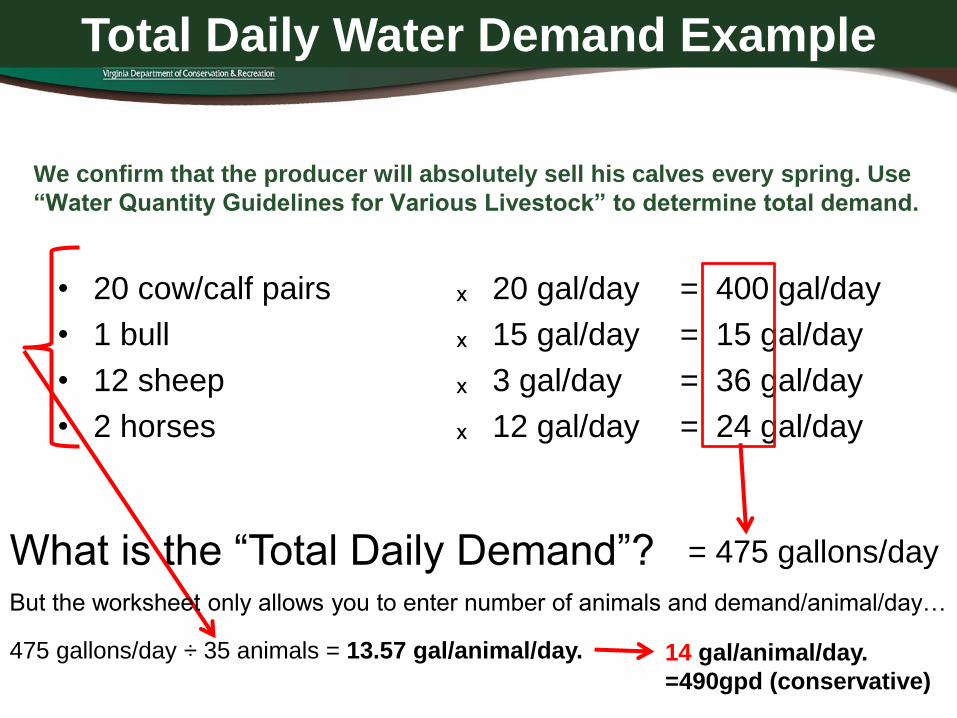
We confirm that the producer will absolutely sell his calves every spring. Use
“Water Quantity Guidelines for Various Livestock” to determine total demand.
• 20 cow/calf pairs
• 1 bull
• 12 sheep
• 2 horses
Total Daily Water Demand Example
What is the “Total Daily Demand”?
ₓ 20 gal/day
ₓ 15 gal/day
ₓ 3 gal/day
ₓ 12 gal/day
= 400 gal/day
= 15 gal/day
= 36 gal/day
= 24 gal/day
= 475 gallons/day
But the worksheet only allows you to enter number of animals and demand/animal/day…
475 gallons/day ÷ 35 animals = 13.57 gal/animal/day. 14 gal/animal/day.
=490gpd (conservative)
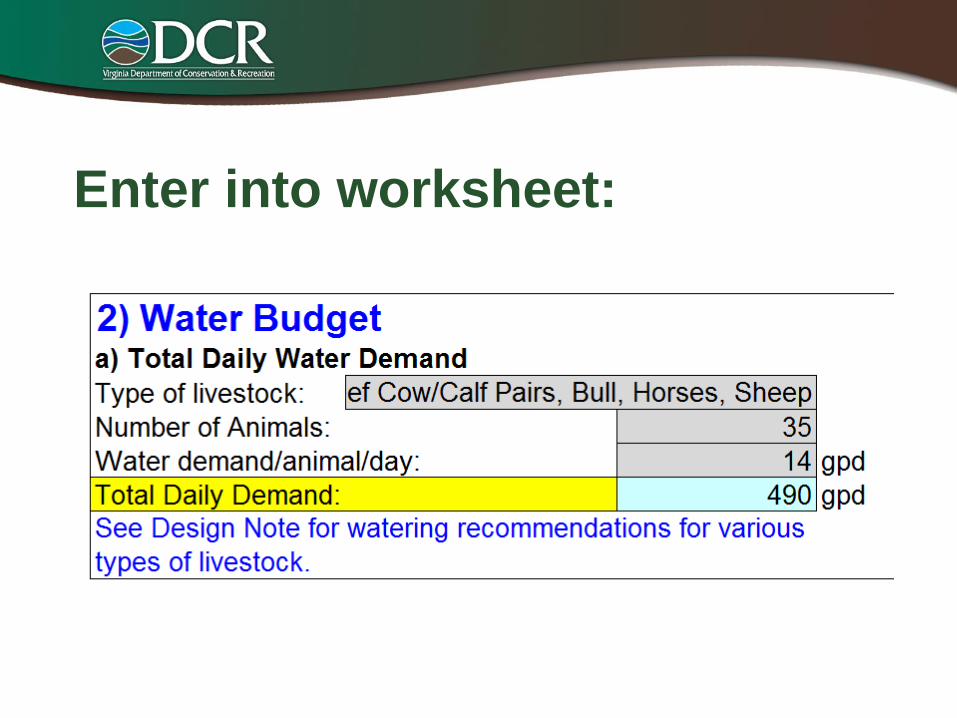
Enter into worksheet:

Water Budget
2) Water Budget:
b. Daily Peak Water Demand
• This will calculate the livestock’s peak demand
for water. An “Alternate Peak Demand” can be
entered based on the planner’s experience.
• The following slides provide info for calculating
“Average Peak Demand” and deciding on a
possible “Alternate Peak Demand.”
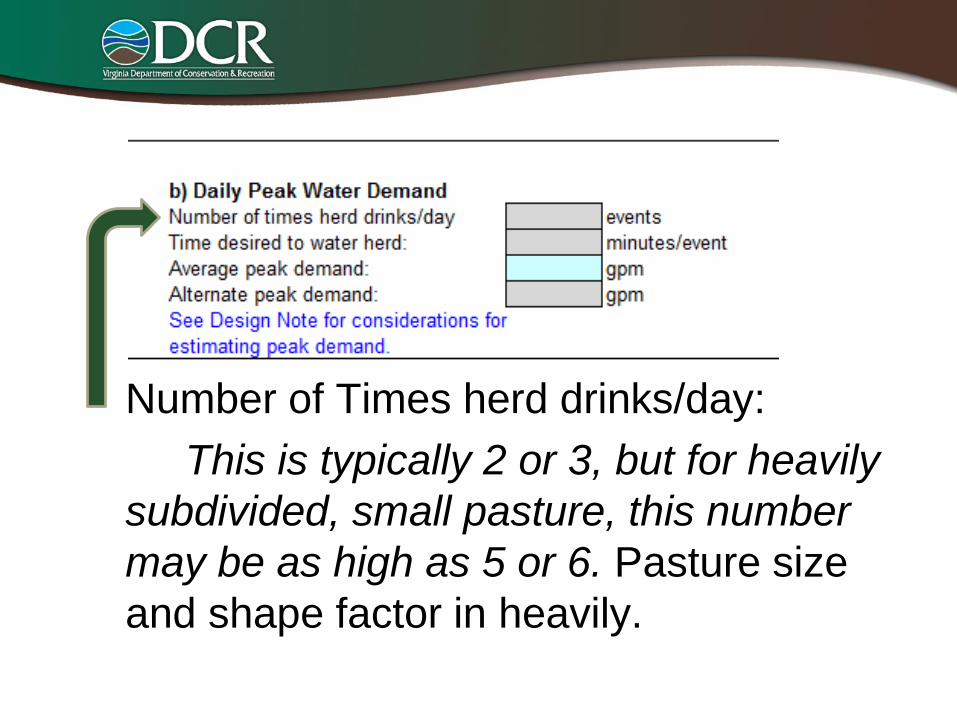
• Number of Times herd drinks/day:
This is typically 2 or 3, but for heavily
subdivided, small pasture, this number
may be as high as 5 or 6. Pasture size
and shape factor in heavily.

From the Missouri Livestock Watering Systems Handbook:
• Distance animals have to travel to get to water affects herd
behavior as related to the social event of going to the water hole
and the amount of water consumed.
• According to cow psychologists, cattle go to water less frequently
and go as a herd or large grazing groups if water is farther than
800 feet from the pasture.
• If water is closer animals tend to go to water more often and as
singles, pairs, or small groups (especially in flat or gently rolling
terrain where they can keep sight of their buddies).
• The design delivery rate should be the maximum available or
maximum required whichever is less. The tank size should be
made bigger for low delivery systems. History has shown that
oversized tanks work well with few problems.
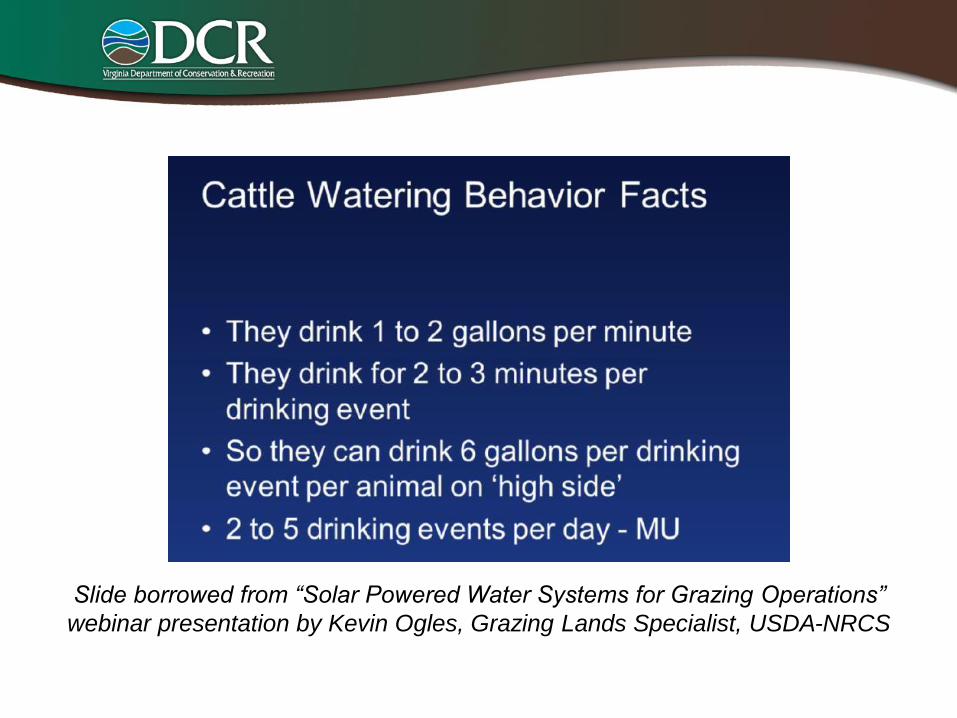
Slide borrowed from “Solar Powered Water Systems for Grazing Operations”
webinar presentation by Kevin Ogles, Grazing Lands Specialist, USDA-NRCS
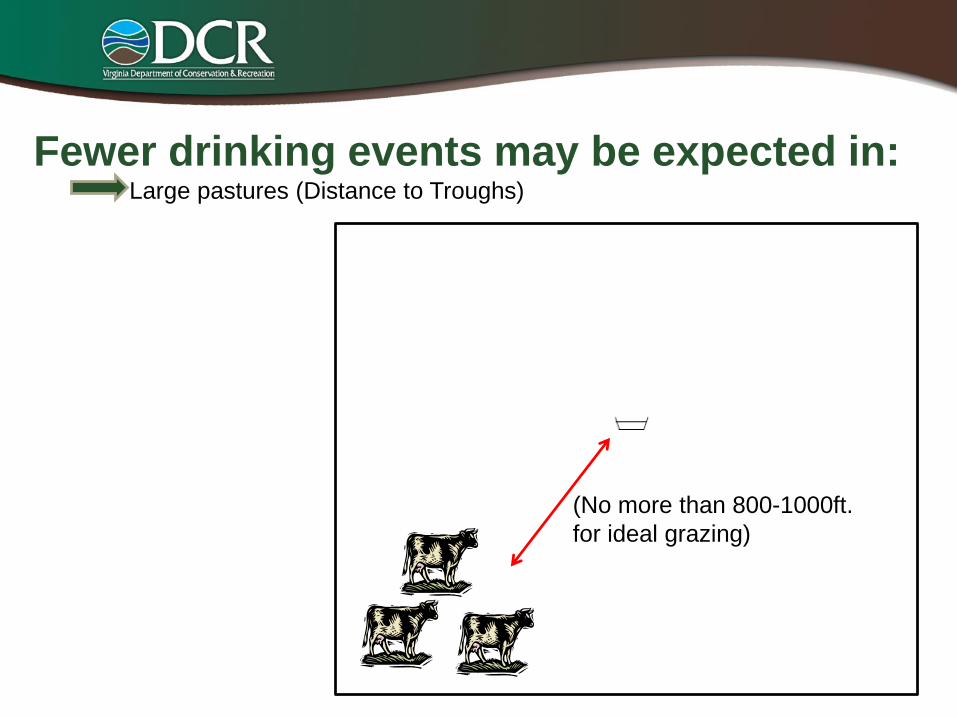
Fewer drinking events may be expected in:Large pastures (Distance to Troughs)
(No more than 800-1000ft.
for ideal grazing)

Fewer drinking events may be expected in:Large pastures (Distance to Troughs)
Odd-Shaped Pastures or Non-Centrally Located Troughs
Fewer drinking events may be expected in:Large pastures (Distance to Troughs)
Odd-Shaped Pastures or Non-Centrally Located Troughs
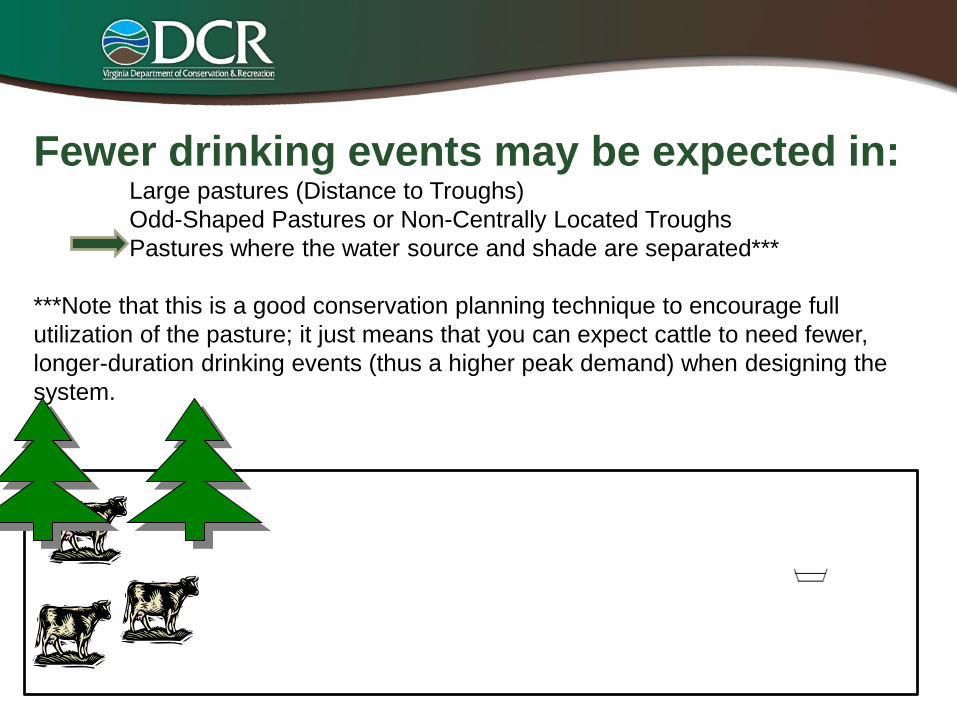
Pastures where the water source and shade are separated***
***Note that this is a good conservation planning technique to encourage full
utilization of the pasture; it just means that you can expect cattle to need fewer,
longer-duration drinking events (thus a higher peak demand) when designing the
system.
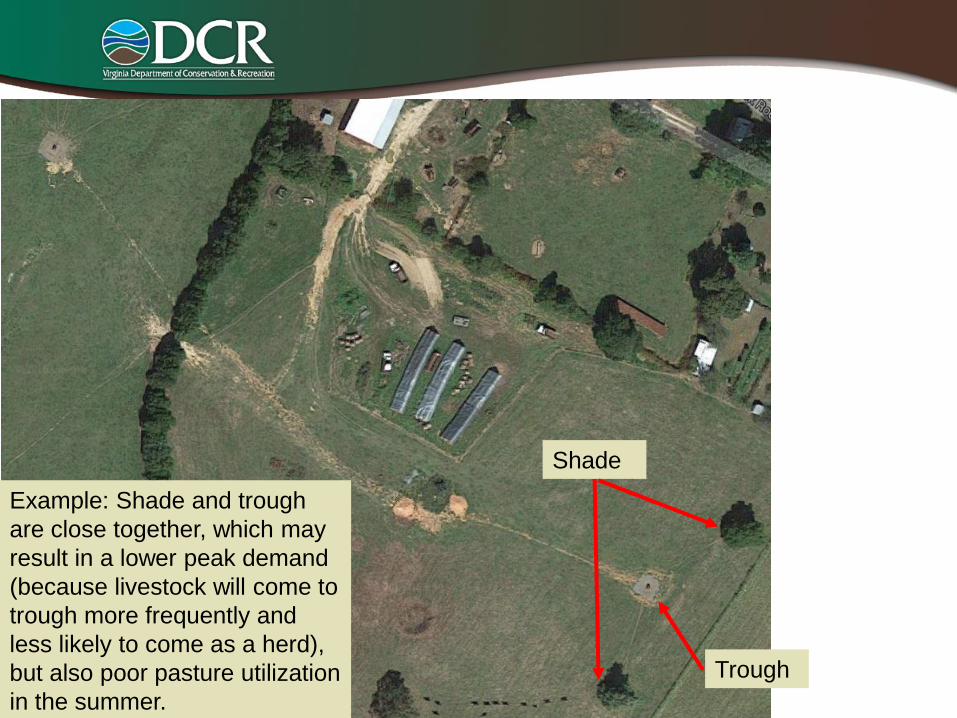
Example: Shade and trough
are close together, which may
result in a lower peak demand
(because livestock will come to
trough more frequently and
less likely to come as a herd),
but also poor pasture utilization
in the summer.
Shade
Trough
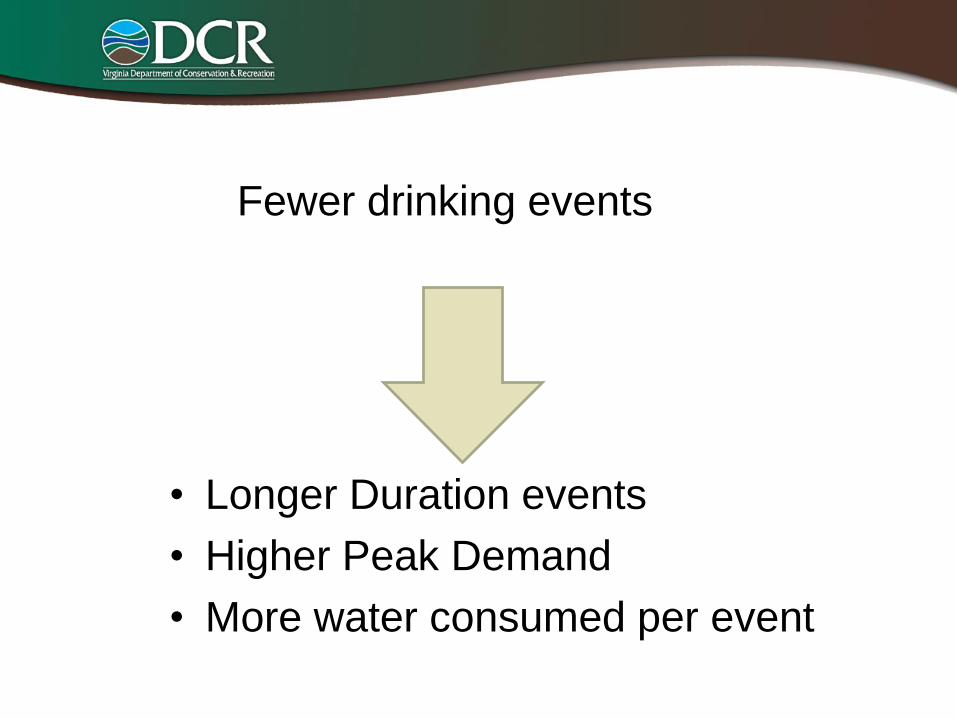
Fewer drinking events
• Longer Duration events
• Higher Peak Demand
• More water consumed per event

• Time desired to water herd:
Typical values are 30 to 60 minutes but is
highly subjective.
Time is valuable when cattle cannot graze
because they are waiting for water.
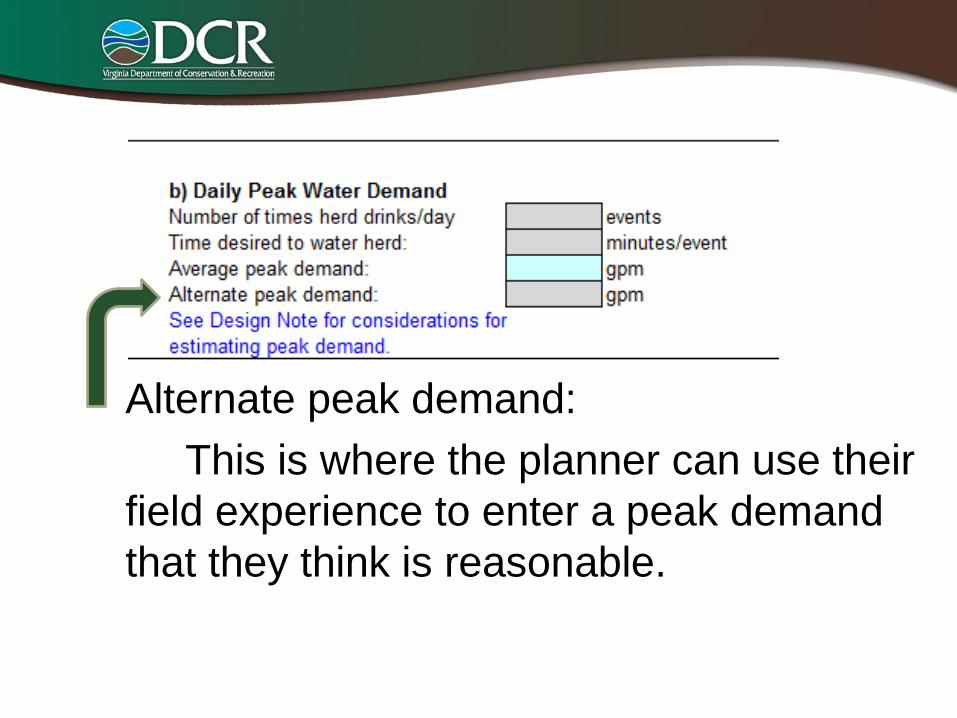
• Alternate peak demand:
This is where the planner can use their
field experience to enter a peak demand
that they think is reasonable.
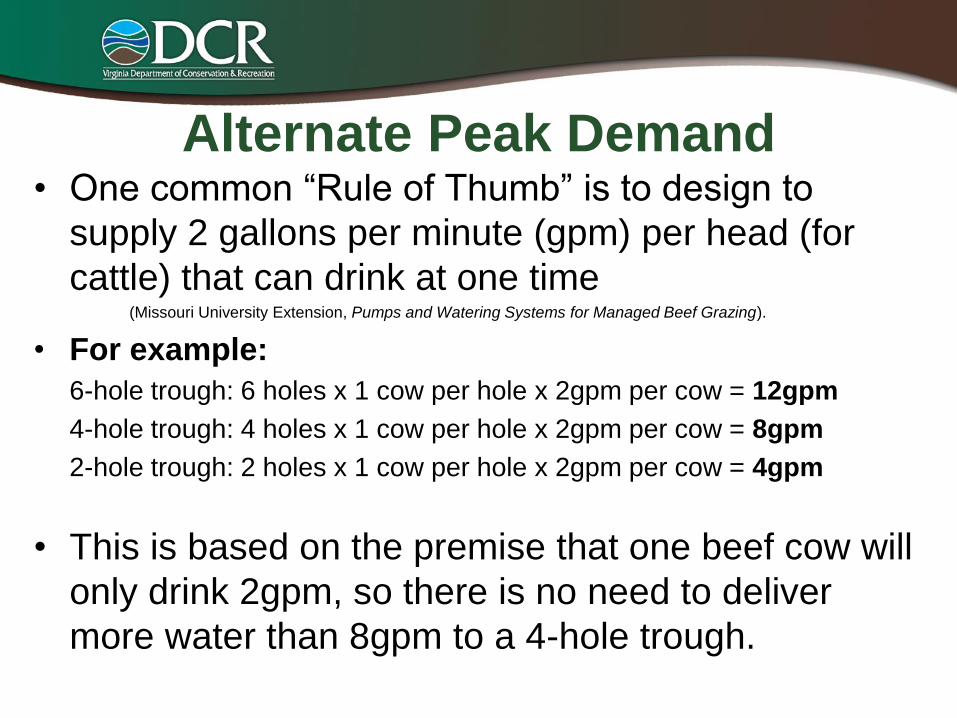
Alternate Peak Demand• One common “Rule of Thumb” is to design to
supply 2 gallons per minute (gpm) per head (for
cattle) that can drink at one time (Missouri University Extension, Pumps and Watering Systems for Managed Beef Grazing).
• For example:
6-hole trough: 6 holes x 1 cow per hole x 2gpm per cow = 12gpm
4-hole trough: 4 holes x 1 cow per hole x 2gpm per cow = 8gpm
2-hole trough: 2 holes x 1 cow per hole x 2gpm per cow = 4gpm
• This is based on the premise that one beef cow will
only drink 2gpm, so there is no need to deliver
more water than 8gpm to a 4-hole trough.
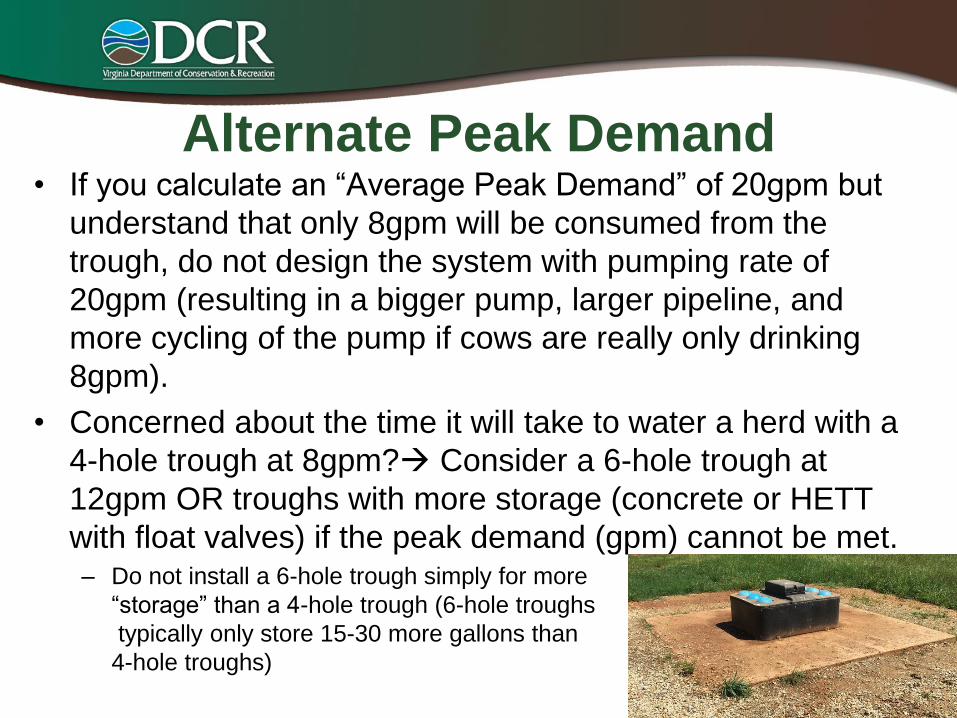
Alternate Peak Demand• If you calculate an “Average Peak Demand” of 20gpm but
understand that only 8gpm will be consumed from the
trough, do not design the system with pumping rate of
20gpm (resulting in a bigger pump, larger pipeline, and
more cycling of the pump if cows are really only drinking
8gpm).
• Concerned about the time it will take to water a herd with a
4-hole trough at 8gpm? Consider a 6-hole trough at
12gpm OR troughs with more storage (concrete or HETT
with float valves) if the peak demand (gpm) cannot be met.– Do not install a 6-hole trough simply for more
“storage” than a 4-hole trough (6-hole troughs
typically only store 15-30 more gallons than
4-hole troughs)
Okay girls, we need to drink a little slower – this drinking
event is supposed to last one hour.

Recommended Approach:
• Calculate an “Average Peak Demand” using 30-60 minutes per event and 3 events.
• Compare this result to the “Alternate Peak Demand” using the “2gpm-per-hole” approach
• If the “Average Peak Demand” >> “Alternate Peak Demand,” then:– Work backwards to determine how long it will take to water the herd at the “Alternate Peak Demand”
– If the Alternate Peak Demand is too low, upgrade to a trough with more holes or a storage trough
• If the “Average Peak Demand” << “Alternate Peak Demand,” then: – Use the “Alternate Peak Demand” as the “Design Flow Rate”
– Consider a trough with fewer holes as the “least cost, technically feasible alternative”
• If the “Average Peak Demand” ≈ “Alternate Peak Demand, then: GREAT!
• In this way, the “Average Peak Demand” can be thought of as more of a planning
tool and will rarely be used as the actual pumping rate.

Summary: Alternate Peak Demand
• 8gpm for 4-hole troughs
• 4gpm for 2-hole troughs
• 12gpm for 6-hole troughs
• 5gpm for concrete or HET troughs
• Compare to “Average peak demand” to
determine if trough size is appropriate
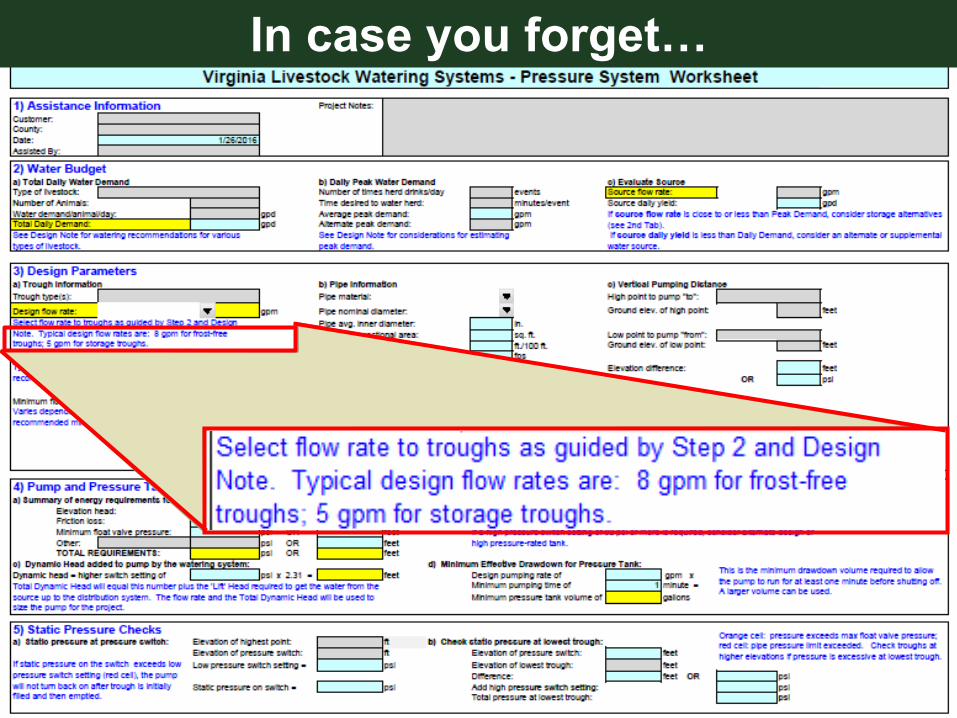
In case you forget…
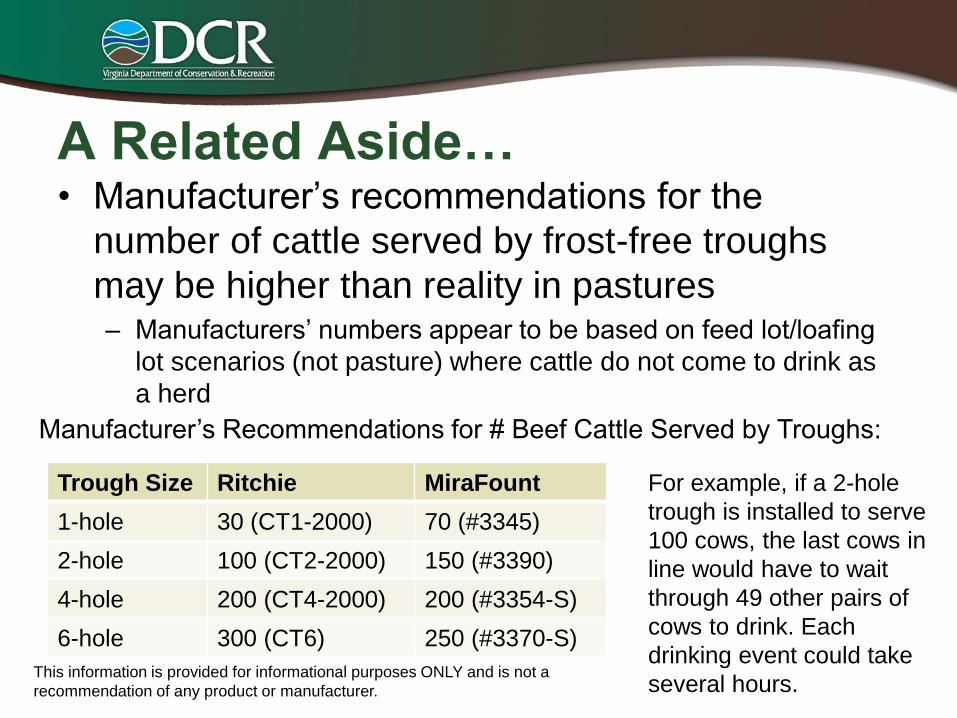
A Related Aside…• Manufacturer’s recommendations for the
number of cattle served by frost-free troughs
may be higher than reality in pastures– Manufacturers’ numbers appear to be based on feed lot/loafing
lot scenarios (not pasture) where cattle do not come to drink as
a herd
Trough Size Ritchie MiraFount
1-hole 30 (CT1-2000) 70 (#3345)
2-hole 100 (CT2-2000) 150 (#3390)
4-hole 200 (CT4-2000) 200 (#3354-S)
6-hole 300 (CT6) 250 (#3370-S)
Manufacturer’s Recommendations for # Beef Cattle Served by Troughs:
This information is provided for informational purposes ONLY and is not a
recommendation of any product or manufacturer.
For example, if a 2-hole
trough is installed to serve
100 cows, the last cows in
line would have to wait
through 49 other pairs of
cows to drink. Each
drinking event could take
several hours.

Trough Size Selection Example
• This is a large herd of 120 cow/calf pairs.
• If we plan for a 4-hole trough at 8gpm with 3 drinking events, how
long will it take to water the herd?
2400gpd/3 events = 800gallons per event
800gallons/8gpm = 100 minutes This is a long time!
• What if we planned to upgrade to a 6-hole trough with an “Alternate
Peak Demand”/”Design Flow Rate” of 12gpm
800gallons/12gpm = 67 minutes --> This is reasonable.
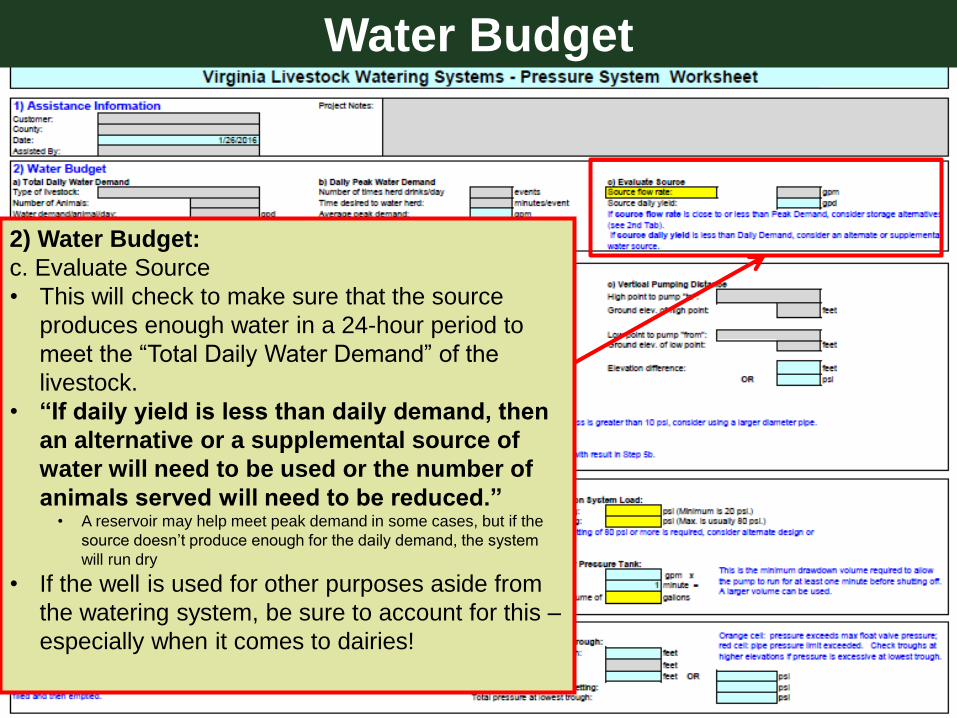
Water Budget
2) Water Budget:
c. Evaluate Source
• This will check to make sure that the source
produces enough water in a 24-hour period to
meet the “Total Daily Water Demand” of the
livestock.
• “If daily yield is less than daily demand, then
an alternative or a supplemental source of
water will need to be used or the number of
animals served will need to be reduced.”• A reservoir may help meet peak demand in some cases, but if the
source doesn’t produce enough for the daily demand, the system
will run dry
• If the well is used for other purposes aside from
the watering system, be sure to account for this –
especially when it comes to dairies!
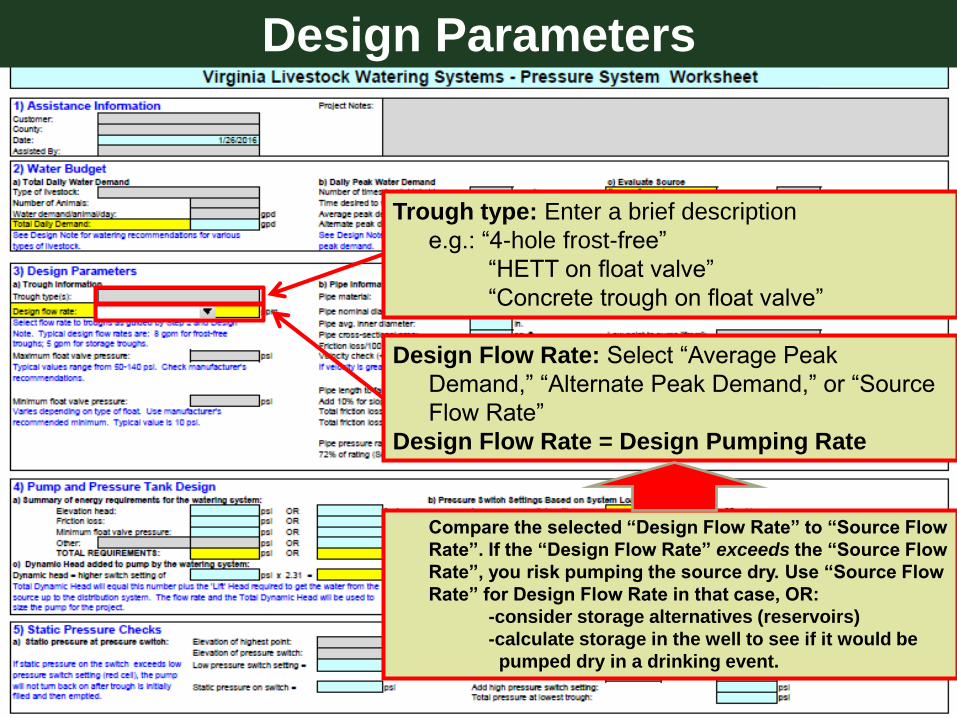
Design Parameters
Trough type: Enter a brief description
e.g.: “4-hole frost-free”
“HETT on float valve”
“Concrete trough on float valve”
Design Flow Rate: Select “Average Peak
Demand,” “Alternate Peak Demand,” or “Source
Flow Rate”
Design Flow Rate = Design Pumping Rate
Compare the selected “Design Flow Rate” to “Source Flow
Rate”. If the “Design Flow Rate” exceeds the “Source Flow
Rate”, you risk pumping the source dry. Use “Source Flow
Rate” for Design Flow Rate in that case, OR:
-consider storage alternatives (reservoirs)
-calculate storage in the well to see if it would be
pumped dry in a drinking event.
Design Flow Rate – Feasible?
• Don’t fall into “trap” of contractors saying
pumps only come in 5gpm, 10gpm, etc.
so you can’t plan for pumping rates of
8gpm, 12gpm, etc.
• A pump’s advertised flow rate is only the
average of its advertised pumping range!
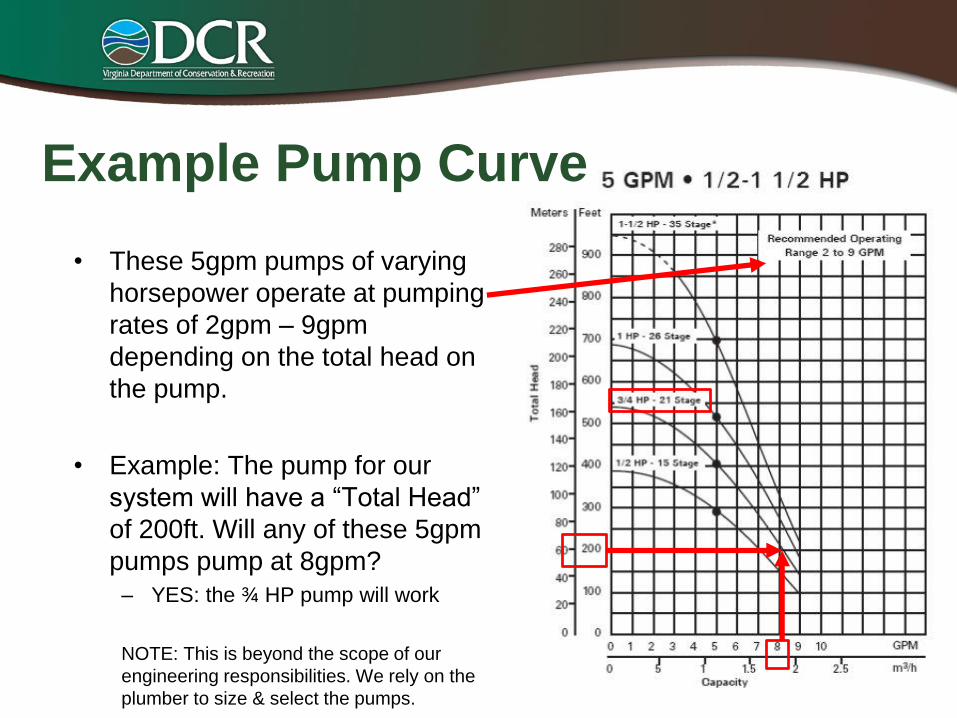
• These 5gpm pumps of varying
horsepower operate at pumping
rates of 2gpm – 9gpm
depending on the total head on
the pump.
• Example: The pump for our
system will have a “Total Head”
of 200ft. Will any of these 5gpm
pumps pump at 8gpm?
– YES: the ¾ HP pump will work
NOTE: This is beyond the scope of our
engineering responsibilities. We rely on the
plumber to size & select the pumps.
Example Pump Curve
Multiple size troughs in system?
• Decide on one design flow rate (there will
only be one pump for the system)
Design Parameters
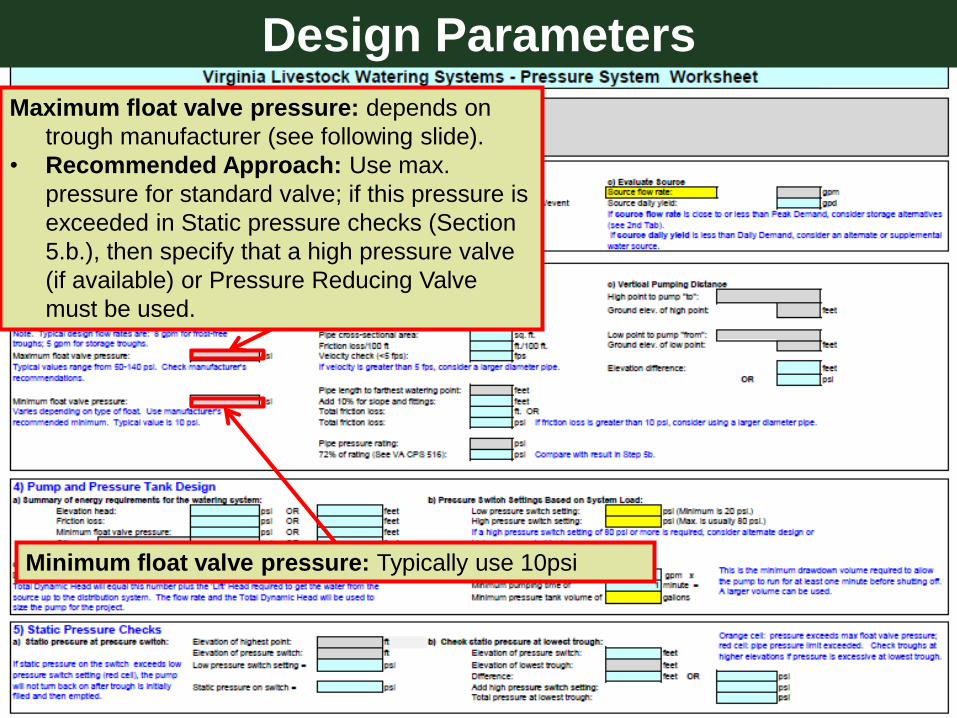
Maximum float valve pressure: depends on
trough manufacturer (see following slide).
• Recommended Approach: Use max.
pressure for standard valve; if this pressure is
exceeded in Static pressure checks (Section
5.b.), then specify that a high pressure valve
(if available) or Pressure Reducing Valve
must be used.
Minimum float valve pressure: Typically use 10psi
This information is provided for informational purposes ONLY and is not a recommendation of any product or manufacturer.
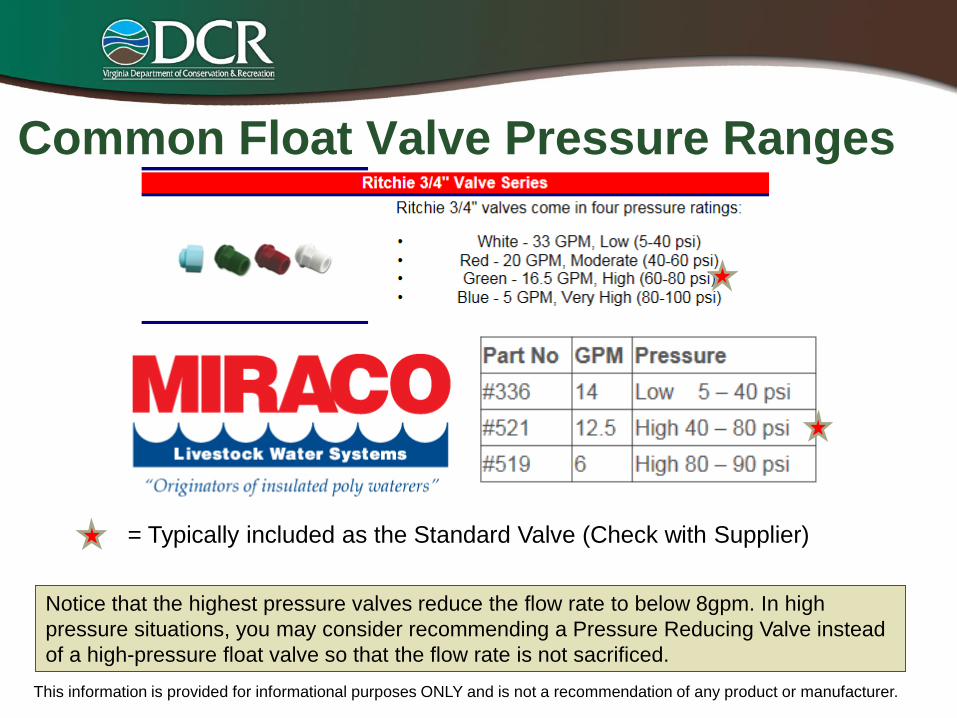
Common Float Valve Pressure Ranges
= Typically included as the Standard Valve (Check with Supplier)
Notice that the highest pressure valves reduce the flow rate to below 8gpm. In high
pressure situations, you may consider recommending a Pressure Reducing Valve instead
of a high-pressure float valve so that the flow rate is not sacrificed.
Design Parameters
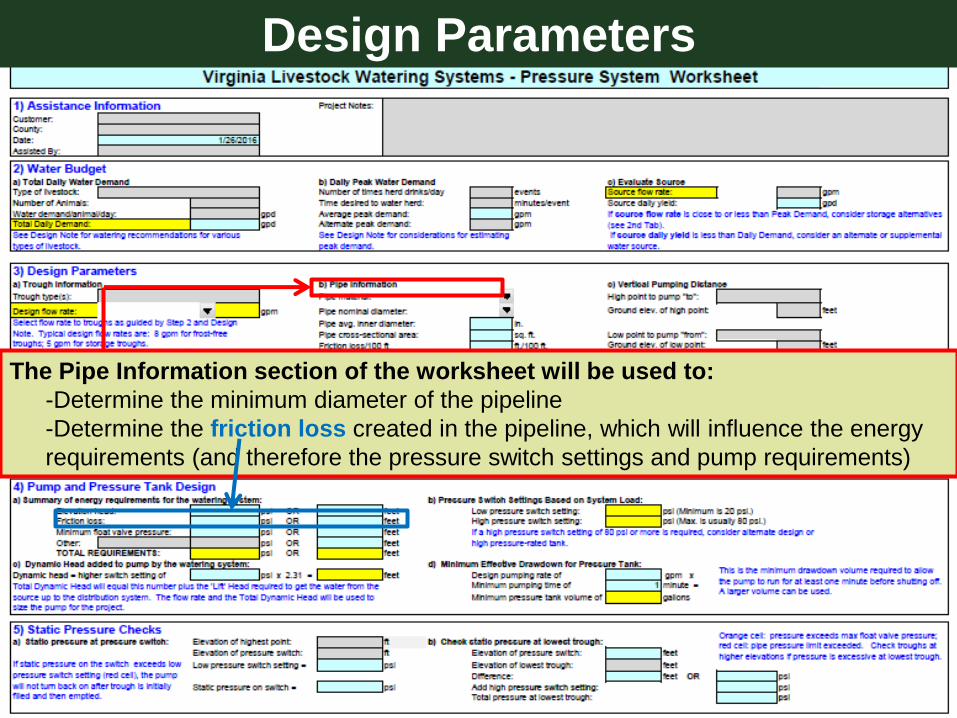
The Pipe Information section of the worksheet will be used to:
-Determine the minimum diameter of the pipeline
-Determine the friction loss created in the pipeline, which will influence the energy
requirements (and therefore the pressure switch settings and pump requirements)
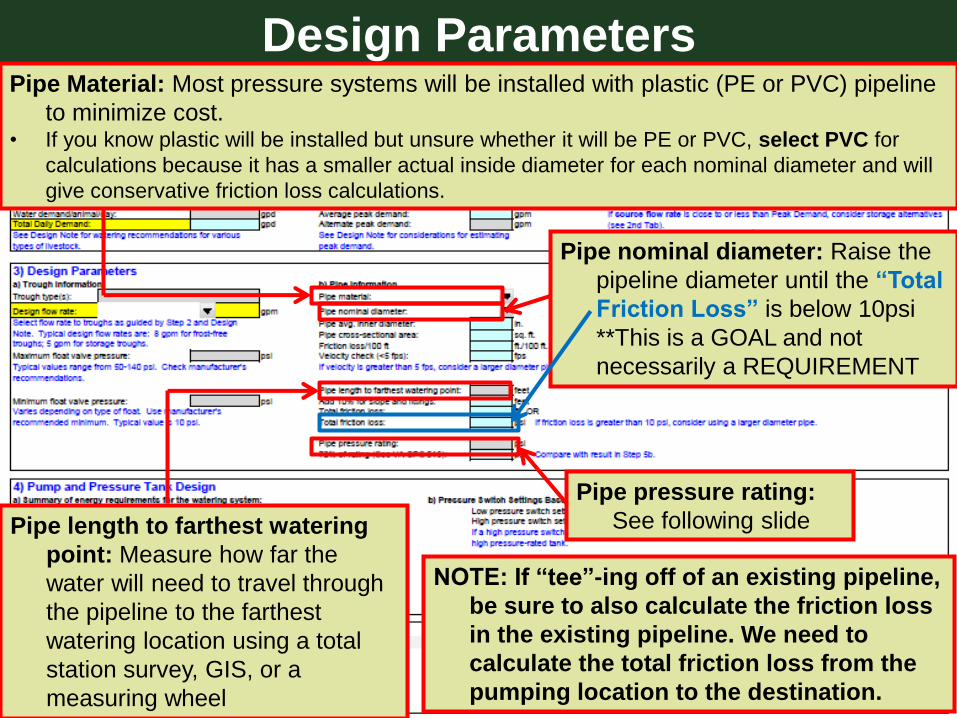
Design ParametersPipe Material: Most pressure systems will be installed with plastic (PE or PVC) pipeline
to minimize cost. • If you know plastic will be installed but unsure whether it will be PE or PVC, select PVC for
calculations because it has a smaller actual inside diameter for each nominal diameter and will
give conservative friction loss calculations.
Pipe nominal diameter: Raise the
pipeline diameter until the “Total
Friction Loss” is below 10psi
**This is a GOAL and not
necessarily a REQUIREMENT
Pipe length to farthest watering
point: Measure how far the
water will need to travel through
the pipeline to the farthest
watering location using a total
station survey, GIS, or a
measuring wheel
Pipe pressure rating:
See following slide
NOTE: If “tee”-ing off of an existing pipeline,
be sure to also calculate the friction loss
in the existing pipeline. We need to
calculate the total friction loss from the
pumping location to the destination.
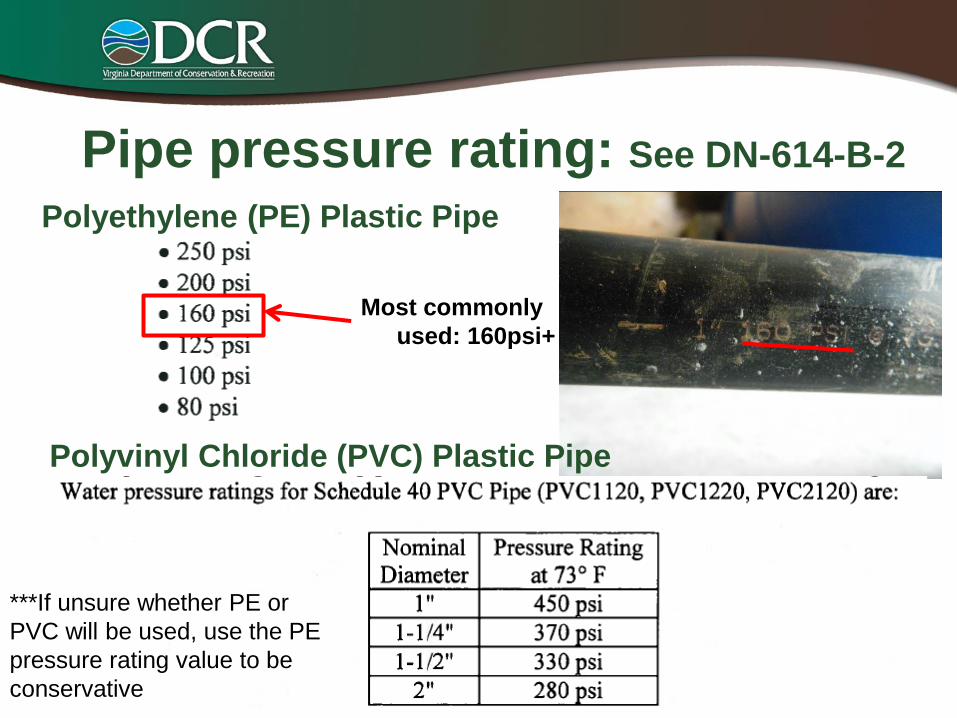
Pipe pressure rating: See DN-614-B-2
Polyethylene (PE) Plastic Pipe
Polyvinyl Chloride (PVC) Plastic Pipe
Most commonly
used: 160psi+
***If unsure whether PE or
PVC will be used, use the PE
pressure rating value to be
conservative

Pipeline Sizes
• All pipeline does not have to be the same size in a
system!
• Design the “least cost, technically feasible” alternative
– Keep the potential for future expansion in mind. If the producer
has committed to address farther fields at a later time, go
ahead and plan for this.
• Analyze total friction loss to trough(s) – if using two
different pipeline sizes, calculate friction loss in both
runs and add together.
• Use the run with highest friction loss on the final
worksheet that you size the pump with– Might not be the longest run (if one run has smaller pipe)!

Pipeline Size: Future Expansion?
Design Parameters
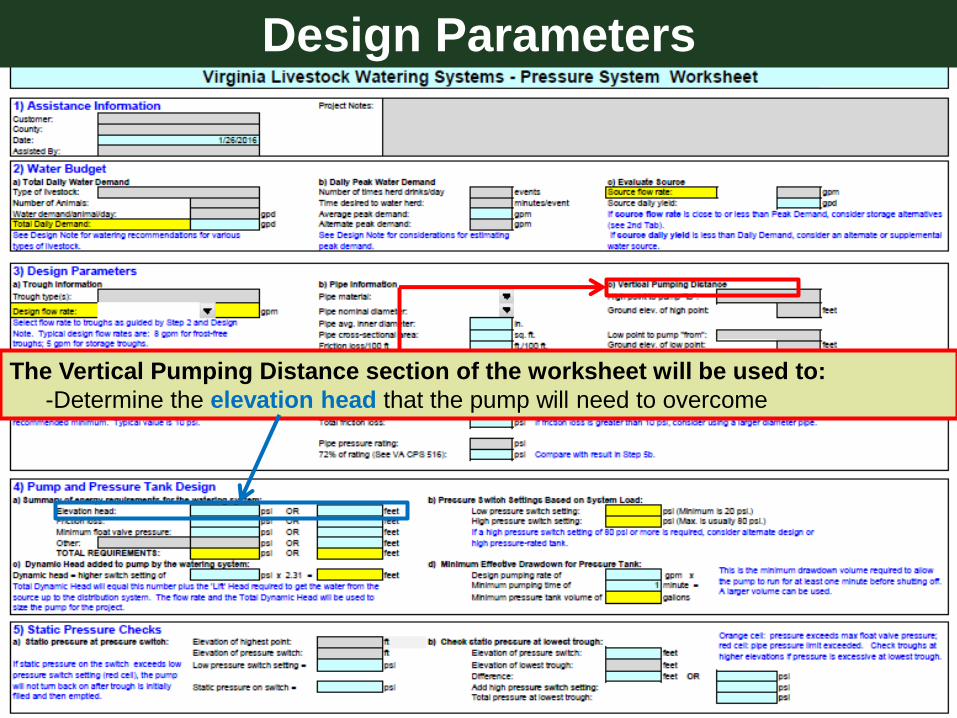
The Vertical Pumping Distance section of the worksheet will be used to:
-Determine the elevation head that the pump will need to overcome
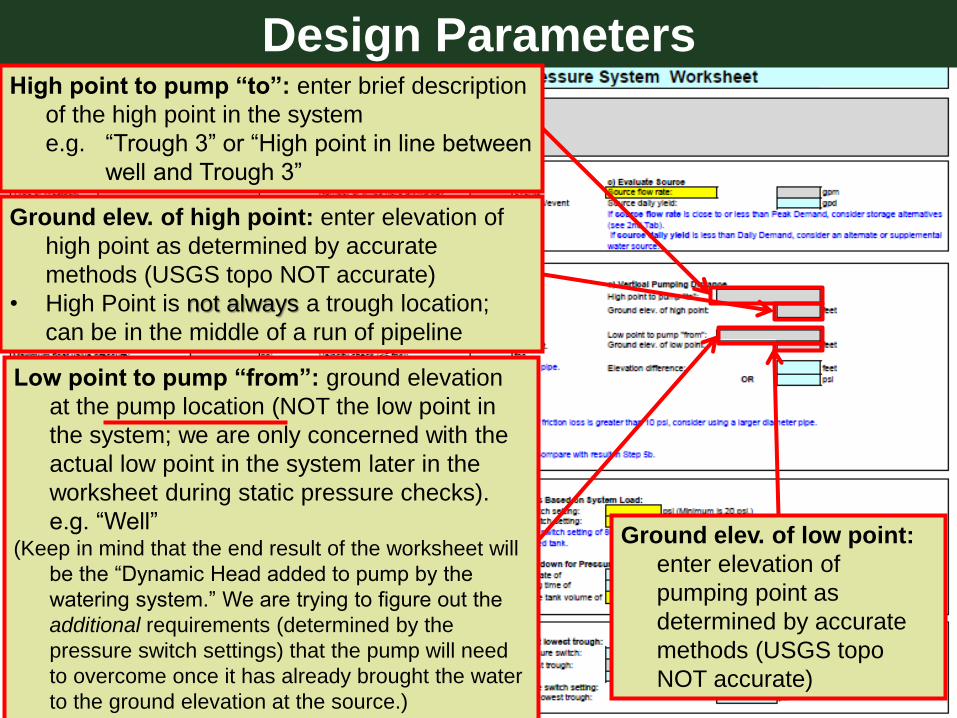
Design ParametersHigh point to pump “to”: enter brief description
of the high point in the system
e.g. “Trough 3” or “High point in line between
well and Trough 3”
Low point to pump “from”: ground elevation
at the pump location (NOT the low point in
the system; we are only concerned with the
actual low point in the system later in the
worksheet during static pressure checks).
e.g. “Well”(Keep in mind that the end result of the worksheet will
be the “Dynamic Head added to pump by the
watering system.” We are trying to figure out the
additional requirements (determined by the
pressure switch settings) that the pump will need
to overcome once it has already brought the water
to the ground elevation at the source.)
Ground elev. of high point: enter elevation of
high point as determined by accurate
methods (USGS topo NOT accurate)
• High Point is not always a trough location;
can be in the middle of a run of pipeline
Ground elev. of low point:
enter elevation of
pumping point as
determined by accurate
methods (USGS topo
NOT accurate)
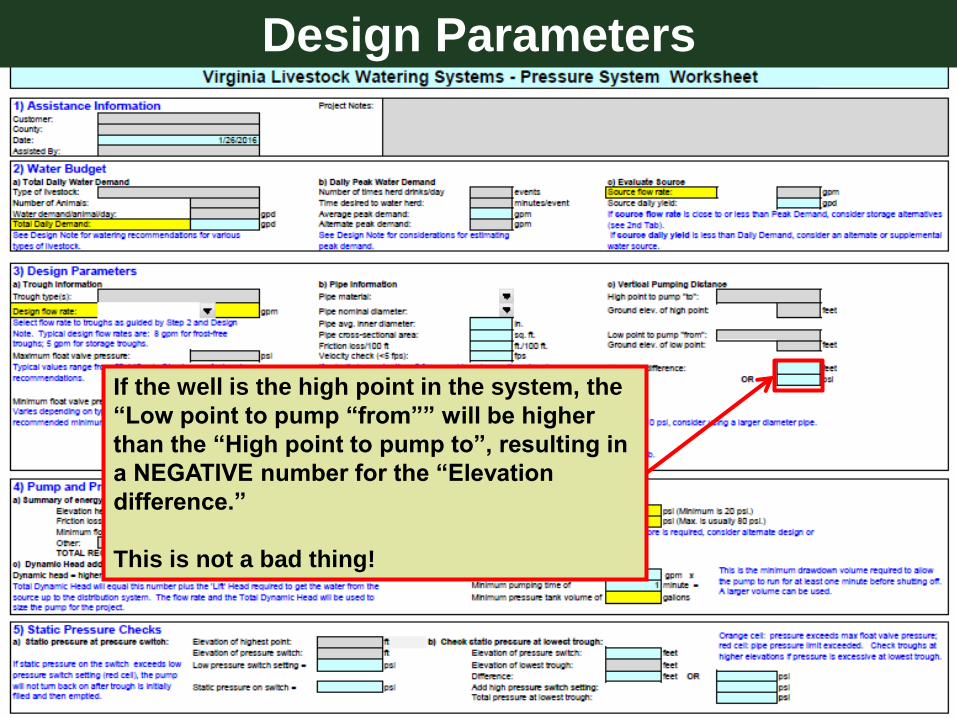
Design Parameters
If the well is the high point in the system, the
“Low point to pump “from”” will be higher
than the “High point to pump to”, resulting in
a NEGATIVE number for the “Elevation
difference.”
This is not a bad thing!

Design Parameters
Key Words:
PUMP “TO”
PUMP “FROM”
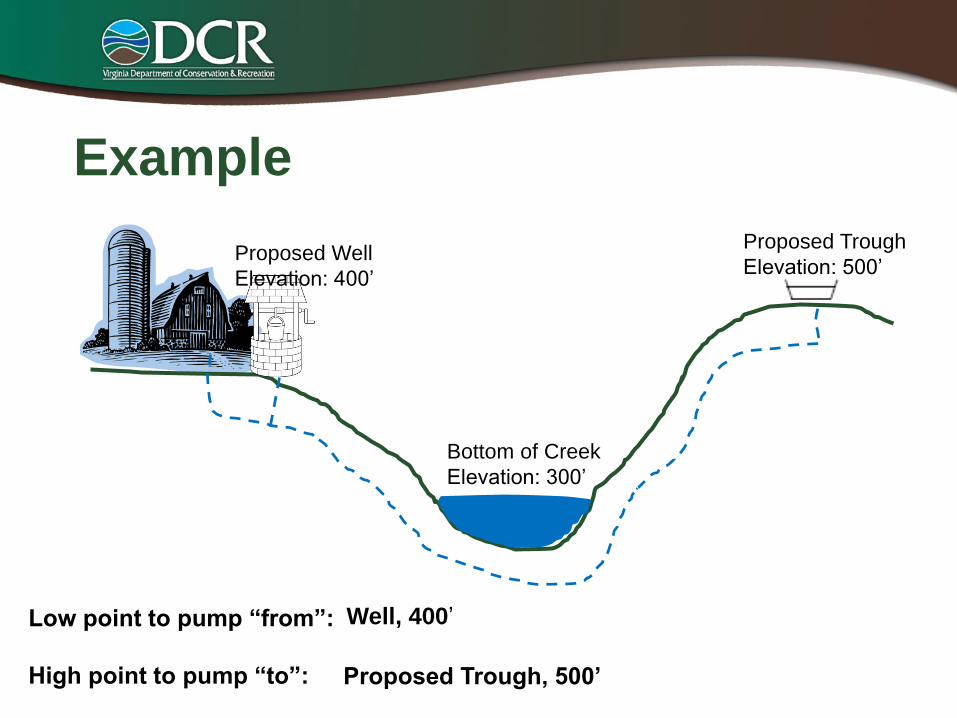
Example
Proposed Trough
Elevation: 500’Proposed Well
Elevation: 400’
Low point to pump “from”:
High point to pump “to”:
Well, 400’
Proposed Trough, 500’
Bottom of Creek
Elevation: 300’
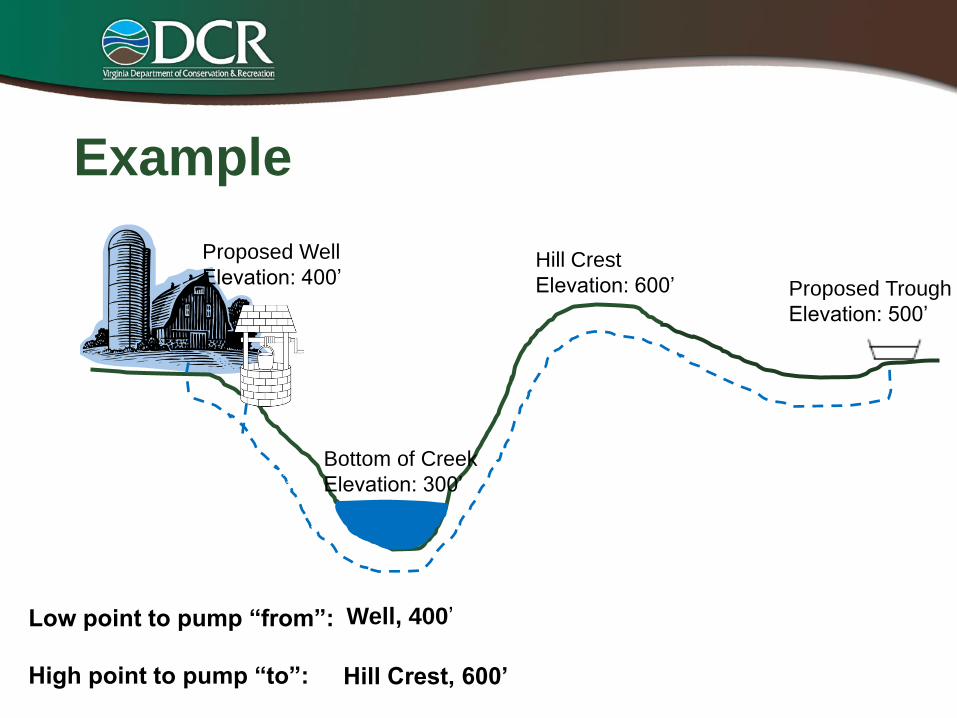
Example
Proposed Well
Elevation: 400’Proposed Trough
Elevation: 500’
Low point to pump “from”:
High point to pump “to”:
Well, 400’
Hill Crest, 600’
Hill Crest
Elevation: 600’
Bottom of Creek
Elevation: 300’
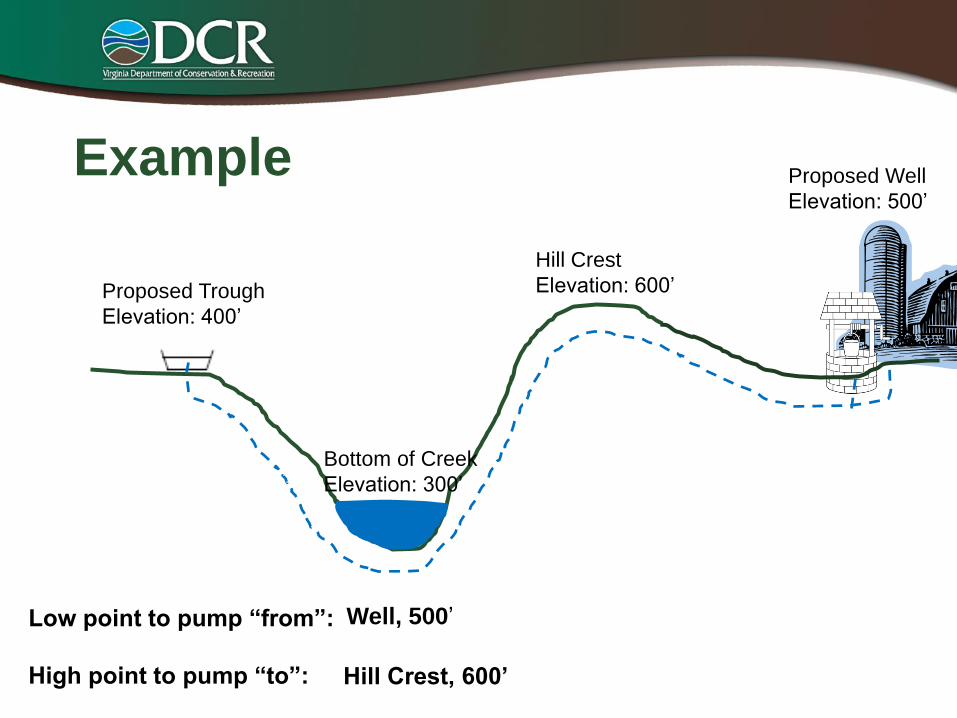
Example Proposed Well
Elevation: 500’
Proposed Trough
Elevation: 400’
Low point to pump “from”:
High point to pump “to”:
Well, 500’
Hill Crest, 600’
Hill Crest
Elevation: 600’
Bottom of Creek
Elevation: 300’

4) Pump and Pressure Tank Design
The boxes in Section (4) “Pump and Pressure
Tank Design” are mostly automatic
calculations based on your inputs from
above.
The only input option for the user is the
“Other” box for the energy budget. Here is
where you would enter if you had performed
a separate analysis (e.g. for evaluating two
separate pipeline diameters).

5) Static Pressure Checks
Section (5) “Static Pressure Checks” will help
check that there will not be excessive static
pressure on:
-the pressure switch, and
-the float valves at the trough(s)
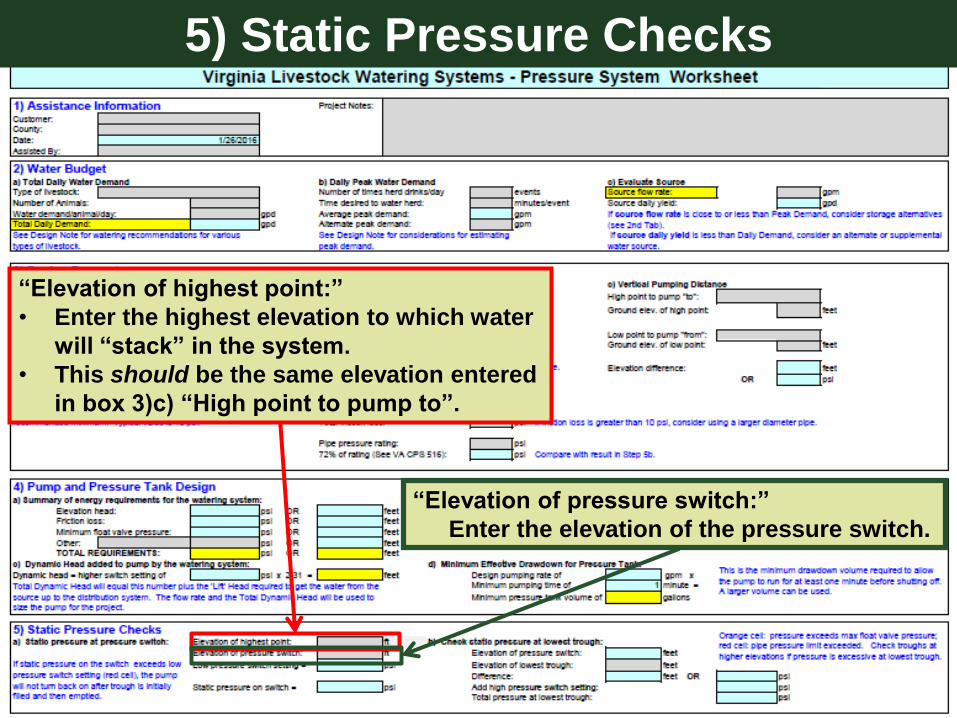
5) Static Pressure Checks
“Elevation of highest point:”
• Enter the highest elevation to which water
will “stack” in the system.
• This should be the same elevation entered
in box 3)c) “High point to pump to”.
“Elevation of pressure switch:”
Enter the elevation of the pressure switch.
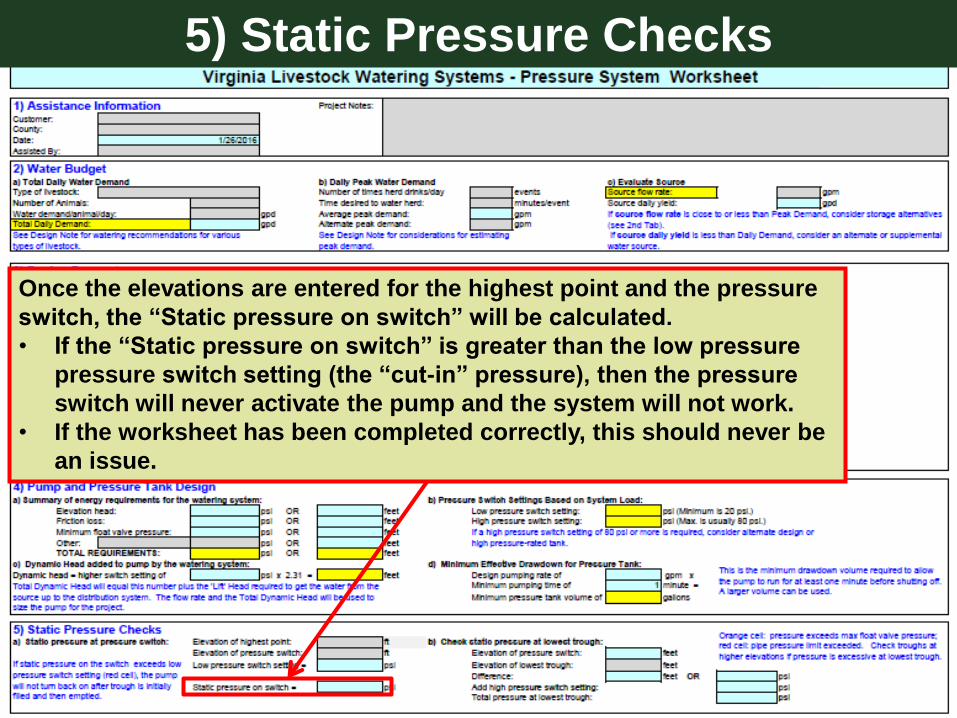
5) Static Pressure Checks
Once the elevations are entered for the highest point and the pressure
switch, the “Static pressure on switch” will be calculated.
• If the “Static pressure on switch” is greater than the low pressure
pressure switch setting (the “cut-in” pressure), then the pressure
switch will never activate the pump and the system will not work.
• If the worksheet has been completed correctly, this should never be
an issue.
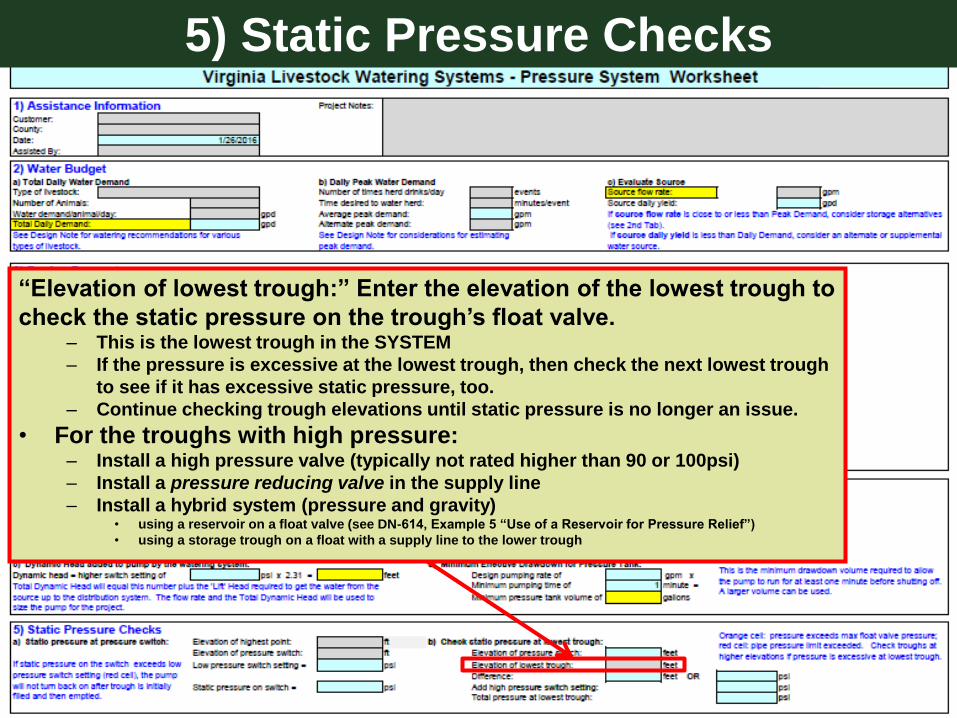
5) Static Pressure Checks
“Elevation of lowest trough:” Enter the elevation of the lowest trough to
check the static pressure on the trough’s float valve. – This is the lowest trough in the SYSTEM
– If the pressure is excessive at the lowest trough, then check the next lowest trough
to see if it has excessive static pressure, too.
– Continue checking trough elevations until static pressure is no longer an issue.
• For the troughs with high pressure: – Install a high pressure valve (typically not rated higher than 90 or 100psi)
– Install a pressure reducing valve in the supply line
– Install a hybrid system (pressure and gravity)• using a reservoir on a float valve (see DN-614, Example 5 “Use of a Reservoir for Pressure Relief”)
• using a storage trough on a float with a supply line to the lower trough
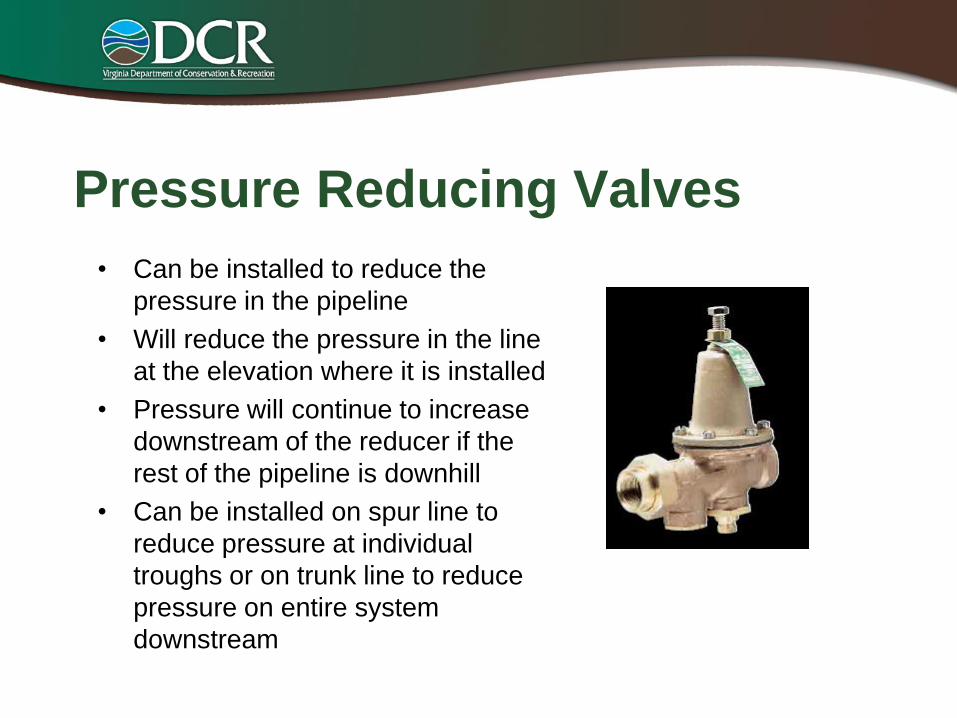
Pressure Reducing Valves
• Can be installed to reduce the
pressure in the pipeline
• Will reduce the pressure in the line
at the elevation where it is installed
• Pressure will continue to increase
downstream of the reducer if the
rest of the pipeline is downhill
• Can be installed on spur line to
reduce pressure at individual
troughs or on trunk line to reduce
pressure on entire system
downstream
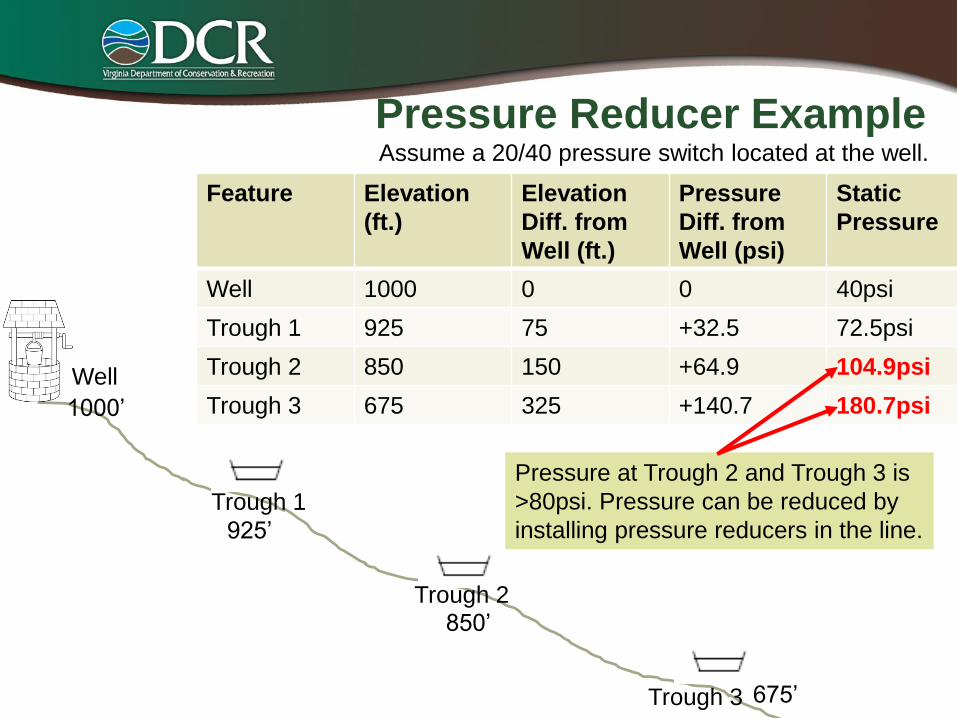
Pressure Reducer Example
1000’
925’
850’
675’
Assume a 20/40 pressure switch located at the well.
Trough 1
Trough 2
Trough 3
Feature Elevation
(ft.)
Elevation
Diff. from
Well (ft.)
Pressure
Diff. from
Well (psi)
Static
Pressure
Well 1000 0 0 40psi
Trough 1 925 75 +32.5 72.5psi
Trough 2 850 150 +64.9 104.9psi
Trough 3 675 325 +140.7 180.7psi
Well
Pressure at Trough 2 and Trough 3 is
>80psi. Pressure can be reduced by
installing pressure reducers in the line.

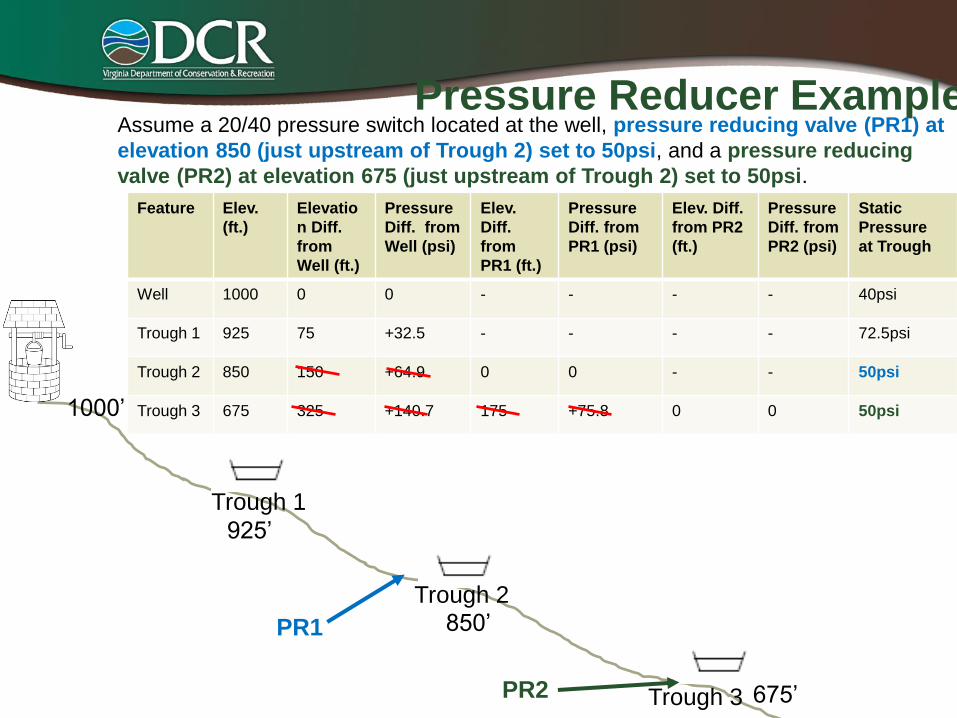
Pressure Reducer Example
1000’
925’
850’
675’
Assume a 20/40 pressure switch located at the well, and a pressure reducing
valve (PR1) at elevation 850 (just upstream of Trough 2) set to 50psi.
Trough 1
Trough 2
Trough 3
Feature Elev.
(ft.)
Elevatio
n Diff.
from
Well (ft.)
Pressure
Diff. from
Well (psi)
Elev.
Diff.
from
PR1 (ft.)
Pressure
Diff. from
PR1 (psi)
Elev. Diff.
from PR2
(ft.)
Pressure
Diff. from
PR2 (psi)
Static
Pressure
at Trough
Well 1000 0 0 - - 40psi
Trough 1 925 75 +32.5 - - 72.5psi
Trough 2 850 150 +64.9 0 0 50psi
Trough 3 675 325 +140.7 175 +75.8 125.8psi
PR1
Pressure at Trough 3 is still >80psi.
Another pressure reducer will be
needed.
Pressure Reducer Example
1000’
925’
850’
675’
Assume a 20/40 pressure switch located at the well, pressure reducing valve (PR1) at
elevation 850 (just upstream of Trough 2) set to 50psi, and a pressure reducing
valve (PR2) at elevation 675 (just upstream of Trough 2) set to 50psi.
Trough 1
Trough 2
Trough 3
Feature Elev.
(ft.)
Elevatio
n Diff.
from
Well (ft.)
Pressure
Diff. from
Well (psi)
Elev.
Diff.
from
PR1 (ft.)
Pressure
Diff. from
PR1 (psi)
Elev. Diff.
from PR2
(ft.)
Pressure
Diff. from
PR2 (psi)
Static
Pressure
at Trough
Well 1000 0 0 - - - - 40psi
Trough 1 925 75 +32.5 - - - - 72.5psi
Trough 2 850 150 +64.9 0 0 - - 50psi
Trough 3 675 325 +140.7 175 +75.8 0 0 50psi
PR1
PR2

Pressure Reducer Example
1000’
925’
850’
950’
What if trough 3 were higher than Trough 2?
Trough 1
Trough 2
Trough 3
Feature Elev.
(ft.)
Elevatio
n Diff.
from
Well (ft.)
Pressure
Diff. from
Well (psi)
Elev.
Diff.
from
PR1 (ft.)
Pressure
Diff. from
PR1 (psi)
Elev. Diff.
from PR2
(ft.)
Pressure
Diff. from
PR2 (psi)
Static
Pressure
at Trough
Well 1000 0 0 - - - - 40psi
Trough 1 925 75 +32.5 - - - - 72.5psi
Trough 2 850 150 +64.9 0 0 - - 50psi
Trough 3 950 50 +21.6 +100 -43.3 - - 6.7psi
PR1
There would not be enough pressure at Trough 3 if PR1 is installed in the main trunk
line. A solution would be to install the pressure reducer on the spur line to Trough 2
so that only the pressure at Trough 2 is affected. Pressure at trough 3 would still be
determined by its elevation difference from the well.
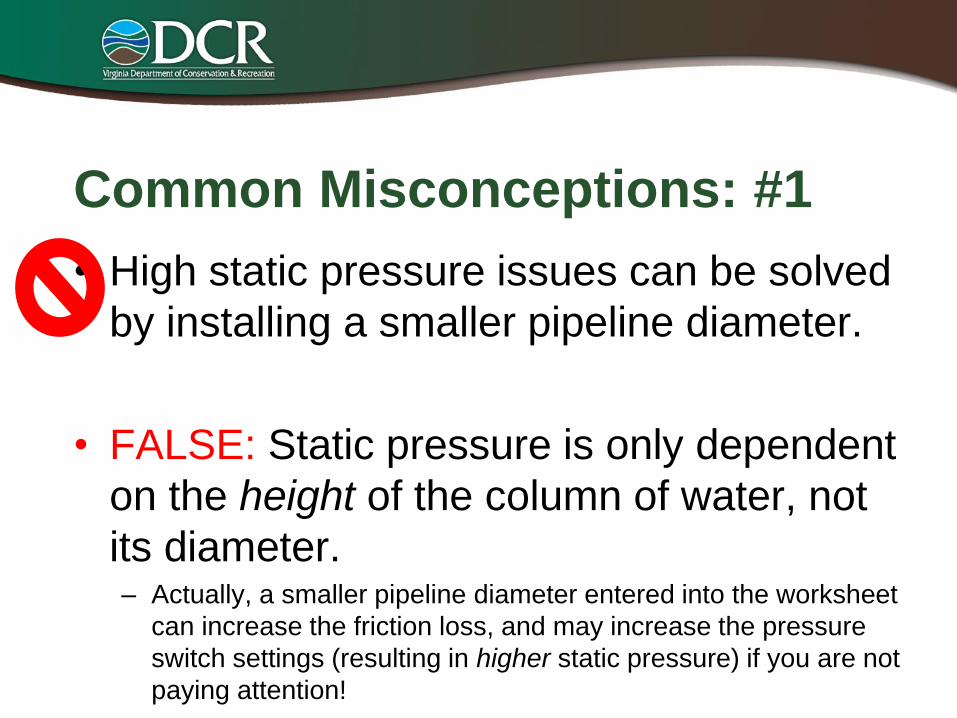
Common Misconceptions: #1
• High static pressure issues can be solved
by installing a smaller pipeline diameter.
• FALSE: Static pressure is only dependent
on the height of the column of water, not
its diameter. – Actually, a smaller pipeline diameter entered into the worksheet
can increase the friction loss, and may increase the pressure
switch settings (resulting in higher static pressure) if you are not
paying attention!

Common Misconceptions: #2
• Stored water in a reservoir somehow
adds extra pressure to the system (more
than just the height of the water would
add).
• FALSE: Static pressure is only dependent
on the height of the column of water, not
its diameter.

Elev.: 100’
Elev.: 70’
24’Pressure at Trough: 24’ / 2.31psi/ft. = 10.4psi
Example: Empty Reservoir
Elev.: 94’

Elev.: 100’
Elev.: 70’
30’
Pressure at Trough: 30’ / 2.31psi/ft. = 13psi
Example: Full Reservoir
The extra pressure at the trough
when the reservoir is full only
depends on the height of the water
in the reservoir and not the
volume.
Common Misconceptions: #3
• Excessive static pressure can be solved
by balancing it with high friction loss.
• FALSE: Static pressure refers to the
pressure in the system when water is
NOT moving. Friction loss only occurs
when the water is moving.
Common Misconceptions: #4
• When “Tee”-ing off of an existing pipeline
in an existing system, it does not make
sense to use a larger diameter pipeline
than what is already installed.
• FALSE: Friction loss is cumulative. Using larger
diameter pipeline for the new pipeline will
minimize friction loss. Always perform
calculations for the existing AND new pipeline
to the watering point and add them together.

Common Misconceptions: #5
• Pipeline size does not matter because the
orifice of the float valve at the trough is
very small and is the “bottleneck” in the
system.
• FALSE: As the following slide shows, the
orifice of most float valves has a capacity
higher than most typical design flow
rates.

This information is provided for informational purposes ONLY and is not a recommendation of any product or manufacturer.
Common Float Valve Pressure Ranges
= Typically included as the Standard Valve (Check with Supplier)
Notice that the highest pressure valves reduce the flow rate to below 8gpm. In high
pressure situations, you may consider recommending a pressure reducing valve instead
of a high-pressure valve so that the flow rate is not sacrificed.
You MIGHT have done
something wrong IF:
• The well/pressure switch is the highest point in
the system and the worksheet calls for a
pressure switch larger than 20/40
• The “static pressure on switch” box in Section
5.a. turns red
– The static pressure on the switch should never be
higher than the low switch setting if all inputs on the
worksheet are correct.
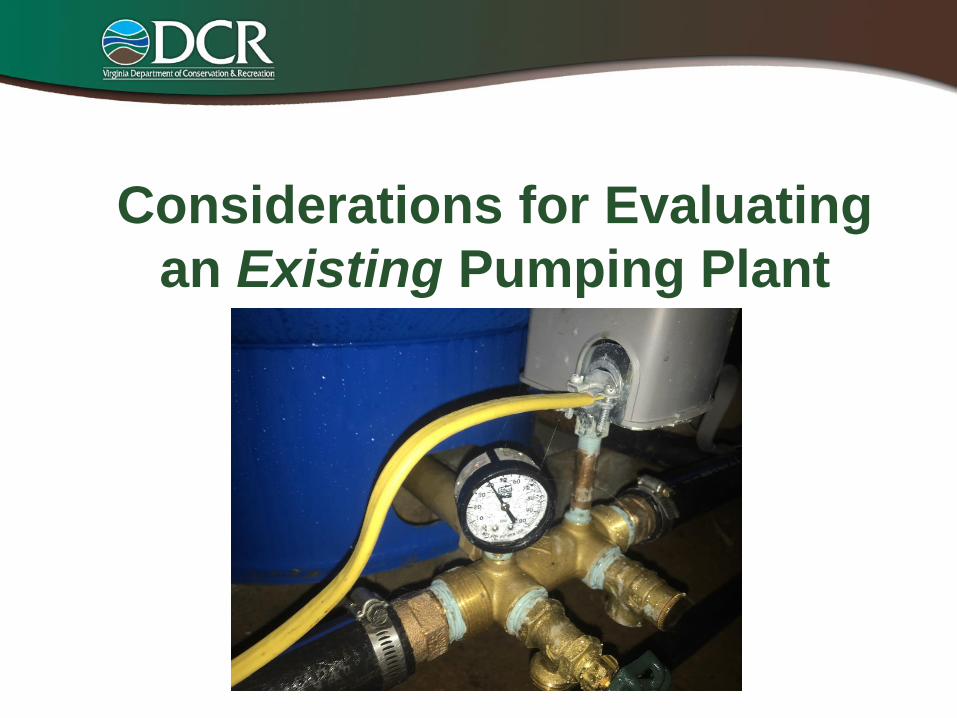
Considerations for Evaluating
an Existing Pumping Plant
Information to Gather: Existing Systems
• Age and condition of pumping plant
• Existing Pumping Rate
• Existing Pressure Switch Settings
• Length and diameter of existing pipeline– Evaluate for Friction Loss
• Existing Elevations– Existing elevations need to be considered for the “High point to
pump “to”” and “Elevation of lowest trough”
Age and Condition of Pumping Plant
• Goal: Determine if the existing pumping
plant will last for the duration of the
practice lifespan
– How old is the existing pump?
– Has the landowner ever experienced any
problems with the pump?
– Was the existing pumping plant installed as
part of a conservation program? If so, is it
still under contract lifespan?

Existing Pumping Rate• Why does the existing pumping rate matter?
1. Is the pumping rate sufficient to supply the livestock?
2. Should be used to size the pipeline if the existing pump will be used
• How to determine:– If the well was installed recently, the pumping rate may be listed on the “Water Well
Completion Report” at the Health Dept.
• Look for the pump capacity (different from well yield)
– Manual Pumping Rate Test:
• Find a hydrant (something with a full flow orifice) near the pumping plant
• Open the hydrant up and wait for the pressure tank to empty
• Once the tank is empty and the switch engages the pump, begin collecting the water in a container
of known volume
• Time how long it takes to fill the container
• Divide the gallons filled by the time it took (in minutes) to come up with the pumping rate in GPM
• Where to input into worksheet:
– “Source Flow Rate” “Design Flow Rate”
– Also document well yield on worksheet

Pressure Switch Settings
1) Complete the “Pressure System Worksheet”
using the existing pumping rate
2) What pressure switch requirements are generated by the
worksheet?
3) If the worksheet calls for pressure switch settings that
are higher than the existing settings, the total head on
the pump will increase, and the contractor/plumber will
need to evaluate the impact on the pump– This process is for planning purposes: Do we need to plan for a new
pump?
– Sizing pumps is beyond the scope of our responsibility
– Leave it up to the professionals!
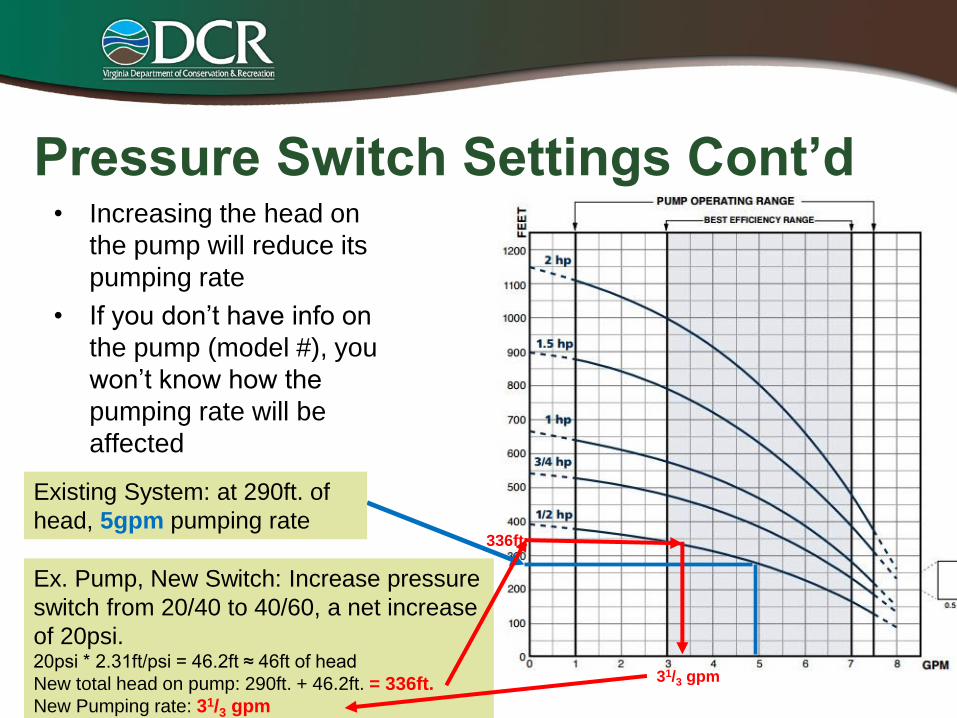
Pressure Switch Settings Cont’d• Increasing the head on
the pump will reduce its
pumping rate
• If you don’t have info on
the pump (model #), you
won’t know how the
pumping rate will be
affected
Existing System: at 290ft. of
head, 5gpm pumping rate
Ex. Pump, New Switch: Increase pressure
switch from 20/40 to 40/60, a net increase
of 20psi.20psi * 2.31ft/psi = 46.2ft ≈ 46ft of head
New total head on pump: 290ft. + 46.2ft. = 336ft.
New Pumping rate: 31/3 gpm
336ft.
31/3 gpm
Existing Pump Example
• The following example will show the importance
of using the existing pumping rate if you will be
using an existing pump.
• The first worksheet will be run as if the planner
has assumed an “Alternate Peak Demand” of
8gpm.
• The second worksheet will be run with the
actual pumping rate of 15gpm.
• A discussion will follow.

If an “alternate peak demand” of
8gpm is used for 4-hole troughs,
then the friction loss is only 5.2psi
energy requirements of the system
are 29.0psi, resulting in pressure
switch settings of 30/50.
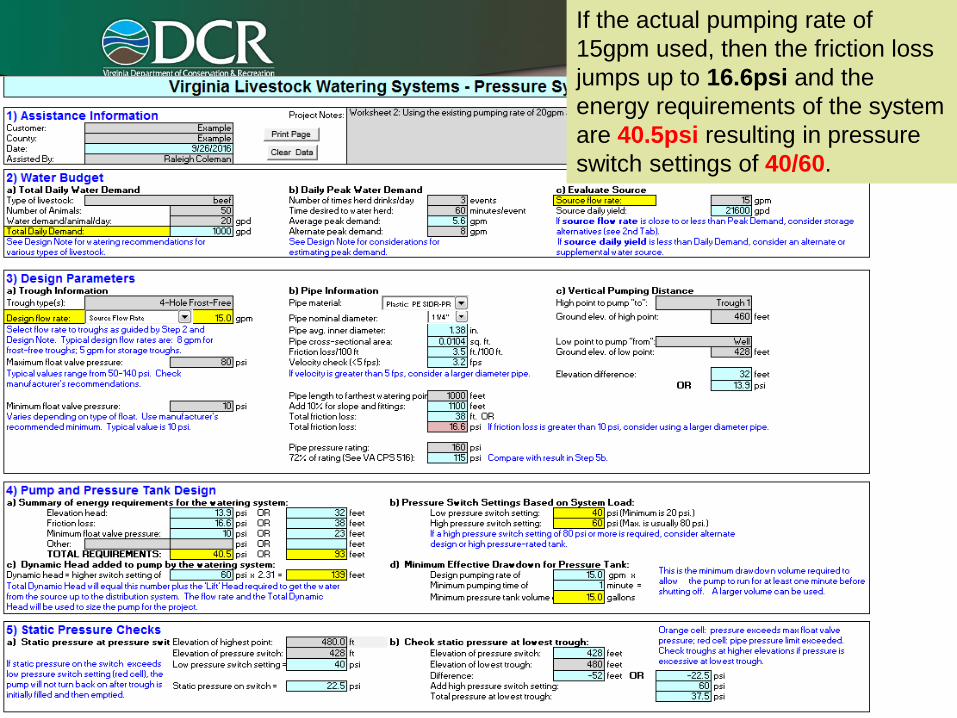
If the actual pumping rate of
15gpm used, then the friction loss
jumps up to 16.6psi and the
energy requirements of the system
are 40.5psi resulting in pressure
switch settings of 40/60.

Discussion• What if the system is designed based on an arbitrary
pumping rate of 8gpm when the pump is actually pumping at
15gpm?– The energy requirement to deliver the water to the trough is actually 40.5psi
– It only takes 30psi for water to enter the pressure tank (a 30/50 pressure switch was
used based on the 8gpm flow rate)
– When the pump kicks on, the pressure tank is the “path of least resistance” and will
begin to fill first
– Trough will not fill until sufficient pressure is achieved in the tank
– The trough will be “short-circuited” by the tank
• The system may still work, but it will be inefficient and
livestock will be waiting for water every time the pressure
tank empties
• Note: This example is exaggerated to illustrate a concept. A
15gpm pumping rate will be unlikely for most standard well
pumps.
?Just remember: use the existing pumping
rate as the “design flow rate” if using an
existing pumping plant.
(Or, if the existing pump rate is
inappropriate, plan for a new pump.)

Important Point for Existing Pumps:
• Don’t confuse flow rate and pressure
• A high flow rate does NOT necessarily mean there is
too much pressure
• Pressure is governed by the pressure switch
• A high flow rate can actually mean there will not be
ENOUGH pressure to overcome the higher friction loss
associated with higher flow rates

User Beware: Things that the
worksheet will not catch• Static pressure issues in pipeline if there is a low point in pipeline
below the lowest trough
– Check static pressure (can enter into “Elevation of lowest
trough” to check)
– Compare against 72% of pressure rating
• If the well is higher than the pressure switch: dynamic head added
to pump will be less than what the worksheet calculates
• If the well is lower than the pressure switch: dyanamic head added
to pump will be higher than what the worksheet calculates

Worksheet Completion
• You might do multiple analyses for various reasons, but
only give ONE worksheet to the contractor to show the
total dynamic head for the entire system, the design
flow rate, pressure switch settings.
• Reference the worksheet in the design so that the
contractor knows to look for it.
• Keep the other worksheet(s) in your file to document
your calculations.
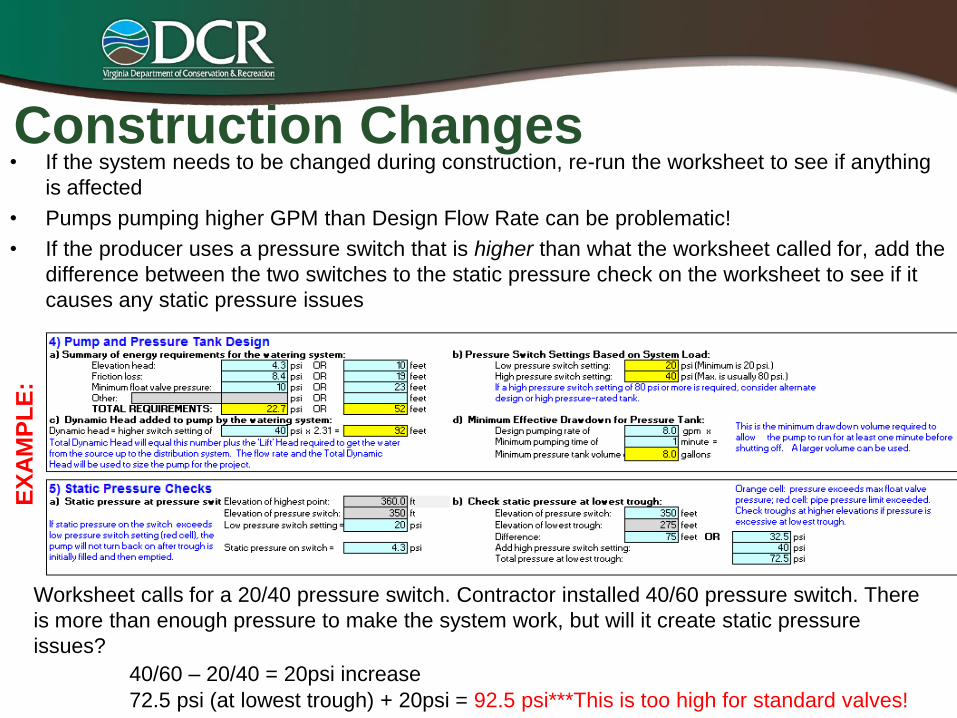
Construction Changes• If the system needs to be changed during construction, re-run the worksheet to see if anything
is affected
• Pumps pumping higher GPM than Design Flow Rate can be problematic!
• If the producer uses a pressure switch that is higher than what the worksheet called for, add the
difference between the two switches to the static pressure check on the worksheet to see if it
causes any static pressure issues
Worksheet calls for a 20/40 pressure switch. Contractor installed 40/60 pressure switch. There
is more than enough pressure to make the system work, but will it create static pressure
issues?
40/60 – 20/40 = 20psi increase
72.5 psi (at lowest trough) + 20psi = 92.5 psi***This is too high for standard valves!
EX
AM
PL
E:
A quick note on as-builts…
• The more detailed your as-builts are, the
more useful they will be in the future if
needed to tie back into the system– Did the pipeline route change?
– Pipeline lengths
– Pipeline type (ASTM, diameter, pressure rating)
– Pumping Plant Info (Pump Model Number, Pumping
Rate, Pressure Switch Settings, Size of Tank, etc.)
– Etc…
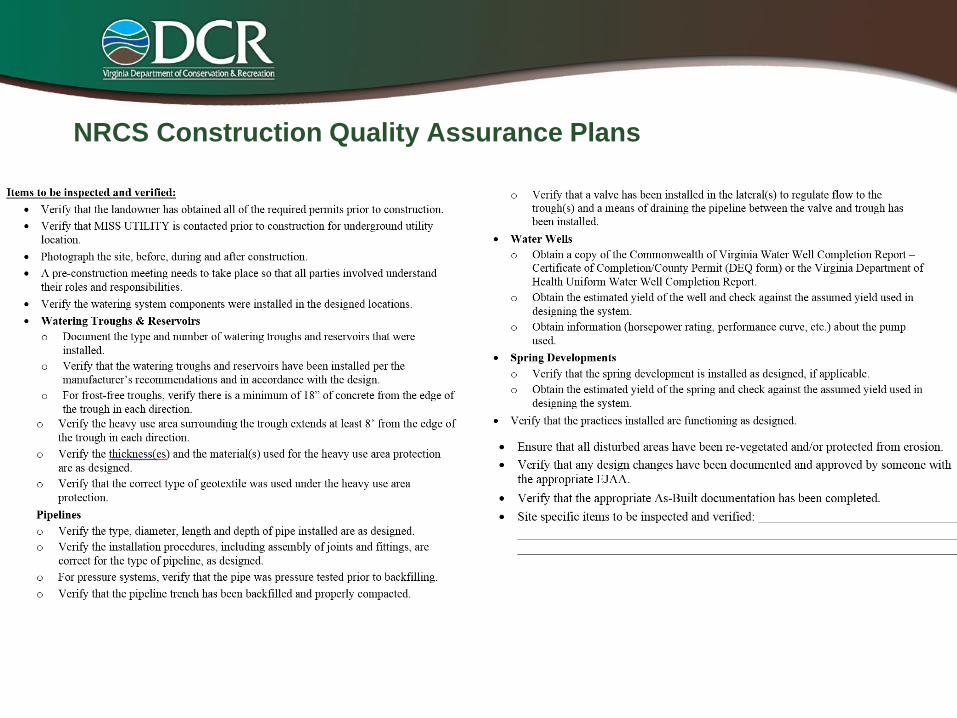
NRCS Construction Quality Assurance Plans

Resources for Further Study
• NRCS Virginia Engineering Design Note
614 (DN-614)
• NRCS Engineering Field Handbook,
Chapter 3: Hydraulics

Special Thanks…
• Glenn Chappell, James River SWCD for
securing the location
• Pat McIlvaine, Loudon SWCD, Stone
• Keith Burgess, Monacan SWCD, supplies
• Dana Young, NRCS, supplies
• Sharyl Walker, NRCS, supplies

Questions?
DCR-DSWC Engineering Staff:
Contact Information
Amanda Pennington, P.E.
District Engineering Services Manager
804-786-0113
Raleigh Coleman
Ag BMP Engineering Specialist
540-270-0039
Emily Nelson
Ag BMP Technician
804-219-6098

Discussion of 3 Common Systems
-Conventional
-Remote Pressure Tank
-Reservoir with Pump on Timer
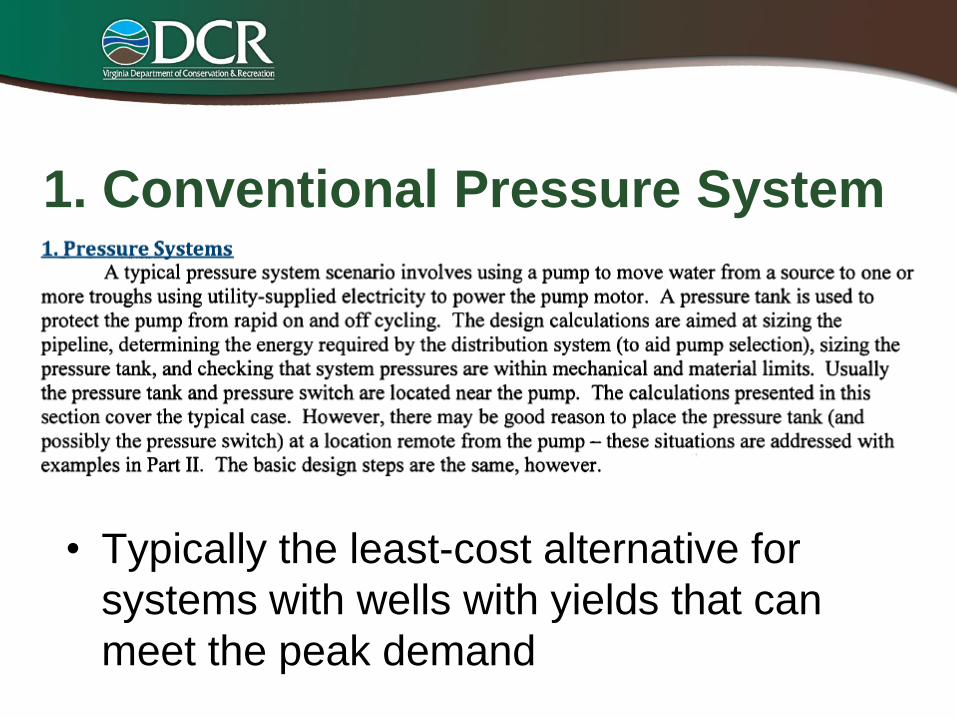
1. Conventional Pressure System
• Typically the least-cost alternative for
systems with wells with yields that can
meet the peak demand

2. Remote Pressure Tank
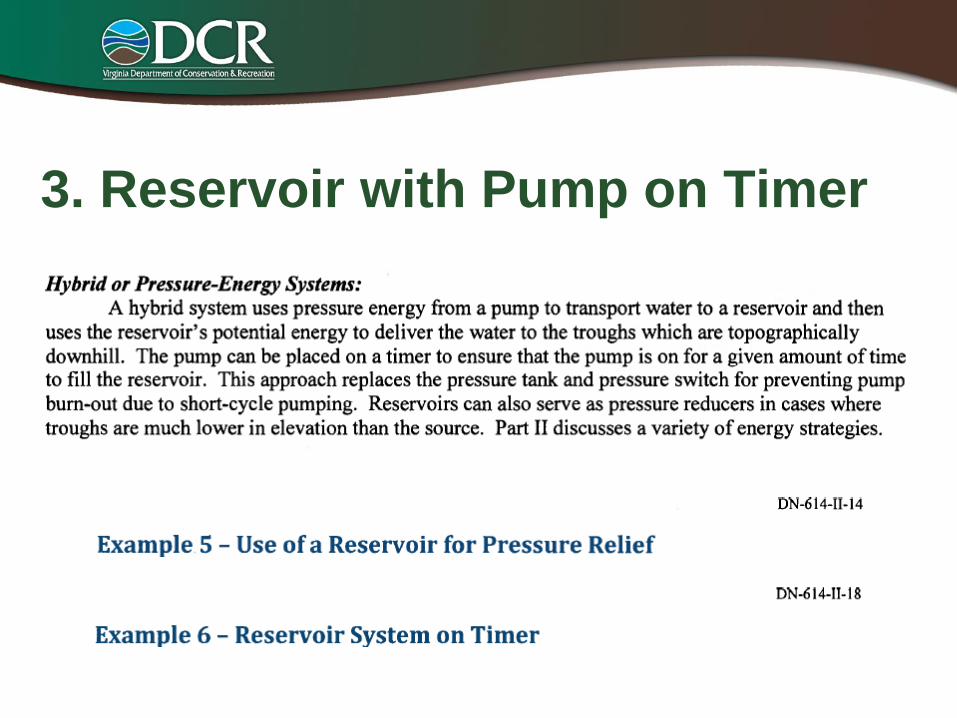
3. Reservoir with Pump on Timer