BUREAU OF ECONOMIC AND BUSINESS RESEARCH UTAH ECONOMIC AND BUSINESS REVIEW VOLUME 61, NUMBERS 11 & 12 NOVEMBER/DECEMBER 2001 THE ECONOMIC AND FISCAL IMPACT OF THE UNIVERSITY OF UTAH HEALTH SCIENCES CENTER Jan E. Crispin-Little, Senior Economist In 2001, the University of Utah Health Sciences Center (UUHSC) commissioned a study from the Bureau of Economic and Business Research to identify the economic impact of UUHSC on the Utah economy during fiscal year 2000. The primary findings of that study are presented in this article. Overview The University of Utah Health Sciences Center (UUHSC) coordinates the medical and health-related academic, research and clinical service activities of the University of Utah. Included under the UUHSC umbrella are the University Hospitals and Clinics, University of Utah Health Network (UUHN), the School of Medicine, the Colleges of Health, Pharmacy and Nursing, and the Spencer S. Eccles Health Sciences Library. While most of these facilities are located on the University of Utah campus, UUHSC also provides patient care through a series of out- patient clinics located along the Wasatch Front. Affiliated with UUHSC is the Howard Hughes Medical Institute (HHMI), a world- class independent research organization located on the University of Utah campus. HHMI established a research facility on the University of Utah campus in 1972 to collaborate with the University Hospital and School of Medicine in genetics research. Over the past 29 years, HHMI has provided $135 to $150 million to the University to support human genetics research. Although HHMI is not governed by the University of Utah it is appropriately included as part of the UUHSC. Without the presence of a university-based hospital and medical school it is unlikely such a facility would be located in Utah.
THE ECONOMIC AND FISCALIMPACT OF THE UNIVERSITY OF
UTAH HEALTH SCIENCES CENTERJan E. Crispin-Little, Senior Economist
In 2001, the University ofUtah Health Sciences Center(UUHSC) commissioned astudy from the Bureau ofEconomic and BusinessResearch to identify theeconomic impact of UUHSC onthe Utah economy duringfiscal year 2000. The primaryfindings of that study arepresented in this article.
OverviewThe University of Utah
Health Sciences Center(UUHSC) coordinates themedical and health-relatedacademic, research and clinicalservice activities of theUniversity of Utah. Included
under the UUHSC umbrellaare the University Hospitalsand Clinics, University ofUtah Health Network(UUHN), the School ofMedicine, the Colleges ofHealth, Pharmacy andNursing, and the Spencer S.Eccles Health SciencesLibrary. While most of thesefacilities are located on theUniversity of Utah campus,UUHSC also provides patientcare through a series of out-patient clinics located alongthe Wasatch Front.
Affiliated with UUHSC isthe Howard Hughes MedicalInstitute (HHMI), a world-class independent researchorganization located on the
University of Utah campus.HHMI established a researchfacility on the University ofUtah campus in 1972 tocollaborate with the UniversityHospital and School ofMedicine in genetics research.Over the past 29 years, HHMIhas provided $135 to $150million to the University tosupport human geneticsresearch. Although HHMI isnot governed by the Universityof Utah it is appropriatelyincluded as part of theUUHSC. Without the presenceof a university-based hospitaland medical school it isunlikely such a facility wouldbe located in Utah.
November/December 2001 UTAH ECONOMIC AND BUSINESS REVIEW 2
BUREAU OF ECONOMIC AND BUSINESS RESEARCH
A similar organization isthe Huntsman CancerInstitute (HCI) which islocated on the University ofUtah campus. HCI is a centerfor cutting-edge cancerresearch and has the largestgenetic database in the world.HCI also operates a hospital-based patient care center inassociation with UUHSC.
Another organization withmore direct ties to UUHSC isARUP (Associated RegionalUniversity Pathologists).ARUP was created in 1984 bythe Department of Pathologyat UUHSC to support theUniversity’s hospital, medicaleducation and research and toestablish itself as a leadingnational reference laboratory.It is now a wholly ownedprivate enterprise of theUniversity, managed by theDepartment of Pathology thatemploys 1,400 Utahns andperforms clinical laboratorytesting 24 hours a day, sevendays a week. ARUP’s grossrevenues in 2000 reached $120million.
University Hospitals andClinics are the clinicalcomponents of UUHSCproviding primary, secondaryand tertiary care throughoutthe Intermountain region.Each year, UniversityHospitals and Clinics servethousands of people. In FY2000, 19,004 patients wereadmitted to the UniversityHospital. Visits to University-owned clinics totaled 741,063.While the majority of patientswho received services throughUUHSC were local residents
about 17 percent of all patientrevenues came from servicesprovided to individuals livingoutside the state of Utah.University Hospitals andClinics also serve as teachingfacilities providing a venue forthe clinical education ofmedical s tudents andresidents.
In tandem with theclinical operations of UUHSCare its teaching and trainingactivities. The academicorganizations within UUHSCinclude the School of Medicine,and the Colleges of Health,Pharmacy and Nursing. In FY2000, 3,279 students wereenrolled in one of UUHSC’sacademic programs—1,808u ndergraduates , 1 ,066graduate students and 405medical students. The numberof residents-on-staff totaled494. These figures include onlythose students enrolled in oneof UUHSC’s academic colleges,it does not include thosestudents who are enrolled inother disciplines but who tookclasses offered by UUHSC.
The third component ofUUHSC is comprised oforganizations that providesupport services to UUHSC’sclinical, research and academicinstitutions. These include theOffice of the Senior VicePresident for Health Sciences,the Spencer S. Eccles HealthSciences Library and others. Employment and Wages
With its hospitals, clinics,colleges, and affiliatedprograms, UUHSC is one of
Utah’s largest employers.During FY 2000, UUHSCdirectly employed the full-timeequivalent of 7,581 people andhad a payroll totaling$429,549,688. Of this amount,wage and salary paymentswere $335.6 million. Anadditional $71.8 million wasspent for benefits includinghealth, dental and retirementbenef i ts for UUHSC’semployees and their families.Payroll taxes accounted for theremaining $22.1 million.
When treated as a singleentity, UUHSC consistentlyranks among the state’slargest employers. In FY 2000,UUHSC was ranked as theninth-largest employer behindsuch organizations asIntermountain Health Care,Brigham Young Universityand Hill Air Force Base. Table1 shows the largest employersin Utah during 2000.
Not only is UUHSC alarge employer, it attracts awell-educated workforce thatincludes renowned scientists,physicians and faculty, manyof whom desire to work in theunique environment of auniversity hospital andteaching complex. WithoutUUHSC, it is likely that asignificant number of theseindividuals would chose to liveand work elsewhere.
Operations-relatedSpending
To operate its facilities,UUHSC purchases millions ofdollars in supplies, equipmentand services annually. In FY
November/December 2001 UTAH ECONOMIC AND BUSINESS REVIEW 3
BUREAU OF ECONOMIC AND BUSINESS RESEARCH
Table 1
Utah’s Largest Nonfarm Civilian Employers
December 2000
Employer Name BusinessRounded
Employment
State of Utah Services 22,000
Intermountain Health Care Health Services 22,000
Brigham Young University Higher Education 17,500
University of Utah (including hospital) Higher Education 17,000
Hill Air Force Base Military Installation 11,000
Convergys Business Services 8,500
Granite School District Public Education 8,500
Jordan School District Public Education 8,000
UUHSC (excluding other U of U emp.) Health/Higher Education 7,600
Utah State University Higher Education 6,500
Wal-Mart Stores Retail 6,500
Davis School District Public Education 6,500
Salt Lake County Services 6,000
Smith’s Food King Retail 6,000
U.S. Postal Service Mail Distribution 5,500
Source: Utah Department of Workforce Services, Labor Market Services, 2000.
2000, these purchases totaled$761.8 million. Over half ofUUHSC’s expenditures($429.5 million) were payroll-related (wages, salaries,benefits and payroll taxes).The remaining $332.2 millionwas spent on a variety of goodsand services.
Most of UUHSC’s non-payroll spending occursoutside of Utah; however, inFY 2000, UUHSC paid $64.2million to Utah vendors forgoods and services. Whenpurchases from local vendorsare combined with thea p p r o p r i a t e p a y r o l lexpenditures, UUHSC’spurchases in the local economy
totaled $471.6 million in FY2000, or about 62.0 percent ofits total spending.Sources of Funding
Money used to financeUUHSC’s operations comesfrom a variety of sources;however, the two mostsignificant are revenues frompatient care and researchgrants which, when combined,accounted for 91.0 percent ofall dollars spent by UUHSC inFY 2000. All other sources(gifts, tuition, and stateappropriations) accounted forthe remaining 9.0 percent.Table 2 highlights the sourcesof UUHSC funds for FY 2000
and shows the relative sharethat each source contributed toUUHSC’s total funding base.
Patient Care. In FY 2000,UUHSC’s faculty and staffprovided inpatient hospitalcare to 19,004 people,conducted 741,063 outpatientvisits and delivered more than3,100 babies. These effortsgenerated $564.7 million inpatient revenue and accountedfor 74.1 percent of the moniesspent by UUHSC in FY 2000.Because of the variety ofsophisticated and uniquemedical services provided byUUHSC hospitals and clinics,UUHSC’s hospitals attract animpressive number of patients
November/December 2001 UTAH ECONOMIC AND BUSINESS REVIEW 4
BUREAU OF ECONOMIC AND BUSINESS RESEARCH
Table 2
University of Utah Health Sciences Center
Sources of Funding, FY 2000
Funding Source
Amount
(millions)Percent of
Total
Patient Care $564,737.9 74.1
Research and Other Grants $125,343.2 16.5
State Appropriation $37,717.9 5.0
Gifts $16,936.0 2.2
Tuition (estimate) $9,452.1 1.2
All other sources $7,583.8 1.0
Total $761,770.9 100.0
Source: Office of the Senior Vice President for Health Services, University of Utah,2001.
from outside the state. In FY2000, 17.0 percent of UUHSC’spatient care revenue camefrom nonresidents.
R e s e a r c h G r a n t s .UUHSC’s long-standingcommitment to research iswell known and is manifestedin the millions of researchdollars its receives each year.In FY 2000, research and othergrants totaled $125.3 millionand provided 16.5 percent ofthe money UUHSC spent tooperate its facilities. Themajority of these grants camefrom federal agencies.
State Appropriation.UUHSC is a bargain for thecitizens of Utah. Despite beinga state-owned facility, only asmall portion of the moneyUUHSC spends each yearcomes from state coffers. In FY2000, about 5.0 percent of themonies spent by UUHSC camefrom state appropriations.These resources are returnedto the state in the form of
economic growth and qualityhealth care. Using state fundsas a foundation, UUHSC hasbuilt a base from which itattracts federal grants, privateendowments and gifts. Inaddition, the taxpayers ofUtah have access to UUHSC’shealth care facilities for theirprimary, secondary andtertiary care.
Although state fundingcontributes just a smallportion of UUHSC’s totalspending, it represents asignificant source of revenuefor some academic colleges andsupport functions withinUUHSC. For example, stateappropriations are the singlemost important source offunding for the academiccolleges of Health (45.2%) andNursing (46.3%) and provided77.0 percent of the moneyneeded to operate the SpencerS. Eccles Library. State fund-
ing contributed a muchsmaller portion of the moneyspent by the College ofPharmacy (16.4%), School ofM e d i c i n e ( 5 . 9 % ) a n dUniversity Hospitals andClinics (1.3%). See Tables 3and 4.
Export-based FundingUUHSC derives a large
portion of the money it spendsfrom export activities. DuringFY 2000, approximately 35percent of UUHSC’s budget, or$266.4 million came fromexport activities. Exportearnings derived fromnonresident patient care andunique medical services thatcannot be obtained elsewherein Utah constituted the largestportion of UUHSC’s exportactivity. Research and othergrants were another importantsource of export earnings,followed by private gifts.
November/December 2001 UTAH ECONOMIC AND BUSINESS REVIEW 5
BUREAU OF ECONOMIC AND BUSINESS RESEARCH
Table 3
University of Utah Health Sciences Center
Expenditures by Funding Source, FY 2000
Funding Source
Patient Care
Researchand Other
GrantsState
Appropriation Gifts Tuition All Other Total
University Hospitalsand Clinics $323,461,435 – $4,164,400 $1,755,461 – $3,768,869 $333,150,165
UUHN $70,240,187 -- -- -- -- -- $70,240,187
School of Medicine $169,924,098 $108,857,101 $18,551,131 $12,678,316 $4,794,334 -- $314,804,980
College of Pharmacy -- $12,147,022 $3,258,789 $1,310,901 $1,116,892 $2,019,382 $19,852,986
College of Health $424,794 $2,416,478 $4,303,872 $322,500 $2,038,707 -- $9,506,351
College of Nursing $687,397 $1,762,643 $3,870,349 $533,671 $1,502,172 -- $8,356,232
Spencer S. EcclesLibrary -- $160,027 $2,363,569 $147,455 -- $395,530 $3,066,581
Other -- – $1,205,746 $187,712 – $1,400,000 $2,793,458
Total $564,737,911 $125,343,271 $37,717,856 $16,936,016 $9,452,105 $7,583,781 $761,770,940
Note: The funds provided by the State of Utah, as presented here, do not include tuition.
Source: Office of the Senior Vice President for Health Services, University of Utah, 2001.
Table 4
University of Utah Health Sciences Center
Expenditures by Funding Source, FY 2000
Funding Source as a Percentage of Total Spending
Patient Care
Researchand Other
GrantsState
Appropriation Gifts Tuition All Other Total
University Hospitalsand Clinics 97.1 -- 1.3 0.5 -- 1.1 100.0
UUHN 100.0 -- -- -- -- -- 100.0
School of Medicine 54.0 34.6 5.9 4.0 1.5 -- 100.0
College of Pharmacy -- 61.2 16.4 6.6 5.6 10.2 100.0
College of Health 4.5 25.4 45.3 3.4 21.4 -- 100.0
College of Nursing 8.2 21.1 46.3 6.4 18.0 -- 100.0
Spencer S. EcclesLibrary -- 5.2 77.1 4.8 -- 12.9 100.0
Other -- -- 43.2 6.7 -- 50.1 100.0
Source: Office of the Senior Vice President for Health Services, University of Utah, 2001.
November/December 2001 UTAH ECONOMIC AND BUSINESS REVIEW 6
BUREAU OF ECONOMIC AND BUSINESS RESEARCH
ECONOMIC IMPACTS OFUUHSC
UUHSC’s economicimpacts stem from both itsd a i l y o p e r a t i o n s a n dconstruction of new facilities.Operations impacts occurwhen UUHSC pays itsemployees and purchasesgoods and services from localvendors. Construction impactsoccur when new facilities arebuilt for UUHSC or whenexisting buildings undergoextensive renovation orremodel.Impacts from Operations
Earnings and EmploymentImpacts1. UUHSC’s mostsignificant impact on the localeconomy stems from its dailyoperations. In FY 2000,UUHSC pumped roughly$471.6 million into the Utaheconomy. The largest localexpenditure was for wages,salaries and benefits whichtotaled $407.4 million. Anadditional $64.2 million waspaid to local vendors for goodsand services. When combined,payroll-related spending andpurchases of goods andservices from local vendorsrepresented 62.0 percent ofUUHSC total spending in FY2000. The money spent forthese purchases circulatesthroughout the Utah economycreating jobs and generatingnew tax revenue.
The direct impact ofUUHSC is measured by thewages, salaries and benefitspaid to, or on behalf ofUUHSC employees. The
indirect impacts include thewages, salaries and benefitspaid to employees of thecompanies that supply goodsand services to UUHSC.Induced impacts measure theeffects of subsequent spendingby employees of thesesuppliers as they (theemployees) purchase goodsand services from secondaryand tertiary suppliers.
Through direct, indirectand induced effects, UUHSCgenerated approximately$233.1 million in earnings forUtah households during 2000($157.0 million in directearnings and $76.1 million inindirect earnings). In addition,the direct, indirect andinduced earnings sustained atotal of 6,253 jobs statewide.Table 5 provides a moredetailed analysis of the impactUUHSC exerted on earningsand employment by broadsector during FY 2000.
The employment andearnings estimates presentedhere represent UUHSC’simpacts on the state’s economyduring 2000. Because theestimates are based solely onUUHSC’s export activities,these impacts represent theeconomic activity that wouldnot otherwise have occurred.
Fiscal Impacts. The finalmeasure of UUHSC’s economicimportance is the fiscal impactthat results from the earningsgenerated by UUHSC’sactivities. Net new tax revenueresulting from UUHSCactivities in 2000 totaled$26,553,980. This estimate
represents the taxes derivedfrom household earnings thatwere attributable to UUHSC’spurchases in Utah. To derivethe indirect benefits, aneffective state and local taxrate of 11.39 percent wasapplied to the total earningsestimate of $233,134,156.2
The indirect fiscal impactestimates presented hererequire qualification. Theeffective state and local taxrate of 11.39 percent assumesthat all state and local taxesare directly tied to personalincome. While this may be thecase with respect to stateincome and sales taxes, therelationship between personalincome and property taxes isless obvious. Receipts fromthis particular tax (andpossibly others) may not be indirect proportion to anincrease in earnings asproperty taxes in particulara r e t i e d t o o t h e rfactors—primarily increases inproperty values. Thus, theestimates presented hereshould be viewed as an “upperbound” estimate of the impactthat UUHSC exerted on stateand local governmentrevenues. Further, the taxbenefit estimates generatedhere show fiscal revenuesreceived by all governmententities including state andlocal units of government
The economic impact onearnings, employment and taxrevenues that resulted fromUUHSC’s operations duringFY 2000 are shown below.
November/December 2001 UTAH ECONOMIC AND BUSINESS REVIEW 7
operations-related impactsshown above, the constructionactivities associated withUUHSC also generateearnings, employment and taxrevenue. The constructionimpacts presented werecalculated by BEBR fromcontract information providedby the Senior Vice Presidentfor Health Sciences.
Spurred by the need foradditional teaching facilities,
increased demand for clinicalcare and the necessity ofreplacing and renovating agingbuildings, UUHSC-relatedconstruction spending totaled$24,730,161 in FY 2000. Usingthe RIMS II model, theeconomic impacts of thesedollars on jobs and earningsfor Utah households can bereliably measured. Based onBEBR’s analys i s , theconstruc t ion ac t iv i t i esassociated with UUHSCsupported 718 jobs in Utah(318 construction jobs and 400
jobs in other sectors). The totalearnings generated byconstruction activities were$18,164,303 in earnings($8,758,946 in construction-r e l a t e d e a r n ings and$9,405,357 in other sectors).
The corresponding taxbenefits associated with theearnings generated byconstruction activity amountedto $2,068,914.3
The economic impacts thatresulted from UUHSC-relatedconstruction activities duringFY 2000 are shown below.4
Summary of Construction Impacts
Total Construction Spending . . . . . . . . . . . . . . $24,730,161
teaching and health servicemissions, UUHSC alsorecognizes the potentialbenefits of academic andmedical research in creatingn e w t r e a t m e n t s a n dtechnologies for peopleeverywhere. Through itsresearch efforts UUHSCcontributes to the body of
science and technology whichhas become a major driver inour economic well-being andrising standard of living. Thisresearch has another moreimmediate benefit—it helpsbuild the state’s smallbusiness base through thelicense and commercializationof research undertaken byUUHSC faculty and staff.
Each year UUHSCreceives and spends millions ofdollars in federal and stateresearch and developmentmoney. In FY 2000 aloneUUHSC spent $125.4 millionin medical and health-relatedresearch. Information providedby the University Office ofTechnology Transfer, showsmuch of this research is ulti-
Table 5
UUHSC’s Economic Impacts on Earnings and Employment, 2000
Input-Output Sector
Adjusted
Purchases
Earnings
Coefficient
Earnings
Generated
Jobs
Coefficient
Adj. Jobs
CoefficientJob Years
Generated
Farm and Agricultural Products $31,182 0.5990 $18,678 43.9 4.23E-05 1
Mining $44 0.5473 $24 16.3 1.57E 0
Maintenance Construction $320,354 0.7345 $235,300 31.2 3.01E 10
November/December 2001 UTAH ECONOMIC AND BUSINESS REVIEW 9
BUREAU OF ECONOMIC AND BUSINESS RESEARCH
mately patented or licensed forcommercial use to Utahbusinesses.
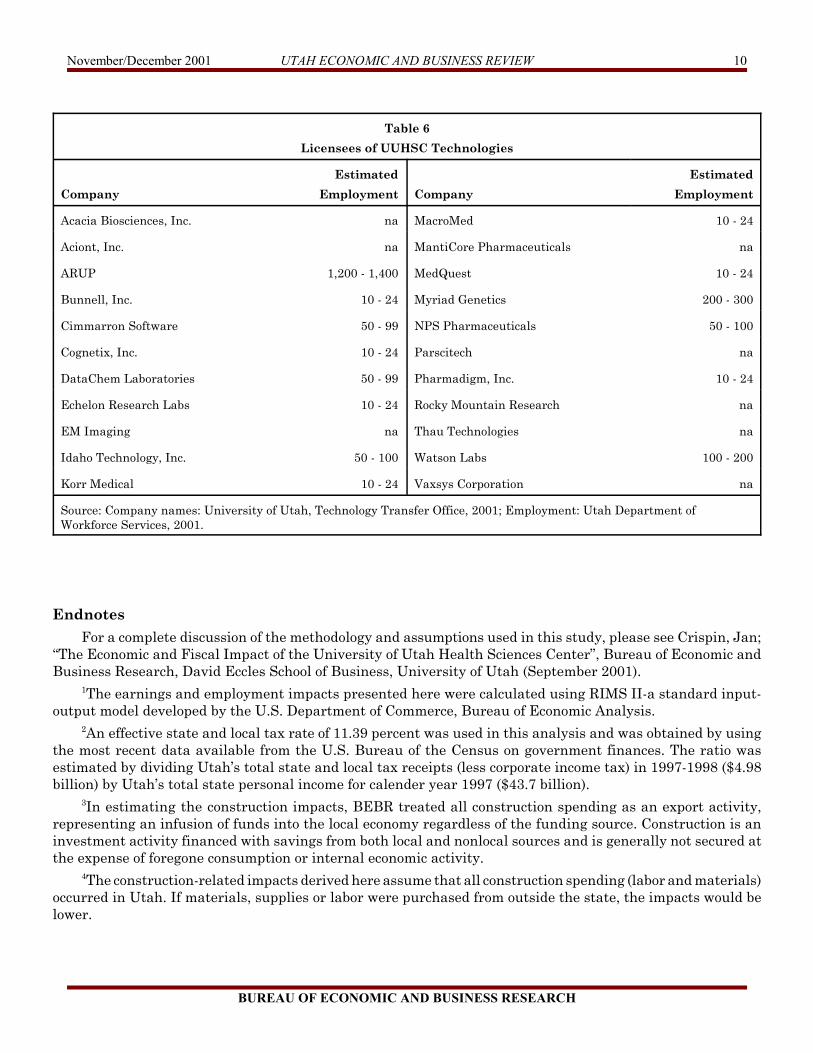
Over the past decades, theUniversity of Utah hasreceived 1,626 patents forresearch and technologiesdeveloped by Universityfaculty and staff. Of thisfigure, more than 60.0 percentwere for research programs inUUHSC. Through thetechnology transfer process,much of UUHSC’s researchhas been licensed to andcommercialized by Utahcompanies. Currently, thereare at least 22 Utah companieswhose direct origins can betraced to UUHSC, or that havel i c e n s e d t e c h n o l o g i e sdeveloped at UUHSC (Table6).Summary
UUHSC benefits Utah’se c o n o m y i n m a n yways—creating jobs andincome for Utah residentswhile generating tax revenuefor units of government. As acustomer for l i teral lythousands of Utah businessesand an employer of more than7,500 people, UUHSC pumpshundreds of millions of dollarsinto the Utah economy eachyear. UUHSC’s reputation forexcellence in carrying out itsgoals of education, clinical careand research is a source ofexport earnings for the Utaheconomy. In FY 2000, morethan one-third of UUHSC’soperating budget, or about
$266.4 million, was export-based. These export-baseddollars are an infusion of newmoney into the state. As such,they stimulate and broadenUtah’s economy.
The impacts of export-based dollars, combined withUUHSC’s in-state spending,result in additional earningsand jobs for Utah residents.During FY 2000, UUHSC’soperations and constructionactivities undertaken on behalfo f U U HS C g e n e r a t e dapproximately $251.3 millionin earnings for Utahhouseholds and sustained6,941 jobs statewide. Theresulting tax revenues were$28.6 million.
As a regional center thatprovides primary, secondaryand tertiary care throughoutthe Intermountain region,UUHSC treats hundreds ofthousands of people each yearat its hospitals and clinics.Many of these patients travelfrom beyond Utah’s borders.During FY 2000, servicesprovided to nonresidentpatients totaled $93.7 millionand accounted for 17 percentof all patient care revenue.Without UUHSC, thesepatients, along with manyUtah residents, would havesought health care servicesfrom facilities outside thestate.
UUHSC’s contributionsextend well beyond Utah’sborders. Its academic and
teaching programs provide themedical community withthousands of health careprofessionals. During FY 2000,3,279 students were enrolledin one of UUHSC’s manyacademic programs. Thenumber of residents-on-stafftotaled 494.
Finally, UUHSC has ahistory of research-ledinnovations and a culture thatencourages interdisciplinaryresearch col laborationsresulting in contributions tothe existing body of scienceand technology. Thesecontributions have been majordrivers of economic growth inUtah. Technologies developedthrough UUHSC’s researchhave been licensed andcommercialized. Currently,there are at least 22 Utahcompanies whose direct originscan be traced to UUHSC.These firms employ about2,500 Utah residents.
As demonstrated with thequantitat ive measures,UUHSC’s sphere of influenceis substantial and far-reaching. Education, healthc a r e a n d e c o n o m i cachievements attributable toUUHSC’s impact not only thelocal community, but alsocontribute to a greater publicgood.
November/December 2001 UTAH ECONOMIC AND BUSINESS REVIEW 10
Source: Company names: University of Utah, Technology Transfer Office, 2001; Employment: Utah Department ofWorkforce Services, 2001.
EndnotesFor a complete discussion of the methodology and assumptions used in this study, please see Crispin, Jan;
“The Economic and Fiscal Impact of the University of Utah Health Sciences Center”, Bureau of Economic andBusiness Research, David Eccles School of Business, University of Utah (September 2001).
1The earnings and employment impacts presented here were calculated using RIMS II-a standard input-output model developed by the U.S. Department of Commerce, Bureau of Economic Analysis.
2An effective state and local tax rate of 11.39 percent was used in this analysis and was obtained by usingthe most recent data available from the U.S. Bureau of the Census on government finances. The ratio wasestimated by dividing Utah’s total state and local tax receipts (less corporate income tax) in 1997-1998 ($4.98billion) by Utah’s total state personal income for calender year 1997 ($43.7 billion).
3In estimating the construction impacts, BEBR treated all construction spending as an export activity,representing an infusion of funds into the local economy regardless of the funding source. Construction is aninvestment activity financed with savings from both local and nonlocal sources and is generally not secured atthe expense of foregone consumption or internal economic activity.
4The construction-related impacts derived here assume that all construction spending (labor and materials)occurred in Utah. If materials, supplies or labor were purchased from outside the state, the impacts would belower.
November/December 2001 UTAH ECONOMIC AND BUSINESS REVIEW 11
BUREAU OF ECONOMIC AND BUSINESS RESEARCH
Utah Business Statistics
UTAH DATA
September
2000
September
2001
% Changefrom Year
Ago
12-MonthAverage
Current Year
12-MonthAverage Last
Year
12-MonthAverage %
ChangeTotal Personal Income (seas. adj. at ann. rates, mil. dol., qtly.) 52,674 na na 54,449.3 51,580.8 5.6 New Corporations (no.) 406 760 87.2 835 686 21.7 New Car, Truck, and Motor Home Sales (no.) 7,260 na na 6,983 7,018 -0.5 Agriculture Average Prices Received by Farmers (dol.) Lambs (cwt.) 82.00 62.00 -24.4 76.42 84.50 -9.6 Barley (per bushel) 1.81 2.04 12.7 2.05 1.92 6.7 Alfalfa Hay, Baled (per ton) 1 82.00 95.00 15.9 89.42 74.00 20.8 Commercial Red Meat Production (thous. of lbs.) 43,400 42,600 -1.8 42,842 40,892 4.8 Milk Production (mil. lbs., qtly.) 448 408 -8.9 404 448 -9.8 Construction Total Permit Construction (thous. of dol.) 330,452.8 298,381.0 -9.7 328,181.3 338,577.3 -3.1 Residential 187,655.1 177,281.7 -5.5 197,930.3 182,506.9 8.5 Nonresidential 82,933.7 69,936.2 -15.7 89,580.7 110,579.3 -19.0 Additions, Alterations, and Repairs 59,864.0 51,163.1 -14.5 49,001.2 45,491.0 7.7 New Dwelling Units (no.) 1,483 1,371.0 -7.6 1,592.2 1,572.1 1.3 Employment 2
Civilian Labor Force (thous.) 1,117.3 1,139.5 2.0 1,131.6 1,101.9 2.7 Employed 1,083.5 1,094.2 1.0 1,089.9 1,066.7 2.2 Unemployed 33.8 45.3 34.0 41.6 35.2 18.2 Percent of Labor Force 3.0 4.0 33.3 3.7 3.2 16.4 Nonagricultural Jobs (thous.) 1,088.0 1,099.0 1.0 1,088.3 1,069.0 1.8 Mining 8.0 8.0 0.0 8.1 7.9 2.4 Contract Construction 74.3 73.3 -1.3 71.1 72.8 -2.4 Manufacturing 131.5 128.8 -2.1 130.4 131.5 -0.9 Transportation, Communications, and Utilities 61.9 62.1 0.3 61.1 60.5 1.1 Wholesale Trade 52.3 52.8 1.0 52.5 51.6 1.7 Retail Trade 201.0 201.5 0.2 201.3 199.2 1.1 Finance, Insurance, and Real Estate 57.5 59.9 4.2 59.1 57.4 3.0 Services 3 316.7 322.3 1.8 317.3 304.8 4.1 Federal Government 32.2 33.3 3.4 33.4 32.4 3.0 State Government 4 58.4 59.9 2.6 58.3 57.3 1.7 Local Government 4 94.2 97.1 3.1 96.2 93.6 2.8 Average Weekly Hours Mining 45.0 43.0 -4.4 43.2 45.1 -4.2 Manufacturing 39.9 38.9 -2.5 39.2 39.8 -1.3 Wholesale Trade 40.0 40.3 0.7 40.2 39.4 2.1 Retail Trade 28.2 27.7 -1.8 27.6 28.0 -1.5 Amount of Unemployment Compensation (thous. of dol.) 6,529.9 13,596.1 108.2 12,270.7 7,985.2 53.7 Finance (qtly.) Total State and National Chartered In-State Banks 33 33 0.0 33 32 3.1 Total Assets (mil. of dol.) 29,271.9 33,870.8 15.7 31,354.0 29,924.7 4.8 Total Liabilities (mil. of dol.) 26,811.3 31,147.5 16.2 28,738.9 27,472.5 4.6 Total Equity Capital (mil. of dol.) 2,460.6 2,721.1 10.6 2,613.8 2,452.2 6.6 Capital to Assets 5 8.41 8.03 -4.5 9.0 8.8 1.8 Loan Loss Reserve Ratio 1.70 2.16 27.1 1.9 1.38 40.1 Loans to Assets 65.75 45.39 -31.0 55.2 64.84 -14.9 Temporary Investment Ratio 6.40 33.21 418.9 21.6 9.62 124.4 Return on Assets 0.23 0.68 195.7 0.8 0.95 -15.3 Production Crude Oil (thous. of bbls.) 1,265.2 na na 1,278.4 1,309.3 -2.4 Natural Gas (mil. of cu. ft.) 23,634.3 na na 24,886.6 22,911.5 8.6 Coal (thous. short tons) 2,041 2,366 15.9 2,508.0 2,175 15.3 Crude Oil to Refineries, Barrels Received (thous. of bbls.) 4,122 na na 4,059.3 4,098 -0.9 Travel/Tourism Air Passengers (total no. on and off, S.L. Int'l. Airport) 1,548,127 1,128,307 -27.1 1,607,627.9 1,659,549 -3.1 Highway Traffic Count Across State Lines (both directions) 72,205 70,397 -2.5 64,040.3 66,970 -4.4 Visits to State and National Parks and Monuments 1,817,965 1,129,754 -37.9 1,138,420.9 1,153,830 -1.3 Utilities Natural Gas Customers (residential and commercial) 687,477 725,221 5.5 701,473.7 680,555 3.1 Natural Gas Customers (industrial) 1,050 1,096 4.4 1,042.8 1,069 -2.5 Telephone Lines in Service (Qwest, residential access) 776,925 712,252 -8.3 739,427.9 776,717 -4.8 Telephone Lines in Service (Qwest, business/public access) 687,477 426,896 -37.9 450,932.7 600,141 -24.9
November/December 2001 UTAH ECONOMIC AND BUSINESS REVIEW 12
BUREAU OF ECONOMIC AND BUSINESS RESEARCH
Utah Business Statistics
UTAH DATA
September
2000
September
2001% Change from
Year Ago
12-MonthAverage
Current Year
12-MonthAverage Last
Year
12-MonthAverage %
ChangeDavis County Nonagricultural Employment (thous.) 86.5 89.4 3.4 86.9 84.3 3.2 Unemployment Rate (seasonally adjusted) 2.9 3.5 20.7 3.3 2.9 13.8 Authorized Permit Construction (thous. of dol.) 76,392.6 27,333.3 -64.2 33,857.2 29,573.1 14.5 New Dwelling Units (no.) 369 182 -50.7 202 175 15.5 New Car, Truck, and Motor Home Sales, Owner's County (no.) 741 na na na 718 na Natural Gas Customers (residential and commercial) 74,712 76,505 2.4 75,977 74,119 2.5 Natural Gas Customers (industrial) 96 92 -4.2 92 95 -3.4 Telephone Lines in Service (Qwest, residential access) 94,572 93,991 -0.6 94,883 93,806 1.1 Telephone Lines in Service (Qwest, business access) 29,818 31,483 5.6 30,855 28,484 8.3
Salt Lake County Nonagricultural Employment (thous.) 550.4 555.6 0.9 553.6 541.6 2.2 Unemployment Rate (seasonally adjusted) 2.9 4.2 44.8 3.5 2.9 19.3 Authorized Permit Construction (thous. of dol.) 111,813.6 97,208.3 -13.1 115,719.1 124,504.7 -7.1 New Dwelling Units (no.) 308 362 17.5 392 393 -0.3 New Car, Truck, and Motor Home Sales, Owner's County (no.) 3,732 na na na 3,617 na Natural Gas Customers (residential and commercial) 291,763 293,880 0.7 295,706 288,779 2.4 Natural Gas Customers (industrial) 461 467 1.3 462 481 -4.0 Telephone Lines in Service (Qwest, residential access) 344,533 317,556 -7.8 331,119 346,317 -4.4 Telephone Lines in Service (Qwest, business access) 232,928 234,775 0.8 234,840 220,406 6.5
Utah County Nonagricultural Employment (thous.) 156.7 158.2 1.0 155.4 151.1 2.8 Unemployment Rate (seasonally adjusted) 2.5 3.6 44.0 3.1 2.6 19.7 Authorized Permit Construction (thous. of dol.) 68,392.4 66,944.4 -2.1 68,202.5 61,327.1 11.2 New Dwelling Units (no.) 369 291 -21.1 351 343 2.5 New Car, Truck, and Motor Home Sales, Owner's County (no.) 1,000 na na na 886 na Natural Gas Customers (residential and commercial) 99,575 103,317 3.8 102,381 98,385 4.1 Natural Gas Customers (industrial) 155 143 -7.7 148 150 -1.4 Telephone Lines in Service (Qwest, residential access) 112,738 107,457 -4.7 109,150 111,722 -2.3 Telephone Lines in Service (Qwest, business access) 57,148 60,660 6.1 59,836 53,474 11.9
Weber County Nonagricultural Employment (thous.) 87.7 86.3 -1.5 87.7 88.6 -1.1 Unemployment Rate (seasonally adjusted) 4.1 4.4 7.3 4.3 4.0 9.5 Authorized Permit Construction (thous. of dol.) 13,652.7 24,312.1 78.1 19,752.4 32,451.5 -39.1 New Dwelling Units (no.) 80 74 -7.5 103 139 -25.6 New Car, Truck, and Motor Home Sales, Owner's County (no.) 470 na na na 466 na Natural Gas Customers (residential and commercial) 67,215 67,903 1.0 67,847 66,506 2.0 Natural Gas Customers (industrial) 102 97 -4.9 98 103 -4.2 Telephone Lines in Service (Qwest, residential access) 62,253 53,492 -14.1 56,689 64,266 -11.8 Telephone Lines in Service (Qwest, business access) 31,774 34,077 7.2 33,458 28,972 15.5 na Not Available1 Mid-month prices. 2 Some figures not strictly comparable due to reclassification. 3 Includes services by nonprofit and religious organizations. 4 Includes public schools and collegeinstitutions. 5 Includes allowance for loan losses.Sources:Personal Income U.S. Department of Commerce, Bureau of Economic Analysis.New Corporations Utah Department of Commerce, Division of Corporations and Commercial Code.New Car and Truck Sales Utah State Tax Commission, Economic and Statistics Unit, Utah Car and Truck Sales.Agriculture U.S. Department of Agriculture, Utah Agricultural Statistics Service, Utah Agriculture.Construction Data Bureau of Economic and Business Research, University of Utah, Utah Construction Report.Employment Data Utah Department of Workforce Services, Utah Labor Market Report.Finance Data Utah Department of Financial Institutions.Crude Oil Production Utah Division of Oil, Gas and Mining, Oil and Gas Production Report, and Utah Office of Energy and
Resource Planning.Natural Gas Production Utah Division of Oil, Gas and Mining, Oil and Gas Production Report.Coal Production U.S. Department of Energy, Energy Information Administration.Air Passengers SLC International Airport, Statistics Division, Air Traffic Statistics and Activity Report.Highway Traffic Count Utah Department of Transportation, Automatic Traffic Recorder Data Report.Visits to State and National Parks and Monuments U.S. Forest Service and Utah State Parks and Recreation Department.Utilities Data Cooperating Utility Companies.
November/December 2001 UTAH ECONOMIC AND BUSINESS REVIEW 13
BUREAU OF ECONOMIC AND BUSINESS RESEARCH
Utah Business Statistics
UTAH DATA
October
2000
October
2001% Change from
Year Ago
12-MonthAverage Current
Year
12-MonthAverage Last
Year12-Month Average
% ChangeTotal Personal Income (seas. adj. at ann. rates, mil. of dol., qtly.) na na na 54,449 51,581 5.6 New Corporations (no.) 644 na na 852 701 21.6 New Car, Truck, and Motor Home Sales (no.) 7,430 na na 6,760 7,100 -4.8 Agriculture Average Prices Received by Farmers (dol.) Lambs (cwt.) 75.00 61.00 -18.7 75.25 84.92 -11.4 Barley (per bushel) 1.79 2.11 17.9 2.08 1.92 8.2 Alfalfa Hay, Baled (per ton) 1 82.00 98.00 19.5 90.75 74.67 21.5 Commercial Red Meat Production (thous. of lbs.) 44,200 48,900 10.6 43,233 41,117 5.1 Milk Production (mil. lbs., qtly.) na na na 404 448 -9.8 Construction Total Permit Construction (thous. of dol.) 337,374.8 329,380.0 -2.4 327,515.0 339,759.5 -3.6 Residential 182,163.4 115,032.9 -36.9 192,336.1 182,618.3 5.3 Nonresidential 78,018.4 56,664.1 -27.4 87,801.1 108,694.8 -19.2 Additions, Alterations, and Repairs 77,183.0 57,702.0 -25.2 47,377.8 48,445.6 -2.2 New Dwelling Units (no.) 1,523 1,756.0 15.3 1,612 1,561 3.2 Employment 3
Civilian Labor Force (thous.) 1,126.7 1,149.3 2.0 1,133.5 1,102.9 2.8 Employed 1,091.1 1,102.4 1.0 1,090.9 1,067.8 2.2 Unemployed 35.0 46.9 34.0 42.6 35.1 21.4 Percent of Labor Force 3.1 4.1 32.3 3.8 3.1 19.7 Nonagricultural Jobs (thous.) 1,088.0 1,097.6 0.9 1,089.1 1,070.8 1.7 Mining 8.0 8.0 0.0 8.1 7.9 1.9 Contract Construction 73.0 71.8 -1.6 71.0 72.4 -2.0 Manufacturing 131.2 128.5 -2.1 130.2 131.4 -0.9 Transportation, Communications, and Utilities 61.8 61.9 0.2 61.2 60.6 0.9 Wholesale Trade 52.4 52.6 0.4 52.5 51.8 1.5 Retail Trade 201.3 201.6 0.1 201.4 199.4 1.0 Finance, Insurance, and Real Estate 57.9 60.3 4.1 59.3 57.3 3.6 Services 4 314.7 319.5 1.5 317.7 306.4 3.7 Federal Government 31.6 32.8 3.8 33.5 32.5 3.1 State Government 5 59.0 60.6 2.7 58.4 57.3 1.9 Local Government 5 97.1 100.0 3.0 96.5 93.8 2.8 Average Weekly Hours Mining 43.2 42.6 -1.4 43.2 44.3 -2.5 Manufacturing 40.1 38.6 -3.7 39.1 39.7 -1.6 Wholesale Trade 40.9 39.8 -2.7 40.1 39.5 1.6 Retail Trade 27.5 27.4 -0.4 27.6 28.0 -1.2 Amount of Unemployment Compensation (thous. of dol.) 8,058.9 na -100.0 12,653.6 8,171.4 54.9 Finance (qtly.) Total State and National Chartered In-State Banks na na na 33 32 3.1 Total Assets (mil. of dol.) na na na 31,354.0 29,924.7 4.8 Total Liabilities (mil. of dol.) na na na 28,738.9 27,472.5 4.6 Total Equity Capital (mil. of dol.) na na na 2,613.8 2,452.2 6.6 Capital to Assets 6 na na na 8.97 8.82 1.8 Loan Loss Reserve Ratio na na na 1.93 1.38 40.1 Loans to Assets na na na 55.20 64.84 -14.9 Temporary Investment Ratio na na na 21.58 9.62 124.4 Return on Assets na na na 0.81 0.95 -15.3 Production Crude Oil (thous. of bbls.) 1,277.5 na na 1,278.5 1,306.4 -2.1 Natural Gas (mil. of cu. ft.) 24,134.5 na na 24,961.8 23,017.4 8.4 Coal (thous. short tons) 2,301 2,021 -12.2 2,485 2,211 12.4 Crude Oil to Refineries, Barrels Received (thous. of bbls.) 4,111 na na 4,053 4,085 -0.8 Travel/Tourism Air Passengers (total no. on and off, S.L. Int'l. Airport) 1,574,436 1,365,064 -13.3 1,590,180 1,658,926 -4.1 Highway Traffic Count Across State Lines (both directions) 63,827 63,488 -0.5 64,012 66,735 -4.1 Visits to State and National Parks and Monuments 1,227,624 910,240 -25.9 1,111,972 1,142,075 -2.6 Utilities Natural Gas Customers (residential and commercial) 702,559 726,901 3.5 703,687 683,290 3.0 Natural Gas Customers (industrial) 1,091 1,102 1.0 1,044 1,070 -2.4 Telephone Lines in Service (Qwest, residential access) 775,306 na na 736,166 777,045 -5.3 Telephone Lines in Service (Qwest, business/public access) 702,559 na na 428,058 629,367 -32.0
November/December 2001 UTAH ECONOMIC AND BUSINESS REVIEW 14
BUREAU OF ECONOMIC AND BUSINESS RESEARCH
Utah Business Statistics
UTAH DATA
October
2000
October
2001% Change from
Year Ago
12-MonthAverage
Current Year
12-MonthAverage Last
Year
12-MonthAverage %
ChangeDavis County Nonagricultural Employment (thous.) 86.4 89.4 3.4 87.2 84.5 3.2 Unemployment Rate (seasonally adjusted) 2.9 3.5 20.7 3.4 2.9 16.2 Authorized Permit Construction (thous. of dol.) 68,250.4 47,158.4 -30.9 32,099.5 33,033.9 -2.8 New Dwelling Units (no.) 357 335 -6.2 200 190 5.0 New Car, Truck, and Motor Home Sales, Owner's County (no.) na na na na 721 na Natural Gas Customers (residential and commercial) 74,792 76,379 2.1 76,122 74,304 2.4 Natural Gas Customers (industrial) 93 91 -2.2 92 95 -3.3 Telephone Lines in Service (Qwest, residential access) 94,876 na na 94,883 93,984 1.0 Telephone Lines in Service (Qwest, business access) 29,627 na na 30,967 28,711 7.9
Salt Lake County Nonagricultural Employment (thous.) 551.7 555.5 0.7 553.9 542.9 2.0 Unemployment Rate (seasonally adjusted) 3.0 4.2 40.0 3.6 2.9 23.0 Authorized Permit Construction (thous. of dol.) 134,192.6 138,813.4 3.4 116,104.1 125,333.2 -7.4 New Dwelling Units (no.) 371 923 148.8 438 393 11.5 New Car, Truck, and Motor Home Sales, Owner's County (no.) na na na na 3,669 na Natural Gas Customers (residential and commercial) 291,838 295,193 1.1 296,011 289,161 2.4 Natural Gas Customers (industrial) 451 470 4.2 464 478 -3.0 Telephone Lines in Service (Qwest, residential access) 343,305 na na 330,011 346,104 -4.6 Telephone Lines in Service (Qwest, business access) 233,898 na na 234,926 223,596 5.1
Utah County Nonagricultural Employment (thous.) 156.8 157.6 0.5 155.5 151.6 2.6 Unemployment Rate (seasonally adjusted) 2.5 3.6 44.0 3.2 2.6 24.0 Authorized Permit Construction (thous. of dol.) 68,250.4 81,550.7 19.5 69,310.9 62,537.7 10.8 New Dwelling Units (no.) 357 436 22.1 358 343 4.3 New Car, Truck, and Motor Home Sales, Owner's County (no.) na na na na 893 na Natural Gas Customers (residential and commercial) 100,181 103,241 3.1 102,659 98,761 3.9 Natural Gas Customers (industrial) 152 143 -5.9 147 151 -2.3 Telephone Lines in Service (Qwest, residential access) 112,508 na na 108,845 111,884 -2.7 Telephone Lines in Service (Qwest, business access) 57,707 na na 60,029 54,527 10.1
Weber County Nonagricultural Employment (thous.) 87.7 86.4 -1.5 87.6 88.6 -1.1 Unemployment Rate (seasonally adjusted) 4.0 4.5 12.5 4.4 4.0 10.3 Authorized Permit Construction (thous. of dol.) 22,644.0 25,169.3 11.2 19,962.8 31,825.9 -37.3 New Dwelling Units (no.) 102 181 77.5 110 132 -16.6 New Car, Truck, and Motor Home Sales, Owner's County (no.) na na na na 461 na Natural Gas Customers (residential and commercial) 67,074 68,007 1.4 67,931 66,639 1.9 Natural Gas Customers (industrial) 97 98 1.0 98 102 -3.4 Telephone Lines in Service (Qwest, residential access) 60,924 na na 56,304 63,960 -12.0 Telephone Lines in Service (Qwest, business access) 31,889 na na 33,601 29,727 13.0 na Not Available1 Mid-month prices. 2 Some figures not strictly comparable due to reclassification. 3 Includes services by nonprofit and religious organizations. 4 Includes public schools and collegeinstitutions. 5 Includes allowance for loan losses.Sources:Personal Income U.S. Department of Commerce, Bureau of Economic Analysis.New Corporations Utah Department of Commerce, Division of Corporations and Commercial Code.New Car and Truck Sales Utah State Tax Commission, Economic and Statistics Unit, Utah Car and Truck Sales.Agriculture U.S. Department of Agriculture, Utah Agricultural Statistics Service, Utah Agriculture.Construction Data Bureau of Economic and Business Research, University of Utah, Utah Construction Report.Employment Data Utah Department of Workforce Services, Utah Labor Market Report.Finance Data Utah Department of Financial Institutions.Crude Oil Production Utah Division of Oil, Gas and Mining, Oil and Gas Production Report, and Utah Office of Energy and
Resource Planning.Natural Gas Production Utah Division of Oil, Gas and Mining, Oil and Gas Production Report.Coal Production U.S. Department of Energy, Energy Information Administration.Air Passengers SLC International Airport, Statistics Division, Air Traffic Statistics and Activity Report.Highway Traffic Count Utah Department of Transportation, Automatic Traffic Recorder Data Report.Visits to State and National Parks and Monuments U.S. Forest Service and Utah State Parks and Recreation Department.Utilities Data Cooperating Utility Companies.
November/December 2001 UTAH ECONOMIC AND BUSINESS REVIEW 15
BUREAU OF ECONOMIC AND BUSINESS RESEARCH
Utah Business Statistics
NATIONAL DATA
October
2000
October
2001% Change
from Year Ago
12-MonthAverage
Current Year
12-MonthAverage Last
Year
12-MonthAverage %
Change
U.S. Gross Domestic Product (seas. adj. at ann. rates, bil., qrtly.) na na na 10,149.3 9,638.3 5.3 Total Personal Income (seas. adj. at ann. rates, bil. of dol.) 8,406.0 8,770.1 4.3 8,745.1 8,204.4 6.6 Industrial Production Index (seasonally adjusted, 1992=100) 146.3 136.9 -6.4 141.7 145.2 -2.4 Capacity Utilization Rate (seasonally adjusted, percent) 81.2 74.6 -8.1 77.7 82.1 -5.3 Net Exports of Goods & Services (millions of dollars; seasonally adj.) -34,025.0 -29,433.0 -13.5 -29,868.5 -30,017.2 -0.5 Exports of Goods & Services (millions of dollars; seasonally adj.) 90,412.0 77,319.0 -14.5 85,736.4 87,813.3 -2.4 Imports of Goods & Services (millions of dollars; seasonally adj.) 124,437.0 106,752.0 -14.2 115,612.6 117,830.3 -1.9 Composite Index of 11 Leading Indicators (1992=100) 109.4 109.4 0.0 109.2 107.6 1.4
Corporate Profits (seas. adj. at ann. rates, bil., qrtly.) Profits Before Taxes na na na 747.9 877.9 -14.8 Profits-Tax Liability na na na 231.8 279.3 -17.0 Profits After Taxes na na na 516.1 599.8 -14.0
Value of New Construction Put In Place Total Construction (seas. adj. at ann. rates, bil. of dol.) 820.8 863.5 5.2 857.1 812.4 5.5 Private Const.: Residential (seas. adj. at ann. rates, bil. of dol.)b 370.3 398.6 7.7 391.0 375.0 4.3 New Housing Units (seas. adj. at ann. rates, bil. of dol.) 257.5 281.6 9.4 274.7 265.2 3.6 Private Const.: Nonresidential (seas. adj. at ann. rates, bil. of dol.) 215.5 199.6 -7.4 212.9 206.0 3.3
Interest Rates Federal Funds Rate 6.51 2.49 -61.8 4.64 6.06 -23.5 Discount Rate on New 91-Day Treasury Bills 6.29 2.20 -65.0 4.19 5.85 -28.4 Yield on Long-Term Treasury Bonds 5.80 5.32 -8.3 5.55 6.05 -8.2 Average Prime Rate Charged by Banks 9.50 5.53 -41.8 7.68 9.06 -15.2 Mortgage Rate (conventional 1st mortgage, new home, U.S. avg.) 7.80 6.62 -15.1 7.09 8.06 -12.0
na Not Availableb Includes residential improvements, not shown separately.Sources:U.S. Gross Domestic Product U.S. Department of Commerce, Survey of Current Business.Total Personal Income U.S. Department of Commerce, Survey of Current Business.Industrial Production Index Board of Governors of the Federal Reserve System, Federal Reserve Bulletin.Capacity Utilization Rate Board of Governors of the Federal Reserve System, Federal Reserve Bulletin.Export/Import Data U.S. Department of Commerce, Survey of Current Business.Composite Index of 11 Leading Indicators The Conference Board, Inc.Consumer Price Indices U.S. Department of Labor, Bureau of Labor Statistics, Monthly Labor Review.Producer Price Index U.S. Department of Labor, Bureau of Labor Statistics, Monthly Labor Review.GDP Implicit Price Deflator U.S. Department of Commerce, Survey of Current Business.Corporate Profits U.S. Department of Commerce, Survey of Current Business.National Employment Data U.S. Department of Labor, Bureau of Labor Statistics, Monthly Labor Review.National Construction Data U.S. Department of Commerce, Bureau of the Census, Value of New Construction Put in Place.Interest Rates Board of Governors of the Federal Reserve System, Federal Reserve Bulletin.
Bureau of Economic and Business ResearchUniversity of Utah1645 E Campus Center Dr Rm 401Salt Lake City UT 84112-9302
Address Service Requested
Nonprofit Org.U.S. Postage PaidPermit No. 1529Salt Lake City, UT
UTAH ECONOMIC AND BUSINESS REVIEW VOLUME 61 NOS. 11 & 12
J. Bernard Machen
President
David Eccles School of BusinessJack W. Brittain Dean
Bureau of Economic and Business ResearchR. Thayne Robson Director