Ever since the Global Financial Crisis (GFC) inmid-2008, investment capital for miningprojects has been a scarce resource as miningcompanies have to compete with projects fromother sectors (Njowa et al., 2013) whilemarkets remain depressed. It is imperative thatvaluation of mining projects is treated withcaution as decisions to invest in mineralprojects are based on the expected returnderived from valuations. The discounted cashflow (DCF) analysis is commonly accepted asthe principal method for valuing miningprojects (Park and Matunhire, 2011; Smith etal., 2007; Janisch, 1976). In DCF analysis, anappropriate discount rate is applied to discountfuture cash flows to present value. Thediscount rate is important because it signifi-cantly impacts the outcome of a valuation.Economic and finance theory provides valuable
tools to calculate discount rates. However,there is often uncertainty on an appropriatediscount rate to apply to a project, as thediscount rate must account for such factors asthe risk and stage of development of themineral project. The Weighted Average Cost ofCapital (WACC) is the discount rate that isused for cash flows with risk profiles similar tothat of the overall company. The WACC is theaverage after-tax cost of capital, which iscomputed as the weighted sum of the cost ofdebt and equity. The cost of debt is derivedfrom the interest rate adjusted for the tax rate,normally fixed for the length of the loan. Thecost of equity can be calculated using thecommonly applied Capital Asset Pricing Model(CAPM) or Gordon’s Wealth Growth Model,even though there are other less commonlyused methods such as the Arbitrage PricingTheory (APT).
The cost of equity is defined as theexpected return on an asset’s common stock incapital markets (Witmer and Zorn, 2007).There is a risk that the investor may notreceive the expected return; therefore,investors are expected to take the risk of theinvestment into account when determining thereturns they want to receive. There is arelationship between risk and expected returnon a stock; the greater the risk, the greater theexpected return on investment the investorexpects (Fehr, 2010).
It is vital, then, that a proper analysis of astock is done in order to determine its truevalue and forecast future returns. According toWitmer and Zorn (2007), estimating the costof equity is not a straightforward exercise;different assumptions and methods result in
Estimating cost of equity in projectdiscount rates: comparison of theCapital Asset Pricing Model andGordon’s Wealth Growth Modelby A.S. Nhleko* and C. Musingwini*
Since the Global Financial Crisis (GFC) in mid-2008, capital has been moredifficult to access. Mining projects must contend with projects from otherindustries for scarce capital. A decision to invest available capital in mineralprojects requires that valuation be conducted to assess the expected return onthe projects. The discounted cash flow (DCF) analysis is generally applied forthe valuation of mining projects, whereby future cash flows are discounted topresent value using an appropriate discount rate. The discount rate signifi-cantly affects the outcome of a valuation. Economic and finance theoryprovides tools to calculate discount rates. The discount rate must account forfactors such as the risk and stage of development of the mineral project;hence the appropriate discount rate to utilize in a project is often a subject ofdebate.
The discount rate is the weighted sum of the cost of debt and equity.There are several methods for determining the cost of equity. This studyconsiders the commonly applied Capital Asset Pricing Model (CAPM) andGordon’s Wealth Growth Model because of their simplicity and availability ofparameters required to estimate the cost of equity. This study explores howdifferences in the cost of equity obtained by these two methods can beexplained for a mining environment. Data for empirical analysis werecollected from the I-Net Bridge, McGregor BFA, and Bloomberg databases. Itwas found that Gordon’s Wealth Growth Model provides better estimates ofthe cost of equity compared to the CAPM under depressed market conditions.Therefore, this research recommends that Gordon’s Wealth Growth Model beused to estimate the discount rates for mining projects during periods ofdepressed market conditions.
Capital Asset Pricing Model, Gordon’s Wealth Growth Model, discount rate,cost of equity, mining projects.
* School of Mining Engineering, University of theWitwatersrand, Johannesburg, South Africa.
Estimating cost of equity in project discount rates
different answers. Hence, this study undertook an analysis ofthe cost of equity estimation by comparing the commonlyapplied CAPM and the Gordon’s Wealth Growth Model.
The CAPM relies on historical data to estimate the beta( ) value, which is used to calculate forward-looking returns.This process is based on the premise that past performance ofan entity is a good estimator of expected future returns.However, this proposition is not entirely correct because thereare periods in the past where unexpected returns wererealized due to events not captured by the -value. Therefore,unreliability in estimated -values results in the need toexplore the use of forward-looking models such as Gordon’sWealth Growth Model in estimating a more appropriate figurefor the cost of equity.
Gordon’s Wealth Growth Model is based on the principlethat dividends grow at a constant rate to perpetuity. It isdifficult to realize this proposition because of volatility inearnings and uncertainty in estimates of expected inflationand real growth in the economy (Stowe et al., 2007;Damodaran, 2002).
The assumptions upon which the CAPM and Gordon’sWealth Growth Model are based may result in difficulty whenapplied to real investment problems. Consequently, cautionmust be exerted to appreciate the constraints of theunderlying assumptions. This raises the question: ‘How candifferences in the cost of equity obtained by these twomethods be explained in a mining environment?’ Selection ofan appropriate discount rate is central to an accurate andvalid assessment of the value of any mineral project. Thediscount rate is applied to cash flows in estimating thepresent value of an asset and is used as the rate of return foran investment. A discount rate that is lower than the true ratewill overvalue the project, resulting in the commissioning ofan uneconomic project. A discount rate that is higher thanthe true rate will undervalue the project, resulting in therejection of a financially viable project. For this reason, it isessential to estimate the discount rate as close to the truediscount rate as possible. Therefore, valuation shouldincorporate a thorough and objective analysis to obtain anappropriate discount rate reflecting the acceptable returnsmatching with the project’s risk profile and market conditions(Ballard, 1994). It is vital to identify a model that can beemployed to reliably estimate the appropriate discount rate.
The prices of securities result from different analyses ofdifferent information accompanied by different conditionsand preferences relevant to a particular investor. Therefore, itis necessary to employ some standard principles whenestimating prices of securities. The CAPM describes therelationship between risk and return in an efficient market.An efficient market is one where the market price is anunbiased estimate of the intrinsic value of the investment(Damodaran, 2002). The CAPM is regarded as a single factormodel because it is based on the premise that the expectedrate of return can be predicted by using a single factor, thesystematic risk.
The systematic risk predominant in any investment isrepresented by beta ( ), which is calculated as the historicalvolatility of a company’s share prices compared to the marketand is therefore a proxy for risk. A minimum level of return
required by the investor is realized when the expected returnE(Ri) is equal to the actual return on an asset; this is knownas risk-free return (Rf). The CAPM assumes that an investorwill only hold a market portfolio. A market portfolio (m) isdefined as a portfolio in which an investment into any assetis equal to the market value of that asset divided by themarket value of all risky assets in the portfolio. Equation [1]is the CAPM equation for estimating the rate of return.
[1]
where E(Ri) is the expected return (cost of equity) on anasset, i, and Rf is the risk-free rate and can be obtained froma totally safe investment (Rudenno and Seshold, 1983).When estimating the risk-free rate it is important to use arate on long-term Treasury bonds (T-bonds) because miningstocks are long-term securities; Treasury bills are morevolatile than T-bonds. When using the CAPM to estimate thecost of equity, the theoretical holding time horizon is the lifeof the project. Therefore, it is a logical choice to use the rateon long-term T-bonds as a proxy for the risk-free rate. Theterm E(Rm)− Rf, represents the market risk premium(Brigham and Ehrhardt, 2007).
Gordon’s Wealth Growth Model was initially developed byGordon and Shapiro in 1956, and later refined by Gordon in1962, based on the premise that dividends grow at a constantrate in perpetuity. Nonetheless, this assumption does nothold in reality because projections of dividends cannot bemade for an indefinite period; hence, various versions of thedividend discount model have been developed. These modelswere developed based on different assumptions concerningfuture growth. The simplest form of the dividend discountmodels is Gordon’s Wealth Growth Model and it is used tovalue a stock of a company that has stable growth and paydividends regularly (Stowe et al., 2007; Damodaran, 2002).
This model assumes that the stock is equal to the presentvalue of all its future dividend payments. The predicteddividends are discounted back to their present values.Gordon’s Wealth Growth Model is useful when evaluatingentities having well-established policies on dividend payoutsand a growth rate equivalent to or lower than the smallgrowth in the economy (Damodaran, 2002). Companies mayhave different expected growth rates, but there is evidencethat dividends growth rates for mature companies are similarto the nominal gross domestic product (GDP) rate. NominalGDP is given by real GDP plus inflation (Brigham andEhrhardt, 2007). The model’s expected rate of return iscalculated by using Equation [2].
[2]
whereR represents the investors’ required rate of return
(discount rate)Dt–1 represents dividends at the present time (paid in the
previous period)Dt represents dividends at the next consecutive time (paid
in the next period)
�
216
Pt represents current stock priceg represents the constant growth rate of the dividend
stream.
In order to obtain a reliable estimate of the expected rateof return, it is imperative that the expectations of investorsare reflected on the stable growth rate and future dividends.Estimating reliable and impartial forecasts of futuredividends, their timing, and growth patterns for deriving costof equity is regarded as the main challenge in using dividenddiscount models.
According to Foerster and Sapp (2005) and Whitcutt(1992), the growth rate (g) can also be estimated using thenominal GDP since it is argued that GDP is the maximumsustainable growth rate for a company’s dividend. However,using GDP growth rates to approximate long-term growthrate in dividends seems to work well at estimating thedividends for the stock of a mature and dividend-payingcompany. There is evidence that the dividend and GDPgrowth rates have a positive correlation (Foerster and Sapp,2005).
This study is limited to mining companies listed on theJohannesburg Securities Exchange (JSE). The JSE wasselected because it:
� Is a member of the World Federation of Exchanges� Complies with the global standards and legislative
requirements� Acts as a regulator to its members, ensuring that
markets operate in a transparent manner, safeguardinginvestors
� Ensures accurate and adequate disclosure of allinformation relevant to investors (City ofJohannesburg, 2014)
� JSE data can be accessed for an adequate length oftime.
Prior to June 1995, the sectors of the JSE were defineddifferently; therefore to use data prior to this period, onewould have to reconstruct each sectoral index in order toobtain comparable data. Reconstruction of the data is beyondthe scope of this study, thus only data post-1995 wasconsidered. The time horizon period for the study is January1998 to December 2012 because the JSE was illiquid prior to1998. The study considered top mining companies, by marketcapitalization, as the smaller companies are thinly traded andmay experience long periods of mispricing, which wouldadversely affect the findings if it occurs.
In order to apply Gordon’s Wealth Growth Modeleffectively, a company has to have stable growth and paydividends regularly. Small mining enterprises do not paydividends frequently and have variations in growth rates,thus it will be futile to determine their discount rates usingthis model. According to Tholana et al., (2013) gold,platinum, and coal are the most economically vital mineralsin South Africa; hence, the focus of this study is restricted tothese commodities. Coal-mining companies (excluding themulti-commodity companies) were not considered as theycannot be classified as ‘stable growth’ companies due to
failure to pay dividends regularly. Based on the marketcapitalization, the top three mining companies in the goldand platinum sectors quoted on the JSE over the period of thestudy were selected.
The six mining companies used were:
� Platinum: Anglo American Platinum Limited, LonminPlc, and Impala Platinum Holdings Limited
� Gold: AngloGold Ashanti Limited, Harmony GoldMining Company Limited, and Gold Fields Limited.
The databases used to source data for this study are I-NetBridge, McGregor BFA, and Bloomberg. The WACC valuesobtained from the Bloomberg database were split into debtand equity components. The equity component of WACC wasused to benchmark against the estimates of CAPM andGordon’s Wealth Growth Model.
The average market premium and risk-free rate (T-bonds) used in South Africa for the year 2013 are 6.8% and6.4%, respectively (Fernandez et al., 2013). These estimateswere adopted for this study in order to reduce the inaccuracyin the estimated cost of equity. The values were calculatedfor the preceding 60 months using ordinary least squares(OLS) linear regression, covariance of stock returns againstthe market returns, and adjusted using the Blume’stechnique. The adjusted coefficient values were used toestimate the cost of equity rates.
Gordon’s Wealth Growth Model is based on the premisethat dividends grow at a constant rate in perpetuity.Subsequently, the GDP rate was applied as an alternative tocompany-specific growth rates because the latter are notconstant over time. The GDP growth rate in South Africaaveraged 3.16% in real terms from 1993 until 2014, asshown in Figure 1.
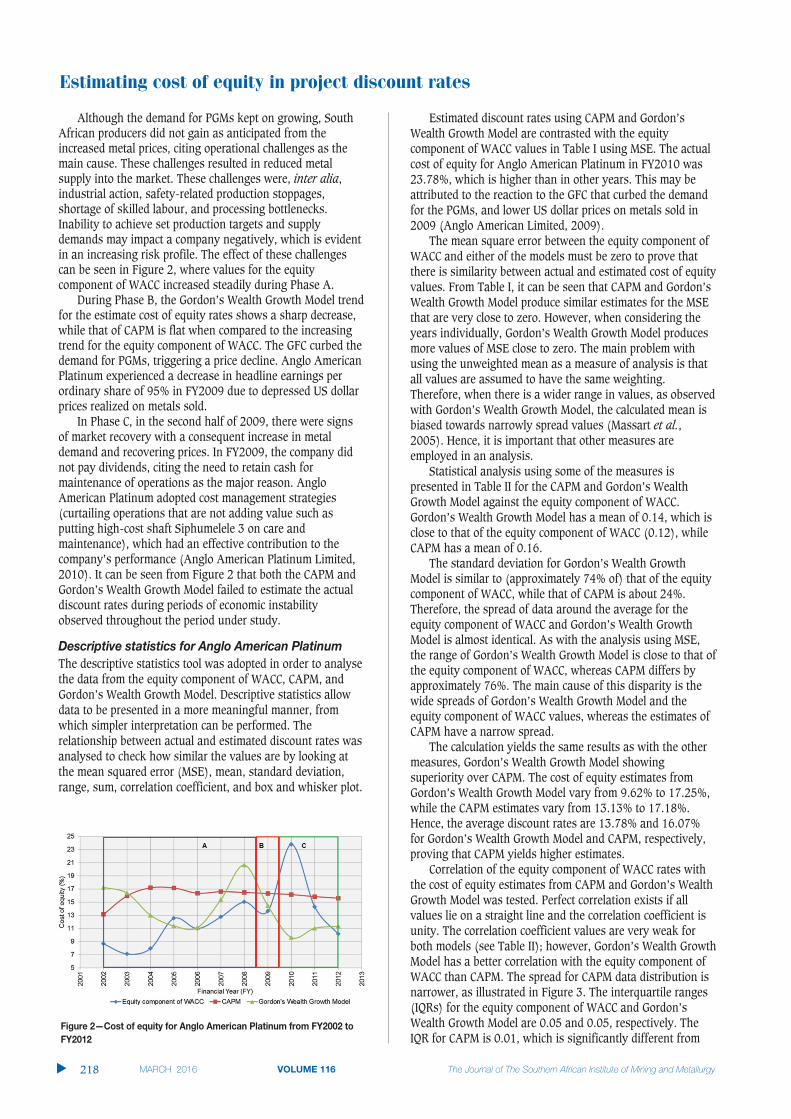
For the purposes of illustrating the approach followed incomparing CAPM and Gordon’s Wealth Growth Model for allthe six mining companies, data and analysis is presented onAnglo American Platinum Limited. The discount rateestimates for Anglo American Platinum Limited for the periodfrom financial year 2002 (FY2002) to FY2012 are shown inFigure 2. The estimates are divided, according to marketconditions, into three phases: ‘A’ (market boom), ‘B’(recession), and ‘C’ (steady economic growth). In Phase A,commodity prices soared drastically due to increased globaldemand for platinum group metals (PGMs). The headlineearnings of Anglo American Platinum increased due to highUS dollar prices realized for metals sold and weaker rand/USdollar exchange rates.
Estimating cost of equity in project discount rates
217 �
Estimating cost of equity in project discount rates
Although the demand for PGMs kept on growing, SouthAfrican producers did not gain as anticipated from theincreased metal prices, citing operational challenges as themain cause. These challenges resulted in reduced metalsupply into the market. These challenges were, inter alia,industrial action, safety-related production stoppages,shortage of skilled labour, and processing bottlenecks.Inability to achieve set production targets and supplydemands may impact a company negatively, which is evidentin an increasing risk profile. The effect of these challengescan be seen in Figure 2, where values for the equitycomponent of WACC increased steadily during Phase A.
During Phase B, the Gordon’s Wealth Growth Model trendfor the estimate cost of equity rates shows a sharp decrease,while that of CAPM is flat when compared to the increasingtrend for the equity component of WACC. The GFC curbed thedemand for PGMs, triggering a price decline. Anglo AmericanPlatinum experienced a decrease in headline earnings perordinary share of 95% in FY2009 due to depressed US dollarprices realized on metals sold.
In Phase C, in the second half of 2009, there were signsof market recovery with a consequent increase in metaldemand and recovering prices. In FY2009, the company didnot pay dividends, citing the need to retain cash formaintenance of operations as the major reason. AngloAmerican Platinum adopted cost management strategies(curtailing operations that are not adding value such asputting high-cost shaft Siphumelele 3 on care andmaintenance), which had an effective contribution to thecompany’s performance (Anglo American Platinum Limited,2010). It can be seen from Figure 2 that both the CAPM andGordon’s Wealth Growth Model failed to estimate the actualdiscount rates during periods of economic instabilityobserved throughout the period under study.
The descriptive statistics tool was adopted in order to analysethe data from the equity component of WACC, CAPM, andGordon’s Wealth Growth Model. Descriptive statistics allowdata to be presented in a more meaningful manner, fromwhich simpler interpretation can be performed. Therelationship between actual and estimated discount rates wasanalysed to check how similar the values are by looking atthe mean squared error (MSE), mean, standard deviation,range, sum, correlation coefficient, and box and whisker plot.
Estimated discount rates using CAPM and Gordon’sWealth Growth Model are contrasted with the equitycomponent of WACC values in Table I using MSE. The actualcost of equity for Anglo American Platinum in FY2010 was23.78%, which is higher than in other years. This may beattributed to the reaction to the GFC that curbed the demandfor the PGMs, and lower US dollar prices on metals sold in2009 (Anglo American Limited, 2009).
The mean square error between the equity component ofWACC and either of the models must be zero to prove thatthere is similarity between actual and estimated cost of equityvalues. From Table I, it can be seen that CAPM and Gordon’sWealth Growth Model produce similar estimates for the MSEthat are very close to zero. However, when considering theyears individually, Gordon’s Wealth Growth Model producesmore values of MSE close to zero. The main problem withusing the unweighted mean as a measure of analysis is thatall values are assumed to have the same weighting.Therefore, when there is a wider range in values, as observedwith Gordon’s Wealth Growth Model, the calculated mean isbiased towards narrowly spread values (Massart et al.,2005). Hence, it is important that other measures areemployed in an analysis.
Statistical analysis using some of the measures ispresented in Table II for the CAPM and Gordon’s WealthGrowth Model against the equity component of WACC.Gordon’s Wealth Growth Model has a mean of 0.14, which isclose to that of the equity component of WACC (0.12), whileCAPM has a mean of 0.16.
The standard deviation for Gordon’s Wealth GrowthModel is similar to (approximately 74% of) that of the equitycomponent of WACC, while that of CAPM is about 24%.Therefore, the spread of data around the average for theequity component of WACC and Gordon’s Wealth GrowthModel is almost identical. As with the analysis using MSE,the range of Gordon’s Wealth Growth Model is close to that ofthe equity component of WACC, whereas CAPM differs byapproximately 76%. The main cause of this disparity is thewide spreads of Gordon’s Wealth Growth Model and theequity component of WACC values, whereas the estimates ofCAPM have a narrow spread.
The calculation yields the same results as with the othermeasures, Gordon’s Wealth Growth Model showingsuperiority over CAPM. The cost of equity estimates fromGordon’s Wealth Growth Model vary from 9.62% to 17.25%,while the CAPM estimates vary from 13.13% to 17.18%.Hence, the average discount rates are 13.78% and 16.07%for Gordon’s Wealth Growth Model and CAPM, respectively,proving that CAPM yields higher estimates.
Correlation of the equity component of WACC rates withthe cost of equity estimates from CAPM and Gordon’s WealthGrowth Model was tested. Perfect correlation exists if allvalues lie on a straight line and the correlation coefficient isunity. The correlation coefficient values are very weak forboth models (see Table II); however, Gordon’s Wealth GrowthModel has a better correlation with the equity component ofWACC than CAPM. The spread for CAPM data distribution isnarrower, as illustrated in Figure 3. The interquartile ranges(IQRs) for the equity component of WACC and Gordon’sWealth Growth Model are 0.05 and 0.05, respectively. TheIQR for CAPM is 0.01, which is significantly different from
�
218
that of the equity component of WACC; this is expectedbecause the spread of the CAPM data is narrower (see Table I).
The cost of equity estimates using the CAPM and Gordon’sWealth Growth Model failed to predict the actual discountrates for Anglo American Platinum. Descriptive statisticswere used to check for similarity in the data for CAPM andGordon’s Wealth Growth Model and the equity component ofWACC rates. The statistical measures show that the data forGordon’s Wealth Growth Model and the equity component ofWACC are similar, with only MSE results favouring CAPMwhen looking at the means.
The same methodology used to estimate the cost of equityand compare it to the equity component of WACC was appliedin analysing the other companies. The cost of equity valuesestimated using Gordon’s Wealth Growth Model produced asimilar trend for all platinum companies, and the sameapplies for all gold companies used in the study. On the otherhand, the CAPM produced different trends for differentcompanies and this can be attributed to the individual riskprofiles of the companies. The correlation coefficient measurewas used to summarize the findings of this study. The ratingsystem used to analyse the ability of CAPM and Gordon’sWealth Growth Model to estimate the cost of equity formining companies is shown in Table III.
The colour classifications in Table IV were assignedvalues in order to calculate an overall rating score for CAPMand Gordon’s Wealth Growth Model. A summary of thefindings of this study using the correlation coefficient areshown in Table IV.
The Gordon’s Wealth Growth Model has a higher overallrating compared to CAPM. Hence, Gordon’s Wealth GrowthModel was chosen as the better model to estimate the cost ofequity for mining company projects.
Since the GFC in mid-2008, it has been difficult for miningprojects to access capital as mining companies have tocompete with other sectors for this scarce resource. Therefore,it is vital to determine reliable project values. A widelyapplied valuation technique is DCF analysis, which usesappropriate discount rates to discount future cash flows topresent values. There are numerous methods that can beapplied to determine discount rates; this study consideredGordon’s Wealth Growth Model and the Capital Asset PricingModel (CAPM). These methods were chosen because of theirsimplicity and availability of the parameters required to
Estimating cost of equity in project discount rates
Rating Poor Moderate GoodColour Red Yellow GreenRating value 1 2 3
Estimating cost of equity in project discount rates
estimate the discount rates. Based on market capitalization asquoted on the JSE over the period January 1998 to December2012, the top three platinum and top three gold miningcompanies were selected for the study. Data used forempirical analysis was obtained from I-Net Bridge, McGregorBFA, and Bloomberg databases. The CAPM closely capturedthe actual cost of equity throughout the period under study,while Gordon’s Wealth Growth Model captured the trend forthe actual equity component of Weighted Average Cost ofCapital (WACC) values. However, Gordon’s Wealth GrowthModel consistently underestimated the cost of equity. Thiscan be attributed to the fact that economic market movementsdo not immediately affect mining companies.
The data-set for Gordon’s Wealth Growth Model wassimilar to that of the equity component of WACC for both goldand platinum mining companies. There was a highcorrelation between Gordon’s Wealth Growth Model and theequity component of WACC for gold mining companies,whereas a weak correlation between the equity component ofWACC and both CAPM and Gordon’s Wealth Growth Modelwas identified for platinum mining companies. However,CAPM had a narrower spread than Gordon’s Wealth GrowthModel throughout, suggesting that it is a better model forestimating cost of equity. It is therefore recommended thatinvestors, practitioners, and/or researchers consider usingGordon’s Wealth Growth Model when estimating cost ofequity for mining companies under depressed economicmarket conditions, given that this method uses ex-ante datato estimate ex-ante returns.
This paper refers to part of an MSc research study undertakenat the University of the Witwatersrand.
ANGLO AMERICAN PLATINUM LIMITED. 2009. Annual Report 2009.http://www.angloamericanplatinum.com/~/media/Files/A/Anglo-American-Platinum/annual-reports/ar2009.pdf [Accessed 11 June 2014].
ANGLO AMERICAN PLATINUM LIMITED. 2010. Annual Report 2010.http://investoreports.com/angloplatinumar2010_pdfs//downloads/angloplatinum_2010.pdf [Accessed 11 June 2014].
BALLARD, J. 1994. A practitioner’s view of DCF methods in mineral valuation,Proceedings of Mineral Valuation Methodologies Conference, Sydney.http://www.1mine.org/view/?d=1234567890123456789012345678901234567890123456789012345678901234191782 [Accessed 13 February2014].
BRIGHAM, E.F. and EHRHARDT, M.C. 2007. Financial Management. ThomsonLearning, London.
CITY OF JOHANNESBURG. 2014. Johannesburg Securities Exchange.http://www.joburg.org.za/index.php?option=com_content&view=article&id=106%3Ajse&catid=30&Itemid=58 [Accessed 17 April 2014].
DAMODARAN, A. 2002. Investment Valuation, Tools and Techniques forDetermining the Value of Any Asset. Wiley, New York.
FEHR, D. 2010. Creating and monitoring a diversified stock portfolio.http://www.finrafoundation.org/web/groups/foundation/@foundation/documents/foundation/p118404.pdf [Accessed 21 November 2013].
FERNANDEZ, P., AGUIRREAMALLOA, J., and LINARES, P. 2013. Market risk premiumand risk free rate used for 51 countries in 2013: a survey with 6,237answers. http://papers.ssrn.com/sol3/papers.cfm?abstract_id=914160&download=yes [Accessed 9 January 2014].
FOERSTER, S.R. and SAPP, S. 2005. The dividend discount model in the long-run:a clinical study. Journal of Applied Finance, vol. 15, no. 2. pp. 1–40.http://www.ivey.uwo.ca/faculty/ssapp/Research/Papers/Foerster_Sapp_JAF_Oct_2005.pdf [Accessed 18 July 2014].
JANISCH, P.R. 1976. The limitations of gold-mine evaluation. Journal of theSouthern African Institute of Mining and Metallurgy, vol. 76, no. 11. pp. 439–444. http://www.saimm.co.za/Journal/v076n11p439.pdf[Accessed 13 February 2014].
MASSART, D.L., SMEYERS-VERBEKE, J., CAPRON, X., and SCHLESIER, K. 2005. Visualpresentation of data by means of box plots.http://www.csee.umbc.edu/courses/graduate/CMSC601/Spring11/papers/box_charts.pdf [Accessed 15 December 2014].
NJOWA, G., CLAY, A.N., and MUSINGWINI, C. 2014. A perspective on globalharmonisation of major national mineral asset valuation codes. ResourcesPolicy, vol. 39, March. pp. 1-14. http://dx.doi.org/10.1016/j.resourpol.2013.10.004 [Accessed 14 April 2015].
PARK, S.J. and MATUNHIRE, I.I. 2011. Investigation of factors influencing thedetermination of discount rate in the economic evaluation of mineraldevelopment projects. Journal of the Southern African Institute of Miningand Metallurgy, vol. 111, no. 11. pp. 773–779. http://www.saimm.co.za/Journal/v111n11p773.pdf [Accessed 25 February 2014].
RUDENNO, V. AND SESHOLD, P. 1983. Cost of capital for resource projects. TheAustralasian Institute of Mining and Metallurgy Project DevelopmentSymposium, Sydney, November 1983. pp. 281–286.http://www.onemine.org/view/?d=1234567890123456789012345678901234567890123456789012345678901234194481 [Accessed 24February 2014].
SMITH, G.L., PEARSON-TAYLOR, J., ANDERSON, D.C., and MARSH, A.M. 2007. Projectvaluation, capital investment and strategic alignment—tools andtechniques at Anglo Platinum. Journal of the Southern African Institute ofMining and Metallurgy, vol. 107, no. 1. pp. 67–74.http://www.saimm.co.za/Conferences/Pt2006/035-42_Smith.pdf[Accessed 24 February 2014].
STOWE, J.D., ROBINSON, T.R., PINTO, J.E., and MCLEAVEY, D.W. 2007. Equity AssetValuation. CFA Institute Investment Series. Wiley, Hoboken, New Jersey.
TABORDA, J. 2014. South Africa GDP growth rate. Trading Economics.http://www.tradingeconomics.com/south-africa/gdp-growth [Accessed 23October 2014].
THOLANA, T., MUSINGWINI, C., and NJOWA, G. 2013. An algorithm to constructindustry cost curves used in analysing cash cost performance ofoperations for selected minerals in South Africa. Journal of the SouthernAfrican Institute of Mining and Metallurgy, vol. 113, no. 6. pp. 473–484.http://www.saimm.co.za/Journal/v113n06p473.pdf [Accessed 14 April2015].
WHITCUTT, P.G. 1992. The cost of equity finance: an empirical study. MBAresearch report, Wits Business School, University of the Witwatersrand.
WITMER, J. and ZORN, L. 2007. Estimating and comparing the implied cost ofequity for Canadian and U.S. firms, Bank of Canada Working Paper 2007–48. http://www.econstor.eu/bitstream/10419/53825/1/548043353.pdf [Accessed 21 November 2013]. �


![FR Appendix 9.12: Cost of capital · A9.12-3 capital to consider is the weighted average cost of debt and equity. The WACC is given by the following expression: WACC = E[R i] x E/(D+E)](https://static.documents.pub/doc/80x56/5b15f9d67f8b9a824f8c6713/fr-appendix-912-cost-of-capital-a912-3-capital-to-consider-is-the-weighted.jpg)


