SHRP-A-409 Validation of Relationships Between Specification Properties and Performance Rita B. Leahy Edward T. Harrigan Strategic Highway Research Program Harold Von Quintus Brent Rauhut Engineering Strategic Highway Research Program National Research Council Washington, D.C. 1994
Transcript
SHRP-A-409
Validation of RelationshipsBetween Specification Properties
and Performance
Rita B. LeahyEdward T. Harrigan
Strategic Highway Research Program
Harold Von QuintusBrent Rauhut Engineering
Strategic Highway Research ProgramNational Research Council
Washington, D.C. 1994
SHRP-A-409ISBN 0-309-05813-9Product no. 1012
Program Manager: Edward T. Harrigan
Project Managers: Rita B. Leahy and Harold Von QuintusProgram Area Secretary: Juliet NarsiahTypesetters: Laurie Dockendorf, Teresa Culver, and Peggy BlairProduction Editor: Katharyn L. Bine
Strategic Highway Research ProgramNational Research Council2101 Constitution Avenue N.W.
Washington, DC 20418
(202) 334-3774
The publication of this report does not necessarily indicate approval or endorsement by the National Academy ofSciences, the United States Government, or the American Association of State Highway and TransportationOfficials or its member states of the findings, opinions, conclusions, or recommendations either inferred or
The work reported herein was supported by the Strategic Highway Research Program(SHRP). SHRP is a unit of the National Research Council that was authorized by section128 of the Surface Transportation and Uniform Relocation Assistance Act of 1987.
The patience and expertise of Laurie Dockendorf, Teresa Culver, and Peggy Blair, OregonState University, are gratefully acknowledged. It was largely through their tireless efforts atthe keyboard that this report made it to press.
Contents
Page
Acknowledgments .................................................. iii
Contents ......................................................... v
List of Figures ..................................................... ix
List of Tables ...................................................... xv
Figure 2.15 Relationship between limiting stiffness and fracture temperature ........ 41
Figure 2.16 Relationship between m-value and fracture temperature .............. 41
Figure 2.17 Relationship between ultimate strain at failure and fracturetemperature ............................................. 42
Figure 3.1 Experimental design for stage 2 validation ....................... 47
Figure 3.2 Relationship between log of slope of creep compliance of binder andmix .................................................. 49
Figure 3.3a Relationship between G* and sin 8 (rutting) ...................... 50
Figure 3.3b Relationship between G* and sin 8 (fatigue cracking) ............... 50
Figure 3.4a Relationship between binder specification property and observedrutting ................................................ 51
Figure 3.4b Relationship between binder specification property and observedfatigue cracking ......................................... 51
Figure 3.5 Relationship between tensile strain at failure and secant modulus ....... 53
Figure 3.6 Relationship between failure strain in tension for binder secantmodulus of 100 MPa (14.5 ksi) and observed pavement cracking ....... 54
Figure 3.7 Relationship between binder specification properties and observedlow-temperature cracking ................................... 56
Figure 3.8 Relationship between binder specification properties and observedlow-temperature cracking (test temperature at lowest pavementtemperature plus 10°C [50°F]) ............................... 56
Figure 3.9 Relationship between binder stiffness and low-temperature cracking atvarious test temperatures ................................... 57
X
Page
Figure 3.10 Comparison of calibrated predictions with measured fatigue crackingusing backcalculated asphalt moduli ........................... 60
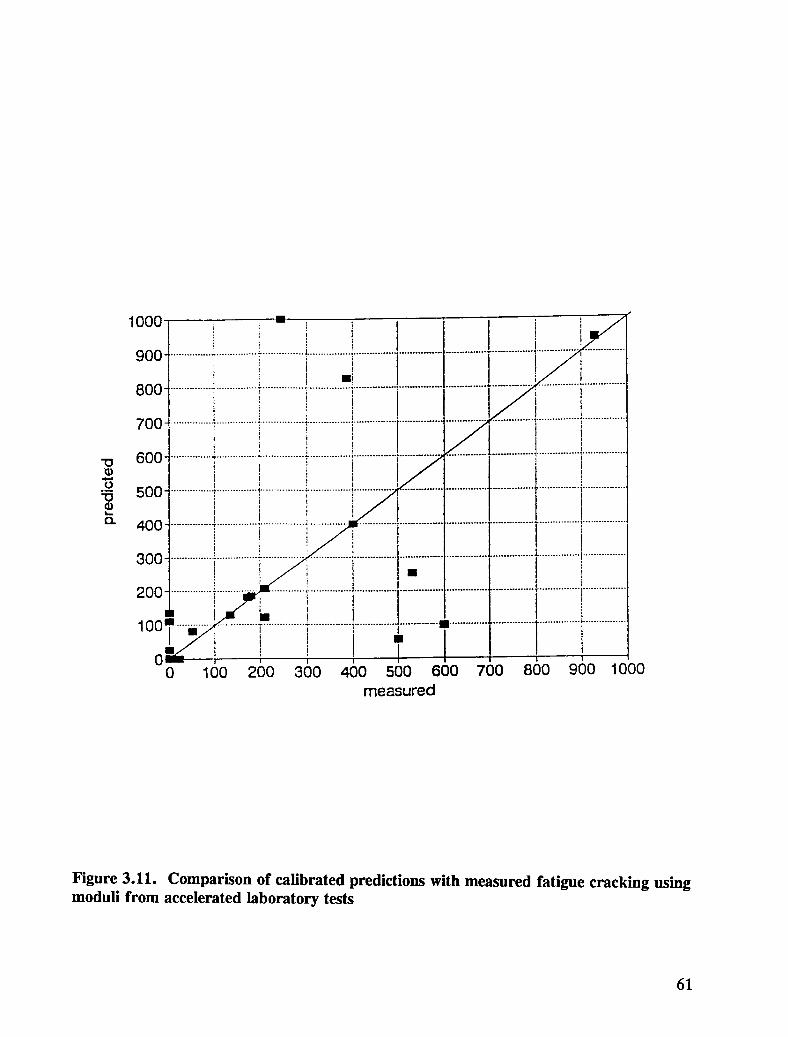
Figure 3.11 Comparison of calibrated predictions with measured fatigue crackingusing moduli from accelerated laboratory tests .................... 61
Figure 3.12 Comparison of measured rut depth with calibrated predictions ofrut depth .............................................. 62
Figure 3.13 Final cell groups of predicted versus observed low-temperaturecracking ............................................... 64
Figure 4.1 Effect of age conditioning on C/sin 8 .......................... 70
Figure 4.2 Effect of age conditioning on tensile strength ..................... 70
Figure 4.3 Effect of age conditioning on m-value .......................... 71
Figure 4.4 Effect of age conditioning on stiffness .......................... 71
Figure 4.5a Effect of age conditioning on tensile strength(modified binder AAK) .................................... 72
Figure 4.5b Effect of age conditioning on tensile strength(modified binder AAG) .................................... 72
Figure 4.5c Effect of age conditioning on tensile strength(modified binder AAM) .................................... 72
Figure 4.6a Effect of age conditioning on G*/sin _5(modified binder AAG) ......... 73
Figure 4.6b Effect of age conditioning on G*/sin 8 (modified binder AAK) ......... 73
Figure 4.6c Effect of age conditioning on G*/sin 8 (modified binder AAM) ........ 73
Figure 4.7 Modified binder performance in terms of tensile strength ............. 75
Figure 4.8 Modified binder performance in terms of G*/sin 8 .................. 75
Figure 4.9 Modified binder performance in terms of stiffness .................. 76
Figure 4.10 Modified binder performance in terms of m-value .................. 76
Figure 4.11 Modified binder data ...................................... 78
xi
Page
Figure 4.12 Effect of binder modification on G*/sin _ ................... 78
Figure 4.13 Effect of binder modification on high-temperature properties ....... 79
Figure 4.14 Effect of modifiers on unaged binders (tensile strength) ........... 80
Figure 4.15 Comparison of tensile strength for unmodified and modified binders 80
Figure 4.16 Comparison of laboratory- and field-aged modifiers .............. 81
Figure 4.17 Effect of modifiers on unaged binders (tensile strain) ............. 82
Figure 4.18 Comparison of tensile strain for unmodified and modified binders ... 82
Figure 4.19 Effect of modifiers on unaged binders (stiffness) ................ 83
Figure 4.20 Comparison of stiffness for unmodified and modified binders ....... 83
Figure 4.21 Relationship between bending beam rheometer stiffness andtheoretical mix cracking temperature ......................... 84
Figure 4.22 Relationship between bending beam rheometer stiffness and TSRSTfracture stress .......................................... 84
Figure 4.23a Relationship between load cycles and permanent shear strata(control mix with binder AAG) ............................. 90
Figure 4.23b Relationship between load cycles and permanent shear strata(control mix with binder AAK) ............................. 90
Figure 4.24a Relationship between load cycles and permanent shear strain(binder AAG with M401) ................................. 91
Figure 4.24b Relationship between load cycles and permanent shear strata(binder AAK with M401) ................................. 91
Figure 4.25a Relationship between load cycles and permanent shear strain(binder AAG with M412) ................................. 92
Figure 4.25b Relationship between load cycles and permanent shear strain(binder AAK with M412) ................................. 92
Figure 4.26a Relationship between load cycles and permanent shear strata(binder AAG with M415) ................................. 93
x_i
Page
Figure 4.26b Relationship between load cycles and permanent shear strain(binder AAK with M415) ................................. 93
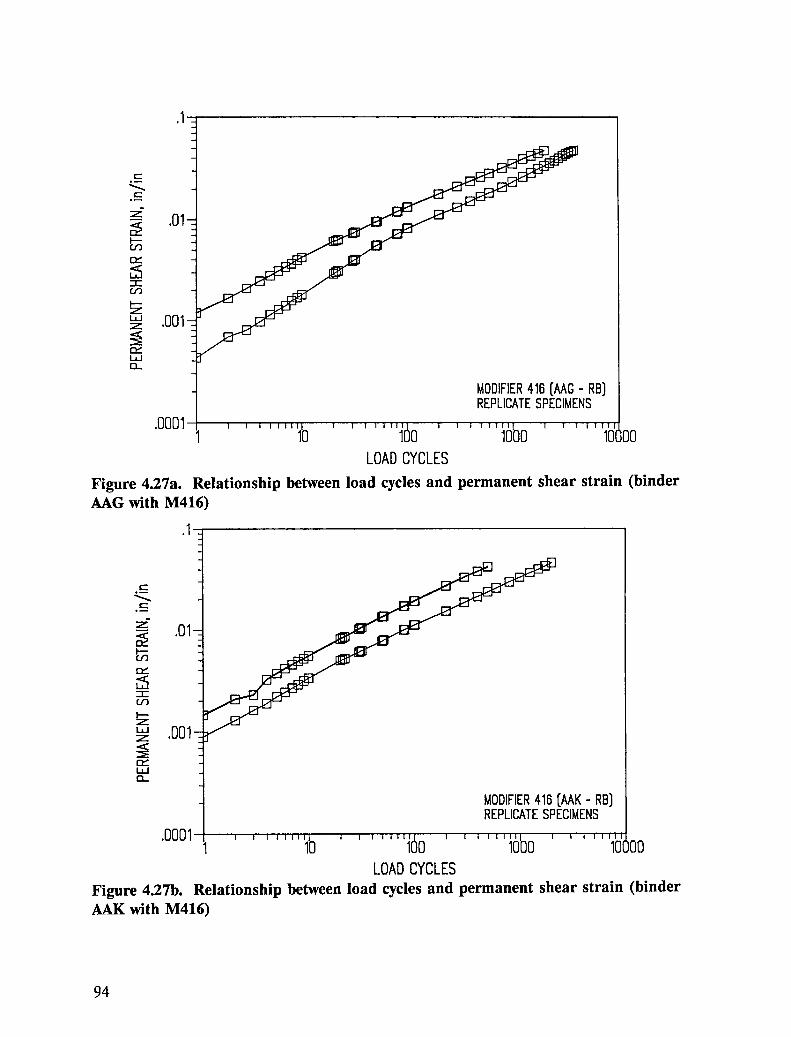
Figure 4.27a Relationship between load cycles and permanent shear strain(binder AAG with M416) ................................. 94
Figure 4.27b Relationship between load cycles and permanent shear strain(binder AAK with M416) ................................. 94
Figure 4.28a Performance of modified mixes over a range of air void contents(modified binder AAG) ................................... 96
Figure 4.28b Performance of modified mixes over a range of air void contents(modified binder AAK) ................................... 96
Figure 4.29 Performance of modified mixes in terms of load cycles to 4 percentstrain ................................................ 97
Figure 4.30 Performance of modified mixes in terms of permanent shear strain .. 97
Figure 4.31a Performance of modified mixes in terms of stiffness (by binder) ..... 101
Figure 4.31b Performance of modified mixes in terms of stiffness (by modifier) ... 101
Figure 4.32a Performance of modified mixes in terms of fatigue life (by binder) ... 102
Figure 4.32b Performance of modified mixes in terms of fatigue life (by modifier) 102
ooo
xln
List of Tables
Table 1.1 SHRP asphalts contracts involved in the validation process ........ 9
Table 2.1 Asphalt binders and aggregates used in validation effort ........... 16
Table 2.2 Summary statistics for fracture temperature .................... 39
Table 2.3 Summary statistics for fracture strength ....................... 40
Table 4.1 Materials used in modified binder evaluation ................... 69
Table 4.2 Air void content of 15 cm x 15 cm (6 in. x 6 in.) specimens ....... 87
Table 4.3 Air void content of 5 cm x 15 cm (2 in. × 6 in.) specimens ........ 88
Table 4.5 Features of modified asphalt mix experiment ................... 98
Table 4.6 Average values for stiffness, fatigue life (at 500 #in.fin.), andcumulative dissipated energy from modified asphalt mix experiment .. 100
XV
Abstract
This report summarizes the two-stage validation of the proposed binder and mixspecifications and tests. Stage 1 addresses the validation of the specifications and tests withlaboratory data; Stage 2, with field performance data. The report is divided into fourchapters, the first of which outlines the validation process. Chapters 2 and 3 are devoted toStage 1 and 2 validation, respectively, and include a comprehensive discussion of thelaboratory testing undertaken to evaluate asphalt concrete performance in terms of permanentdeformation, fatigue cracking and low-temperature cracking. Chapter 4 addresses thevalidation testing conducted using modified materials.
Executive Summary
A critical element of the Strategic Highway Research Program (SHRP) Asphalt Program wasthe validation of the proposed binder and mix tests and specifications using both laboratoryand field data. SHRP planned the validation as a three-stage process. The first two stageswere completed within the 5-year program life, and the final stage in the post-SHRP era. Theinitial two-stage process was a coordinated effort among researchers at Pennsylvania StateUniversity, Texas Transportation Institute, the University of California at Berkeley andOregon State University. The post-SHRP validation will be accomplished primarily throughthe Federal Highway Administration's (FHWA) Special Pavement Studies (SPS-9). The SPS-9 effort is an extension of SHRP's Long Term Pavement Performance Program (LTPP), andinvolves state participation in the design and construction of controlled test sections based onSHRP binder and mix tests and specifications. Sections constructed as part of the SPS-9program will be monitored for 15 years to allow a comparison between predicted and actualperformance.
The purpose of the stage 1 validation was to confirm that variation in binder propertiesproduce meaningful changes in mix performance as measured by laboratory tests.Researchers at the University of California at Berkeley and Oregon State Universityaccomplished this by using simulative laboratory tests ("torture tests") such as wheel-trackingdevices, thermal stress restrained specimen and flexural beam tests, specifically designedaccelerated performance tests and accelerated load facilities.
The stage 2 validation established the degree of correlation between binder and mix propertiesand field performance. Additionally, the stage 2 validation provided experimental resultsneeded to set specification limits for the binder and mix properties selected to controlpavement performance. The stage 2 validation was conducted by researchers at TexasTransportation Institute and Pennsylvania State University and relied almost exclusively onsampling and testing of LTPP General Pavement Studies (GPS) sections.
All materials used in the stage 1 validation effort were obtained from the SHRP MaterialsReference Library (MRL). From eight to 16 asphalt binders were employed for the variousstudies. The asphalts selected are representative of materials currently used in the UnitedStates and produced from crude-oil sources around the world. Two to four aggregates wereused in the various studies.
Laboratory compacted specimens were evaluated to determine the binder's influence onpermanent deformation, fatigue cracking and low-temperature cracking. The relationshipbetween the binder specification property, G'sin _5,and fatigue life is very strong. Overall, itwas concluded that binder properties play a critical role in the fatigue response of asphalt-aggregate mixes; but air void content and aggregate characteristics can also significantlyaffect fatigue response. Results from both wheel track and shear tests indicate that therelationship between the binder specification property, G*/sin 8, and mix performance is weakbecause of the dominant effect of the aggregate on the permanent deformation response.When aggregate characteristics and/or compaction conditions are expected to result in a mixthat is susceptible to permanent deformation, selection of an asphalt that can overcome thesedeficiencies will be important. The value of G*/sin 8 may be used screen binders that willprovide inferior performance in such cases. Thermal stress restrained specimens tests(TSRST) indicate that the influence of the binder on low-temperature cracking mixperformance is critical. Fracture temperature of the mix was highly correlated to specificationproperties of temperature at limiting stiffness, m-value and the ultimate strain at failure. Insummary, the stage 1 validation findings indicate the binder's influence on asphalt concretemixes varies with distress. In order of decreasing influence, the binder's effect onperformance is as follows: low-temperature cracking, fatigue cracking and permanentdeformation.
The key objective of the stage 2 validation was to validate the selected binder and mixproperties with field performance data. Ideally, this would have required a widespreadgeographic distribution of sites to encompass a range of climatic zones and data from well-documented, in-service pavement sections. Although data from several field studies wereavailable, the preponderance of the data was generated from the LTPP's GPS sites. Theexperimental design included one for the load-related distresses (rutting and fatigue cracking)and one for the non-load-related distress (low-temperature cracking). Each included pavementsections located in different climatic zones with different types and severity of distress. Thetotal number of pavement sections in the overall experiment was 72, with 48 in the load-related portion and 24 in the non-load-related portion. The validation program includedextensive sampling and testing of field cores and extracted binders, as well as nondestructivetesting data.
Test results from the load-related sections show no clear relationships between binder
properties and either rutting or fatigue cracking. This lack of clear trends may reflect theeffect of mix design, construction, climate or any combinations of these factors. Furthermore,it underscores the fact that the binder specification cannot be used in isolation to increase the
probability of enhanced pavement performance. Test results from the non-load-relatedsections indicate that the binder properties included in the specification (stiffness (S) andslope (m)) are reasonable parameters for controlling thermal cracking, and that the 6°Ctemperature range used to define different binder grades allows for a reasonably accurateevaluation of performance. It was also concluded, however, that thermal cracking of aparticular binder is mix-dependent, i.e., mix performance is not controlled solely by the binderproperties.
4
Although the binder and mix specifications and tests are appropriate for both unmodified andmodified materials, the validation testing undertaken with modified materials was limited inscope. The materials used were drawn from the following general categories of modifiers:polymers such as styrene butadiene (SBS), styrene butadiene rubber (SBR), ethylene vinylacetate (EVA); reclaimed rubber, extenders, oxidants, antioxidants, mineral fillers, andantistripping agents.
To determine the suitability of the binder tests and specifications, 11 modifiers and 5 asphaltswere included in the experiment design. The modified materials were selected based on thecollective knowledge and opinions of the expert task group (ETG), SHRP and A-001 staff.The performance data were drawn primarily from laboratory test data, not field performancedata, such that any influences made with respect to field performance are preliminary at best.
It was observed that all the binder tests could accommodate the range of modified bindersevaluated. There were no reported difficulties regarding specimen preparation or testing.However, there was no clear correspondence between the material properties of the modifiedbinders and performance as measured by the dynamic shear and bending beam rheometersand the direct tension device.
Validation testing with modified mixes was limited to that associated with permanentdeformation and fatigue cracking. For permanent deformation, three asphalts, two aggregatesand four modifiers were considered. Specimens were compacted over a range of air voidcontents and tested in the simple shear device. As expected, the performance of the modifiersis dependent upon the base asphalt. It was observed, however, the performance ranking ofthe modifiers, despite the difference in void content, was nearly identical to that hypothesizedby the ETG, whose members were instrumental in the selection of modifiers used in the
validation testing. The fatigue experimental design included three asphalts, one aggregate andthree modifiers. Beam specimens were tested in flexure (controlled-strain). Though limitedin extent, the results suggest that both binder type and modifier type substantially affectflexural stiffness and fatigue life.
1
Validation Process
A critical element of the Strategic Highway Research Program (SHRP) Asphalt Program wasthe validation of the proposed binder and mix tests using both laboratory and field data. Interms of the performance-based specifications, validation is defined as the verification of
relationships between binder and asphalt-aggregate mix properties and pavement performancethrough the correlation of those properties with measured characteristics of in-servicepavements.
SHRP planned the validation as a three-stage process: The first two stages were to becompleted within the 5-year program life, and the final stage in the post-SHRP era (TRB,1986). The initial two-stage process was a coordinated effort between SHRP contracts
A-003A and A-005, as illustrated in Figure 1.1. A brief description of the major contractsof the SHRP asphalt program is found in Table 1.1. The work done by the A-003A and A-005 contractors--and discussed in Chapters 2 and 3, respectively--was focused primarily onunmodified materials (FRB, 1986). Validation testing of modified materials, the focus of theA-004 contract, is addressed in Chapter 4. The post-SHRP validation will be accomplishedunder the auspices of the Federal Highway Administration (FHWA) via two mechanisms:the Accelerated Loading Facility (ALF) at the Turner-Fairbank Highway Research Center;and Special Pavement Studies, SPS-9. The SPS-9 effort, an extension of SHRP's Long TermPavement Performance Program (LTPP), involves state participation in the design andconstruction of controlled test sections based on SHRP binder and mix tests and
specifications. In accordance with a statistically designed sampling plan and testing schedule,SPS-9 considers the interaction of material properties, traffic, structural design, andenvironment to estimate the relative influence of key factors on pavement performance. Thesections will be monitored for 15 years to allow a comparison between predicted and actualperformance.
1.1 Stage 1 Validation
The purpose of the stage 1 validation was to confirm that variation in binder propertiesselected for specification yielded physically reasonable, meaningful changes in mixperformance as measured by laboratory tests. SHRP contract A-003A accomplished this by
7
A-002A/A-003B HYPOTHESIS ]
Composition r" Composition Physical Property
I iSTAGE 1 VALIDATION-A-003A
_-_ c-- o._ _ .£-6
c _c
_ _ o_
Composition Physical Property
STAGE 2 VAUDATION-A-005A
Composition Physical Property
Figure 1.1. The two-step validation process using accelerated performance tests andfield performance data
8
Table 1.1. SHRP asphalt contracts involved in the validation process
A-002A Binder characteristics and evaluation
A-003A Performance related testing and measuring of asphalt-aggregate mixes
A-003B Fundamental properties of asphalt-aggregate interactionsincluding adhesion and absorption
A-005 Validation and performance prediction models
the use of simulative laboratory tests ("torture tests") with wheel-tracking devices, thermalstress restrained specimen and flexural beam tests, specifically designed acceleratedperformance tests, and accelerated load facilities.
1.2 Stage 2 Validation
The stage 2 validation established the degree of correlation between binder and mix propertiesand field performance. Additionally, the stage 2 validation provided experimental resultsneeded to set specification limits for the binder and mix properties selected to controlpavement performance. The stage 2 validation was conducted by SHRP contract A-005 andrelied almost exclusively on sampling and testing of LTPP General Pavement Studies (GPS)sections (Lytton et al, 1993). The GPS sections are in-service pavements that wereconstructed in the late 1970s and early 1980s. The two approaches used in the stage 2validation are shown schematically in Figure 1.2.
Ideally, the field validation process would provide data from which specification propertiesand limits could be established directly. As shown in Figure 1.3, there were three key steps:1) the identification of field sections with a broad range of compositional and physicalproperties as well as observed distress; 2) measurement of selected binder and mix propertiesand comparison to observed pavement distress; and 3) determination of correlation betweenbinder and mix properties and observed pavement distress. The advantage of this empiricalmethod was that it would demonstrate clearly that a particular binder or mix property directlyaffected field performance as measured by the selected laboratory test. Although eminentlypractical and dictated by time and budgetary constraints, this method presented aproblem--i.e., the inevitable uncertainties associated with the uncontrolled nature of the fieldpavements used in the analysis. The analysis, as evidenced by typical results shown inChapter 3, was imprecise due to lack of experimental control of key variables that affectpavement performance, e.g., traffic, climate, pavement geometry, subgrade, drainage,construction quality control, and maintenance. Since the laboratory-measured parameterswere not highly correlated with the observed distress, one might attribute the lack ofcorrelation to the fact that 1) the selected material property was not related to performance, or2) that the material property was related to performance, but factors such as traffic,environment, pavement geometry, and subbase/subgrade support also affected theperformance. Therefore, to provide incontrovertible proof that the selected material property
9
lO
_o_o\
o_, _ °_-o._ ..°m_
0
N
11
was related to the observed distress or performance, the effect had to be isolated from allother variables that affect overall performance. Because of the limited size of the data set,normalizing the data to identify the relative contribution of the other variables limited theeffectiveness of the empirical approach to validation.
To address the shortcomings of the empirical validation approach, the A-005 contractorproceeded in parallel with a more complex mechanistic method of field validation. In thisapproach, material relationships were used in mechanistic models to predict distress, whereasthe empirical approach attempts a simple correlation between material properties andobserved distress. As in the empirical method, field cores were taken from distressedpavements and subjected to a series of laboratory binder and mix tests to measure specificproperties that were identified by the A-002A and A-003A contractors as related to aparticular distress. With this approach, generation of material properties is the result of aniterative solution, thus requiring initial estimates of the parameters. In cases where thelaboratory-determined parameters did not match those generated by the mechanistic models,the model coefficients were adjusted iteratively until the predicted properties matched themeasured properties within acceptable limits.
The obvious advantage of this method is that it provides a mechanism to normalize andcalibrate performance data from real-world, uncontrolled field sections to isolate the effect ofmaterial properties on performance from other factors. Moreover, this approach permits areasonable extrapolation of the performance prediction capabilities of the mechanistic modelsbeyond the limits of the experimental data upon which it was based.
12
2
Stage 1 Validation
The approach to the validation effort and individual contract responsibilities are shown inFigure 2.1. Binder properties and tests were validated in parallel using both laboratory testsand field performance data by the A-003A and A-005 contractors, respectively. A similarapproach was used for validation of the mix properties/tests. Both laboratory and fieldvalidation efforts are reviewed in the following sections.
This discussion summarizes the validation of the binder tests and properties as they relate tothe performance of asphalt-aggregate mixes. Specifically, it addresses the validation of thebinder properties proposed by the A-002A contractor to predict asphalt-aggregate mixperformance in terms of fatigue cracking, permanent deformation, and low-temperaturecracking. A comprehensive discussion of the stage 1 validation may be found elsewhere(SHRP, 1994).
2.1 Binder Tests
The following tests have been selected to characterize the fundamental properties of thebinder:
1) Dynamic Shear Rheometer. This test is used to measure the rheologicalproperties of the binder in terms of dynamic shear modulus (stiffness), G*, andphase angle, _5. In the SHRP binder specification, the parameter G'sin 8 relatesto fatigue cracking, and G*/sin 8 relates to permanent deformation.
2) Bending Beam Rheometer. This test is used to measure the creep stiffness, S,of the asphalt at low temperatures and the slope of the creep stiffness, m,versus loading time curve. In the SHRP binder specification, both of thesevalues relate to low-temperature cracking, and m also is related to fatiguecracking.
13
p_
_ _ o_
0
c_pm_
14
3) Direct Tension Test. This test is used to measure the low-temperature failureproperties of the binder. The tensile strain at failure indicates the performanceof mixes in cold environments.
2.2 Experimental Design
All materials used in the validation effort were obtained from the SHRP Materials Reference
Library (MRL). From eight to 16 asphalt binders were employed for the various studies, theproperties of which are reported elsewhere (Anderson et al, 1994). The asphalts selected arerepresentative of materials currently used in the United States and produced from crude-oilsources around the world. Two to four aggregates were used in the various studies. Two
aggregates were employed for fatigue, permanent deformation, and thermal cracking studies.For fatigue and thermal cracking, aggregate characteristics are less significant than theasphalt properties. For permanent deformation, time and material constraints precluded thetesting of more than two aggregates despite of the universally recognized effect of aggregateon mix resistance to rutting. Four aggregates were used for the aging and water-sensitivitystudies because of the aggregate's dominant effect. The MRL binders and aggregates used inthe validation effort are shown in Table 2.1.
2.3 Fatigue
2.3.1 Flexural Fatigue
For fatigue, combinations of eight asphalts and two aggregates were tested using a flexuralbeam test device developed at the University of California at Berkeley (UCB) (Figure 2.2).All tests were conducted on prismatic specimens 5 cm x 6.25 cmx 37.5 cm (2 in. x 2.5in. × 15 in.) in the controlled strain mode at 20°C (68°F) using a sinusoidal loading at afrequency of 10 Hz.
All asphalt-aggregate mixes were prepared at a fixed asphalt content near the optimumdetermined by the California Department of Transportation (Caltrans) mix design procedure(ASTM D1560, D1561). Mixes were prepared by rolling wheel compaction to producespecimens with target air void contents of 4 and 7 percent.
A full factorial experiment was designed to test all main effects and two-factor interactions.
The factorial matrix consisted of 8 asphalts, 2 aggregates, 2 air void levels, and 2 strainlevels, resulting in a total of 64 cells. Each cell had two replicates to allow for estimation ofexperimental error, resulting in a total of 128 flexural fatigue tests. The factorial experimentis summarized below:
15
Table 2.1. Asphalt binders and aggregates used in validation effort
Asphalts
MRL Code Grade
AAA- 1 150/200
AAB-1 AC-10
AAC-1 AC-8
AAD-1 AR-4000
AAF-1 AC-20
AAG-1 AR-4000
AAK- 1 AC-30
AAL- I 150/200
AAM- 1 AC-20
AAV AC-5
AAW AC -20
AAX AC-20
AAZ AC-20
ABA AC-20
ABC AC-20
ABD AR-4000
Aggregates
MRL Code Characteristics
RC Limestone, high absorption
RD Limestone, low absorption fully crushed quarry rock
Response variables included a) initial flexural stiffness measured at the 50th load cycle; b)fatigue life in terms of the number of load cycles corresponding to a 50 percent reduction inflexural stiffness; and, total dissipated energy, i.e., the summation of dissipated energy percycle until a 50 percent reduction in flexural stiffness occurs.
Binder properties provided by A-002A included complex shear modulus (G*), phase angle(_i), storage modulus (G', which is equal to G'cos 8), loss modulus (G", which is equal toG sln/5), and loss tangent (tan 8, which is equal to G"/G') (Anderson et al, 1994).
G'sin _ includes the viscous component of asphalt binder stiffness. The A-002A contractorhypothesized that G'sin 6 relates to the accumulation of dissipated energy during repetitiveloading. Therefore, it also should relate to the dissipated energy parameter measured inasphalt-aggregate mixes by the flexural fatigue test. Both parameters include terms forstiffness and phase angle.
Dissipated energy for a single load cycle in the flexural beam fatigue test is equal to2 *"
-a-Ei Si sin _bi. It should be noted that the phase angles _ and _bi are equal; however, fornotational purposes, 8 is used for the phase angle of the binder and thi is used for the phaseangle of the mix.
A-002A binder properties are based on thin film oven test (TFOT)-aged materials to simulateshort-term aging during construction. The binders used in this study were aged and theproperties calculated for conditions different from those required in the SHRP binderspecification for fatigue cracking evaluation. This was done to represent more closely theproperties of the binder in the asphalt-aggregate mixes tested in the fatigue validation effort.The specification calls for binders to be aged in the pressure aging vessel (PAV), before firsttesting to simulate long-term aging effects, and to test binder specimens at a loadingfrequency of 10 radians per second (rad/s). Asphalt-aggregate mixes were subjected to short-term aging (4 hours at 135°C [275°F]) but not long-term aging, and were tested at a loadingfrequency of 10 Hz.
Despite this minor modification from the binder aging and testing protocols, there isexcellent correlation between G'sin 6 after PAV aging and the value of G'sin _ after TFOTaging, as seen in Figure 2.3. Thus, it is expected that the conclusions drawn from this studywould not change significantly if asphalt binder properties had been determined in accordancewith the A-002A testing protocol. Furthermore, if asphalt binder properties resulting fromlong-term binder aging in the PAV accurately represent those in mixes subjected to long-termaging, then the conclusions reported herein regarding fatigue relationships will probably hoId
18
20000
o_ R2__ = O.g6
o_15000r-_L:J
,, []
o_10000Wr-_
znm
LL.0•o 5000-
. BINDERTESTINGAT20°C,10rod/.:
0 50'00 I0_00 15_00 2O(I00
G*SIN8 OFMIXAFTERTFOT,kP0Figure 2.3. Relationship between G'sin _ after TFOT and PAV
for mixes subjectedto long-term aging (except for possible asphalt-aggregate interactioneffects on aging).
Flexural stiffness, fatigue life, and total dissipated energy were the response variablesmeasured in the flexural fatigue tests and used in the analysis herein. Flexural stiffness is animportant parameter in that it affects the strain on an asphalt concrete layer when subjectedto a load. Although flexural stiffness was measured throughout the test, only the "initial"flexural stiffness is reported. This initial stiffness was measured at the fiftieth load cycle toallow the specimen to become seated in the test equipment (SHRP, 1994).
For purposes of this study, fatigue life was defined as the number of load cyclescorresponding to a reduction in flexural stiffness of 50 percent of the initial flexural stiffness.
Total dissipated energy also was measured, because research reported by Europeaninvestigators has indicated it is related to the fatigue response of asphalt-aggregate mixes(SHRP, 1994). In addition, the research has suggested that dissipated energy is independentof the testing mode (i.e., controlled-strain versus controlled-stress) and frequency of loading(thus allowing fatigue testing to be completed more quickly). Total dissipated energy is thecumulative sum of the dissipated energy per load cycle upon reaching the fatigue life.
Since asphalt source significantly affected fatigue response, it was expected that additionalanalyses would find relationships between asphalt binder properties and asphalt-aggregate mixfatigue response. But since aggregate and air void characteristics also significantlyinfluenced the fatigue response of asphalt-aggregate mixes, it was expected that the effect of
19
asphalt properties might be masked somewhat by these other factors. Because of thesignificance of the interactions between asphalt source, aggregate source, and air void level,the relationships between binder properties and mixture fatigue response were evaluatedseparately for each aggregate source and air void level. Flexural strain level did not interactwith any of the other factors in its effect on mixture fatigue response. Therefore, flexuralstiffness, fatigue life, and dissipated energy results were averaged across strain level tosimplify subsequent analyses (SHRP, 1994). Typical results are shown in Figures 2.4, 2.5,and 2.6.
Figure 2.4 indicates that theflexural stiffness of mixtures is strongly related to the. a_ . .
recommended binder property, G sxn _, as Illustrated by the R2 value of 0.88. As the binder
stiffness increases, whether it is the result of an increase in the stor_a_e modulus (G'), theloss modulus (G'sin 6, or G"), or a combination of both moduli (G), the mix flexuralstiffness also increases. Figure 2.5 suggests an inverse relationship between binder stiffnessand mix fatigue life: As binder stiffness increases, fatigue life decreases. Figure 2.6 showsthe relationship between total dissipated * "energy and G sm _. The trend of the relationship isthe same as that observed for fatigue life, but the overall relationship is not as strong,suggesting that prediction of dissipated energy based on G'sin 6 is not as reliable as that ofstiffness and fatigue life. Though not shown here, the comprehensive statistical analysisrevealed that comparisons of flexural stiffness, fatigue life, or dissipated energy to all binder(G) propert:es (G sxn _, G , G ) were equally strong (SHRP, 1994).
2.3.2 Elastic Layer Theory
Asphalt binder properties were compared with fatigue life estimates for "hypothetical"pavements constructed with various asphalts. Fatigue life estimates were made for twohypothetical structural sections by calculating the maximum principal tensile strain (using anelastic layer analysis program) at the bottom of the asphalt concrete layer, and thencalculating the corresponding fatigue life from the tensile strain using the relationshipbetween fatigue life and strain for a given mix. The strain calculated by ELSYM5 for thehypothetical pavement was entered into the equation shown below, and the correspondingfatigue life was predicted.
In general, the relationship between G'sin 6 and predicted pavement fatigue life was muchweaker than that observed with the lab testing, as linear regression between G'sin _ andpredicted pavement fatigue life produced coefficients of determination (R2) ranging from 0.21to 0.38. More important, the direction of the trend is opposite to that observed in the
20
10000
R2= 0.88 []D
o 8000 []o_
u'f
z 8000
_ B-- 4000
-, Si,i_Ju_ 2000
0 5o'o0 I0_00 15_00 2oc,ooG*SIN8, kPa
Figure 2.4. Relationship between G'sin _ and flexural stiffness
7
R2= 0.88
i,io:: 8_J
I, rn I-I0
5i,i.=_Io>-
(..0o 4
5 50'00 10_00 151_00 201)00
G*SIN8,kPa
Figure 2.5. Relationship between G'sin _ and cycles to failure
21
B0
R2 = 0.52Oa. 50
>2 [] []"_ 40u.J [] []Z
i,i [] [],,, 30t---
20-
._I
100I..-- [] []
0 _ Ib I 20
G*SIN8, MPaFigure 2.6. Relationship between G'sin _ and total dissipated energy
laboratory flexural fatigue analysis: In this analysis, predicted fatigue life generallyincreased as binder stiffness increased. It should be noted that this analysis was based onasphalt sections 15 to 25 cm (6 to 10 in.) thick and it indicates that with increasing sectionthickness and stiffness, both controlled-strain testing and controlled stress-testing yield thesame results. Furthermore, controlled-strain testing and analysis of sections less than 3 in.thick would yield, as expected, a directly proportional relationship between G'sin _ andfatigue life.
A comparison between the SHRP binder specification for G'sin _ related to fatigue crackingand the pavement fatigue life predicted from elastic layer theory is difficult because of the
• • _ o • • •
reversed relatxonshlp between G sm 6 and predicted pavement fatigue hfe. If thisrelationship is confirmed in future studies, the binder specification limit will need to bemodified. The results of this study still indicate that asphalt binder properties are importantin evaluating fatigue cracking. But the importance of considering the influence of pavementstructure effects also is demonstrated.
2.3.3 Conclusions
In summary, the conclusions with respect to the A-002A binder tests/properties for fatigueare:
1) G'sin 8, G*, and G' all result in relationships of equivalent strength with mixfatigue response. Hence, one may conclude that the effect of the sin _ term of
22
specification. The effect of sin _5,however, may still be important for modifiedasphalts.
2) The relationships between the binder specification property, G'sin _i, and mixflexural stiffness and fatigue life were very strong. The relationship withdissipated energy was significantly weaker.
3) In the prediction of fatigue cracking in pavement structures, it appears thatasphalt binder properties are again important, but pavement structure effectsmay be equally or more important. In fact, pavement structure effects mayinfluence fatigue cracking to the extent that the relationship between G'sin 8and pavement fatigue life may be completely reversed as the thickness of theasphalt concrete layer changes. It is recognized that the study performed byA-003A to evaluate these effects has some limitations. Nevertheless, itidentifies an issue that is worthy of further evaluation. If further studyconfirms that the direction of the relationship between G'sin 8 and pavementfatigue life is dependent on the pavement structure, the binder specification willneed to include provisions for pavement structure effects.
4) Overall, asphalt binder properties play a critical role in the fatigue response ofasphalt-aggregate mixes. But other mix characteristics, such as air void levelsand aggregate characteristics, can also significantly affect fatigue response.Therefore, asphalt binder properties alone may not provide sufficiently reliableestimates of fatigue cracking in pavements. In critical design situations(unusual traffic volume or loading conditions, modified materials), asphalt-aggregate mix fatigue testing should be conducted to increase the reliability ofestimates of pavement fatigue cracking.
2.4 Permanent Deformation
This section summarizes research conducted to validate the relationships between asphaltbinder properties and the permanent deformation response of asphalt-aggregate mixes. Therelationship between binder properties and permanent deformation response of asphalt-aggregate mixes was evaluated using the wheel-tracking device at the University ofNottingham (England) and a shear device developed at UCB as part of the SHRP-sponsoredresearch.
2.4.1 Wheel-Tracking Tests
In this study, a wheel-tracking device was used to simulate the stress conditions caused by adynamic wheel load on the pavement surface. An experiment was designed to test all mainfactors and two-factor interactions. The factorial matrix consisted of 16 asphalts,2 aggregates, and 2 air void levels, resulting in a total of 64 cells. All mixes were prepared
23
at a fixed asphalt content near the optimum determined by the Caltrans mix design procedure(ASTM D1560, D1561). Mixes were compacted by the rolling wheel compaction method toproduce specimens with target air void contents of 4 and 7 percent. The factorial experimentis summarized below:
Response variables included the normalized rutting rate (mm/MPa/hr--linear regressed rutrate between 2000 and 4000 passes divided by contact stress) and total rut depth (mm--rutdepth after 5000 passes).
Binder properties provided by the A-002A contractor were measured from dynamicmechanical analysis (DMA) and included complex shear modulus (G*), phase angle (_),storage modulus (G'), loss modulus (G"), and loss tangent (tan _).
The SHRP binder specification requires the value of G*/sin _ for any original binder toexceed 2.2 kPa when tested at 10 rad/s at the specified temperature after having been agedaccording to the rolling thin film oven test (RTFOT). The implication is that asphalt binderswith G*/sin _ values exceeding this limit should contribute acceptable resistance to permanentdeformation in asphalt-aggregate mixes, while binders with lower G*/sin _ values maycontribute to rutting.
Asphalt binders and asphalt-aggregate mixes used in this study were subjected to similaraging and testing conditions. Asphalt binders were aged according to the RTFOT to simulatethe short-term aging effects of the construction process. Asphalt-aggregate mixes were alsosubjected to short-term aging; after mixing, they were placed in an oven at 135°C (275°F)for 4 hours. Asphalt binder properties were calculated for and mixes were tested at atemperature of 40°C (104°F). Binder properties were calculated at a loading frequency of10 rad/S, or 1.6 Hz. Mixes were tested at a loading frequency of 20 rad/s, or 3.2 Hz.Considering that binder properties are logarithmic functions of loading time, the difference inloading rates is not substantial.
Wheel-tracking tests were performed by SWK Pavement Engineering Ltd. at the Universityof Nottingham. A wheel fitted with a solid rubber tire passes over the top of a 200 mm(8 in.) diameter cylindrical core specimen at a frequency of approximately 3 Hz, or 20 rad/s.These tests were conducted at a temperature of 40°C (104°F), and each test was run for aduration of 5000 load passes (approximately 2 hours). Tests were performed with an appliedload of approximately 620 N (140 lb). The contact area of the tire measured 850 mm2 (1.32in2), which gives a corresponding contact stress of approximately 730 kPa (105 lb/in2).
24
Two rutting parameters were measured from the wheel-track test data: normalized rut rate
and total rut depth. The normalized rut rate is the rate of increase in rut depth (mm/hr)between 2000 and 4000 load passes divided by the contact stress of the wheel. The total rutdepth is the average rut depth (mm) at the end of the test, i.e., after 5000 passes. SWK staffconsidered rut rate a more reliable indicator of permanent deformation performance becauseit is less likely to be affected by "initial start-up errors" and, perhaps, additional compactionof the specimen during the initial stages of the test.
Since it was hypothesized that asphalt source would significantly affect rutting response,analysis of variance (ANOVA) was performed to determine the influence of the various
factors. The ANOVA indicated each of the factors and interactions accounting for thevariation of rutting response by the following approximate proportions:
Since the aggregate and air void characteristics appeared to influence the rutting response, itwas expected that the effect of asphalt properties might be masked somewhat by these otherinfluences. In view of the aggregate and air void effects, as well as the interaction betweenasphalt source and aggregate source, the relationships between binder properties and mixrutting response were evaluated separately for each aggregate source and air void level.Complete statistical analyses were performed (SHRP, 1994). Typical results are shown inFigure 2.7.
The results indicate that a poor relationship exists between the binder property, G*/sin 6, andmix rutting. As engineering logic would suggest, the value of G*/sin 6 increases as rut rateand rut depth decrease. Comprehensive statistical analysis indicated that none of the binder
• _ l l! " * . .
properties (G, G, or G ) was highly correlated with rut depth or rut rate. In addition,substantial scatter in the data suggests that it would be difficult to predict rutting based solelyon the binder properties. As illustrated by Figure 2.7 only 18 to 30 percent of the variationin rutting response is explained by the parameter G*/sin 6. Thus, most of the variation inrutting response probably can be attributed to other variables such as aggregatecharacteristics or the testing process.
Although all the binders used in the wheel tracking experiment exceed the minimum• 2 * •
specification value of 2.2 kPa (0.3 lb/m ) for G/sin _ (Harrigan et al, 1994), Figure 2.7indicates that at least one of the asphalts, when combined with aggregate RH, produced a
25
E 5EE [] R2 --0.30
LLJO0 4-f.f3
m
o []oo 3 []
n.- 1 [],..._J,<
[AGGREGATERH,¢_VOIDS)
0 5'0 I[_0 I_0 2[)0 2_i0
G*/SIN8,kPa
Figure 2.7a. Relationship between G*/sin _ and total rut depth
2.0
_- R2= 0.1B [AGGREGATERH,4% VOIDS]¢-
I:}_
1.5 []EE
I.--
n_ 1.0 []
N_ 0.5
< [] [] [] EY_rwO [] []Z
0.0 !5'0 IdO IgO 2_0 2_0
G*/SIN8,kPaFigure 2.7b. Relationship between G*lsin _ and normalized rut rate
26
relatively high rut depth. It is uncertain that this level of rut depth measured in the wheel-tracking test would occur in a pavement built with that particular asphalt, nor does it implythat the specification limit is questionable. Rather, it underscores the need for mixevaluation in addition to the binder testing.
The results of this study might suggest that G*/sin _ is not a reliable predictor of potentialrutting. Aggregate and air void characteristics appear to have more influence on the ruttingresponse of asphalt-aggregate mixes than does the asphalt binder. However, severalconsiderations temper this conclusion:
1) SWK staff acknowledged that the repeatability of wheel-tracking tests can bepoor--i.e., a significant number of replicate tests should be conducted to
obtain a reliable estimate of the rutting rate. A similar wheel-tracking studywas performed on mixes made from two asphalts and two aggregates. Eachcell of the experiment in that study included two replicates, from which testprecision was calculated. The testing error in that study was nearly assignificant as the asphalt effect was in this study. Thus, the relatively low testprecision probably contributed to the low coefficients of determination (R2)when trying to predict rutting response from G*/sin 8.
2) Binder and wheel-tracking tests were conducted at 40°C (104°F). Thistemperature may not be sufficiently high to allow the viscous characteristics ofbinders to affect the mixture rutting response. Note that the SHRP binderspecification does not provide for a climatic region for which binders would betested at 40°C (104°F) for permanent deformation evaluation; the lowest testtemperature is 45°C (l13°F). At higher test temperatures, the binder effectmight be more pronounced.
3) The magnitude of total rut depths for the better-performing mixes wasrelatively small in comparison with the testing error. SWK noted this fact aswell, suggesting that an increase in the contact pressure and load applicationsmay reduce the testing error.
4) While the wheel-tracking test equipment at the University of Nottingham isconsidered useful, it is relatively small. The surface area of the mix specimenis 40,000 mm2 and the contact area of the rubber wheel is 850 mm2 (1.32in2). Yet the aggregate size was typical of that used in conventional pavementmixes. Thus, the dimensional ratios in the wheel-tracking test were not thesame as those that occur in real pavements.
Although not part of the SHRP research effort, other wheel-tracking tests conducted by SWKwith modified mixes yielded more encouraging results with respect to the relationship
between G*/sin _ and permanent deformation. (Bouldin et al, 1994). As shown in Figure 2.8,there was excellent correlation between G/sin 6 and both rut rate and strain accumulationrate.
Figure 2.8a. Relationship between G*lsin _ and rut rate (Shell data)
.1[]
f,n
_- .01-.__u,J
R2 -- 0.g8
.001 , , , , , , , , , , , , , ,50 16o _cDO
(;*/SIN 8, Pa
Figure 2.8b. Relationship between G*Isin _ and strain rate (Shell data)
28
Based on the conflicting data, it is apparent that additional testing with both modified andunmodified mixes is necessary to determine the effect of G*/sin dion permanent deformation.It is recommended that future permanent deformation studies that employ wheel-trackingdevices use higher contact stresses and/or more load repetitions. The precision of wheel-tracking test equipment should be improved to minimize testing error. Fortunately, largerwheel-tracking test equipment is beginning to appear in the United States. These devices willpermit testing of larger slabs of asphalt concrete with boundary conditions representative ofactual pavement structures.
2.4.2 Shear Tests
Binder properties were compared with the permanent deformation response of asphalt-aggregate mix specimens subjected to repetitive simple shear loading under controlledconditions in the laboratory. The hypotheses related to permanent deformation in asphalt-aggregate mixes are as follows:
1) Permanent deformation (rutting) in an asphalt concrete layer is caused by acombination of densification (volume change) and shear deformation resultingfrom the repetitive applications of traffic loads.
2) Permanent deformation is caused primarily by large shear stresses in the upperportions of the asphalt concrete layer.
3) Properties of asphalt (elastic and viscous) and aggregate that contribute topermanent deformation in asphalt-aggregate mixtures can be determined byusing a simple shear test.
Therefore, the selection of the simple shear test is consistent with both A-002A and A-003Ahypotheses regarding permanent deformation. It can measure the elastic (linear andnonlinear) and viscous influences of the binder in the asphalt-aggregate mixture. It also cansimulate the shear stress conditions believed to be the primary cause of permanentdeformation in asphalt concrete pavements.
Specimen conditioning, compaction, and target void contents were as reported in the wheel-tracking validation effort. All shear testing was conducted on cylindrical specimens 152 mm(6 in.) in diameter by 51 mm (2 in.) in height. A full factorial experiment was designed toevaluate all main effects and two-factor interactions. The factorial matrix consisted of
9 asphalts, 3 aggregates, and 2 air void levels, resulting in a total of 36 cells. Each cell hadonly one replicate, for a total of 36 tests for each shear test condition. Thus, a total of 72shear test results were analyzed. Since no replicates were provided, the three-factorinteraction of asphalt source, aggregate source, and air voids was used as an estimate ofexperimental error. The factorial experiment is summarized below:
Aggregate Source RD, RHAir Voids 4 percent, 7 percent (target levels)Replicates i/cellTest Condition constant height (CH) or field state of stress (FS) 1Total No. of Tests 72
The response variables were as follows: load cycles to 2 percent strain, (N2%--number ofshear load cycles at which the asphalt-aggregate mixture specimen exhibits 2 percent
cumulative permanent shear strain) and cumulative permanent shear strain, (_3,p--cumulativepermanent shear strain after a constant number of load cycles).
Half the specimens in this study were tested under a constant height condition (CH), and theother half were tested under afield state of stress (FS) condition. The CH shear test issensitive to elastic and viscous characteristics of the asphalt binder. It also measures theeffect of dilatancy. Dilatancy in this case is the tendency of a mix to change in volume asaggregate particles are forced to slide past each other during shear deformation. The FSshear test incorporated loading conditions thought to represent the state of stress occurring inan asphalt concrete layer near the edge of a truck tire. An instrumented specimen is shownschematically in Figure 2.9.
The CH shear test applied a cyclic (haversine) shear stress of 103 kPa (15 1b/in2) _ 10% tothe specimens. The load pulse duration was 0.1 see with 0.6 sec between load pulses. Inaddition, vertical compressive loads were applied as necessary to maintain the originalspecimen height throughout the test. The magnitude of the vertical compressive load is afunction of the specimen's propensity to dilate under shear loading. Shear strain wascalculated from the difference between displacements measured by two LVDTs (linearlyvariable differential transducer) located _ 1.27 cm (0.5 in.) at mid-height on each side of thespecimen. Each test was scheduled to run for 3600 load cycles. But many were stoppedbefore reaching this number of load cycles if the specimen exhibited 4 percent permanentshear strain or if failure occurred.
The FS shear test simultaneously applied a cyclic shear stress of 173 kPa (25 Ib/in 2) _ 10%and a cyclic compressive axial stress of 345 kPa (50 lb/in 2) _+ 10%, both with load pulsedurations of 0.1 sex: and 0.6 sec between load pulses. In addition, a constant confiningpressure of 138 kPa (20 1b/in2) was applied to the specimen. Each test also was scheduled torun for 3600 load cycles; all but three of the FS tests completed the scheduled 3600 loadcycles.
1Field state of stress (FS) describes the state of stress in which there is a constant ratiobetween the vertical stress and horizontal shear stress, i.e., a/r = constant.
30
SIDE VIEW
Load (to mahztahl constant specimen height)
Reaction _ Platen ](this side fixed to prevent
horizontal movement) ,] _ '_ ,
Accumulated ," I Specimen ,'
Shea_ ":. I . ( I Adhesive
Deformation Platen
Reaction
(this end fixed againstprevent vertical movement)
Figure 2.9. Simple shear test load conditions and instrumented specimen
31
Two shear response parameters were calculated from each of the above shear test conditionsfor comparison with asphalt binder properties:
1) the number of load cycles at which the specimen exhibited 2 percentcumulative permanent shear strain, or N2%; and
2) the cumulative permanent shear strain after a constant number of load cycles,
or _/p.
For CH tests, _'p values at 32 load cycles were used in the following analyses. This wasthe highest number of load cycles that allowed all specimens to be analyzed. Similarly, for
FS tests, _'yp values at 602 load cycles were used.
Although binders and asphalt-aggregate mixes both were tested at a temperature of 60°C(140°F), they were tested at substantially different loading frequencies: Binders were testedat a loading frequency of 10 rad/s (1.6 Hz); and the mixes at 62.8 rad/s (10 Hz). Because ofthe faster loading, it is possible that the binders in the asphalt-aggregate mixes exhibitedmore of their elastic nature and less of their viscous nature than the binders tested alone (i.e.,
in the asphalt binder tests).
The results of an ANOVA model on the shear test data indicated that asphalt source,
aggregate source, and air void level each significantly affect the shear response (N2% and
_,p) of asphalt-aggregate mixtures. The model indicated each of the factors influencingshear response in the following approximate proportions:
Note that the influence of asphalt in the CH shear tests was approximately equal to thatobserved in the FS shear tests. Note the substantial effect of aggregate in the FS shear tests.
Since asphalt source significantly affected rutting response, it was expected that additionalanalyses would show some relationship between asphalt binder properties and asphalt-aggregate mix shear response, especially for data from CH shear tests. But since aggregateand air void characteristics appeared to influence shear response more, it was expected thatthe effect of asphalt properties might be obscured somewhat by these other influences,especially for data from FS shear tests. In light of the aggregate and air void effects, therelationships between binder properties and mix shear response were evaluated separately foreach aggregate source and air void level (SHRP, 1994). Typical results are shown inFigures 2.10 and 2.11.
While there is significant scatter in the data, there does appear to be some relationship. Thestrongest relationships and least data scatter are exhibited for mixes containing RH aggregate
at 7 percent air voids tested under CH test conditions. In Figures 2.10 and 2.1 !_ forexample, the expected relationships between the binder property, G*/sin _ (or G , G', andG") and mix response are observed: As parameter G*/sin6 increases, the number of load
cycles before the specimen exhibits 2 percent permanent shear strain increases (i.e., N2%increases); the amount of permanent shear strain after a given number of load cyclesdecreases (i.e., I_3,_decreases) Although not shown here, graphical analysis of the datap
indicates that the strength of the relationship between G*/sin di (or G*, G', and G") and mixshear response weakens considerably as air voids change from 7 to 4 percent and as theaggregate source changes from RH to RD. Furthermore, it was noted that data resultingfrom CH shear tests generally provide stronger relationships and less data scatter than FSshear test data. The lower correlations from the FS shear test data probably are the result ofthe overwhelming effect of aggregate characteristics; recall the proportional effect determinedby the ANOVA model.
A comparison was made between the SHRP binder specification limit for G*/sin direlated to
permanent deformation and _,p observed in laboratory simple shear testing. As illustrated inFigure 2.11, MRL binder AAV with a G*/sin t5of 1333 Pa (0.2 lb/in 2) (at 60°C [140°F] and10 rad/s) does not meet the minimum specification requirement of 2.2 kPa (0.3 lb/in2),binder AAC (G*/sin 6 = 2674 Pa (0.4 lb/in2)) barely meets the specification. The resultsshown in Figure 2.11 indicate that a minimum of 2.2 kPa (0.3 lb/in 2) is generally a valid
specification requirement. Mixes containing AAV asphalt exhibited the highest values of I;3,pin most cases. For mixes containing RH aggregate and compacted to 4 percent air voids,however, the value of Z,,/_ for AAC was equal to that of AAV, yet AAC meets thespecification (Figure 2.12_. For mixes containing RD aggregate and compacted to 4 percent
air voids (Figure 2.13)_ it was observed that AAB and AAG (G*/sin 6 = 3251 (0.5 lb/in 2)and 4311 Pa (0.6 lb/in ), respectively), while meeting the specification limit, produce higher
values of I33,p than do either AAV or AAC. One cannot be certain that the magnitude of _;_,pin Figure 2. I3 suggests a potential rutting problem in the pavement. This comparison doesdemonstrate, however, the possibility of accepting an asphalt according to the specificationlimit that may result in rutting, or rejecting an asphalt that would provide acceptableperformance.
33
100R2 = 0.52
[]
r_F.--
_4
o
_- 10-m [],._1
0
[AGGREGATERH,7g VOIDS)
1. 25'oo 5o'oo ;56o locooG*/SIN8, P0
Figure 2.10. Relationship between G*/sin _ and load cycles to 2 percent strain
0.05
AAV R2 = 0.58[]t--.
0.04t-
< 0.05I--
-I-ra 0.02I,I
._.1
0
[AGGREGATERH,7_ VOIDS]
.01 25'00 50'00 75'00 10c00G*/SIN8, Po
Figure 2.11. Relationship between G*/sin _ and cumulative shear strain
34
.1
R2 = 0.28t-o-
Eo--
AAV AAC-- [] [].<
_-- [] []
,,, .01-r"
I-'-
o
(AGGREGATERH,4%VOIDS).DO)
25'00 5ObO 75'00 10(O0G*/SIN 8, Pa
Figure 2.12. Relationship between G*/sin _ and cumulative shear strain (aggregate RH,4 percent air voids)
.1
R2 = 0.02{-,.--
¢=.
AAB AAGrv- [] []I--
[]rv- _ F]< AAV []LU .01 []-r-" []
AAC []i,i:>I---.,,=E::3:=E=)(.3
(AGGREGATERD,4%VOIDS].DO1
25'00 50'00 75'00 101OO
G*/SIN 8, Pa
Figure 2.13. Relationship between G*/sin _ and cumulative shear strain (aggregate RD,4 percent air voids)
35
Overall, the results of this study indicate that binder properties can affect the shear responseof asphalt-aggregate mixes. Aggregate characteristics, however, can be equally or moresignificant. Specific findings from this study include the following:
1) Stronger relationships between asphalt binder properties and mix shear
response (N2% or _3'p) were observed for mixes tested under CH conditionsthan for mixes tested under FS conditions. The researchers believe this is the
result of the overwhelming influence of aggregate in the FS shear test. Theconfining pressure in the FS shear test provides stability to the aggregateskeleton of the mix. This minimizes strains in the asphalt binder, reducing theinfluence of the binder properties. The results of the ANOVA support thishypothesis; the influences of binder properties and air void level are lesspronounced in the FS shear test. The CH shear test, however, confinesspecimen deformation in only one direction (i.e., the height of the specimenremains constant). Aggregate particles are allowed to "slide" past each otherduring shear loading, causing larger strains in the asphalt, which highlights theinfluence of the binder.
2) Although the relationships between binder properties and mix shear responsegenerally are weak, it appears that any binder property (G*/sin 6, G*, or G")can be used to estimate mix shear response with the same degree of reliability(poor). Thus, the significance of the sin 8 term in G*/sin 8 is questionable,although it may have more of an effect with modified binders.
3) The strongest relationship between asphalt binder properties and mix shearresponse was observed for mixes containing RH aggregate and 7 percent airvoids. This suggests that when mix characteristics are such that they result inlow interparticle friction, the influence of asphalt binder properties becomesmore significant. Aggregate RD was a quarried product that is 100 percentcrushed; RH was a partially crushed fiver gravel that would be expected toprovide less interparticle friction than RD. This underscores the influence ofaggregate characteristics on permanent deformation.
2.4.3 Conclusions
The results of A-003A's efforts to validate the effect of A-002A's asphalt binder properties
on the permanent deformation response of asphalt-aggregate mixes indicate that the influenceof asphalt is highly dependent on the conditions to which the mix is subjected. ANOVAshowed the effect of asphalt was significant but that its influence was small compared withthat of aggregate, especially when the mix was tested at lower temperatures (e.g., 40°C[104°F]) or was subjected to states of stress that amplified the aggregate influence (e.g., FSshear test).
The correlations between G*/sin 8 and the various measures of permanent deformation
response were generally poor, with the exception of the wheel-tracking data reported by
36
Shell. The weak correlations are partly the result of the dominant effect of aggregatecharacteristics on permanent deformation response. But in cases where interparticle frictionis low (e.g., RH aggregate and 7 percent air voids) and the mix is subjected to harshenvironmental and loading conditions (e.g., 60°C [140°F] and CH shear test), the influenceof the binder becomes more readily apparent. When aggregate characteristics and/orcompaction conditions are expected to result in a mix that is susceptible to permanentdeformation, selection of an asphalt that can overcome these deficiencies will be important.* ,
It appears that the value of G/sin _ may be used to screen binders that will provide inferiorperformance in such cases.
The results of these studies underscore the importance of mix testing, in addition to bindertesting, for evaluation of permanent deformation in pavements. It is recognized that the mixtests used in these validation efforts are only estimates of the permanent deformationresponse that would actually occur in a pavement. Nevertheless, the general conclusionspresented herein are expected to hold when future studies compare binder properties withpermanent deformation response of mixes measured from larger-scale wheel-tracking testsand actual pavement performance.
2.5 Thermal Cracking
The A-002A ranking for resistance to low-temperature cracking is based on the limitingstiffness temperature and the ultimate strain at failure. The limiting stiffness temperature isestimated based on a stiffness value of 200 MPa (29 k/in 2) at a loading time of 2 hours in thebending beam rheometer. The ultimate strain at failure is estimated at -26°C (-15°F) and aloading time of 2 hours in the direct tension test. The experiment design for this task wasdeveloped to relate fundamental properties of asphalt cement suggested by the A-002Acontractor to the low-temperature cracking characteristics of asphalt concrete mixes, asmeasured by the thermal stress restrained specimen test (TSRST).
The experiment design included 14 asphalt cements and two aggregates. Two degrees ofaging and two levels of air void content are employed. The fully replicated factorial designwas developed as follows:
Experiment Design Variable Levels
Asphalt Type 14Aggregate Type 2Degree of Aging 2 (Short, Long)Air Void Content 2 (4 percent, 8 percent)Rate of Cooling 1 (10°C/hr [50°F/hr])Replicates 2No. of tests 224
37
The MRL asphalts and aggregates used in the study are listed below.
As noted above, two aging levels were considered. After mixing, the loose mix wassubjected to short-term oven aging (STOA) for 4 hours at 135°C (275°F). Following short-term oven aging, the mix was compacted. Some of the specimens also were long-term ovenaged (LTOA) for 5 days at 85°C (185°F).
Prismatic specimens 5 cm x 5 cm x 25 cm (2 in. x 2 in. x 10 in.) were prepared using akneading compactor. The TSRST was used to evaluate all mixes (STOA and LTOA).Placed in a stand to ensure proper alignment, specimens were glued to end platens with an
epoxy compound. After the epoxy had cured, the test specimen was cooled to a temperatureof 5°C (41°F) for 1 hour to establish thermal equilibrium before testing. The specimen andend platens were then placed in an environmental cabinet and cooled at a rate of 10°C/hr(50°F/hr) until fracture.
Typical TSRST results are shown in Figure 2.14. From the test results, four parameterswere identified to relate the fundamental properties of asphalt cement and aggregate tothermal cracking characteristics of asphalt concrete mixes. The TSRST results illustrated inFigure 2.14 include fracture temperature, fracture strength, slope of the thermally inducedstress curve, and transition temperature. Only fracture temperature and strength arediscussed here. Of the 224 specimens prepared, 201 were used in analysis, 23 were deemedunacceptable because void contents were not within the acceptable range.
Fracture temperature is defined as the temperature at which fracture occurs and correspondsto the temperature at which the thermal stress induced is maximum. A summary of thefracture temperature data is shown in Table 2.2. Mean values and the coefficients ofvariation of fracture temperature for a specific asphalt type, aggregate type, and degree ofaging may be found elsewhere (SHRP, 1994).
The repeatability of TSRST for fracture temperature is quite good, as the coefficients ofvariation for fracture temperature are typically less than or equal to 10 percent. Asexpected, fracture temperature varies with asphalt type. For mixes with the Re aggregate,fracture temperature ranged from -32.1°C to -18.6°C (-25.8°F to -1.5°F) and from -27.8°Cto -13.6°C (-18.0°F to 7.5°F) for STOA and LTOA specimens, respectively. For specimenswith the Rt/aggregate, fracture temperatures ranged from -32.2"C to -16.3°C (-26.0°F to2.7°F) and from -29.3°C to -13.6°C (-20.7°F to 7.5"F) for STOA and LTOA specimens,respectively.
Fracture strength is defined in terms of the maximum stress. Mean values and thecoefficients of variation of fracture strength for a specific asphalt type, aggregate type, and
degree of aging were determined (SHRP, 1994). A summary of the fracture strength data isshown in Table 2.3.
38
4
FractureStrength
a-3dT
,e dSo9
"_2 Slope = dS/dTFracture Temp.
-o iE i
lE Transition
r- Temp.t-
0 I I _ I I I-35 -3( -25 -20 -15 -10 -5 0
Temperature (°C)
Figure 2.14. Typical TSRST results
Table 2.2. Summary statistics for fracture temperature
Aggregate Degree of Warmest Fracture Coldest Fracture RangeType Aging Temperature (°C) Temperature (°C) (Warm-Cold)
RC STOA -18.6 -32.1 15.4
LTOA -13.6 -27.8 12.9
Difference Minimum Maximum Average(STOA-LTOA) -0.6 -6.5 -3.8
RH STOA -16.3 -32.2 15.7
LTOA -13.6 -29.3 14.8
Difference Minimum Maximum Average(STOA-LTOA) -0.6 -5.5 -2.9
Difference in STOA (°C) Maximum: -3.8(RC-RH) Minimum: 0.9
Average: -1.16
Difference in LTOA (°C) Maximum: -2.0(RC-RH) Minimum: 1.6
Average: -0.42
39
Table 2.3. Summary statistics for fracture strength
Aggregate Degree of Maximum Fracture Minimum Fracture Range
Type Aging Strength (MPa) Strength (MPa) (Maximum-Minimum)
RC STOA 2.922 1.877 1.045
LTOA 2.903 2.109 0.794
Difference Maximum Minimum Average(STOA-LTOA) 0.726 -0.670 0.20
RH STOA 3.512 2.584 0.928
LTOA 3.447 1.983 1.464
Difference Maximum Minimum Average(STOA-LTOA) 0.379 -0.634 -0.02
Difference in STOA (MPa) Maximum: 1.105(RC-RI-I) Minimum: -0.296
Average: 0.467
Difference in LTOA (MPa) Maximum: 0.763
(RC-RH) Minimum: -0.260Average: 0.249
I
The repeatability of TSRST for fracture strength is considered reasonable, as coefficients ofvariation are, with few exceptions, less than 20 percent. The fracture strengths exhibit a
wide range of values, depending on asphalt type.
Although comprehensive statistical analyses were performed to assess the influence of asphalt
type, aggregate type, void content, and degree of aging on the TSRST results, this discussionfocuses on a comparison of the binder specification properties and A-003A mix properties.
The A-003A performance ranking of asphalts and aggregates for resistance to low
temperature cracking of mixtures was compared with the A-002A ranking (Anderson, et al,1994). Also, fracture temperature was related to the A-002A low-temperature index test
results and asphalt cement properties. Linear regression analyses were performed to
correlate fracture temperature to A-002A low-temperature index test results and asphalt
cement properties.
Fracture temperature was compared with the A-002A low-temperature index test results--
specifically, the temperature at limiting stiffness and m-value from the bending beamrheometer test, and the ultimate strain at failure from the direct tension test. Fracture
temperature shows an excellent correlation with the A-002A test results. Figures 2.15 and2.16 show the relationship between fracture temperature and temperature at limiting stiffness
(S(t) =200 MPa (29 k/in 2) at 2 hours) and m-value, respectively. The relationship betweenfracture temperature and ultimate strain at failure is shown in Figure 2.17.
Figure 2.15. Relationship between limiting stiffness and fracture temperature
-10[]AGGREGATERC-R2= 0.87
o AGGREGATERH- R2 = 0.85o -15u.r o
<_ -20
i,i
,,, -25
,'_ -30i,
-35!5 o.ga o.g5 o.io 0.15 0.,_0 0.,_5 o.sa
m- VALUE
Figure 2.16. Relationship between m-value and fracture temperature
41
-10[] AGGREGATERC- R2 = 0.77
o AGGREGATERH- R2 = D.82° -15uS o13E
< -20 oI.a.Io._ []
i,iI--w -25r_ 0 []
_-. []
n.- -30
ULTIMATESTRAINATFAILURE,%Figure 2.17. Relationship between ultimate strain at failure and fracture temperature
2.5.1 Conclusions
Based on the results presented here, the following conclusions are appropriate:
1) Asphalt type, aggregate type, degree of aging, and air void content all have asubstantial effect on the low-temperature cracking characteristics of asphaltconcrete mixtures. The effect of interactions between mix properties isconsidered minor.
2) Asphalt type, degree of aging, air void content, and the interaction betweenasphalt and degree of aging are significant factors for the fracture temperature.Fracture temperature was warmer for long-term-aged mixes. Fracturetemperature is most affected by asphalt type and degree of aging. Air voidcontent and interaction between asphalt type, also affect fracture temperature,though to a much lesser extent.
3) Asphalt type, aggregate type, air void content, and the interaction betweenaggregate and degree of aging are significant factors for fracture strength.Fracture strength is highly influenced by air void content and aggregate type.Fracture strength was greater for mixes with lower air voids compared withthose with higher air voids, and greater for mixtures with RH aggregate thanfor those with RC aggregate. Asphalt type and the interaction between
42
aggregate type and degree of aging have a minor influence on fracturestrength. The effect of degree of aging on fracture strength is inconclusive.
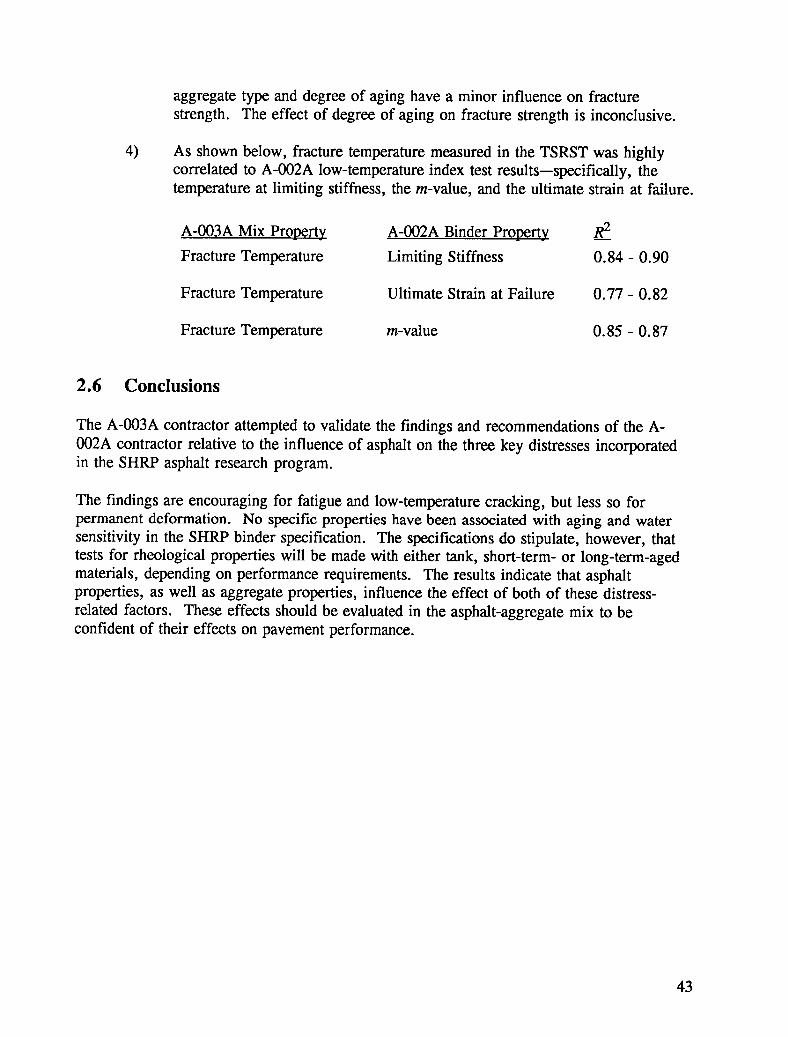
4) As shown below, fracture temperature measured in the TSRST was highlycorrelated to A-002A low-temperature index test results--specifically, thetemperature at limiting stiffness, the m-value, and the ultimate strain at failure.
A-003A Mix Property A-002A Binder Property R2
Fracture Temperature Limiting Stiffness 0.84 - 0.90
Fracture Temperature Ultimate Strain at Failure 0.77 - 0.82
Fracture Temperature m-value 0.85 - 0.87
2.6 Conclusions
The A-003A contractor attempted to validate the findings and recommendations of the A-002A contractor relative to the influence of asphalt on the three key distresses incorporatedin the SHRP asphalt research program.
The findings are encouraging for fatigue and low-temperature cracking, but less so forpermanent deformation. No specific properties have been associated with aging and watersensitivity in the SHRP binder specification. The specifications do stipulate, however, thattests for rheological properties will be made with either tank, short-term- or long-term-agedmaterials, depending on performance requirements. The results indicate that asphaltproperties, as well as aggregate properties, influence the effect of both of these distress-related factors. These effects should be evaluated in the asphalt-aggregate mix to beconfident of their effects on pavement performance.
43
3
Stage 2 Validation
Researchers at the Texas Transportation Institute (TrI) and Pennsylvania State Universitywere charged with the validation of binder and mix tests/properties as they relate to the fieldperformance in terms of fatigue cracking, permanent deformation, and low- temperaturecracking. This stage 2 validation is described in Development and Validation ofPerformance Prediction Models and specifications for Asphalt Binders and Paving Mixes(Lytton et al, 1994).
3.1 Limitations of the Stage 2 Validation
The term "validation" does not mean verification of the specifications by means ofincontrovertible evidence. To do so would have required more time and a more thoroughstudy of the SHRP data from the laboratory and field than were available to the A-005researchers. Rather, to validate the selected properties for the specification is to determinewhether the trends in the data are correct and of reasonable proportion. It will remain a taskfor the future, as in the Long Term Pavement Performance (LTPP) SPS-9 study, to useproperly calibrated performance prediction models with long-term field data from controlledexperiments to refine the specification limits.
The validation efforts reported here address the following:
1) an empirical study of the strain and stiffness of the asphalt binder in tension;
2) a study of the slopes of the log compliances of the mix and of the binder, andtheir relationship to binder theology (these relationships are evaluated for theload-related distress of rutting and fatigue cracking);
3) a study of binder stiffness (S) and slope of the log compliance curve (m) forthermal cracking; and
4) calibration of performance prediction models.
45
It is important to note that each investigation independently found it impossible to set anybinder specification limit independent of the properties of the aggregate. The thermalcoefficient of contraction of the mix is strongly dependent upon that property of theaggregates. A range of mix performance maybe observed with the same or virtually thesame binder because of this property of the aggregate. In permanent deformation, only afraction of the total rut depth can be attributed to the properties of the asphalt-bound layerbecause the supporting layers contribute to the rutting as well. A careful analytical studywith a calibrated performance prediction model to isolate the effect of the asphalt-bound layerwould be necessary to further refine the binder specification. Fatigue cracking occurs morerapidly in pavements with underdesigned structures, as well as with asphalts with littleresistance to fracture.
3.2 Experimental Design
As noted above, one of the key objectives of the A-005 contract was to validate the selectedbinder and mix properties with field performance data. Ideally, this would require awidespread geographic distribution of sites to encompass a range of climatic zones and datafrom well-documented, in-service pavement sections in which the following are known:
• complete construction, traffic, and environmental histories;
• distress history and deflection test measurements; and
• layer thicknesses and material properties, including base course(s) andsubgrade.
Although data from several excellent field studies were available, none had all thecharacteristics described above. Hence the preponderance of the data were generated fromthe LTPP's General Pavement Studies (GPS) sites.
The experimental design for the validation effort is shown in Figure 3.1. Two experimentswere designed: one for the load-related distresses (rutting and fatigue cracking) and one forthe non-load-related distress (low-temperature cracking). Each was designed to havepavement sections located in different climatic zones with the different types and varyingdistress levels. The total number of pavement sections in the overall experiment was 72,with 48 in the load-related portion and 24 in the non-load-related portion. The validationprogram required extensive sampling and testing of the field cores and extracted binders, aswell as maximum use of nondestructive testing data.
Thirty-six to 46 cores were taken from each site and tested for the following:
• compressive and tensile creep and recovery;
• frequency sweep in compression and tension;
46
__ WET DRYFREEZE NO-FREEZE FREEZE NO-FREEZE
H 2C 2V _10 2C 2V _10 2C 2V_102C 2V[ 10H
L 2c 2v_2c 2v_ 2c 2v_2c 2v[1°
L L 2c 2v_ 2c 2v_ 2c 2v_2c 2v[1°/
[--2 Sites of Verification2 Sites of Calibration
a. Load-related experiment
_.__ WET DRYHARD FREEZE FREEZE-THAW HARD FREEZE FREEZE-THAW
H 2C 1V[J-2C 1V_1°2C 1V _10 2C 1V _10H
L 2C 1V _10 2C lV _10 2C lV _10 2C lV 11o
l --1 Site for Verification--2 Sites for Calibrationb. Non-load-related experiment
Figure 3.1. Experimental design for stage 2 validation
47
• indirect tensile creep and recovery; and
• indirect tensile strength.
After testing, the binder was extracted and recovered from the cores for evaluation of its]physical and rheological properties. Rheological tests were conducted to determine the linearviscoelastic properties, which were then used to develop master stiffness and creepcompliance curves.
3.3 Binder and Mix Compliance: Load-Related
Frequency sweep tests were made on core samples from all of the load-related GPS sites.The test results were analyzed with nonlinear regression analysis to produce the creepcompliance parameters of the mix. The binder was extracted from cores from each load-related GPS site, and rheological tests were conducted at a variety of frequencies andtemperatures. This resulted in a master shear creep compliance curve and a time-temperatureshift function for the extracted binder. Figure 3.2 illustrates the relationship between theslope of creep compliance of the binder and the mix.
3.4 Empirical Validation: Load-Related
Figure 3.3a shows a comparison of G* and sin _ versus rutting. The G* and sin _ valueswere calculated at 52°C and 70°C (126°F and 158°F) for pavement sections in freezing andnonfreezing climates, respectively. The 52°C and 70°C (126°F and 158°F) temperatures arethe lowest and highest temperatures, respectively, at which the SHRP binder specificationtests are conducted. The G* and sin _ plots for fatigue cracking in Figure 3.3b also show aninterspersion of high and low cracking rates over the entire area of the graph. Shown inFigure 3.4a is the relationship between the binder specification property and measured rutdepth; Figure 3.4b illustrates the relationship between the binder specification property andobserved fatigue cracking. Note in Figure 3.4a that all the field sections but one meet thebinder specification requirement for permanent deformation. Note also that in the data setthere was not excessive rutting, as the maximum rut depth observed was less than 1.8 cm(0.7 in.). The adequacy of the binder specification with respect to fatigue cracking is moretentative. As seen in Figure 3.4b, there were very few sections in the data set that exhibited
fatigue crackin_g, all of which had a G'sin _ well below the specification maximum of 5000kPa (725 Ib/in'_).
By normalizing the data to eliminate the pavement geometry, it is clear from Figures 3.3 and3.4 that there is an equal chance of the pavement having a high rate of either rutting orfatigue cracking, regardless of the binder property. This may reflect the effect of mixdesign, construction, climate, or any combination of these factors. The lack of clear trendsin the data highlights the fact that the binder specification cannot be used in isolation toincrease the probability of enhanced pavement performance.
48
I ' ' ' ' I ' ' ' _ i ' ' _ ' I ' _ ' ' I _ ' ' ' i0.97 -
"-" Y = 0.653 + 0.386XU3
o 0.92
r_ 0.87
0.82E _O
_ 0.77
E_.
0.72'0r-
-r-I
m0.67
I , , e I I , , , , I , , , , I _ , , , I , , , , I
0.24 0.34 0.44 0.54 0.64 0.74
Mixf_ure
Figure 3.2 Relationship between log of slope of creep compliance of binder and mix
49
1.00o HIGHRUTTING
0
[] o LOWRUTTING0.08
o
0.96 o []ooo D0
z 0.94 o_ o0
DoE ] [] []
0.92 o0 0
o.go0
0
0.88 lb t0 _0 _0 _0 d0 50 _0 3
8', kPa
Figure 3.3a. Relationship between G* and sin _ (rutting)
1.00 -,o HIGHCRACKING
0
[] o LOWCRACKING0.98
[]
0.96 [] [][]
z 0.94 _ o
ODD [] []
0.92 o[] []
0.900
[]
0.88 lb 2'0 _0 _0 _0 do 50 _0C*,kPa
Figure 3.3b. Relationship between G* and sin _ (fatigue cracking)
50
1.0BINDERSPEC:G*/SIN8 > 2.2 kPa
0.8
¢..
0.6 [](-.o_
::lff [] []n
"' Dm 0.4 []
DD I-I
[_ DD D
[] DI_] I-0.2 [] [] _ q_
,0 I I I I I I I I I I I I I I I I I I I t I I I
.1 t lb 1(ioG*/SIN& kPo
Figure 3.4a. Relationship between binder specification property and observed rutting
Figure 3.4b. Relationship between binder specification property and observed fatiguecracking
51
3.5 Limiting Strain and Stiffness of Asphalt Binder
The A-002A contractor found a distinct relationship between tensile strain at failure andsecant modulus from the direct tension test of binders (Anderson et al, 1994). Thisrelationship held true for both the unaged and laboratory-aged specimens. Direct tensiontests also were performed at different temperatures on binders recovered from each of thenon-load-related GPS sites.
Figure 3.5 shows that substantial differences between the two sets of data. Those sectionswith less severe low-temperature cracking mirrored the tests performed on the SHRPMaterial Reference Library (MRL) asphalts. Those GPS sections with greater amounts oflow temperature cracking exhibited a more significant difference. Figure 3.5 also shows atypical relationship between the tensile strain at failure and the secant modulus from theindirect tensile test (von Quintus et al, 1991). The effect of the aggregate is illustrated as thetypical curves for laboratory-aged binders and mixesbegin to diverge.
The tensile strain at failure is a parameter that was proposed for use in the binderspecification. To establish the relationship between failure strain and total cracking, thefailure strain in tension was determined for a constant secant modulus. This was done to
normalize differences between binders with varying stiffness. Figure 3.6 shows acomparison between the total amount of cracking and failure strain estimated at a secantmodulus of 100 MPa (14.5 k/in2). As illustrated, there are three distinct sets of data. Thosesites in a colder environment where low failure strains were measured generally had muchmore cracking. Conversely, those sites where the binders exhibited failure strains in excessof 1 percent generally had low amounts of cracking. Although the data set is limited, the 1percent failure strain in tension appears to be reasonable in separating those mixes that hadlow amounts of cracking in colder climates. In essence, binders with greater failure strainsnormalized to a specific secant modulus were found to be more resistant to cracking, whichwas expected.
3.6 Empirical Validation: Non-Load-Related
The binder parameters that have been identified as those controlling thermal cracking are thecreep stiffness (S) and the slope of the binder stiffness curve (m) at 60 sec loading time. Thetest temperature at which the two parameters are obtained is selected based on the lowestpavement service temperature.
An empirical approach was used to validate the proposed binder specification. Minimumpavement surface temperatures of the pavement sections varied from - 11 °C to -31 °C (12 °F
to -23.8°F) which represents a broad range of service temperatures. Direct measurement of
specification parameters at the appropriate test temperatures was not available; parameters
were generated from the binders' master stiffness curves and shift functions using the time-
temperature superposition principle. The stiffness and slope parameters were obtained for
the 22 GPS sections and then compared with the specification limits proposed for thermal
cracking. The "failed" and "passed" sections, as determined by the specification, were then
52
53
• Mlnlmum Pavement Temperatureless than (colder) -14'_;
O Minimum Pavement TemperatureWarmer than -14"C
1000 -- • •
• I- % • I •800
•i
'_. Cracking Measuremento" Believed to bew
o ! In Erroro 600 - IC_
o 400 -¢0
200 - ,_
° i0 ! o _o , I I I _ !0.2 0.4 0.6 0.8 1.0 1.2 1.4
Failure Strain in Tension, %
Normalized to a Secant Modulus = 100 MPa
Figure 3.6. Relationship between failure strain in tension for binder secant modulus of
100 MPa (14.5 ldin 2) and observed pavement cracking
54
compared with actual cracking observed in the field. Only 7 of the 22 binders passed thespecification requirements as shown in Figure 3.7. Further examination of these resultsindicated that the actual cracking observations in the field did not agree with the specificationrequirements. Some binders used in sections with medium observed cracking passed thespecification, while sections with zero and low observed cracking had binder properties thatfailed the specification. In fact, 5 of the 14 binders that failed the specification were insections where either zero or low cracking was observed in the field. All sections withobserved high cracking did fail the specification. Clearly, these observations warrantedfurther evaluation of the proposed specification.
Additional work was performed to investigate the specification limits and proposedtemperature ranges. The sections were categorized into four groups based on the stiffnessand slope values as determined by the specification. A check was made for a relationshipbetween failure in either of the specification parameters and cracking potential. Fourcategories (i.e., quadrants of Figure 3.7) were established based on the magnitudes ofstiffness and slope (S and m) at the test temperature, relative to the specification limits for Sand m (S < 300 MPa and m _> 3.0 respectively). Almost all the sections rejected by thespecification did not meet the limits for both S and m. On the other hand, only one of thesections was rejected based on the stiffness requirement alone. Figure 3.7 also shows thatone section did not pass the specification requirement for slope only. All the binders used inthe remaining GPS sections that did not pass the specification also failed to meet both thestiffness and slope limits; neither parameter is solely responsible for rejection of thesebinders. As illustrated by Figure 3.7, there is no clear correlation between adherence toeither of the specification limits and observed cracking in the field.
A key observation was made with respect to the test temperatures at which these parameterswere obtained. It was noted that all binders with test temperatures of-10°C (14°F) passedthe specification. On the other hand, all sections with parameters obtained at testtemperatures of-20°C or -30°C (-4°F or -220F) failed. In its current format, the outcomeof the specification is driven primarily by test temperature. It seems that the currentspecification is not as sensitive to differences between different binder properties as it is todifferences between test temperatures.
The temperature ranges used in the specification were examined to determine whether the
sensitivity to differences in binder properties could be improved. The stiffness and slopeparameters were obtained at the lowest pavement temperature plus 10°C (50°F). Thisapproach resulted in acceptance of most of the binders used in sections with observed low
cracking as shown in Figure 3.8. Nine of the 14 test sections with binder properties of S <300 MPa (43.5 k/in 2) and m > 0.30 were zero or low cracking sections in the field. Threehad medium cracking, and two had high cracking. All eight field test sections that exceededthe specification limits (S > 300 MPa (43.5 k/in2) or m < 0.30) had either medium or highcracking. Considering mix effects, which may temper the binder's performance, it isconcluded that stiffness and slope are reasonable parameters.
Figure 3.9 provides additional evidence regarding the effects of test temperature. Bindersfrom each field site were evaluated at -10°C, -15°C, and -20°C (14°F, 5°F, and -40°F) to
55
SPEC-m > 0.50 OBSERVEDCRACKINGS< ,500MPo o ZERO # MEDIUM
+ LOW 0 HIGH
0.70
0.60[]
0.50o
0.40 <> []E
+ .+0.30 _o
OOD
o []+ o0.20
0.10
O.%o....... ,0, ...... ....... '¢STIFFNESS,MPo
Figure 3.7. Relationship between binder specification properties and observed low-temperature cracking
SPEC- m > 0.50 OBSERVEDCRACKINGS<300MPo o ZERO MEDIUM
Figure 3.8. Relationship between binder specification properties and observed low-temperature cracking (test temperature at lowest pavement temperature plus 10°C[50°C])
56
104-5PEC- 5 _;,:300MPa o TESTINGat-10°0
o TESTINGat-20°C
103 o o•_ o 0
_ 8 @ILl
" 8 8b_ [] oI,m-- 0
102- 8 o [] B
[]
[]
[]
101 ZERO LOW MEDIUM HIGH
LEVELOFCRACKING
Figure 3.9. Relationship between binder stiffness and low-temperature cracking atvarious temperatures
determine stiffness and slope. Figure 3.9 shows that all the binders passed at -10°C (14°F),and only four passed at -20°C (-4°F). Furthermore, comparison with the binderspecification indicated that none of the asphalts could be used in service temperatures below-20°C (-4°F), whereas available performance date indicate that several of the binders wereadequate.
The primary conclusions drawn with respect to the binder specification are as follows:
• Stiffness and slope (S and m) appear to be reasonable parameters forcontrolling thermal cracking.
• The specification limits (S < 300 MPa (43.5 k/in2) and m > 0.30) may berefined, but are they quite reasonable.
• The 6°C (43°F) temperature rarlge used to define different binder grades inthe binder specification seems to allow for a reasonably accurate evaluation ofthermal cracking performance.
• Thermal cracking performance of a particular binder is mix-dependent i.e.,mix performance cannot be controlled solely by the binder properties.
57
• Consideration of additional field data will help to refine the specification
testing limits and appropriate test temperature ranges.
3.7 Pavement Performance Models: Predictions and Calibration
One of the primary objectives of the A-005 contract was to develop pavement performanceprediction models to support the performance-based specifications and Superpavc software(Lytton et al, 1994). The final step in the model-building process was to illustrate that themodels could accurately predict the amount of distress observed in the field. To address theshortcomings of the empirical validation approach described in the preceding section, theA-005 contractor proceeded in parallel with a more complex mechanistic method of fieldvalidation. In this approach, as previously shown in Figure 1.3, material relationships wereused in mechanistic models to predict distress. Field cores were taken from distressedpavements and subjected to a series of laboratory binder and mix tests to measure specificproperties that were identified by the A-002A and A-003A contractors as related to aparticular distress.
The three ways to validate a model are:
• to collect new data to check the model and its predictive ability;
• to compare results with theoretical expectations, empirical data, and simulatedresults; and
• to use a "hold-out" sample to check the model and its predictive ability.
The best means of model validation is through the collection of new data so that one candetermine whether the model developed from the original data still applies to the new data.If the model is applicable to the new data, this permits a reasonable extrapolation of theperformance prediction capabilities beyond the limits of the experimental data upon which itwas based. Because of time constraints the collection of "new" data was not possible.
Future development and refinement of the model should include the expansion of thedatabase upon which the current model is based through the LTPP SPS-9 and othercontrolled field experiments.
A reasonable alternative to collecting new data is to split the existing data into two sets. Thefirst data set is called the model-building set and is used to develop the model. The seconddata set is called the validation or prediction set and is used to evaluate the reasonableness
and predictive ability of the selected model. For small data sets where data splitting isimpractical, nonlinear regression techniques may be used.
With respect to pavement performance, calibration is the process of systematically adjustingthe predicted values of distress so that the predicted and observed values of distress match asclosely as possible throughout the pavement's known history.
58
Several methods of calibration were used toward this end. For example, rutting predictionswere calibrated by adjusting the factor by which the predicted rut depth is multiplied to givean accurate estimate of the observed rut depth. Calibration of this kind may be performedone pavement section at a time; for the SHRP validation, however, calibration was done onsets of pavements grouped by the four LTPP climatic zones: wet-freeze, wet-no-freeze, dry-freeze, and dry-no-freeze. As expected, the multiplying factors varied with climatic zone.
3. 7.1 Fatigue Cracking
Calibration of the fatigue model required adjustment of material properties: healingproperties in the crack initiation phase; and the tensile strength, stiffness, and log slope ofthe creep compliance in the crack propagation phase. Two sets of calibration coefficientswere developed. The first of these used moduli that were backcalculated from the fallingweight deflectometer (FWD) tests on cores extracted from the GPS sections. The second setused moduli that were calculated from a series of tests conducted in the SHRP shear testdevice. Comparisons of the predicted and measured values for both sets of coefficients areshown in Figures 3.10 and 3.11.
3. 7.2 Permanent Deformation
Calibration of rut depth predictions was accomplished using a system identification iterativemethod to converge to a final multiplying factor for each climatic zone. The final valueswere the same regardless of the moduli used, i.e., backcalculated from FWD data or theA-003A-recommended accelerated laboratory tests. Comparison of the predicted andmeasured values is shown in Figure 3.12.
3. 7.3 Thermal Cracking
Calibration of the thermal cracking model required the use of nonlinear regression analysis tofind the best values of a stress intensity factor (k) and two empirical coefficients (tl and tr)that describe the amount of surface cracking. In summary, the calibration determined theunknown parameters (ill and tr) included in the relationship between the amount of crackingand the logarithm of the ratio of the average crack depth within the surface layer to thethickness of the surface layer. Perhaps the best way to measure the goodness of fit of themodel is to compare directly the predicted and observed amount of cracking by categorizingthe predicted and observed levels of cracking as follows:
• Zero cracking: 0 to 7.5 m (0 to 25 ft) of cracking per 150 m (500 ft)section;
• Low cracking: 7.5 to 22.5 m (25 to 75 ft) of cracking per 150 m (500ft) section;
59
1000. i ! ' ii a ! _.J900 .................-...............i................_................!................r................,...............T...............T..........._ ............
" ' iiljii:iiiiii:iiiii''800..... i i i i 1700 ................................................................... ' ................ 1............................
-0600m ................ ir 1 1 1 t...............i................i................................jJ............... , i i
,- i i i i_" 400- ................................................_.............................................................., _ _ i 7_i-" ..........................I..............i................
_oo.................!,..........i,__ , ..............................i...............!................./ , ! i i I.............................,...............................ii100 |..............................I ......................................................................._ ii
0 i I I t0 100 200 300 400 500 600 700 800 900 1000
measured
Figure 3.10. Comparison of calibrated predictions with measured fatigue cracking usingbackcalculated asphalt moduli
60
1000 -- ' 'i _ i I ! i_J. .... _ . ". ............ ; .......................................................... _...............................900 ................-...... _ , , !! _ , 1 I I "
................ r-------×...............................................................................,.,,,, ' ' ' ' i ill ii_ _ i i , _ ................ouu ................i...............;...............: ...............i................"............._ ' iiJi I i i._ i I i
.-- _ ! i I 1 .............. I ................o 500 ................_..............._...............+...............i........_- ..............
,oo................_..............._!................_i__l I...............[...............!................................................_oo.................i..............._.........._ .........i................I................I..............'...............i...............i................i _! I I" 1 I i
i _ ! i I i200................ t t.=....................................... i............................................................._................]................i ! I i
• i i,, ,._. , I II I . ........ .,- " ....... _.................. II ......................................100 .....ii_ _ , _ I ,
Figure 3.12. Comparison of measured rut depth with calibrated predictions of rutdepth
62
• Medium cracking: 22.5 to 45 m (75 to 150 ft) of cracking per 150 m(500 ft) section; and
• High cracking: greater than 45 m (150 ft) of cracking per 150 m (500 ft)section.
The results of this comparison using predicted cracking determined with the modelparameters are shown in Figure 3.13 and are summarized as follows:
• Eight of the high cracking sections were predicted to be high crackingsections. Similar success was observed with the zero cracking sections.
• Of the three low cracking sections, two were predicted to be zero, and onewas predicted to be low cracking.
• Only one prediction was off the diagonal by two cells; 16 of 19 predictionswere on the diagonal (meaning excellent prediction), and three were just onecell off the diagonal (implying fairly good prediction).
3.8 Conclusions
3.8.1 Load-Related
While it is evident that the properties of the binder are important in extending the service lifeof asphalt concrete, it also is obvious from the lack of observed patterns of high and lowrates of rutting and fatigue cracking that the selection of the binder alone will not ensuregood load-related performance. It is clear that the disciplines of pavement analysis anddesign, mix design, and the effects of construction and weather also play important roles inthe appearance and progression of load-related distress.
Performance prediction models were developed and calibrated to observations of rutting andfatigue cracking on a variety of pavements in the United States and Canada. Calibration
adjustments were made to the predictions by a mathematical technique known as the systemsidentification method or by a nonlinear pattern search method. The calibration adjustmentswere not large, nor did they vary much from one climatic zone to another, indicating that theprediction models developed for both fatigue cracking and rutting are sound.
The calibrated models take into account the traffic, temperature variations in all layersthroughout the year, and the seasonal variation in material properties of each layer incomputing amounts of rutting and cracking. The calibrated load-related models were shownto be well-suited for use in developing-performance related specification limits and foroptimizing mix designs in the Superpave system.
63
Observed cracking
Zero Low Med. High
Zero 4 2 1
Low 1
Med. :3.._
High 1 8
Figure 3.13 Final cell groups of predicted versus observed low-temperature cracking
64
3.8.2 Non-Load-Related
Based on the results of the field validation studies, the following conclusions were drawnregarding the effectiveness of the SHRP specifications:
• The stiffness and slope (S and m-value at 60 see loading time) determined frombending beam rheometer testing appear suitable for evaluating the thermalcracking performance of binders. Both stiffness and slope correlatedreasonably well with observed thermal cracking in the field.
• The limits on stiffness and slope in the binder specification (S < 300 MPa(43.5 k/in 2) and m > 0.30) seem quite reasonable. Additional field data willhelp to refine the limits.
• The 6°C (43°F) temperature range used to define different binder grades inthe binder specification seems to allow for a reasonably accurate evaluation ofthermal cracking performance.
• The binder specification alone does not guarantee adequate thermal crackingperformance. Mix characteristics have a significant effect on thermal crackingperformance of a particular binder.
• It appears that long-term aging (Harrigan et al) is needed to properly evaluatethe thermal cracking resistance of the mix.
• Based on limited data, it appears that aging levels comparable to thoseobserved in the field, as reflected by changes in the low-temperature propertiesof the binder, can be attained through thin film oven testing (TFOT) followedby pressure aging vessel (PAV) aging as proposed in the SHRP binderspecification.
• The thermal cracking model adequately represents and accounts for the mostsignificant factors in the thermal cracking of pavements in the field and hasgood predictive capability.
65
4
Validation Testing with Modified Materials
It is readily acknowledged that asphalt cements with optimum properties may not be obtainedfrom all petroleums by conventional refining processes or blending practices because ofinherent variability in the characteristics of crude oils. As noted elsewhere (Kennedy et al,1994) asphalt modification may prove to be the most efficient, cost-effective means for
minimizing asphalt deficiencies and producing binders with acceptable performance propertiesfrom a wide variety of petroleum sources.
4.1 Scope of Work
It was originally intended on asphalt cement modification would encompass:
refining operations;
addition of a chemical modifier; or
mechanical reinforcement.
The emphasis on this research was to be placed on, but not limited to, modifiers such as
mineral fillers, extenders, polymers, rubbers, oxidants, antioxidants, and hydrocarbons. Theresearch was "...to develop test methods to evaluate the effectiveness of modification
procedures in enhancing the performance of asphalt binders and mixes." (TRB, 1986).Additional aspects of the research were to include health and environmental effects, recyclingpotential, and field studies of modified materials. In concert with the evolutionary nature ofthe SHRP asphalt program, the contract objective was modified somewhat in 1990, as notedin the following (SHRP, 1990):
Contract A-004: Adapt as necessary performance-related test methods for
binders and mixes to permit their use with the full range of modified systems.Explore innovative refinery processes to enhance the performance of modifiedasphalt binders. Develop a modifier evaluation protocol to permit evaluation
67
and selection of modified binder systems that remedy specific pavementperformance gaps.
The scope and complexity of the modification research later were revised because of timeand budget constraints, such that the A-004 contract responsibilities were limited to testingmodified binders in accordance with the A-002A-recommended test equipment and protocols.
Furthermore, responsibility for evaluation of modified mixes was shifted to the A-003Acontractor and limited to that associated with permanent deformation and fatigue cracking.
Validation testing of modified binders is addressed in Section 4.3. Validation testing withmodified mixes is addressed in Section 4.4.
Because of the lack of field performance data on modified materials, an expert task group(ETG) was formed in February 1990 to assist SHRP and contract staff in selecting modifiersfor inclusion in the experimental design. Members of the ETG included refinery personnel,material producers, and state highway administration (SHA) personnel. The final selectionof modified materials was based on a survey of SHA materials engineers (conducted by theA-004 contractor) and the ETG's recommendations. Modifiers were selected for each
pavement distress based on their expected performance. For example, the modifiers selectedfor evaluation with respect to permanent deformation were expected to span the full range ofperformance: good, poor, or "no effect." This selection methodology clearly allowed foroverlapping use of modifiers. Modifiers that were expected to enhance permanentdeformation performance would be expected to detract from fatigue cracking performance.
The modified materials were selected based on the collective knowledge and opinions of the
ETG, SHRP, and A-001 staff. The performance data were drawn mostly from laboratorytest data, not field performance data. Furthermore, the reader is reminded that theconclusions drawn are based on a limited data set. Any inferences made with respect to field
performance are preliminary at best.
4.2 Modified Materials
Materials used in the validation testing were drawn from the following general categories ofmodifiers: polymers such as styrene butadience styrene (SBS), styrene butadience rubber(SBR), ethylene vinyl acetate (EVA); reclaimed rubber, extendcrs, oxidants, antioxidants,mineral fillers, and antistripping agents.
4.3 Modified Binder Testing
Various combinations of 11 modifiers and five asphalts were evaluated using the dynamic
shear and bending beam rheometers, as well as the direct tension device. The binders andmodifiers are listed by distress in Table 4.1, and the results are presented similarly, i.e., bydistress.
68
Table 4.1. Materials used in modified binder evaluation
Distress Modifier Binder
Aging SBR AAG, AAK, AAMoxidantantioxidant
mineral fiber
Fatigue SBR AAF, AAG, AAKEVAoxidant
Permanent Deformation SBS ADD, AAG, AAKmineral filler
Thermal Cracking SBS AAD, AAG, AAKextender
reclaimed rubber
4.3.1 Aging
Three levels of age conditioning were considered: unaged (tank), thin film oven test(TFOT)- aged, and TFOT residue with the pressure aging vessel (PAV). Three binders wereused in combination with four modifiers. The three binders considered--AAM, AAG, andAAK--were expected to demonstrate "good," "intermediate," and "poor" performance,respectively.
Age conditioning of the unmodified binders, as measured by G*/sin 5 from dynamic sheardata (Figure 4.1), suggests that TFOT aging would produce the expected performance,whereas after PAV aging, AAM and AAG would perform identically, but very differentlyfrom AAK. Direct tension results, as measured by tensile strength (Figure 4.2), generallyyield the expected results in terms of performance; however, age conditioning does notmarkedly affect the individual binder's tensile strength. Although not shown, failure straindata indicate that tank and TFOT- aged binders generally yield similar results regardless ofbinder type. Also, PAV conditioning resulted in lower failure strains for the AAG and AAKbinders. Figure 4.3 shows the m-value calculated from bending beam rheometer data. Theaging trends for the individual binders are as expected, although both AAM and AAGperformed nearly identically, but again, differently from AAK. Bending beam stiffness data(Figure 4.4) indicate that the various aging techniques do not markedly affect the behavior ofthe individual binder. Furthermore, the stiffness data indicate that binders AAM and AAKbehave similarly, and that AAG is much stiffer, regardless of conditioning.
Age conditioning of the modified binders was evaluated for tensile strength and G*/sin dtasshown in Figures 4.5 and 4.6, respectively. Observations with respect to the test results maybe considered from two perspectives: the effect of age conditioning across materials, and theeffect of the modifier on the control binder.
69
300
AGE CONDITIONING
FATANK
[]TFOT
[] PAV
200 --
z_
(3
lOO -
0
AAM AAG AAK
UNMODIFIEDBINDER
Figure 4.1. Effect of age conditioning on G*/sin
750
AGE CONDITIONING
_ZJTANK
"_c_600 ; [] TFOT
"T'r __ [] PAVF-(_Z 450
_300
°0
AAM AAG AAK
UNMODIFIEDBINDER
Figure 4.2. Effect of age conditioning on tensile strength
7O
0.5 l r_x-x'x-x_
AGE CONDITIONING
[]TANK __///x
0.4 EaTFOT _///A._'_ II1_-_
[_PAV _,//_,,,_
I_ '''_\_'//A '//_\\_
//hk\\_[
0.2-
o.1- '//A) _//A\_
AAM AAG AAK
UNMODIFIEDBINDER
Figure 4.3. Effect of age conditioning on m-value
750
AGE CONDITIONING
I_TANK
600 {7"_TFOT
[] PAVEL
:_ 4so
if)uJZIi
_u_300O9
AAM AAG AAK
UNMODIFIED BINDER
Figure 4.4. Effect of age conditioning on stiffness
71
7OO
600 X UNMODIFIEDBINDER(AAK)EXPECTEDMODIFIERPERFORMANCE
•_ u POOR500 o O00O
::_ o NO EFFECT
m.i400
z 500p-
20O
100 I i lTANK TFOT PAV
AGECONDITIONING
Figure 4.5a. Effect of age conditioning on tensile strength (modified binder AAK)700
X UNMODIFIEDBINDER(AAG)
EXPECTEDMODIFIERPERFORMANCE
600 0 D POORo GOOD
•_ o NOEFFECT
500400 o
z 300I,=JI--
2O0"El
100 I i iTANK TFOT PAV
AGECONDITIONING
Figure 4.5b. Effect of age conditioning on tensile strength (modified binder AAG)700
B00
. 5oo-r-
_J_ 400
z 500t_J
P" X UNMODIFIEDBINDER(AAM)
200 EXPECTEDMODIFIERPERFORMANCEo POORo GOOD
100 I t tTANK TFOT PAV
AGECONDITIONING
Figure 4.5c. Effect of age conditioning on tensile strength (modified binder AAM)
72
1000 L.I
X UNMODIFIEDBINDER[AAG]
EXPECTEDMODIFIERPERFORMANCEo POOR
o GOOD _
100
t_
10 I I I
TANK TFOT PAV
AGECONDfflONING
Figure 4.6a. Effect of age conditioning on G*lsin _ (modified binder AAG)
1000
X UNMODIFIEDBINDER(/V,K] ..,,,,,,,,El
EXPECTEDMODIFIERPERFORMANCE
o POORo GOOD ,)'I
o NOEFFEC_
100
10 _ i rTANK TFOT PAV
AGECONDITIONING
Figure 4.613. Effect of age conditioning on G'lsin _ (modified binder AAK)
1000
X UNMODIFIEDBINDER[AAMI 7
EXPECTEDMODIFIERPERFORMANCE
o POORo GOOD
_z 1000'3
10 I f I
TANK TFOT PAV
AGECONDITIONING
Figure 4.6c. Effect of age conditioning on G*/sin ,_ (modified binder AAJVI)
73
With respect to tensile strength, the performance of binder AAK was fairly consistentregardless of age conditioning or modifier, as shown in Figure 4.5a. For binder AAG(Figure 4.5b), the largest difference was observed between TFOT and PAV conditioning forall materials. Also, the difference between the "good" and "poor" modifiers was evident atall conditioning levels, the largest difference between the tank and TFOT procedures. Withbinder AAM (Figure 4.5c), the "good" modifier showed slightly different behavior betweenthe TFOT and PAV conditioning. With the "poor" modifier, however, the material responsedeteriorated with each succeeding aging procedure.
Shear rheometer data (G*/sin _) was significantly more sensitive to conditioning procedures,as it increased for all materials with degree of aging. As shown in Figure 4.6, G_*/sindiscriminated among the control, "good," and "poor" modifiers fairly consistently after bothTFOT and PAV conditioning. Only with binder AAG (Figure 4.6a) was there a differencein behavior measured in the unaged/tank condition among the control binder, "good," and"poor" modifiers.
Shown in Figures 4.7 to 4.10 are comparisons between various properties of the unmodifiedand modified binders. The data points are paired in terms of age conditioning, i.e.,unmodified tank tensile strength with modified tank tensile strength, unmodified TFOT agedtensile strength with modified TFOT-aged tensile strength, unmodified PAV-aged tensilestrength with modified PAV-aged tensile strength, and so on. As illustrated in Figure 4.7,agreement between the unmodified and modified tensile strength regardless of ageconditioning is quite good, except for the modifiers that are expected to result in poorperformance with respect to aging. Those modifiers that were expected to perform poorly asthey were aged consistently yielded lower tensile strengths, suggesting that the ageconditioning did affect the modified binder and that the direct tension test is useful tomeasure this effect. The results for G*/sin t5 shown in Figure 4.8 are nearly identical tothose shown in Figure 4.7, except that the poorly performing modifiers are virtually a mirrorimage of those shown for tensile strength, as expected. Bending beam stiffness data inFigure 4.9 may not discriminate as much among unmodified and modified binders assuggested by the nearly linear relationship. Not surprisingly, the m-values derived frombending beam data (Figure 4.10) show a similar trend.
In summary, the limited age conditioning of modified binders suggests the following:
• A poor modifier tends to have measurable effect on the rheological propertiesof a good binder (Figure 4.5c), but a good modifier tends to have a lessperceptible effect on a poor asphalt (Figure 4.5a).
• Differences among age conditioning procedures are seen more clearly withdata derived from dynamic shear rheometer testing (G*/sin _) than withbending beam rheometer data (Figures 4.5 and 4.6).
• Tensile strength and G*/sin _ seem more sensitive to modifier influence thando stiffness and m-value measurements derived from bending beam rheometerdata (Figures 4.7 and 4.8 versus Figures 4.9 and 4.10).
74
7O0
°_ EXPECTEDMODIFIERPERFORMANCE6" 600 o POOR o
o GOOD oo NOEFFECT o
500 oo
,_ 400
o E]300 E]
"" 200 o
100
TENSILESTRENGTHof UNMODIFIEDBINDER,psi
_gure 4.7. Modified binder Performance/n terms of tens//e Strength
1000
i E3
" L_C
0
100 o
o¢o o o
_a EXPECTEDMODIFIERPERFORMANCEo POORo GOOD
o NOEFFECT
G*/SIN8 of UNMODIFIEDBINDER,kPo
Figure 4.8. Modified binder performance in terms of G*/sin
75
7OOEXPECTEDMODIFIERPERFORMANCE
o BOO o POORo_ o GOODo NOEFFECT o
o []"' 500OCl
w_. 400__.w
° _:_ 300 LIN ITY
°m []m 200L_
z fN 100 []o
[STIFFNESSMEASUREDWITHBENDINGBEAM RHEOMETER]
O I_0 2_0 3_0 4_0 5_0 61_0 71)0
STIFFNESSof UNMODIFIEDBINDER,MPo
Figure 4.9. Modified binder performance in terms of stiffness
Additional evaluation of modified binders was conducted by A-002A researchers at thePennsylvania State University. Four asphalts were used in combination with 10 modifiers.
As shown by the bending beam stiffness data in Figure 4.11, the material response was quitediverse. In terms of binder performance, AAD and AAK generally performed consistently,regardless of modifier, with only one exception for each. In the case of binder AAD, themodifier detracted from its performance; with AAK, the addition of a modifier improved itsperformance. For binder AAG, six of the nine modifiers reduced the stiffness; two left itessentially unchanged, and one increased it only marginally. Binder AAF was evaluated withfour modifiers: Two reduced stiffness, one increased it, and one left it identical to thecontrol stiffness. Clearly, these additional data are much more encouraging in terms of theuse of the bending beam for evaluating modified binder response.
4.3. 2 Permanent Deformation
In the early stages of the modifier evaluation, it was decided that only unaged binders wouldbe considered in the permanent deformation, fatigue, and low-temperature crackingevaluations. This decision, as evidenced by the conditioning procedures included in thebinder specification, was later revised. Unfortunately, the data included here are limited tothose for unaged binders.
In the permanent deformation evaluation, three binders and three modifiers were combined.From an evaluation of all the rheological data, only the dynamic shear rheometer dataprovided some relationship to expected performance. As illustrated in Figure 4.12, theG*/sin 6 clearly discriminated among the poor, intermediate, and good modifiers that werecombined with binder AAK. Similar trends are seen with binder AAG, although the effectof the good modifier was not as dramatic as that observed with AAK. The effect of the goodmodifier resulted in a more than doubling of the G*/sin _ term for binder AAD. Admittedly,this data set is relatively small, but it is clear that the dynamic shear rheometer can be usedto discriminate among modifier performance.
Data drawn from a number of sources and spanning a wide range of modifiers 2 providesadditional corroborating evidence that the dynamic shear rheometer is an effective tool forevaluating the permanent deformation behavior of modified binders (SHRP, 1994). The datashown in Figure 4.13 include both aged and unaged materials tested at various temperaturesand clearly demonstrate the effects of modifiers on the high-temperature behavior in terms ofG*/sin 8.
4.3.3 Fatigue Cracking
As was the case for permanent deformation, all binders evaluated in the fatigue crackingexperiment were unaged. Three binders and three modifiers were tested in the A-004
2Modifiers in this data set included cellulose fibers, EVA, organic and inorganic Idlers, polyethylene,polyftmctional polyolefm, reclzlmed rubber, SBR, and SBS.
Figure 4.12. Effect of binder modification on G*/sin
78
4+ UNAGED []o TFO-AGED
hl
l_,--r--I
°=_ 5 - X []Z
I,ii,
o 2_ X
Z
+ []
0
0F--
0 45 60 65 70
TESTTEMPERATURE,°CFigure 4.13. Effect of binder modification on high-temperature properties
experiment. The results, unfortunately, are inconclusive. As illustrated in Figures 4.14 and4.15 the poor modifiers produced a lower tensile strength than the control binders AAK andAAG, but nearly identical to the control for binder AAF. The good modifiers did increasethe tensile strength of binders AAG and AAF. However, the modifier that was supposed tohave no effect increased the tensile strength when added to binders AAK and AAF. Likelyreasons for the lack of correspondence between the material properties and expectedperformance are that the hypothesized performance of the binders and modifiers may nothave been entirely correct. For example, binder AAK was suggested as good for fatigue, butpoor for aging. Normally, asphalts which stiffen with aging are also susceptible to fatiguecracking. Also, the use of unaged binders may have been inappropriate for evaluating thefatigue response.
Additional data included both PAV-conditioned material and binders extracted from field
cores. 3 As seen in Figure 4.16, shear rheometer data (G'sin t3)clearly discriminates amongthe various types of modifiers, suggesting that rheological properties at intermediatetemperatures can be used effectively to predict the fatigue performance of modified binders.
3Modifiers used were EVA, polyethylene, and SBR.
79
7O0
[] UNMODIFIED BINDEREXPECTED MODIFIER PERFORMANCE
600 - F_ POOR
•_ []GOODO. 500 - FIINO EFFECT"I-
(9Z 400-LLI
00 300-ILl !
Z 200W i
AAK AAG AAF
UNAGED BINDERS
Figure 4.14. Effect of modifiers on unaged binders (tensile strength)
801] EXPECTEDMODIFIERPERFORMANCE o J"_ o POORo_ 0 GOOD"' 501]r-.,zr,n¢-..,w-----400(=)_E
Figure 4.15. Comparison of tensile strength for unmodified and modified binders
8O
2.0× X PAV-AGED
• RECOVEREDFROMFIELDCOREi,iII_l_IC3
o 1.5Z
LLIi,
o 1.0 •
,.,o XZ
" 0.500F--
0.02'0 215 3TESTTEMPERATURE,°C
Figure 4.16. Comparison of laboratory- and field-aged modifiers
4.3. 4 Thermal Cracking
Three binders and four modifiers were considered in the A-004 thermal crackingexperimental design. As noted previously, the materials were tested without ageconditioning. In general, none of the properties measured with the direct tension device
corresponded to the expected performance, as illustrated in Figures 4.17 and 4.18. The poormodifiers did reduce the tensile strain, as expected. Unfortunately, all the modifiers, eventhose that were predicted to enhance the thermal cracking response, resulted in lower tensilestrains as well. Stiffness, as derived from bending beam rheometer data (Figures 4.19 and4.20) was somewhat less erratic. The reasons cited for the discrepancies between materialproperties and expected performance with regard to fatigue cracking are applicable to thermalcracking.
Other researchers have published test data that are substantially less variable and far moreencouraging. Data reported by ELF researchers included four penetration graded asphalts,each of which was modified with varying percentages of a styrene-butadiene block copolymer(King et al, 1993). In addition to the conventional binder tests, bending beam rheometer anddirection tension tests were used to characterize the control and modified binders. A
standard aggregate blend was used for all mixes. Figure 4.21 illustrates the excellentagreement between the binder temperature at bending beam rheometer stiffness of 200 MPa(29 k/in 2) and theoretical mix cracking temperature. Figure 4.22 compares the bendingbeam stiffness and stress at fracture as measured by the thermal stress retrained specimen test(TSRST). There was good agreement between the binder and mix parameters, especially for
81
2.5
[] UNMODIFIED BINDER
EXPECTED MODIFIER PERFORMANCE
Z 2- i=1PODa<rr" [_-_GOODI.--03 [] NO EFFECTLLI 1.5 -.._1OgZLUI--I'- 1ZW
rr"W_ 0.5
0
AAK AAD AAG
UNAGED BINDERS
Figure 4.17. Effect of modifiers on unaged binders (tensile strain)
3 jEXPECTEDMODIFIERPERFORMANCEi.a..I
n POORZ
--m o GOOD ./
,'-', o NOEFFECT __
,...--,o 2
_ °
- _ []PERCENTTENSILESTRAINof UNMODIFIEDBINDER
Figure 4.18. Comparison of tensile strain for unmodified and modified binders
82
50O
[] UNMODIFIED BINDER
EXPECTED MODIFIER PERFORMANCE
400 - [] POOR
_] GOOD
[] NO EFFECT13_
300-
O')UJZU_I..1_200-
I--U)
100 -
AAK AAD AAG
UNAGED BINDERS
Figure 4.19. Effect of modifiers on unaged binders (stiffness)
1000
EXPECTEDMODIFIERPERFORMANCE /o POOR
13. o GOOD
,,,""_" o NOEFFECT _iz
oi,
100 o0
i.O
i.iZi,
10 ........ llJ0 ....... i0 I0
STIFFNESS of UNMODIFIEDBINDER, MPa
Figure 4.20. Comparison of stiffness for unmodified and modified binders
Figure 4.21. Relationship between bending beam rheometer stiffness and theoretical_ cracking temperature
[ALLMODIFIEDBINDERS]BX= 40/50PEN
_E a= BO/7OPENE 7 o= 80/I(]0PEN
o= 1BO/200PENz 0
_" <><> _,
_; 6 o X,, <>
o [] nu_ 5l.LJ
"_ 4m 0I--
[STIFFNESS MEASUREDWITHBENDINGB_M RHEOME7"ER]
3 5'0 1_0 150 250 250 3,roSTIFFNESS,MPo
Figure 4.22. Relationship between bending beam rheometer stiffness and TSRSTfracture strength
84
the harder grades of asphalt cement. The softest binder (180/200 penetration) appeared muchmore sensitive to changes in the modifier content as evidenced by the rapid change instiffness. Although this data set also is limited, the results do show conclusively that thebending beam rheometer is an effective tool for evaluating modified binder response.
4.3.5 Conclusions
It was originally intended that research conducted under the A-004 contract, AsphaltModification, would encompass modification or adjustment of asphalt cement properties asdefined by refining operations, addition of a chemical modifier, and/or mechanicalreinforcement. The scope and complexity of the modification research were revised becauseof time and budget constraints. The A-004 contract was then limited to testing modifiedbinders in accordance with the A-002A recommended test equipment and protocols.Modified materials included in the experiment design were selected based on the collectiveknowledge and opinions of the ETG, SHRP, and A-001 staff. The expected performance ofthese materials was based largely on laboratory test data, as field performance data werenonexistent or not readily available.
As noted previously, the A-004 experiment design included 11 modifiers and 5 asphalts thatwere a subset of the materials used in other asphalt research contracts. This may havelimited the full expected range of material response. It therefore, is not surprising that thereis no clear correspondence between the material properties of the modified binders andperformance as measured by the dynamic shear and bending beam rheometers and the directtension device. Moreover, the decision to use unaged binders to evaluate the permanentdeformation, fatigue, and low-temperature cracking behavior was unfortunate. This decisionwas made in the early stages of the research and undoubtedly affected the validity of theresults. The requirement for age conditioning in the final SHRP binder specification clearlyestablishes the perils of research conducted in parallel rather than series. Aside from theselimitations and constraints, the following general comments are noteworthy.
• Although the binder specification includes tensile strain at failure, this valuewas observed to be highly variable for modified binders. In some cases,coefficient of variation exceeded 30 percent. Coefficients of variation (CV)for tensile strength data averaged approximately 20 percent, but wereconsistently less than or equal to 10 percent for bending beam stiffness, m-value, and shear rheometer stiffness. Tensile strength rather than tensile strainmay be an appropriate specification property for modified binders because ofits smaller variability and correspondence to expected performance.
• All the binder tests could accommodate the range of modified bindersevaluated. There were no reported difficulties regarding specimen preparationor testing. Test conditions (temperature, load, rate of loading, etc.), however,may need to be adjusted to accommodate the diversity of materials for use asmodifiers.
85
• In general, the results of the A-004 experiment were inconclusive. Again, thismay have been the result of the modifier selection process, the use of unagedmaterials, or some combination thereof. Fortunately, supplemental dataprovided by other researchers (Shell, Elf, Pennsylvania State University)provided a far more encouraging picture of the efficacy of the SHRP bindertests for performance prediction.
• A comprehensive laboratory investigation with complementary controlled fieldstudies would extend and enhance the data generated by SHRP
4.4 Modified Mix Testing
As noted in Section 4.1, the scope of the research was narrowed and many responsibilitieswere shifted to the A-003A contractor. Validation testing with modified mixes was limitedto that associated with permanent deformation and fatigue cracking.
4.4.1 Permanent Deformation
The purpose of this phase of the research was to assess the influence of modifiers on thepermanent deformation characteristics of asphalt concrete mixes as measured by the constantheight repeated load simple shear test.
Three asphalts (AAD, AAG, and AAK), two aggregates (RB and RL), and four modifiers(coded M401, M412, M415, and M416) were used in the initial experimental design. Toestablish a baseline performance level, a control (i.e., unmodified) mix was prepared foreach combination of binder and aggregate. Performance comparisons were made among thevarious modified mixes as well as with the control mix.
Specimens for this study were fabricated by the A-004 contractor, Southwestern Laboratories(SWL). The Texas-modified gyratory compactor, was used to compact specimens that were15 cm (6 in.) in diameter and 15 cm (6 in.) in height. The specimens were then shipped tothe University of California at Berkeley (UCB).
Void content measurements were made on the full-sized compacted specimens and onsamples sawn into 5 cm (2 in.)-high specimens. Two procedures were used to determinevoid content: one with Parafilm and one without Parafilm. Table 4.2 contains a summary ofvoid content determinations made by both the A-004 and A-003A staff. UCB voidmeasurements made without Parafilm are similar to those made by SWL while those madewith Parafilm are significantly higher. This difference is most likely because at high voidcontent and without Parafilm, water flows freely in and out of the specimen, and air voidcontent typically is underestimated. Similar results are observed for the 5 cm (2 in.) highspecimens sawed from the 15 cm (6 in.) cylinders, as seen in Table 4.3.
86
Table 4.2. Air void content of 15 cm x 15 cm (6 in. × 6 in.) specimens
Mean 6.5 8.5 11.4Standard Deviation 0.5 2.0 2.3Coefficient of Variation 6.9 23.9 20.0(%)
II
*No Paraf'dm**With Parafdm
88
Before testing, aluminum heads that lock into the mechanism on the simple shear devicewere bonded to the top and bottom of each specimen with an epoxy cement. Aftercapping, the specimens were held in an oven at 40°C (104°F) for approximately 3.5hours to ensure temperature equilibrium. Constant height repeated load simple sheartests were performed at 40°C (104OF). Each specimen was conditioned with 100repetitions of haversine shear stress of 6.9 kPa (1 lb/in 2) (0.1 sec haversine pulse with a0.6 sec rest period between pulses). After conditioning, the specimen was subjected to arepetitive shear stress of 70 kPa (10 lb/in2). The test was terminated at 5000 load cyclesor a maximum shear strain of 5 percent, whichever came first.
In order to test mixes with similar air void content, all specimens containing the RLaggregate were deleted from the experimental design. The testing program was reducedto an evaluation of the five modifiers, one aggregate (RB), and two asphalts (AAG andAAK).
Test results are shown graphically in Figures 4.23 to 4.27. Table 4.4 shows estimatedload cycles to 4 percent strain. Significant variations in air void content occurred makingcomparisons among the mixes questionable. Based on these data an estimate of therelative performance of the mixes over a range of void contents is shown in Figure 4.28.The average load cycles to 4 percent strain (Figure 4.29) suggest the following: Mixescontaining binder AAG appeared to be more sensitive to modifiers than did mixescontaining AAK. The performance ranking of the modifiers, from good to poor, formixes containing AAG was 401, 412, 416, 415. All the modifiers except 415 performedbetter than did the unmodified/control mix. Mixes containing binder AAK were lesssensitive to the influence of the modifiers. None of the modifiers improvedperformance. The performance ranking of the modifiers, from good to poor, for mixescontaining AAK is 415, 412, 401, 416. When the measured permanent strain is takendirectly from Figures 4.23 to 4.27 (at both 100 and 1,000 load cycles), the performancerankings of the modifiers are somewhat different (Figure 4.30). For binders AAG andAAK the performance ranking (from good to poor) is 401, 412, 415, 416. Thisperformance ranking of the modifiers, despite the difference in void content is nearlyidentical to that hypothesized by the ETG, whose members were instrumental in theselection of the modifiers to be used in the validation testing.
4.4.2 Fatigue
The purpose of the research was to assess the influence of modifiers on the fatiguecharacteristics of asphalt concrete mixes as measured by the new flexural fatigueequipment.
Three asphalts (AAF, AAG, and AAK), one aggregate (RB), and three modifiers (codedM405, M415, and M416) were included in the experimental design, as shown in Table4.5. To establish a baseline performance level, a control (i.e., unmodified) mix wasprepared for each combination of binder and aggregate. Performance comparisons weremade among the various modified mixes as well as with the control mix.
Figure 4.28b. Performance of modified mixes over a range of air void contents(modified binder AAK)
96
4000[[ [_]AAG [77]AAKif)Iii_J0 3000>..z
a_<0"NLU _ 20OO
<n-
><
1000
0
CONTROL 401 412 415 416
MODIFIED MIX
Figure 4.29. Performance of modified mixes in term_ of load cycles to 4 percent strain
0.018
[] AAG [] AAKt-. o.o15 -
_z< 0.012 -
I'--
rr<: 0.009UJ"1"
,,, O'OOPr 0.003uJ(:L
0.000 -- -- __ __
CONTROL M401 M412 M415 M416
MODIFIED MIX
Figure 4.30. Performance of modified mixes in term_ of permanent shear strain
97
Table 4.5. Features of modified asphalt mix experiment
Number of asphalts 3 - MRL core asphalt AAF-1, AAG-1, and AAK-1
Number of aggregates 1 - MRL aggregate RB
Asphalt content 1 - 5.0 percent and 5.2 percent for unmodified andmodified mixes, by weight of aggregates
Number of modifiers 3 - Modifiers identified as M405, M415, and M416
Air void levels 1 - 7 ± 1 percent
Strain levels 2 - 400 and 700 # in./in.
Replicates at each strain level 2
Temperature 1 - 20"C (68°F)
Frequency 1 - 10 Hz (sinusoidal)
Specimen size 6 cm (2 in.) height, 6.25 cm (2.5 in.) width,37.5 cm (15 in.) length
Method of compaction Kneading compaction
Total number of mixes tested 10
Total number of specimens tested 39 I
98
Specimens for this study were fabricated by the A-004 contractor, SWL, using a kneadingcompactor. The compacted specimens were then shipped to UCB, where they were sawed tothe required dimensions (6.4 cmx 5 cmx 40.7 cm [2.6 in. × 2 in. x 16.3 in.]) andtested. All tests were performed at 20°C (68°F) in the controlled-strain mode with asinusoidal load at a frequency of 10 Hz. The response variables included initial flexuralstiffness measured at the 50th load cycle; fatigue life, as defined by the number of cycles toa 50 percent reduction in stiffness; initial dissipated energy per cycle measured at the 50thload cycle; and cumulative or total dissipated energy associated with fatigue life.
Table 4.6 is a summary of the data for the control and modified mixes. The control mixes,in order of decreasing stiffness, are AAG, AAF, and AAK. Figures 4.31 and 4.32 illustratethe effect of modifier type on the average stiffness and fatigue life of the various mixes. Thefatigue life of mixes containing AAK was observed to be the longest, followed by mixescontaining binders AAF and AAG. The conventional notion that stiffer mixes undercontrolled-strain testing performed poorer than their less stiff counterparts was confirmed forthe unmodified mixes. The modified mixes, however, did not follow this pattern. ModifierM405 had a detrimental effect on all mixes, regardless of binder type. Addition of thismodifier to binder AAF and AAK increased stiffness but decreased fatigue life. ModifiersM415 and M416 produced changes in performance similar to those of modifier M405 onmixes containing AAG. Addition of both modifiers reduced fatigue life, although mixstiffness decreased. For mixes containing AAK, the addition of modifiers M415 and M416increased fatigue life substantially. In both cases, mix stiffness decreased. The modifiereffects on cumulative dissipated energy were similar to those observed for fatigue life.
Though limited in extent, the results of this study indicate that both binder type and modifiertype substantially affect stiffness, fatigue life, and cumulative dissipated energy. For thicksections, the ETG ranking of the modifiers in order of decreasing fatigue life was M405,M415, and M416. Results from the controlled strain testing ranked the modifiers in exactlythe opposite order.
99
Table 4.6. Average values for stiffness, fatigue life (at 500 p in./in.), and cumulative
dissipated energy from modified asphalt mix experiment
Voids
Cumulative Dissipated filled with
Stiffness Fatigue Life (N_ Energy to Nf Voids BitumenMix Type (psi) (at 500/_ in./in.) (psi) (%) (%)
Figure 4.31b. Performance of modified mixes in terms of stiffness (by modifier)
101
800j [][] M405CONTROL[]:]]M415
I.-- L/::_M416
I0 _.___.
AAF AAG AAK
BINDER
Figure 4.32a. Performance of modified mixes in terms of fatigue life (by binder)
8OO
[] AAF [] AAG [] AAK
60O
if)'w'
cd --0t) 400UJZLLELF-09
200
o
CONTROL M405 M415 M416
MODIFIED MIX
Figure 4.32b. Performance of modified mixes in terms of fatigue life (by modifier
102
References
Anderson, D., R. Christianson, H. Bahia, R. Dongre, M. Sharma, C. Antle, and J. Button.Binder Characterization and Evaluation, Volume 3: Physical Characterization. Report no.SHRP-A-396. Strategic Highway Research Program, National Research Council,Washington, DC. 1994.
Bouldin, M., G. Row, J. Souse, and J. Shamrock (1994). Mix Rheology - a tool forpredicting the high performance of hot mix asphalt. Proceedings, Association of AsphaltPaving Technologies, Vol. 63, pp. 1-32.
Harrigan, E., R. Leahy, and J. Youtcheff. The Superpave Mix Design System Manual ofSpecifications, Test Methods and Practices. Report no. SHRP-A-379. Strategic HighwayResearch Program, National Council, Washington DC. 1994.
Kennedy, T., G. Huber, E. Harrigan, R. Cominsky, H. Von Quintus, C. Hughes, and J.Moulthrop. Superpave: The Product of the SHRP Asphalt Research Program. Report no.SHRP-A-410. Strategic Highway Research Program, National Research Council,Washington, DC. 1994.
King, S., H. King, O. Hardens, W. Arand, and Planche (1993). Influence of Asphalt Gradeand Polymer Concentration on the Low Temperature Performanceof Polymer ModifiedAsphalt. Proceedings, Association of Asphalt Paving Technologists, Volume 62, pp. 1-22.
Lytton, R.L., J. Uzan, E.G. Fernando, R. Roque, D. Hiltunen, and S.M. Stoffels.Development and Validation of Performance Prediction Models and Specifications for AsphaltBinders and Paving Mixes. Report no. SHRP-A-357. Strategic Highway Research Program,National Research Council, Washington, DC. 1993.
SHRP 1990. Asphalt: A Stragetic Plan. Report no. SHRP-A-301. Strategic HighwayResearch Program, National Research Council, Washington, DC. 1993.
SHRP 1994. Research Performed by the University of California at Berkeley; Oregon StateUniversity, and Austin Research Engineers. Stage 1 Validation of the Relationship BetweenAsphalt Properties and Asphalt-Aggregate Mix Performance. Report no. SHRP-A-398.Strategic Highway Research Program, National Research Council, Washington, DC. 1994.
103
Transportation Research Board 1986. Strategic Highway Research Program Research Plans.NCHRP Project 20-20. Transportation Research Board, National Research Council,Washington D.C.
Von Quintus, H. L., J.A. Scherocman, C.S., and T.W. Kennedy. Asphalt-AggregateMixture Analysis System. NCHRP Report 338. Transportation Research Board, NationalResearch Council, Washington, DC. 1991.