Validation of Streamflow Measurements Made with AcousticDoppler Current Profilers
Kevin Oberg1 and David S. Mueller, M.ASCE2
Abstract: The U.S. Geological Survey and other international agencies have collaborated to conduct laboratory and field validations ofacoustic Doppler current profiler �ADCP� measurements of streamflow. Laboratory validations made in a large towing basin show that themean differences between tow cart velocity and ADCP bottom-track and water-track velocities were −0.51 and −1.10%, respectively.Field validations of commercially available ADCPs were conducted by comparing streamflow measurements made with ADCPs toreference streamflow measurements obtained from concurrent mechanical current-meter measurements, stable rating curves, salt-dilutionmeasurements, or acoustic velocity meters. Data from 1,032 transects, comprising 100 discharge measurements, were analyzed from 22sites in the United States, Canada, Sweden, and The Netherlands. Results of these analyses show that broadband ADCP streamflowmeasurements are unbiased when compared to the reference discharges regardless of the water mode used for making the measurement.Measurement duration is more important than the number of transects for reducing the uncertainty of the ADCP streamflow measurement.
DOI: 10.1061/�ASCE�0733-9429�2007�133:12�1421�
CE Database subject headings: Streamflow; Validation; Acoustic techniques; Stream gaging; Discharge measurement; Field tests;Laboratory tests.
Introduction
Since the early 1990s, the U.S. Geological Survey �USGS� andother agencies around the world have used acoustic Doppler cur-rent profilers �ADCPs� to measure discharge in inland waterwaysand in estuaries �Oberg and Mueller 1994�. Pelletier �1988� re-ported that Water Survey Canada personnel make about 19,000streamflow measurements annually, and thousands more are madethroughout the world each year by government agencies andengineering firms. During the period from October 1, 2005, toSeptember 30, 2006, USGS personnel made 65,766 dischargemeasurements in the United States, 14% of which were madewith ADCPs. ADCPs are widely used for streamflow measure-ment, but are also increasingly used for mapping velocity fields�Wagner and Mueller 2001; Jacobson et al. 2004�, geomorphicresearch �Dinehart and Burau 2005; Kostachuk et al. 2004�, mea-surement of bed-load velocity �Rennie et al. 2002�, and manyother applications. Many investigators have studied the accuracyof current-meter streamflow measurements over the years; seePelletier �1988� for a comprehensive review of this accuracy.Even recently, Hubbard et al. �2001� published information onnew Price AA current-meter ratings because of the widespreaduse of these instruments in the engineering community. However,
1Hydrologist, U.S. Geological Survey, Office of Surface Water, 1201W. University Ave., Suite 100, Urbana, IL 61801-2748. E-mail:[email protected]
2Hydrologist, U.S. Geological Survey, Office of Surface Water, 9818Bluegrass Parkway, Louisville, KY 40299. E-mail: [email protected]
Note. Discussion open until May 1, 2008. Separate discussions mustbe submitted for individual papers. To extend the closing date by onemonth, a written request must be filed with the ASCE Managing Editor.The manuscript for this paper was submitted for review and possiblepublication on May 3, 2006; approved on June 7, 2007. This paper is partof the Journal of Hydraulic Engineering, Vol. 133, No. 12, December 1,
few comprehensive validations of commercially available ADCPsfor streamflow measurements have been made to date �2007�.
Purpose and Scope
The purpose of this paper is to present results of laboratory andfield validations of streamflow measurements made with ADCPsto ensure that there are no changes in long-term streamflowrecords caused by changes in equipment and measurement tech-nology. ADCP validations were made by comparing velocitiesmeasured by ADCPs to those measured with a tow cart in a tow-ing basin and by comparing streamflow measurements made withADCPs to concurrent mechanical current meter measurementsand streamflow computed from stable stage-discharge ratingcurves. Tests in towing basins are the standard method for cali-brating and validating mechanical current meters �ISO 1976�.However, the use of towing basins imposes limitations that arenot representative of field measurement conditions �no turbu-lence, artificial backscatter material, smooth bed, negligible orzero-velocity gradients in the sample volume, and other condi-tions�. Beginning in 2001, the USGS and other agencies under-took field validations for all available water modes at sites in theUnited States, Canada, Sweden, and The Netherlands. This paperpresents the results of these field validations using bottom-tracking profilers.
Previous Work
Many investigators have compared ADCP velocity measurementsto measurements made simultaneously or nearly simultaneouslywith other well-calibrated instruments. Comparisons of ADCP-measured velocities to tow-cart velocities by Shih et al. �2000�and Appell et al. �1988�, showed that the ADCPs performed at orclose to the manufacturer’s specifications. Nystrom et al. �2002�showed that mean velocities measured by commercially available
ADCP measurements were within ±1 cm/s of acoustic Doppler
velocimeter �ADV� measured velocities. Lemmin and Rolland�1997� compared velocity measurements from a custom-made sta-tionary ADCP to hot film and pitot tube velocity measurements ina laboratory flume and to velocity measurements in a shallowriver �30–60 cm deep� and found excellent agreement. Bos�1991� compared a commercially available ADCP to the SonarWork Station built by The Netherlands’ Rijkswaterstaat, andfound good correspondence between the two instruments exceptin rapidly changing flows �as much as 2.5 m/s�. The differencesobserved could be explained in part by different depth cell sizes,sampling time, and because the two instruments sampled alter-nately, not concurrently. Simpson and Oltmann �1993� comparedmany detailed velocity profile measurements with mechanicalcurrent meters on the Sacramento River at Freeport, Calif. toprofiles obtained with an ADCP. González et al. �1996� concludedthat ADCP velocity profile measurements in the center of a 49-mwide, 8-m deep canal were in good agreement with theoreticalfluid mechanics. Although ADCP velocity comparisons are use-ful, they do not address all of the potential errors in measuringstreamflow.
Morlock �1996� evaluated 1,200- and 600-kHz broadbandADCPs manufactured by Teledyne RD Instruments, Inc. �TRDI�at 12 geographically diverse sites in the United States and foundthat the ADCP discharges compared favorably with dischargemeasurements made with Price AA current meters and standardUSGS techniques �Rantz et al. 1982�. Morlock �1996� used watermode 4, which is no longer commonly used. Preliminary resultsof discharge measurement comparisons at five field sites usingwater modes 1 and 5 by Mueller �2002� indicated that ADCP-measured discharges were within ±5% of concurrent current-meter measurements. However, the data set was too small to dem-onstrate whether or not significant biases between ADCP andcurrent-meter measurements were present. Since 2001, new watermodes for velocity measurement have been introduced. Somedata collected by Mueller �2002� are included in analyses in thispaper.
Laboratory Validation
The use of towing basins for current-meter calibrations are com-mon and procedures for these calibrations are well established�ISO 1976�. The USGS, in cooperation with the South FloridaWater Management District, tested ADCPs at the Naval Centerfor Surface Warfare, David Taylor Model Basin �DTMB�, in Car-derock, Md., during March 13–16, 2000. The DTMB was chosenbecause the towing basin is much deeper and wider than theUSGS facility and because the National Oceanographic and At-mospheric Administration routinely uses this facility to evaluateperformance of ADCPs for use in its monitoring programs. Thepurpose of the measurements at DTMB in March 2000 was toevaluate the feasibility of using a large, indoor towing basin forvalidating ADCPs and to then validate ADCP velocity measure-ments for various ADCPs.
Instruments Tested
Five ADCPs were tested at the DTMB, a 1,500-kHz SonTek/YSIArgonaut SL, a 3,000-kHz SonTek/YSI acoustic Doppler profiler�ADP�, a 600-kHz TRDI Rio Grande, a 1,200-kHz TRDI Broad-band, and a TRDI prototype 3-beam horizontal 600-kHz capableof bottom tracking. Of these ADCPs, only the 3,000-kHz SonTek/
YSI ADP, the 1,200-kHz Broadband, and the 600-kHz Rio
Grande are now commonly used for streamflow measurements.Therefore, only the results obtained from these three ADCPs arepresented in this paper. All of the ADCPs used, except the Argo-naut SL, were capable of making two independent velocity mea-surements, a bottom-track �BT� velocity and a water-track �WT�velocity measurement �Simpson 2001�. The BT velocity, or thevelocity of the ADCP over the bed, is measured by the ADCPusing separate acoustic pulses that can be much longer than thewater pulse �typically 20–30% of the water depth� and is typicallyused to measure the velocity of the vessel used for making ADCPmeasurements. WT velocities are measured using short acousticpulses �5–50 cm� and backscattered sound returned to the ADCPfrom small particles moving with the water �Gordon 1996; Sim-pson 2001�. The techniques used to measure velocities vary byADCP manufacturer. SonTek/YSI uses narrow-band techniques�SonTek/YSI 2001�, whereas a broadband technique is used byTRDI �Gordon 1996�. Regardless of the techniques employed, BTmeasurements in rivers are generally more accurate than WTmeasurements, because of the much stronger acoustic reflectionsfrom the river bed.
Data Collection and Processing Methods
The towing basin at the DTMB used in this study is approxi-mately 363 m long; 15.5 m wide, and varies in depth from 3 to6.7 m �Naval Sea Systems Command 2004�. Shih et al. �2000�describe the towing basin and the test procedure used. For validWT measurements, adequate backscattering material is essential.Towing basins do not retain material in suspension because ofnegligible turbulence in the basin. It was necessary, therefore, toseed the basin with a backscattering material. The proceduresused to ensure adequate backscattering for these measurementsare described by Oberg �2002�.
Results
Limitations associated with the use of acoustics in towing tanksfor validating acoustic profilers were realized during these tests.The compass heading had to be ignored due to magnetic interfer-ence and values for the heading, pitch, and roll fixed to a constantvalue for analysis. The bed and sidewalls of the towing basin areacoustically reflective and acoustic reflections from these surfacesare present in the data. Acoustic interference, if present, is oftendifficult to detect and eliminate, and usually results in a negativebias. The intensity of signal returned to the ADCP �backscatter�appreciably varied in space and time. The beam-to-beam variationin the intensities for a given depth indicated incomplete mixing ofthe backscattering material, which is difficult to achieve in a tow-ing basin. In addition, after seeding the tow tank, intensitiestended to decrease as seeding material dropped out of the watercolumn, until such time as there was not enough intensity forvalid velocity measurements. For one depth cell, the averagebackscatter for one of the tow-tank measurements ranged from43 dB in beam 3 to 52 dB in beam 2. In contrast, for a typicalriver measurement, variation in backscatter among the four beamsis usually less than 3 dB �see Fig. 2 in Oberg �2002� for moredetails�. Acoustic backscatter changed appreciably between mea-surements. For example, the average backscatter for one beamdropped 7 dB in about 25 min for measurements made in thesame region of the towing basin.
The mean tow cart, BT, and depth-averaged WT velocities for24 comparisons are shown in Table 1. For 5 of the 24 validation
runs, only one pass was available for analysis because of prob-
07
lems encountered in recording the tow-cart velocities. Examina-tion of the reciprocal passes for the remaining 19 comparisons didnot indicate any significant variation as a result of the direction oftravel in the towing basin, therefore, the single-pass measure-ments are assumed to be unbiased and valid.
The mean of the differences between the tow-cart velocity andBT velocity ranged from −2.33 to 0.99%. The mean of the differ-ences between the tow-cart velocity and WT velocity ranged from−2.10 to −0.70%. The mean differences between tow cart velocityand ADCP BT and WT velocities for all instruments and tow-cartvelocities were −0.51 and −1.10%, respectively. The variability ofthe differences between BT and WT velocities and tow-cart ve-locity �Fig. 1� is significantly greater at lower tow-cart velocities��40 cm/s� as observed by Shih et al. �2000�. WT velocitiesshowed a small negative bias. At higher velocities, BT velocitiesalso seemed to exhibit a small negative bias. However, at lowervelocities, this bias was not as evident. The distribution of thepercent difference between BT and tow-cart velocities was moreuniform about zero at lower velocities. Greater variability at
Table 1. Selected Results of Tow-Tank Validations at the David TaylorModel Basin, Carderock, Md., March 13–16, 2000
Manufacturer Model
Velocity�cm/s�
Difference�%�
Towcart
Bottomtrack
Watertrack
Bottomtrack
Watertrack
TRDI Broadband-WM1 7.74 8.20 7.65 5.94 −1.16
TRDI Broadband-WM1 14.9 15.0 14.7 0.74 −1.28
TRDI Broadband-WM1 22.8 22.7 22.5 −0.44 −1.32
TRDI Broadband-WM1 41.1 41.0 40.9 −0.29 −0.54
TRDI Broadband-WM1 61.8 61.8 61.5 0.03 −0.53
TRDI Broadband-WM1 123 123 123 −0.24 −0.41
Mean 0.96 −0.87
TRDI Broadband-WM5 5.13 5.20 5.00 1.36 −2.60
TRDI Broadband-WM5 7.71 8.05 7.70 4.36 −0.18
TRDI Broadband-WM5 14.8 14.9 14.8 0.88 −0.47
TRDI Broadband-WM5 22.5 22.4 22.4 −0.31 −0.31
TRDI Broadband-WM5 61.7 61.7 61.5 −0.05 −0.37
TRDI Broadband-WM5 82.4 82.1 82.1 −0.35 −0.35
Mean 0.99 −0.70
TRDI Rio Grande-WM1 7.60 7.10 7.60 −6.58 0.00
TRDI Rio Grande-WM1 15.0 14.2 14.7 −5.08 −1.74
TRDI Rio Grande-WM1 22.8 22.1 22.4 −2.64 −1.76
TRDI Rio Grande-WM1 61.9 61.8 61.5 −0.16 −0.57
TRDI Rio Grande-WM1 124 121 123 −1.71 −0.45
TRDI Rio Grande-WM1 185 185 184 −0.04 −0.69
TRDI Rio Grande-WM1 309 308 308 −0.15 −0.23
Mean −2.33 −0.78
SonTek ADP 7.78 7.60 7.36 −2.34 −5.44
SonTek ADP 22.7 23.0 22.6 1.45 −0.37
SonTek ADP 61.9 59.8 60.3 −3.32 −2.53
SonTek ADP 123 121 121 −2.34 −1.87
SonTek ADP 308 305 304 −0.95 −1.48
Mean −1.50 −2.10
Note: WM�water mode; bottom track�velocity as measured by theADCP using bottom tracking; and water track�velocity as measured bythe ADCP using water tracking.
slower velocities is expected as the uncertainty in the velocity
JOURNAL
measurement relative to the cart velocity is greater at these slowerspeeds. For tow-cart velocities greater than 40 cm/s, velocity dif-ferences were significantly less.
Normally, BT velocity measurements are more accurate thanWT measurements primarily because the streambed is a goodreflector of acoustic energy. However, analysis of measurementsat DTMB with TRDI ADCPs indicated a greater absolute error inBT than in WT. This result can be explained by the difference inthe scattering of sound energy from a natural streambed and asmooth concrete towing basin. Terrain bias in BT measurementsis exacerbated over smooth surfaces �such as a towing basin� andtends to bias BT velocities low �Steve Maier, TRDI, private com-munication, 2006�. BT measurements in natural streams wherethe bed roughness is greater and sound scattering is less uniformresult in lower terrain bias than BT measurements in a smoothtank like DTMB. Two tests were conducted with the Rio GrandeADCP in which the tow carriage was not moved, while both towcart and ADCP velocities were recorded. Mean measured BT ve-locities were 0.62 cm/s, mean measured WT velocities and tow-cart velocities were zero; another indication of less accurate BTmeasurements in towing basins with a smooth bed. Shih et al.�2000� observed the same result for BT measurements at DTMB.
Field Validation
One of the most common uses of ADCPs is the measurement ofstreamflow. Laboratory validations, similar to those discussed ear-lier, provide information about WT and BT velocities measuredusing an ADCP but the limitations and problems discussed earlierimply that these types of measurements are not necessarily repre-sentative of the field environment. Therefore it is necessary tovalidate ADCP measurements in the field while using all theADCP sensors �heading, tilt, and water temperature� and mea-surements �boat velocity, water velocity, and depth� required tomake an ADCP streamflow measurement in a natural backscatterenvironment. Further, it is also necessary to determine whetherany discernible bias is present between ADCP discharge measure-ments and those made using conventional discharge measurementmethods �Rantz et al. 1982; ISO 1979� commonly used by orga-
Fig. 1. Differences between tow-cart velocity and ADCP measuredvelocity
Field validation of ADCP discharge measurements was conductedwith ADCPs manufactured by TRDI and SonTek/YSI at 22 sites.Validation data were collected with TRDI 600- and 1,200-kHzWorkhorse Rio Grande ADCPs, using water modes 1, 5, 11, and12. Although data were collected using SonTek/YSI ADCPs,these data are not included in the present analysis because im-provements in SonTek/YSI firmware were not reflected in theavailable data. Additional field validation measurements withSonTek/YSI ADCPs are planned and these data will be analyzedwith the results reported later.
Description of Sites
Sites for field validation measurements were selected to provide avariety of measuring conditions and to facilitate comparison ofsimultaneous measurement of discharge using ADCPs and me-chanical current meters. Sites chosen for this study �Table 2� in-cluded 18 sites in the United States, 2 sites in Canada, and 1 siteeach in Sweden and The Netherlands. The streams selected wereupland rivers near continuous-record streamflow-gauging stationswhere flow was steady and not subject to tidal or backwater ef-fects. Some sites were located near control structures �Burl, Mars,Virg, Well, and Wolf� that are used to regulate flow in the stream.For some of these sites, flow was not steady during validations,requiring concurrent comparison measurements.
The drainage areas for the sites used for validations rangedfrom 772 to 1,840,000 km2. Measured stream widths ranged from7.2 to 499 m; mean depths ranged from 0.48 to 9.00 m. Although
Table 2. Locations of ADCP Field Validations
Site ID Station No. Station name
Älgån — Älgån River near Arvika, Sweden
Algon 05550000 Fox River at Algonquin, Ill.
Alley 07065495 Jacks Fork at Alley Spring, Mo.
Burl 07182510 Neosho River at Burlington, Kan.
Chest 07020500 Mississippi River at Chester, Ill.
Cov 03336000 Wabash River at Covington, Ind.
Driel NR890625 Lower Rhine River at Driel, The Netherlands
Dunns 05517500 Kankakee River at Dunns Bridge, Ind.
Emin 07066000 Jacks Fork at Eminence, Mo.
Fisk 07040000 St. Francis River at Fisk, Mo.
Frank 03289500 Elkhorn Creek near Frankfort, Ky.
Benton 06090800 Missouri River at Fort Benton, Mont.
Mars 05543500 Illinois River at Marseilles, Ill.
Mont 05551540 Fox River at Montgomery, Ill.
Sauble 02FA001 Sauble River at Sauble Falls, Ont.
Shelby 05518000 Kankakee River at Shelby, Ind.
Sidney 06329500 Yellowstone River near Sidney, Mont.
TerHte 03341500 Wabash River at Terre Haute, Ind.
Virg 06109500 Missouri River at Virgelle, Mont.
Well — Welland Supply Canal near Port Colborne, O
Willet — Willet Bridge near Intake, Mont.
Wolf 06177000 Missouri River near Wolf Point, Mont.
Note: —�data not available.
stream slope and roughness data were not available for most of
the sites, the streams used for validation measurements rangedfrom channelized low-slope streams, such as Dunns Bridge, tonatural higher-sloped streams, such as Älgån.
Data Collection and Processing Methods
ADCP validation measurements were made for four water modesavailable in TRDI ADCPs �modes 1, 5, 11, and 12�. Mode 1 is thedefault water mode and is available in all TRDI ADCPs and canbe used in a wide range of flow conditions. Modes 5 and 11 areused in shallow ��4 m for a 1,200-kHz ADCP and �8 m for a600-kHz ADCP� and slow flows �typically �1 m/s�. Mode 12makes use of the same measurement technique as Mode 1, but thedata are processed differently and allow for more accurate veloc-ity measurements than Mode 1. More detailed information regard-ing each water mode is provided in subsequent sections.
A detailed procedure for collecting data was followed at eachsite, based on procedures outlined by Oberg et al. �2005, pp.12–19�, but adapted for the comparison measurements being con-ducted. This procedure included making an independent water-temperature measurement, calibrating the compass of each ADCP,carefully measuring the immersion depth of the ADCP, and re-cording the results of ADCP diagnostic tests. Both manned boatsand tethered boats �Rehmel et al. 2003� were used for data col-lection. Moving-bed tests were conducted at each site to deter-mine whether the ADCP measurements would be affected bymoving bed �Oberg et al. 2005, p. 15�. Start and end locationswere identified and marked at a distance measured from the shorethat permitted at least two depth cells to be recorded by the
Latitude Longitude
Drainagearea
�km2�Year of
validation No. of transects
60.150 12.500 — 2003 11
42.166 −88.290 3,630 2004 97
37.148 −91.443 772 2004 24
38.195 −95.735 7,880 2003 80
37.904 −89.836 1,840,000 2001–2002 50
40.140 −87.407 21,300 2004 16
51.969 5.819 185,000 2004 42
41.219 −86.969 3,500 2001 12
37.154 −91.358 1,030 2004 84
36.781 −90.202 3,550 2004 24
38.269 −84.815 1,230 2002 82
47.817 −110.667 64,100 2003 48
41.327 −88.718 21,400 2001 28
41.734 −88.333 4,490 2004 163
44.511 −81.256 927 2003 4
41.183 −87.340 4,610 2001 12
47.678 −104.157 179,000 2003 16
39.476 −87.419 31,800 2004 17
48.005 −110.258 89,000 2003 22
42.894 −78.750 — 2004 147
47.310 −104.491 — 2003 28
48.067 −105.532 213,000 2003 25
nt.
ADCPs tested. Buoys were used to mark start and end locations
07
for measurements made with manned boats. Approximately 10 sof data were collected from a nearly stationary position at thebeginning and end of each transect, in order to obtain more accu-rate estimates of the near-shore velocity for estimating the edgedischarge. The stream was traversed at a boat speed less than orequal to the downstream speed of the water. Where possible, 12or more transects were collected with each ADCP and configura-tion. However, at some sites only 4 transects were collected for aspecific configuration. This procedure was repeated until datawere collected with each of the available instruments and watermodes appropriate for the site.
A current meter was used to make one or two streamflowmeasurements simultaneously with the ADCPs at each site andthe resulting discharge used for comparison with ADCP-measureddischarges. Price AA current meters were used for comparisonmeasurements made in the United States and Canada. The perfor-mance of each current meter was evaluated in a USGS or Envi-ronment Canada towing basin. All the current meters were withinspecifications with the exception of one meter that was biased 1 to2% high. Salt dilution measurements using the finite mass dilu-tion method �Okunishi et al. 1992� were made at Älgån usingstandard procedures used by the Norwegian Water Resources andEnergy Directorate �NVE�. Data collected at Driel were comparedwith streamflow computed from a four-path travel-time acousticvelocity meter located at this site.
At some sites, many different validation measurements weremade using different water modes and configurations. For manyof the validation measurements, concurrent current meter or dilu-tion streamflow measurements were not available for all of theADCP validation measurements. For these situations, the current-meter measurement was compared to the rating for that site. If thecurrent meter measurement agreed within approximately 2% ofthe rated discharge, the rated discharge was used for comparisonwith ADCP measurements. If the current meter did not agreewithin 2% of the rated discharge, the ADCP data that were notcollected concurrent with the current-meter measurement werenot included in this analysis.
All ADCP data were analyzed and reviewed using TRDI’sWinRiver software version 10.06 in order to identify any dataquality issues or to correct any mistakes in data entry in the field.Procedures for data review suggested by Oberg et al. �2005, pp.21–23� were followed. The extrapolation techniques for the topand bottom discharges were reviewed by means of the WinRiversoftware and an appropriate extrapolation method was chosen foreach measuring section or site. The 1/6th power law �TRDI 2003;Chen 1991� was used for the top and bottom discharge extrapo-lations for all data sets, except at two sites. The constant method�TRDI 2003� was used to estimate the top discharge and the 1/6thpower law was used to extrapolate the bottom discharge for datacollected at Burlington and Montgomery, for the upstream mea-suring section �Table 2�. The velocity data at the beginning andend of each transect were reviewed. Where necessary, the startingand ending points of the transects were adjusted to obtain a properedge estimate.
Test Results
The percent difference between discharges measured with anADCP and the reference discharge were computed assuming that
the reference discharge was the “true” value.
JOURNAL
Mode 1Water mode 1 �WM1� is a general purpose water mode for TRDIADCPs �TRDI 2000�. WM1 is typically used in streams with amean depth deeper than 1 m and/or with velocities exceeding1 m/s. WM1 measures the Doppler shift using two phase-codedbroadband pulses separated by a lag that is dependent on theuser-specified ambiguity velocity. The lag is inversely propor-tional to the radial ambiguity velocity, the maximum relative ra-dial velocity �including boat speed and water speed� that can beaccurately measured with the ADCP. The recommended radialambiguity velocity range is from 175 to 700 cm/s �the minimumrecommended value during some of the testing was 170 cm/s�.The bin size and lag between the pulses, and, thus, the ambiguityvelocity, are key variables in determining the standard deviationof the random instrument noise present in velocity measurements.The recommended and commonly used bin sizes for 600- and1,200-kHz instruments are 50 and 25 cm, respectively. Standarddeviations of instrument noise for these bin sizes range between13 and 22 cm/s, depending on the radial ambiguity velocityvalue. The standard deviations will increase dramatically forsmaller bin sizes.
The evaluation data set for WM1 contains 28 measurementsmade at 11 different sites using different field crews and instru-ments �Table 3�. These measurements represent mean depths,mean velocities, and channel widths ranging from 1.2 to 9.0 m,from 0.5 to 1.5 m/s, and from 20 to 500 m, respectively. Stream-flows ranging from 20 to over 5,000 m3/s were obtained fromaveraging between 4 and 16 transects. The reference measure-ments consist of 14 current meter measurements, 11 dischargesdetermined from rating curves, and 3 discharges measured by anAVM. The mean and median percent difference between theADCP and reference discharges is 0.5% with a maximum differ-ence of 5.63%. Graphical analysis of, and a single sample t-teston, the percent differences �Fig. 2�a� showed that the WM1 datawere not biased relative to the reference measurements.
The WM1 data were analyzed for relations between the per-cent differences between the ADCP and reference discharges andselected site and measurement characteristics �Fig. 3�. No strongcorrelations between the percent difference and the selected char-acteristics were observed. Although some weak correlations ap-pear to be present, they are likely the result of the four largeststreamflow measurements all being from the same site. Therefore,streamflow measured using an ADCP with WM1 compare wellwith reference discharges determined by current-meter methodswith no statistical bias evident in the data presented here.
Modes 5/11Water modes 5 and 11 are pulse-to-pulse coherent modes. LikeWM1, two pulses are transmitted, but unlike WM1, the lag be-tween the pulses for WM5 and WM11 is long and variable. Thelag is equal to the time for the first pulse to travel to the bottomand back. After the signal from the first pulse is received at thetransducer face, the ADCP transmits the second pulse. This ap-proach creates a very long lag with extremely low instrumentnoise, typically less than 2 cm/s with bin sizes of 5 and 10 cm for1,200- and 600-kHz instruments, respectively. Because of thelong lag, the ambiguity velocity is very low and could render themodes nearly useless, but an ambiguity resolving bin is used tohelp resolve the ambiguity and allow a lower ambiguity velocitythan the actual water velocity �TRDI 2000�. The time dilationtechnique used to determine the velocity in the ambiguity resolv-ing bin and the bin-to-bin tracking algorithm used to apply the
ambiguity velocity to consecutive bins limits the use of WM5 and
WM11 to conditions with low turbulence and low shear. Shearcaused by coarse bed material or other conditions will often causethese modes to fail. Because of the short pulses and long lag,WM5 and WM11 are limited to shallow depths ��4 m for1,200 kHz and 8 m for 600 kHz� and slow velocities �typically�1 m/s�.
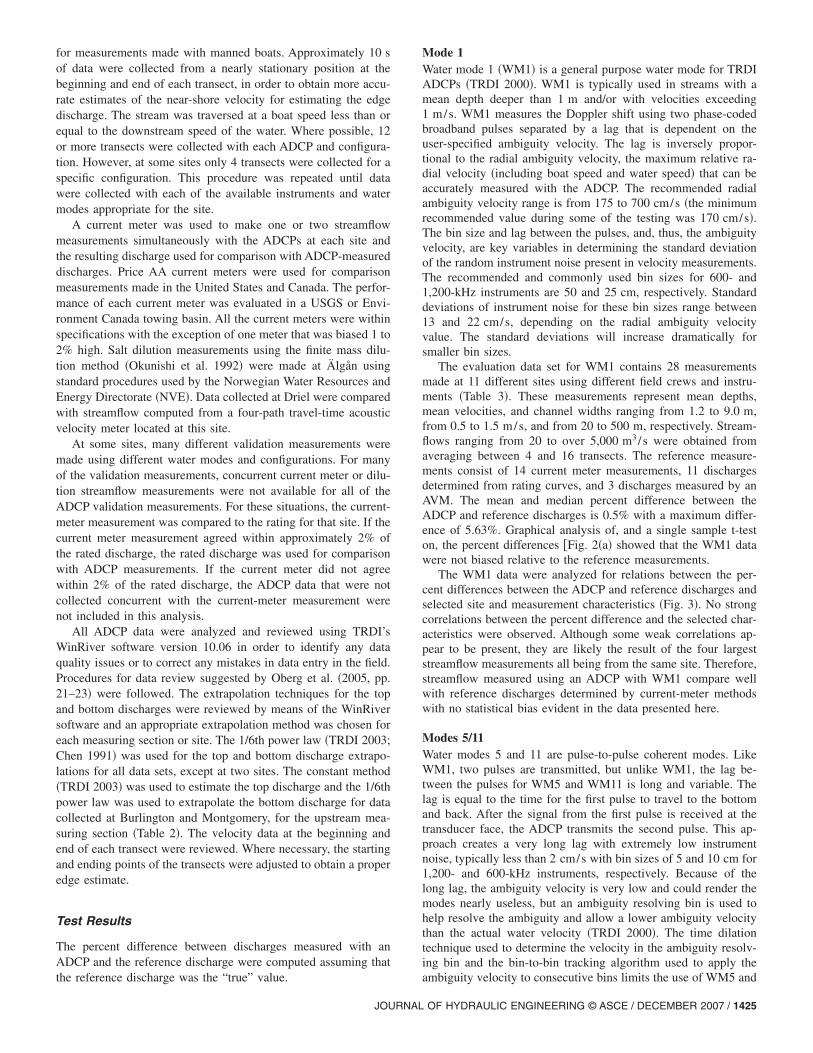
The evaluation data set for WM5 and WM11 contains 11 mea-surements made at 6 different sites using different field crews andinstruments �Table 4�. These measurements represent meandepths, mean velocities, and channel widths ranging from 0.6 to2.4 m, from 0.1 to 0.5 m/s, and from 7 to 105 m, respectively.Measured streamflow ranged from 1.93 to 44.3 m3/s and werecomputed as the average of between 6 and 12 transects. The ref-erence measurements for comparison purposes consist of fivecurrent-meter measurements, one salt-dilution measurement, andfive discharges determined from rating curves. The mean and me-dian percent difference between the ADCP and reference dis-charges were 0.33 and −0.77, respectively; but both were lessthan 1%. Although the maximum percent difference was 7.09%,only one other measurement �5.08%� exceeded a difference of4%. Graphical analysis of, and a single sample t-test on, the per-cent differences �Fig. 2�b�� showed that the WM5 and WM11 data
Table 3. Summary of ADCP Validation Measurements Made with Water
SiteID
No. oftransects
Instrumentconfiguration
ADCPQ �m3/s�
RefQ �m3/s�
Rty
Frq�kHz�
WS�cm�
WV�cm/s�
Burl 8 1,200 25 170 144 144 R
Burl 8 1,200 10 170 145 144 R
Burl 8 1,200 25 170 142 144 R
Chest 12 600 50 170 5,420 5,580 A
Chest 4 600 50 170 5,360 5,580 A
Chest 12 600 50 188 3,140 3,120 A
Chest 12 600 50 188 3,110 3,120 A
Driel 10 600 50 350 201 200 AV
Driel 22 600 50 350 197 196 AV
Driel 10 600 50 350 200 199 AV
Dunns 12 1,200 25 170 23.0 22.6 A
Benton 4 1,200 25 170 135 128 R
Benton 4 1,200 25 170 126 122 R
Benton 4 1,200 25 170 94.2 91.5 R
Benton 4 1,200 25 170 93.6 91.5 R
Mars 12 1,200 25 170 223 219 R
Mars 16 1,200 25 170 226 220 R
Shelby 12 1,200 25 170 29.6 29.8 A
Sidney 4 1,200 25 170 117 116 R
Virg 4 1,200 25 170 121 125 R
Well 22 1,200 25 205 158 150 A
Well 22 1,200 25 170 194 195 A
Well 22 1,200 25 170 204 207 A
Well 8 1,200 25 170 156 150 A
Well 20 1,200 25 170 187 187 A
Well 16 1,200 25 170 218 220 A
Well 13 1,200 25 170 257 267 A
Willet 4 1,200 25 170 20.5 20.5 A
Note: ID�identification; No.�number; Frq.�frequency; WS�bin size;rating curve; AA�Price AA current meter; AVM�acoustic velocity metervel�velocity; and Dur�duration.
were not biased relative to the reference measurements.
The WM5 and WM11 data were analyzed for relations be-tween the percent differences between the ADCP and referencedischarges and selected site and measurement characteristics �Fig.3�. There was no evidence of strong correlations between thepercent difference and the selected characteristics. Therefore, dis-charges measured using an ADCP with WM5 and WM11 com-pare well with reference discharges determined by current-metermethods with no statistical bias evident in the data presented here.
Mode 12WM12 is essentially a high ping rate WM1. WM12 is designed sothat the heading, pitch, and roll sensors are only read at the be-ginning of the averaging period, the individual pings are averagedin phase space, and only the average is transformed into watervelocities. This design eliminates some of the processing over-head and potential for averaging ambiguity velocity errors asso-ciated with WM1. The ping rate for WM1 is approximately 2 to3 Hz whereas the ping rate for WM12 is 10–20 Hz �dependingon number of bins�. However, because the heading pitch and rollsensors are sampled only at the beginning of the averaging period,changes in heading, speed, pitch, or roll will lead to errors in themeasured velocity. Thus, it is important that the sampling period
1
ifference�%�
ADCPQ
COV �%�Width�m�
Meandepth�m�
Max.depth�m�
Meanvel
�m/s�
Maxvel
�m/s�Dur
�min�
−0.29 1.79 37.4 2.56 4.36 1.50 3.27 3.27
0.46 2.61 37.2 2.61 4.40 1.49 4.08 4.08
−1.33 1.98 36.7 2.58 4.35 1.50 3.05 3.05
−2.82 0.94 499 9.00 14.77 1.26 4.27 4.27
−4.00 0.83 494 8.92 14.64 1.27 2.81 2.81
0.68 0.72 488 6.19 12.28 1.08 2.32 2.32
−0.15 1.13 486 6.17 12.33 1.08 2.76 2.76
0.79 4.90 113 4.63 5.83 0.39 1.23 1.23
0.55 7.41 111 4.54 6.61 0.39 1.56 1.56
0.46 4.50 110 4.76 5.92 0.38 1.25 1.25
1.54 1.78 29.4 1.61 2.18 0.49 1.58 1.58
5.15 1.37 140 1.57 2.44 0.61 1.86 1.86
2.98 0.52 141 1.55 2.35 0.58 1.73 1.73
2.99 2.93 135 1.46 2.27 0.48 2.14 2.14
2.37 2.27 134 1.45 2.24 0.48 1.79 1.79
1.58 6.06 120 1.94 3.13 0.96 2.26 2.26
2.79 3.65 120 1.95 2.96 0.97 2.74 2.74
−0.52 2.37 40.4 1.40 1.78 0.52 1.81 1.81
0.62 1.20 170 1.47 2.76 0.47 1.50 1.50
−3.32 3.40 155 1.16 1.94 0.67 2.01 2.01
5.63 2.26 37.9 5.48 5.81 0.76 2.14 2.14
−0.65 2.04 36.4 5.46 5.83 0.98 2.75 2.75
−1.25 2.33 36.3 5.50 5.84 1.02 3.06 3.06
3.46 2.05 39.7 5.41 5.86 0.72 2.43 2.43
−0.01 1.48 39.5 5.35 5.87 0.88 2.59 2.59
−1.05 2.95 36.7 5.42 7.18 1.10 3.03 3.03
−3.52 4.95 36.6 5.41 5.82 1.30 3.00 3.00
−0.16 0.99 19.7 1.90 2.87 0.55 1.63 1.63
ambiguity velocity; Q�discharge; Ref�reference; R�stage-dischargerating; Diff�difference; COV�coefficient of variation; Max�maximum;
Mode
efpe
D
A
A
A
A
M
M
M
A
A
A
A
A
A
A
A
A
A
WV�index
be short, generally 1 s or less. WM12 can be used anywhere
07
WM1 can be used, provided the ambiguity velocity is set properlyas in WM1. The velocity standard deviation for WM12 cannot bestated as broadly as for the other water modes because WM12 ismore configurable and the velocity standard deviation is depen-dent on the sampling period, the bin size, the number of pings fitinto the sampling period, and the ambiguity velocity.
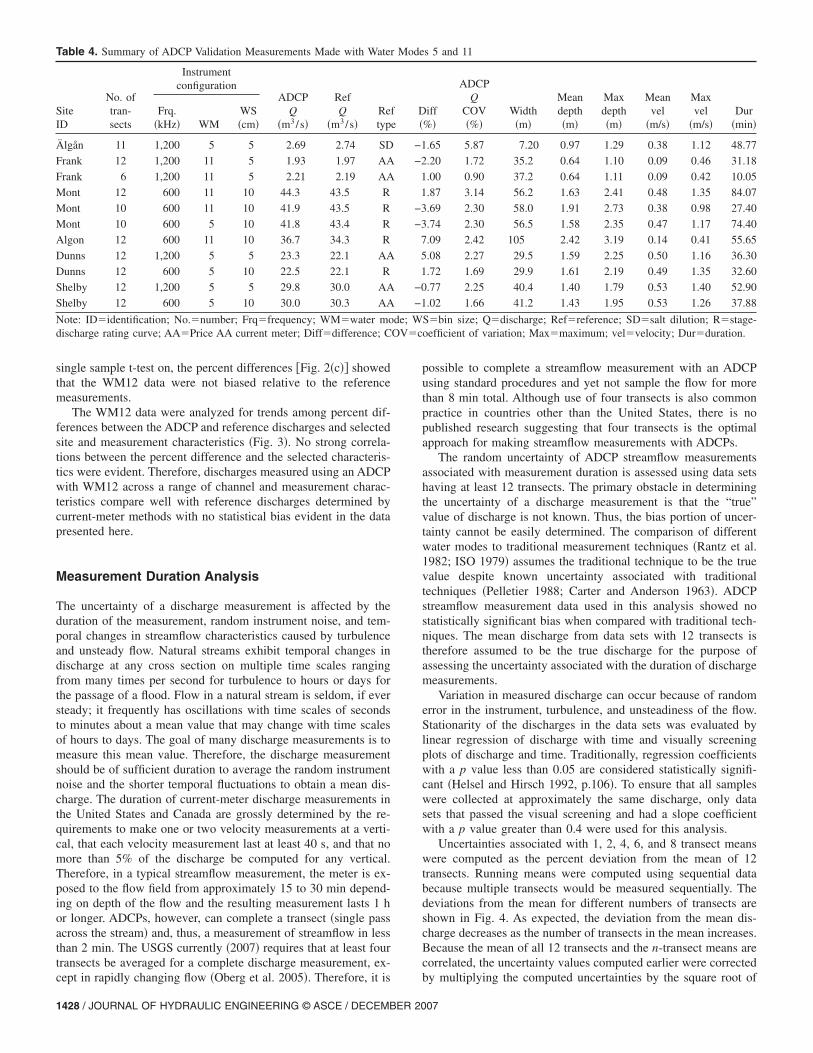
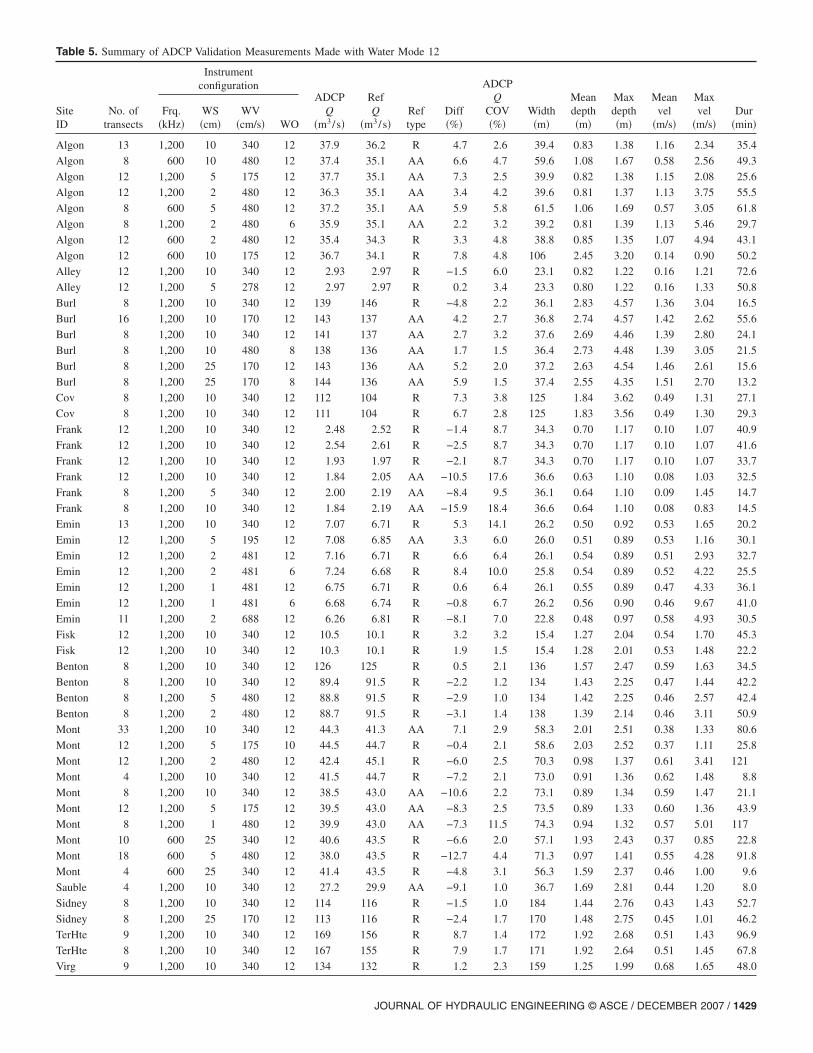
The evaluation data set for WM12 contains 61 measurementsmade at 16 different sites using different field crews and instru-ments �Table 5�. These measurements represent mean depths,mean velocities, and channel widths ranging from 0.5 to 5.3 m,
Fig. 2. Probability density plots of the percent difference between ADplots showing the relation between ADCP and reference discharges w
Fig. 3. Scatter plots and correlation coefficients for selected variadischarges for water modes 1, 5/11, and 12
JOURNAL
0.1 to 1.5 m/s, and 15.4 to 184 m, respectively. Measuredstreamflow ranged from 1.84 to 198 m3/s and were computed asthe average of between 4 and 33 transects across the stream. Thereference measurements consist of 23 current-meter measure-ments and 38 discharges determined from rating curves. Themean and median percent difference between the ADCP and ref-erence discharges were different, −0.14 and 0.50%, respectively;but both were less than 1%. The difference between the ADCPdischarge and the reference discharge ranged from −15.9 to 8.7%,and the standard deviation was 5.8%. Graphical analysis of, and a
reference discharges with normal distributions overlayed and scatteres of perfect agreement
mpared with the percent difference between ADCP and reference
single sample t-test on, the percent differences �Fig. 2�c�� showedthat the WM12 data were not biased relative to the referencemeasurements.
The WM12 data were analyzed for trends among percent dif-ferences between the ADCP and reference discharges and selectedsite and measurement characteristics �Fig. 3�. No strong correla-tions between the percent difference and the selected characteris-tics were evident. Therefore, discharges measured using an ADCPwith WM12 across a range of channel and measurement charac-teristics compare well with reference discharges determined bycurrent-meter methods with no statistical bias evident in the datapresented here.
Measurement Duration Analysis
The uncertainty of a discharge measurement is affected by theduration of the measurement, random instrument noise, and tem-poral changes in streamflow characteristics caused by turbulenceand unsteady flow. Natural streams exhibit temporal changes indischarge at any cross section on multiple time scales rangingfrom many times per second for turbulence to hours or days forthe passage of a flood. Flow in a natural stream is seldom, if eversteady; it frequently has oscillations with time scales of secondsto minutes about a mean value that may change with time scalesof hours to days. The goal of many discharge measurements is tomeasure this mean value. Therefore, the discharge measurementshould be of sufficient duration to average the random instrumentnoise and the shorter temporal fluctuations to obtain a mean dis-charge. The duration of current-meter discharge measurements inthe United States and Canada are grossly determined by the re-quirements to make one or two velocity measurements at a verti-cal, that each velocity measurement last at least 40 s, and that nomore than 5% of the discharge be computed for any vertical.Therefore, in a typical streamflow measurement, the meter is ex-posed to the flow field from approximately 15 to 30 min depend-ing on depth of the flow and the resulting measurement lasts 1 hor longer. ADCPs, however, can complete a transect �single passacross the stream� and, thus, a measurement of streamflow in lessthan 2 min. The USGS currently �2007� requires that at least fourtransects be averaged for a complete discharge measurement, ex-
Table 4. Summary of ADCP Validation Measurements Made with Water
SiteID
No. oftran-sects
Instrumentconfiguration
ADCPQ
�m3/s�
RefQ
�m3/s�Reftyp
Frq.�kHz� WM
WS�cm�
Älgån 11 1,200 5 5 2.69 2.74 SD
Frank 12 1,200 11 5 1.93 1.97 AA
Frank 6 1,200 11 5 2.21 2.19 AA
Mont 12 600 11 10 44.3 43.5 R
Mont 10 600 11 10 41.9 43.5 R
Mont 10 600 5 10 41.8 43.4 R
Algon 12 600 11 10 36.7 34.3 R
Dunns 12 1,200 5 5 23.3 22.1 AA
Dunns 12 600 5 10 22.5 22.1 R
Shelby 12 1,200 5 5 29.8 30.0 AA
Shelby 12 600 5 10 30.0 30.3 AA
Note: ID�identification; No.�number; Frq�frequency; WM�water modischarge rating curve; AA�Price AA current meter; Diff�difference; C
cept in rapidly changing flow �Oberg et al. 2005�. Therefore, it is
possible to complete a streamflow measurement with an ADCPusing standard procedures and yet not sample the flow for morethan 8 min total. Although use of four transects is also commonpractice in countries other than the United States, there is nopublished research suggesting that four transects is the optimalapproach for making streamflow measurements with ADCPs.
The random uncertainty of ADCP streamflow measurementsassociated with measurement duration is assessed using data setshaving at least 12 transects. The primary obstacle in determiningthe uncertainty of a discharge measurement is that the “true”value of discharge is not known. Thus, the bias portion of uncer-tainty cannot be easily determined. The comparison of differentwater modes to traditional measurement techniques �Rantz et al.1982; ISO 1979� assumes the traditional technique to be the truevalue despite known uncertainty associated with traditionaltechniques �Pelletier 1988; Carter and Anderson 1963�. ADCPstreamflow measurement data used in this analysis showed nostatistically significant bias when compared with traditional tech-niques. The mean discharge from data sets with 12 transects istherefore assumed to be the true discharge for the purpose ofassessing the uncertainty associated with the duration of dischargemeasurements.
Variation in measured discharge can occur because of randomerror in the instrument, turbulence, and unsteadiness of the flow.Stationarity of the discharges in the data sets was evaluated bylinear regression of discharge with time and visually screeningplots of discharge and time. Traditionally, regression coefficientswith a p value less than 0.05 are considered statistically signifi-cant �Helsel and Hirsch 1992, p.106�. To ensure that all sampleswere collected at approximately the same discharge, only datasets that passed the visual screening and had a slope coefficientwith a p value greater than 0.4 were used for this analysis.
Uncertainties associated with 1, 2, 4, 6, and 8 transect meanswere computed as the percent deviation from the mean of 12transects. Running means were computed using sequential databecause multiple transects would be measured sequentially. Thedeviations from the mean for different numbers of transects areshown in Fig. 4. As expected, the deviation from the mean dis-charge decreases as the number of transects in the mean increases.Because the mean of all 12 transects and the n-transect means arecorrelated, the uncertainty values computed earlier were corrected
the quantity �12/ �12-n��. The range of uncertainty at 2 SD asso-ciated with 1, 2, 4, 6, and 8 transect means are ±12.5, 7.6, 5.4,4.4, and 4.2%, respectively. Thus, the 4-transect average com-pares well with the commonly stated accuracy of ±5% for dis-charge measurements.
Analysis of these data shows that the uncertainty is more de-pendent on the duration of the measurement, which would beanalogous to the sampling time for a current-meter measurement,than on the number of transects collected. The duration for eachmean was computed by summing the durations of the transectsused in the mean. Uncertainty associated with means comprisedof fewer transects with longer total durations is often less than theuncertainty associated with means comprised of more transectswith a shorter total duration �Fig. 5�. Channel width initially ap-peared to be correlated with depth and duration �correlation coef-ficients of 0.85 and 0.74, respectively�. This correlation couldindicate that duration was simply serving as a surrogate for one ofthe other variables. Removing Mississippi River data, which ismuch wider and deeper than other rivers represented in the analy-sis, reduced the correlation coefficients between width and depth
Table 5. �Continued.�
SiteID
No. oftransects
Instrumentconfiguration
ADCPQ
�m3/s�
RefQ
�m3/s�Frq.
�kHz�WS�cm�
WV�cm/s� WO
Virg 9 1,200 5 480 12 144 140
Well 24 1,200 25 170 12 198 194
Willet 8 1,200 10 340 12 20.1 20.5
Willet 8 1,200 25 170 12 20.1 20.5
Willet 8 1,200 5 170 12 20.4 20.5
Wolf 8 1,200 10 340 12 126 125
Wolf 8 1,200 25 170 12 125 125
Wolf 9 1,200 5 170 12 129 126
Note: ID�identification; No�number; Frq�frequency; WS�bin size�reference; R�stage-discharge rating curve; AA�Price AA current m�velocity; Dur�duration.
Fig. 4. Boxplot of the deviations from the mean of discharge mea-surements based on varying numbers of transects
and width and duration to 0.30 and 0.37, respectively. The resultsdisplayed in Fig. 5 remained unchanged. Therefore, the uncer-tainty associated with a discharge measurement is better describedby the duration of the measurement than the number of transectsincluded in the measurement.
Additional scatter along the upper and lower fringes of thetrend shown in Fig. 5 may be realized if the instrument noise ishigh relative to the mean velocity of the flow. For instrumentnoise to velocity ratios greater than one, a measurement of aspecified duration would have greater uncertainty. Measurementswith these characteristics would not be made during routine op-eration, except for very low-flow conditions. However, some ofthe field validation measurements were specifically configured totest the limits of the instrument and resulted in instrument noise tomean velocity ratios exceeding one. These measurements havenot been included in Fig. 5.
Traditional current-meter measurements with 40-s sampletimes and approximately 25 verticals result in measurement dura-tions from 920 to 1,840 s and based on published uncertaintyanalyses have an uncertainty at 2 SD of about 5.5% �Pelletier1988; Carter and Anderson 1963�. The uncertainty associatedwith ADCP measurements based on the data and analysis pre-sented here for measurement durations from 500 to 1,000 s, from1,000 to 1,500 s, and from 1,500 to 2,000 s are ±2.4, 1.8, and1.2%, respectively. These values are for 2 SD with data havinginstrument noise ratios to mean velocity less than 1. If all dataincluding those with high instrument noise to mean velocity ratiosare included, the uncertainty increases to ±4.4, 3.2, and 3.0% formeasurement durations from 500 to 1,000 s, from 1,000 to1,500 s, and from 1,500 to 2,000 s, respectively.
The results of the above-presented analyses indicate that re-ductions in uncertainty of ADCP streamflow measurements aremore dependent on the duration of the measurement than thenumber of transects made per ADCP streamflow measurement.On the basis of statistical analysis of the data presented herein�which are not necessarily representative of all flow conditionswhere ADCPs may be used� an uncertainty of ±5% in the mea-sured discharge should be achieved by ADCP measurements witha duration of at least 720 s, regardless of the number of transectsmade. A minimum of two transects should be made �with mea-surement duration for all transects �720 s� in order to minimizethe possibility of directional bias in ADCP measured streamflow.
Diff�%�
ADCPQ
COV�%�
Width�m�
Meandepth�m�
Maxdepth�m�
Meanvel
�m/s�
Maxvel
�m/s�Dur
�min�
3.5 2.5 160 1.34 2.05 0.67 2.48 48.0
1.7 1.7 40 5.33 5.82 0.92 2.54 62.2
−2.2 1.2 19.7 1.98 2.87 0.52 1.43 19.5
−2.1 2.9 19.9 1.87 2.87 0.54 0.92 12.5
−0.8 2.6 19.6 1.95 2.86 0.53 1.26 14.4
0.5 0.6 131 1.54 2.13 0.62 1.55 36.1
−0.3 0.9 130 1.51 2.11 0.64 1.16 33.9
2.2 0.5 134 1.53 2.14 0.63 1.59 54.7
�ambiguity velocity; WO�number of subpings; Q�discharge; RefDiff�difference; COV�coefficient of variation; Max�maximum; vel
Reftype
R
AA
AA
AA
AA
R
R
R
; WVeter;
The writers plan to explore this issue in more detail with addi-
07
tional field validation measurements for a variety of ADCPs witha view to developing protocols for future measurements.
Conclusions
Laboratory validations made in a large towing basin show that forADCPs used for streamflow measurements the mean differencesbetween tow-cart velocity and ADCP BT and WT velocities were−0.51 and −1.10%, respectively. Laboratory validations are sub-ject to limitations caused by inadequate and changing backscatterconditions, acoustically bright surfaces that can result in contami-nation of velocity measurements, and compass and pitch-roll sen-sors that must be fixed to constant values.
Field validations of commercially available ADCPs were alsoconducted by comparing streamflow measurements made withADCPs to reference streamflow measurements obtained fromconcurrent mechanical current-meter measurements, stable ratingcurves, salt-dilution measurements, or AVMs. Data were collectedat 22 sites in the United States, Canada, Sweden, and The Neth-erlands, with drainage areas ranging from 772 to 1,840,000 km2,stream widths ranging from 7.2 to 499 m, and mean depths from0.48 to 9.00 m. One-hundred field validation measurements ana-lyzed for ADCPs manufactured by TRDI show that ADCPstreamflow measurements are unbiased when compared to thereference discharges regardless of the mode used for making themeasurement.
Measurement duration is more important than the number oftransects for reducing the uncertainty of the ADCP streamflowmeasurement. The present work suggests that ADCP streamflowmeasurements consisting of at least 2 transects and having a du-ration for all transects of 720 s or greater, will result in acceptablelevels of uncertainty. The use of ADCPs for measuring stream-flow produced reliable measurements over a wide range of con-ditions and compare well to existing methods for streamflow
Fig. 5. Relation between measured disch
measurement.
JOURNAL
Acknowledgments
The USGS and Environment Canada provided financial supportfor the field validations and the South Florida Water ManagementDistrict provided financial support for part of the laboratory vali-dations. The writers gratefully acknowledge Francois Rainville�Environment Canada�, Aad J. Hartman �Rijkswaterstaat, TheNetherlands�, Christer Jonnson �Swedish Meteorological and Hy-drological Institute�, Erlend Moe �Norwegian Water Resourcesand Energy Directorate�, and Tyler Brandt, Brian Loving, KevinJohnson, and Sonny Anderson �USGS� for their efforts to collectand summarize ADCP validation measurements used in thispaper.
Disclaimer. Use of trade, product, or firm names in this paperis for descriptive purposes only and does not imply endorsementby the U.S. Government.
References
Appell, G. F., Gast, J., Williams, R. G., and Bass, P. D. �1988�. “Calibra-tion of acoustic Doppler current profilers.” Proc., Oceans ’88–Conf.and Exposition October 31-November 2, 1988, IEEE, Washington,D.C., 346–352.
Bos, W. G. �1991�. “A comparison of two Doppler current profilers.” J.Oceanic Eng., 16�4�, 374–381.
Carter, R. W., and Anderson, I. E. �1963�. “Accuracy of current metermeasurements.” J. Hydr. Div., 89�4�, 105–115.
Chen, C. �1991�. “Unified theory on power laws for flow resistance.” J.Hydraul. Eng., 117�3�, 371–389.
Dinehart, R. L., and Burau, J. R. �2005�. “Averaged indicators of second-ary flow in repeated ADCP crossings of bends.” Water Resour. Res.,41�9�, W09405.1–W09405.18.
González, J. A., Melching, C. S., and Oberg, K. A. �1996�. “Analysis ofopen-channel velocity measurements collected with an acoustic Dop-
ncertainty and duration of measurement
arge u
pler current profiler.” Proc., RiverTech96, IWRA, Ste Anne de Belle-
vue, Vol. 2, QC, Canada, 838–845.Gordon, L. �1996�. Acoustic Doppler current profilers principles of op-
eration: A practical primer, 2nd Ed., RD Instruments, San Diego.Helsel, D. R., and Hirsch, R. M. �1992�. Statistical methods in water
resources, Elsevier, Amsterdam, The Netherlands.Hubbard, E. F., Schwarz, G. E., Thibodeaux, K. G., and Turcios, L. M.
�2001�. “Price current-meter standard rating development by the U.S.geological survey.” J. Hydraul. Eng., 127�4�, 250–257.
International Standards Organization �ISO�. �1976�. “Liquid flow mea-surement in open channels—Calibration of rotating element currentmeters in straight open tanks.” ISO3455, Geneva, Switzerland.
International Standards Organization �ISO�. �1979�. “Liquid flow mea-surement in open channels—Velocity-area methods.” ISO748,Geneva, Switzerland.
Jacobson, R. B., Elliott, C. M., and Johnson, H. E., III. �2004�. “Assess-ment of shallow-water habitat availability in modified dike structures,lower Missouri River.” U.S. Geological Survey Open-File Rep. 2004-1409, Denver.
Kostaschuk, R., Villard, P., and Best, J. �2004�. “Measuring velocity andshear stress over dunes with acoustic Doppler profiler.” J. Hydraul.Eng., 130�9�, 932–936.
Lemmin, U., and Rolland, T. �1997�. “Acoustic velocity profiler for labo-ratory and field studies.” J. Hydraul. Eng., 123�12�, 1089–1098.
Morlock, S. E. �1996�. “Evaluation of acoustic Doppler current profilermeasurements of river discharge.” U.S. Geological Survey Water Re-sources Investigation Rep. 95-4218, Denver.
Mueller, D. S. �2002�. “Field assessment of acoustic Doppler based dis-charge measurements.” Proc., Hydraulic Measurements & Experi-mental Methods 2002 �CD-ROM�, ASCE, Reston, Va.
Naval Sea Systems Command. �2004�. “Facility data sheet, shallow waterbasin, towing carriage No. 1.” �http://www.dt.navy.mil/hyd/fac/tow-bas/index.html� �March 30, 2006�.
Nystrom, E. A., Oberg, K. A., and Rehmann, C. R. �2002�. “Measure-ment of turbulence with acoustic Doppler current profilers—Sourcesof error and laboratory results.” Proc., Hydraulic Measurements &Experimental Methods 2002 �CD-ROM�, ASCE, Reston, Va.
Oberg, K. A. �2002�. “In search of easy-to-use methods for calibratingADCP’s for velocity and discharge measurements.” Proc., HydraulicMeasurements & Experimental Methods 2002 �CD-ROM�, ASCE,Reston, Va.
Oberg, K. A., Morlock, S. E., and Caldwell, W. S. �2005�. “Quality-
assurance plan for discharge measurements using acoustic Dopplercurrent profilers.” U.S. Geological Survey Scientific InvestigationsRep. 2005-5183, Denver.
Oberg, K. A., and Mueller, D. S. �1994�. “Recent applications of acousticDoppler current profilers.” Proc., Fundamentals and Advancements in
Hydraulic Measurements and Experimentation, ASCE, Reston, Va.,341–350.
Okunishi, K., Saito, T., and Yoshida, T. �1992�. “Accuracy of streamgauging by dilution methods.” J. Hydrol., 137�1–4�, 231–243.
Pelletier, P. M. �1988�. “Uncertainties in the single determination of riverdischarge: A literature review.” Can. J. Civ. Eng., 15�5�, 834–850.
Rantz, S. E., et al. �1982�. “Measurement and computation of stream-flow.” U.S. Geological Survey Water-Supply Paper 2175, Denver.
Rehmel, M. S., Stewart, J. A., and Morlock, S. E. �2003�. “Tetheredacoustic Doppler current profiler platforms for measuring stream-flow.” U.S. Geological Survey Open-File Rep. 03-237, Denver.
Rennie, C. D., Millar, R. G., and Church, M. A. �2002�. “Measurement ofbed load velocity using an acoustic Doppler current profiler.” J. Hy-draul. Eng.. 128�5�, 473–483.
Shih, H. H., Payton, C., Sprenke, J., and Mero, T. �2000�. “Towing basinspeed calibration of acoustic Doppler current profiling instruments.”Proc., 2000 Joint Conf. on Water Resources Engineering and WaterResources Planning and Management, ASCE, Reston, Va.
Simpson, M. �2001�. “Discharge measurements using a broad-bandacoustic Doppler current profiler.” U. S. Geological Survey, Open-FileRep. 01-01, Denver, �http://water.usgs.gov/pubs/of/ofr0101/�.
Simpson, M. R., and Oltmann, R. N. �1993�. “Discharge measurementusing an acoustic Doppler current profiler.” U.S. Geological SurveyWater-Supply Paper 2395, Denver.
version, San Diego.Wagner, C. R., and Mueller, D. S. �2001�. “Calibration and validation of
a two-dimensional hydrodynamic model of the Ohio River, JeffersonCounty, Kentucky.” U.S. Geological Survey Water-Resources Investi-gations Rep. 01-4091, Denver.