100
Valmet – unique offering with process technology, automation and services Roadshow material January 2016
Valmet – unique offering with process technology, automation and services
Roadshow material
January 2016
AgendaValmet Roadshow
Valmet overview
Investment highlights
Industrial Internet
Financials
1
2
3
4
Conclusion5
Appendix6
Valmet overview
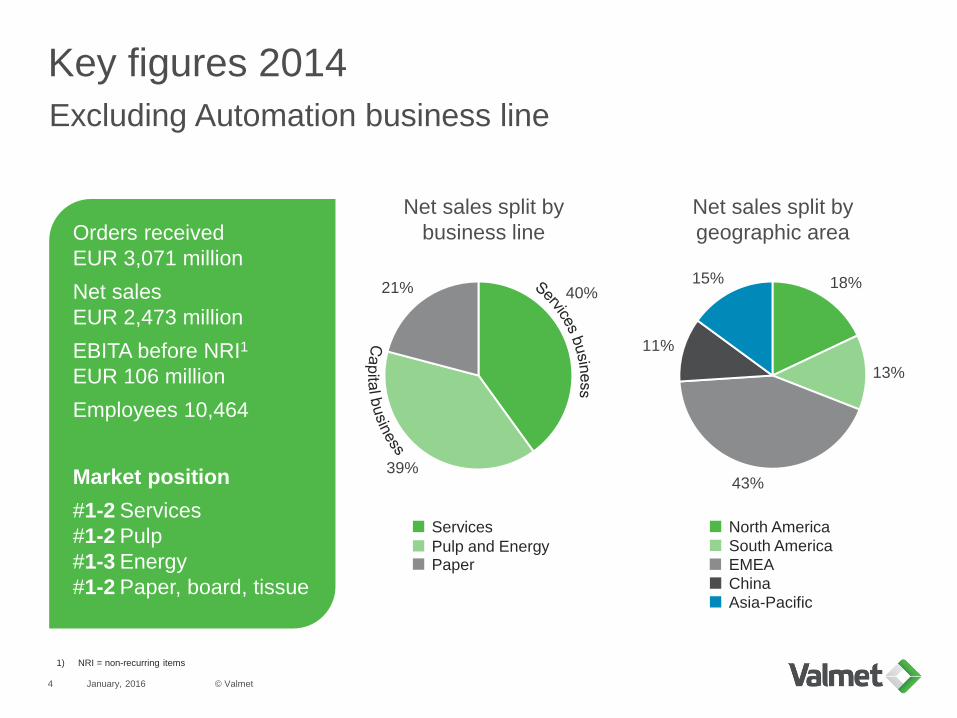
Key figures 2014
January, 2016
Excluding Automation business line
18%
13%
43%
11%
15%40%
39%
21%
Services
Pulp and EnergyPaper
Net sales split by
geographic area
Net sales split by
business line Orders received
EUR 3,071 million
Net sales
EUR 2,473 million
EBITA before NRI1
EUR 106 million
Employees 10,464
Market position
#1-2 Services
#1-2 Pulp
#1-3 Energy
#1-2 Paper, board, tissue
1) NRI = non-recurring items
North America
EMEA
South America
Asia-Pacific
China
© Valmet4
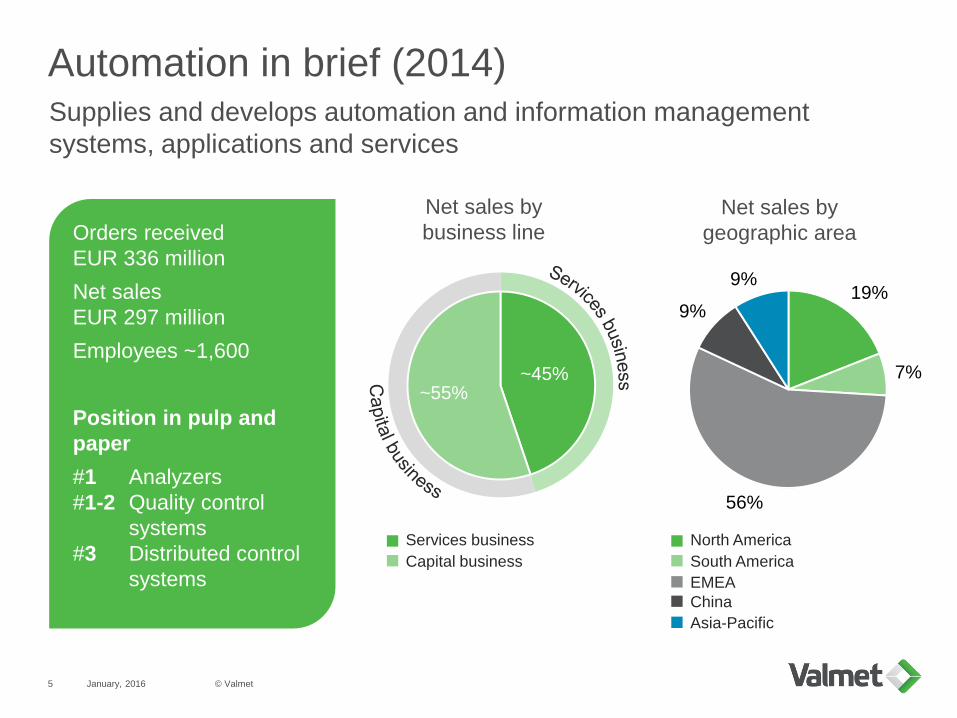
Automation in brief (2014)
January, 2016
Supplies and develops automation and information management
systems, applications and services
Global market leader with
#1 market position in pulp and
paper
Industry-leading product portfolio
Comprehensive services
High barriers to entry and a limited
number of focused players
19%
7%
56%
9%
9%
~55%~45%
North America
EMEA
South America
Asia-Pacific
China
Services business
Capital business
Net sales by
business line
Net sales by
geographic areaOrders received
EUR 336 million
Net sales
EUR 297 million
Employees ~1,600
Position in pulp and
paper
#1 Analyzers
#1-2 Quality control
systems
#3 Distributed control
systems
© Valmet5
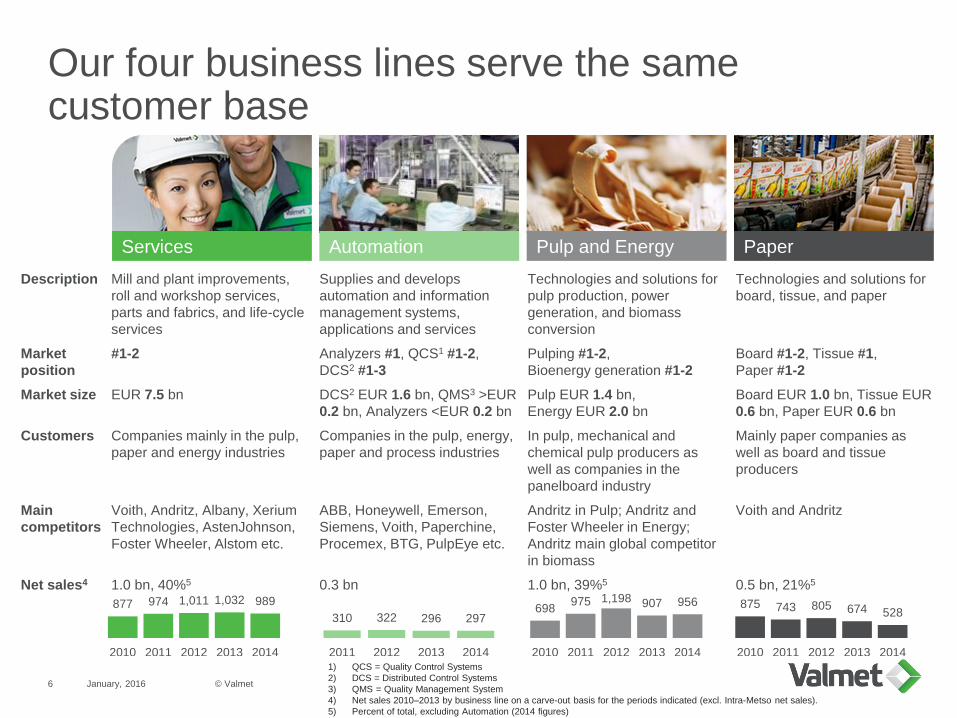
Our four business lines serve the samecustomer base
January, 2016
1) QCS = Quality Control Systems
2) DCS = Distributed Control Systems
3) QMS = Quality Management System
4) Net sales 2010–2013 by business line on a carve-out basis for the periods indicated (excl. Intra-Metso net sales).
5) Percent of total, excluding Automation (2014 figures)
Description Mill and plant improvements,
roll and workshop services,
parts and fabrics, and life-cycle
services
Supplies and develops
automation and information
management systems,
applications and services
Technologies and solutions for
pulp production, power
generation, and biomass
conversion
Technologies and solutions for
board, tissue, and paper
Market
position
#1-2 Analyzers #1, QCS1 #1-2,
DCS2 #1-3
Pulping #1-2,
Bioenergy generation #1-2
Board #1-2, Tissue #1,
Paper #1-2
Market size EUR 7.5 bn DCS2 EUR 1.6 bn, QMS3 >EUR
0.2 bn, Analyzers <EUR 0.2 bn
Pulp EUR 1.4 bn,
Energy EUR 2.0 bn
Board EUR 1.0 bn, Tissue EUR
0.6 bn, Paper EUR 0.6 bn
Customers Companies mainly in the pulp,
paper and energy industries
Companies in the pulp, energy,
paper and process industries
In pulp, mechanical and
chemical pulp producers as
well as companies in the
panelboard industry
Mainly paper companies as
well as board and tissue
producers
Main
competitors
Voith, Andritz, Albany, Xerium
Technologies, AstenJohnson,
Foster Wheeler, Alstom etc.
ABB, Honeywell, Emerson,
Siemens, Voith, Paperchine,
Procemex, BTG, PulpEye etc.
Andritz in Pulp; Andritz and
Foster Wheeler in Energy;
Andritz main global competitor
in biomass
Voith and Andritz
Net sales4 1.0 bn, 40%5 0.3 bn 1.0 bn, 39%5 0.5 bn, 21%5
Services Pulp and Energy PaperAutomation
877 974 1,011 1,032 989
2010 2011 2012 2013 2014
698975 1,198 907 956
2010 2011 2012 2013 2014
875 743 805 674 528
2010 2011 2012 2013 2014
310 322 296 297
2011 2012 2013 2014
© Valmet6
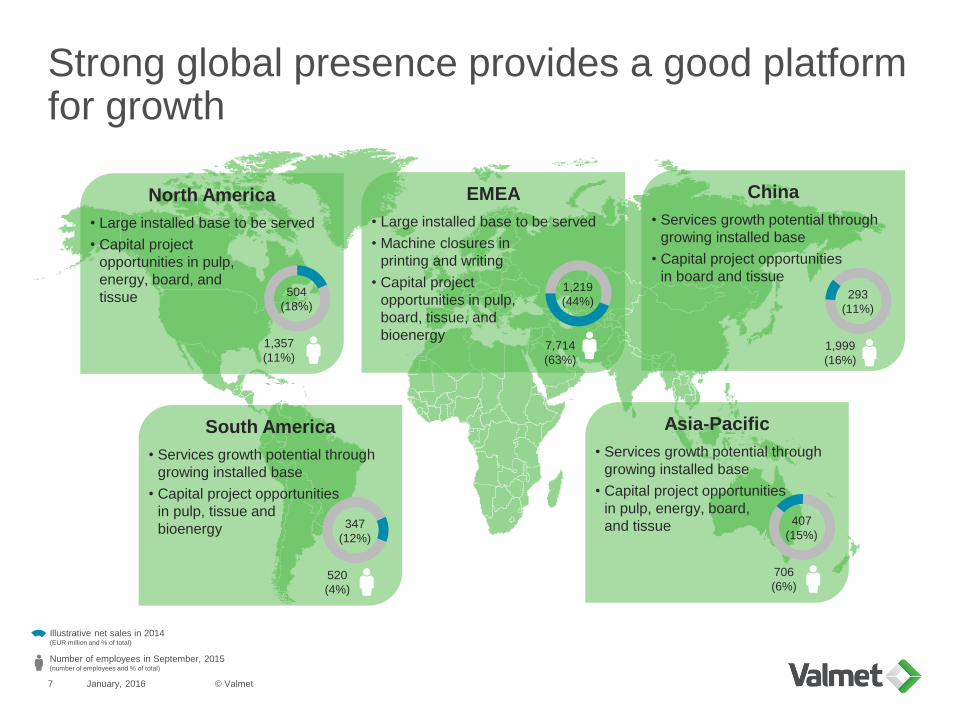
Strong global presence provides a good platform for growth
January, 2016
Illustrative net sales in 2014(EUR million and % of total)
Number of employees in September, 2015 (number of employees and % of total)
North America
• Large installed base to be served
• Capital project
opportunities in pulp,
energy, board, and
tissue 504
(18%)
1,357
(11%)
South America
• Services growth potential through
growing installed base
• Capital project opportunities
in pulp, tissue and
bioenergy 347
(12%)
520
(4%)
EMEA
• Large installed base to be served
• Machine closures in
printing and writing
• Capital project
opportunities in pulp,
board, tissue, and
bioenergy
1,219
(44%)
7,714
(63%)
China
• Services growth potential through
growing installed base
• Capital project opportunities
in board and tissue293
(11%)
1,999
(16%)
Asia-Pacific
• Services growth potential through
growing installed base
• Capital project opportunities
in pulp, energy, board,
and tissue 407
(15%)
706
(6%)
© Valmet7
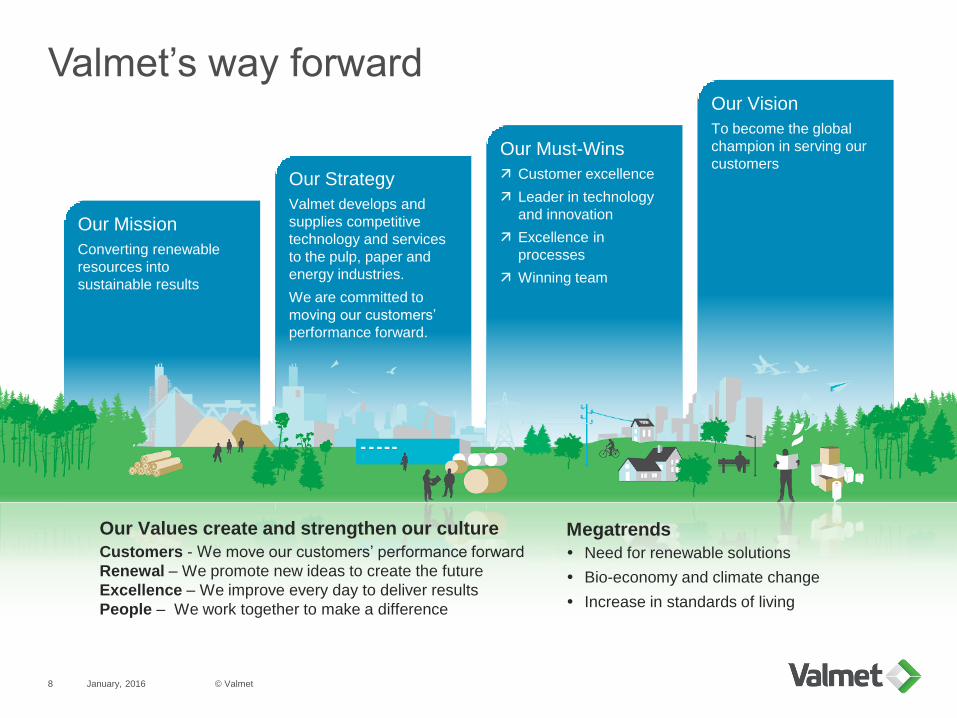
Valmet’s way forward
January, 2016
Our Must-Wins
Customer excellence
Leader in technology
and innovation
Excellence in
processes
Winning team
Our Vision
To become the global
champion in serving our
customersOur Strategy
Valmet develops and
supplies competitive
technology and services
to the pulp, paper and
energy industries.
We are committed to
moving our customers’
performance forward.
Our Mission
Converting renewable
resources into
sustainable results
Our Values create and strengthen our culture
Customers - We move our customers’ performance forward
Renewal – We promote new ideas to create the future
Excellence – We improve every day to deliver results
People – We work together to make a difference
Megatrends
Need for renewable solutions
Bio-economy and climate change
Increase in standards of living
© Valmet8
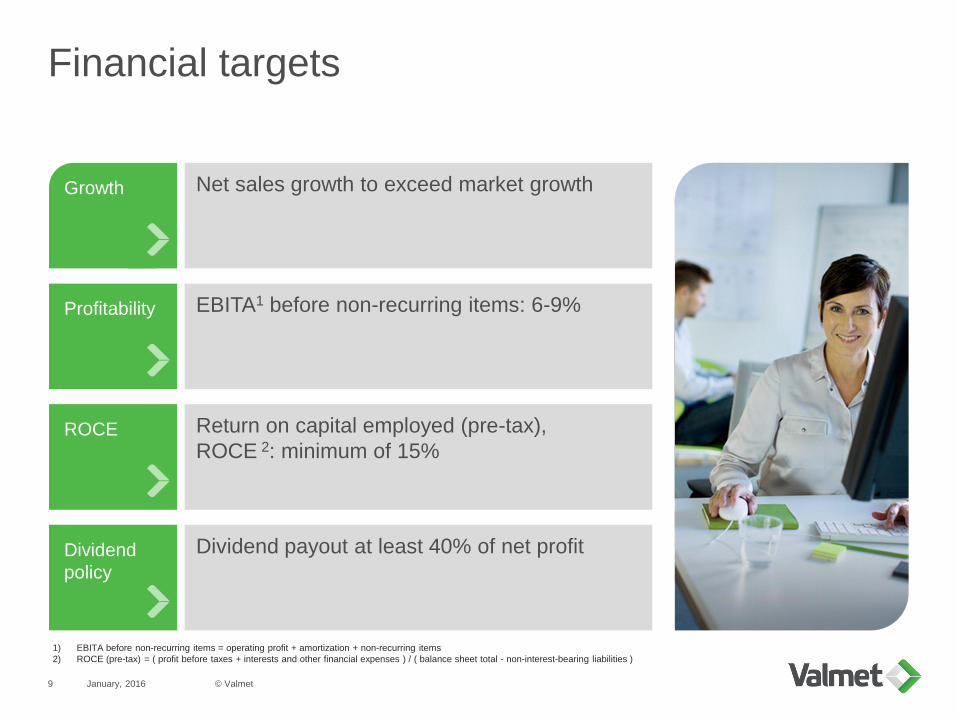
Dividend
policy
Financial targets
January, 2016
Profitability
Growth
ROCE
Net sales growth to exceed market growth
EBITA1 before non-recurring items: 6-9%
Return on capital employed (pre-tax),
ROCE 2: minimum of 15%
Dividend payout at least 40% of net profit
1) EBITA before non-recurring items = operating profit + amortization + non-recurring items
2) ROCE (pre-tax) = ( profit before taxes + interests and other financial expenses ) / ( balance sheet total - non-interest-bearing liabilities )
© Valmet9
Investment highlights
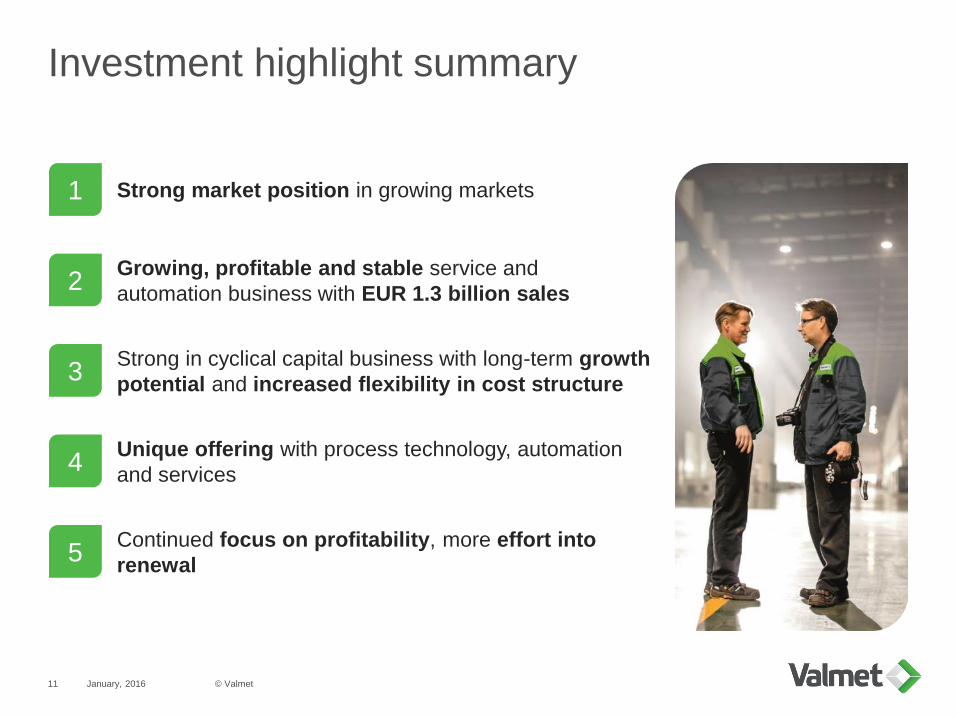
Investment highlight summary
January, 2016 © Valmet11
1
2
3
5
4
Strong market position in growing markets
Growing, profitable and stable service and
automation business with EUR 1.3 billion sales
Strong in cyclical capital business with long-term growth
potential and increased flexibility in cost structure
Continued focus on profitability, more effort into
renewal
Unique offering with process technology, automation
and services
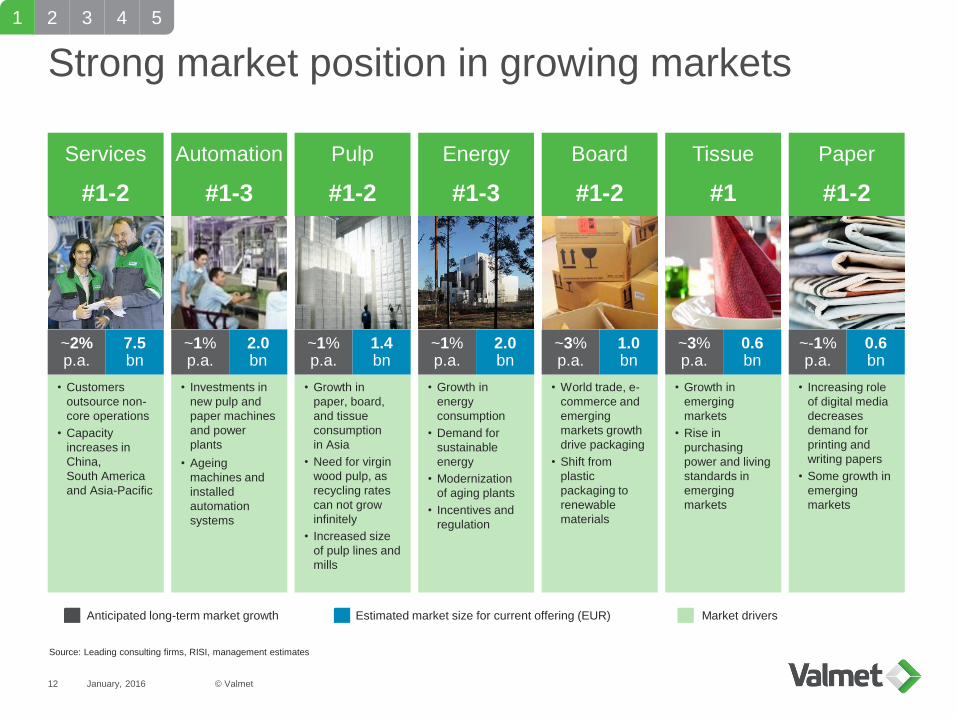
Strong market position in growing markets
January, 2016
2 3 4 51
Services
#1-2
• Customers
outsource non-
core operations
• Capacity
increases in
China,
South America
and Asia-Pacific
Energy
#1-3
Board
#1-2
Paper
#1-2
Pulp
#1-2
• Growth in
energy
consumption
• Demand for
sustainable
energy
• Modernization
of aging plants
• Incentives and
regulation
• Growth in
paper, board,
and tissue
consumption
in Asia
• Need for virgin
wood pulp, as
recycling rates
can not grow
infinitely
• Increased size
of pulp lines and
mills
• World trade, e-
commerce and
emerging
markets growth
drive packaging
• Shift from
plastic
packaging to
renewable
materials
• Growth in
emerging
markets
• Rise in
purchasing
power and living
standards in
emerging
markets
Tissue
#1
• Increasing role
of digital media
decreases
demand for
printing and
writing papers
• Some growth in
emerging
markets
Estimated market size for current offering (EUR)Anticipated long-term market growth
~2%p.a.
7.5bn
~1%p.a.
2.0bn
~1%p.a.
1.4bn
~3%p.a.
1.0bn
~3%p.a.
0.6bn
~-1%p.a.
0.6bn
Source: Leading consulting firms, RISI, management estimates
Market drivers
Automation
#1-3
• Investments in
new pulp and
paper machines
and power
plants
• Ageing
machines and
installed
automation
systems
~1%p.a.
2.0bn
© Valmet12
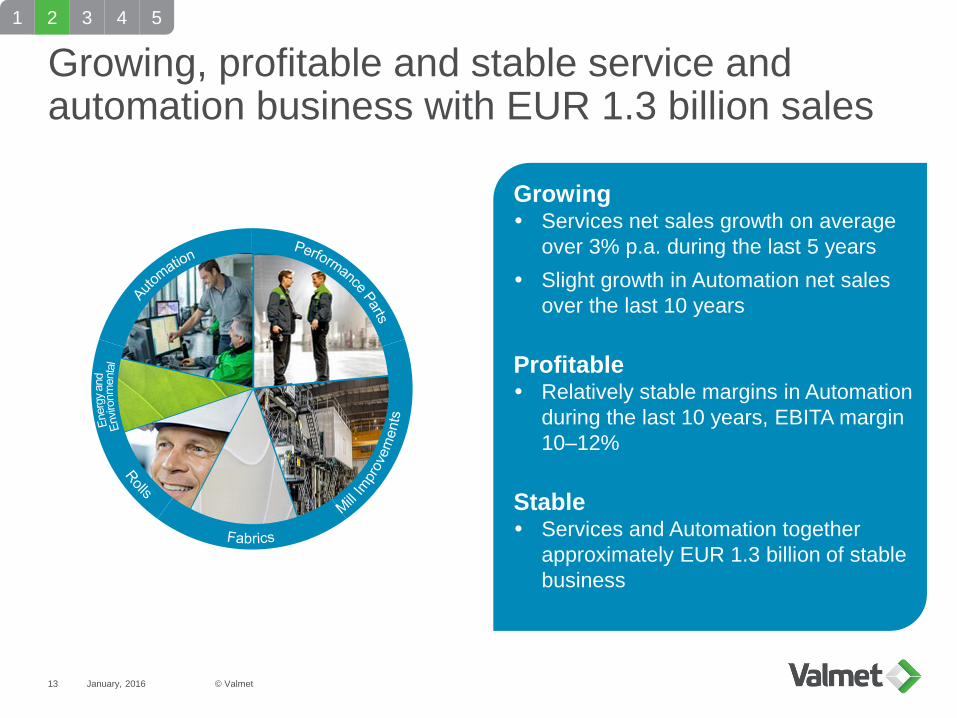
Growing, profitable and stable service and automation business with EUR 1.3 billion sales
January, 2016
2 3 4 5
Growing Services net sales growth on average
over 3% p.a. during the last 5 years
Slight growth in Automation net sales
over the last 10 years
Profitable Relatively stable margins in Automation
during the last 10 years, EBITA margin
10–12%
Stable Services and Automation together
approximately EUR 1.3 billion of stable
business
1
© Valmet13
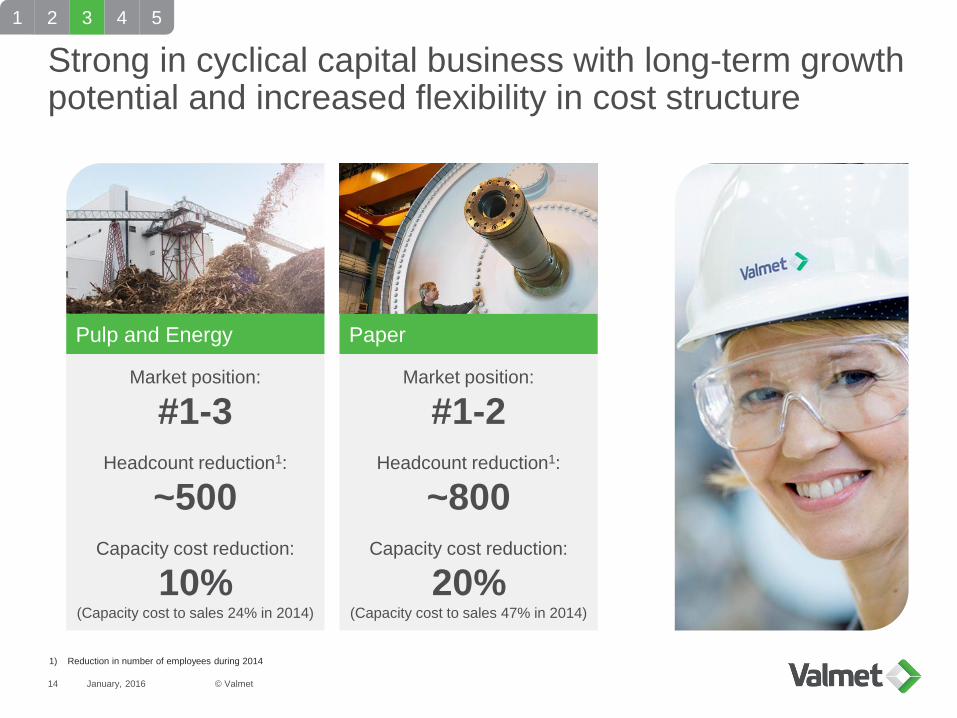
Market position:
#1-2
Headcount reduction1:
~800
Capacity cost reduction:
20%(Capacity cost to sales 47% in 2014)
Market position:
#1-3
Headcount reduction1:
~500
Capacity cost reduction:
10%(Capacity cost to sales 24% in 2014)
Strong in cyclical capital business with long-term growth potential and increased flexibility in cost structure
January, 2016
2 3 4 5
1) Reduction in number of employees during 2014
Pulp and Energy Paper
1
© Valmet14

January, 2016
Unique offering with process technology, automation and services
2 3 4 5
• Valmet is a technology and
service company with full
automation offering
• Strengthened competitiveness
from combination of paper, pulp
and power plant technology,
process know-how and
automation
• Full scope offering gives better
differentiation from competitors
1
© Valmet15
Customer
January, 2016
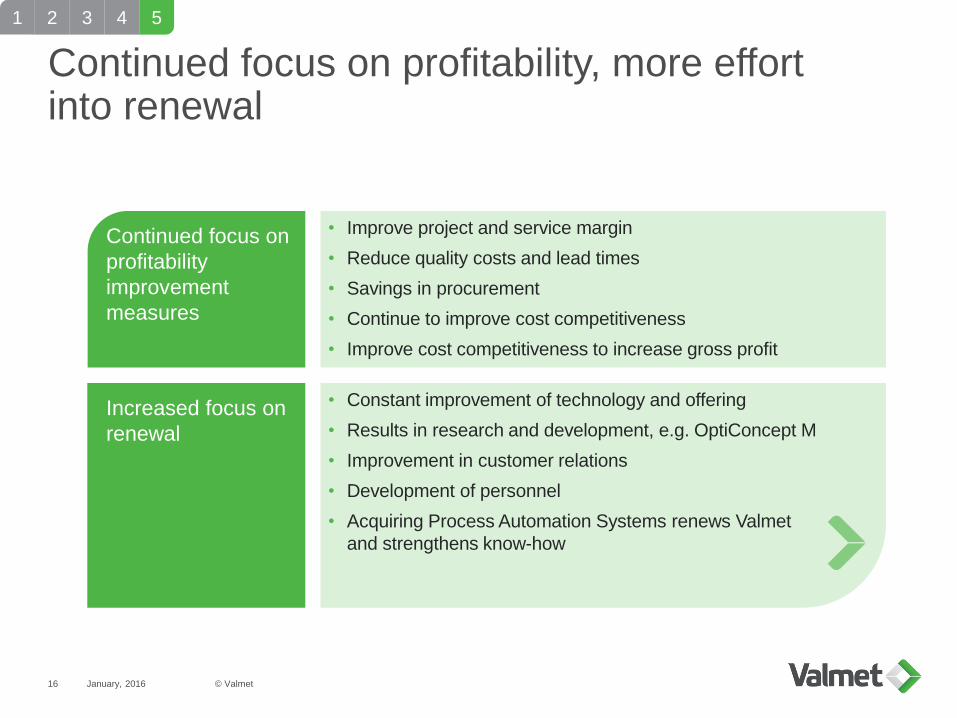
Continued focus on
profitability
improvement
measures
Continued focus on profitability, more effort into renewal
• Improve project and service margin
• Reduce quality costs and lead times
• Savings in procurement
• Continue to improve cost competitiveness
• Improve cost competitiveness to increase gross profit
Increased focus on
renewal
• Constant improvement of technology and offering
• Results in research and development, e.g. OptiConcept M
• Improvement in customer relations
• Development of personnel
• Acquiring Process Automation Systems renews Valmet
and strengthens know-how
2 3 4 51
© Valmet16

Industrial Internet
January, 2016 © Valmet17
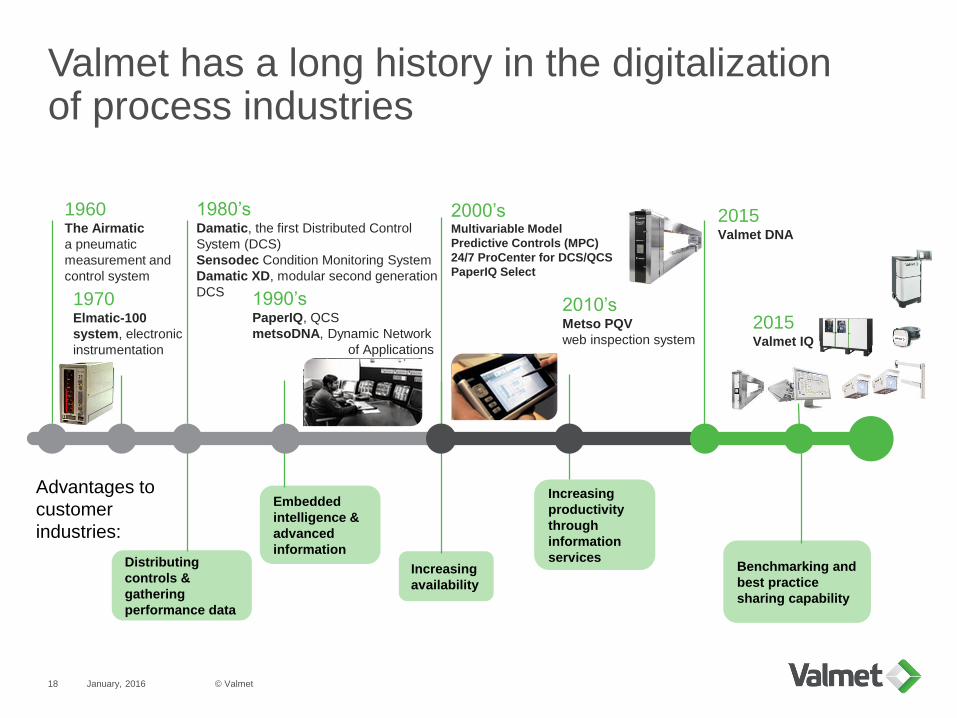
Valmet has a long history in the digitalization of process industries
January, 2016 © Valmet18
1970Elmatic-100
system, electronic
instrumentation
1990’sPaperIQ, QCS
metsoDNA, Dynamic Network
of Applications
1980’sDamatic, the first Distributed Control
System (DCS)
Sensodec Condition Monitoring System
Damatic XD, modular second generation
DCS
2000’sMultivariable Model
Predictive Controls (MPC)
24/7 ProCenter for DCS/QCS
PaperIQ Select
2010’sMetso PQV
web inspection system
2015Valmet DNA
2015Valmet IQ
1960The Airmatic
a pneumatic
measurement and
control system
Distributing
controls &
gathering
performance data
Increasing
availability
Increasing
productivity
through
information
services
Embedded
intelligence &
advanced
information
Benchmarking and
best practice
sharing capability
Advantages to
customer
industries:
Customer’s process
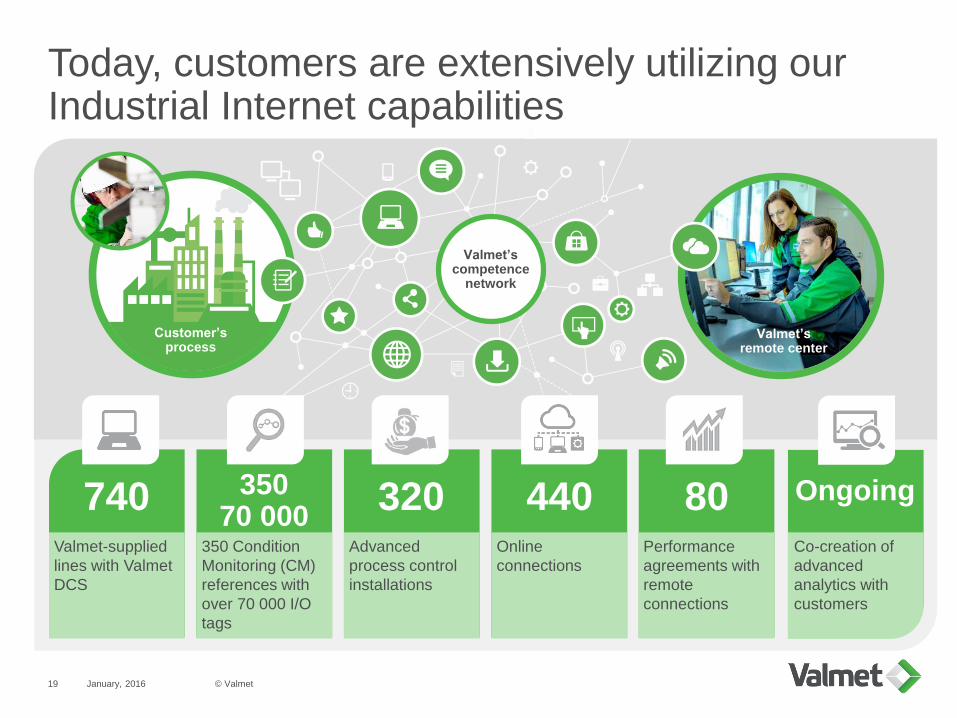
Today, customers are extensively utilizing our Industrial Internet capabilities
January, 2016 © Valmet19
Online
connections
Performance
agreements with
remote
connections
Co-creation of
advanced
analytics with
customers
Valmet-supplied
lines with Valmet
DCS
440350 Condition
Monitoring (CM)
references with
over 70 000 I/O
tags
35070 000
80Advanced
process control
installations
320740 Ongoing
Valmet’s remote center
Valmet’s competence
network
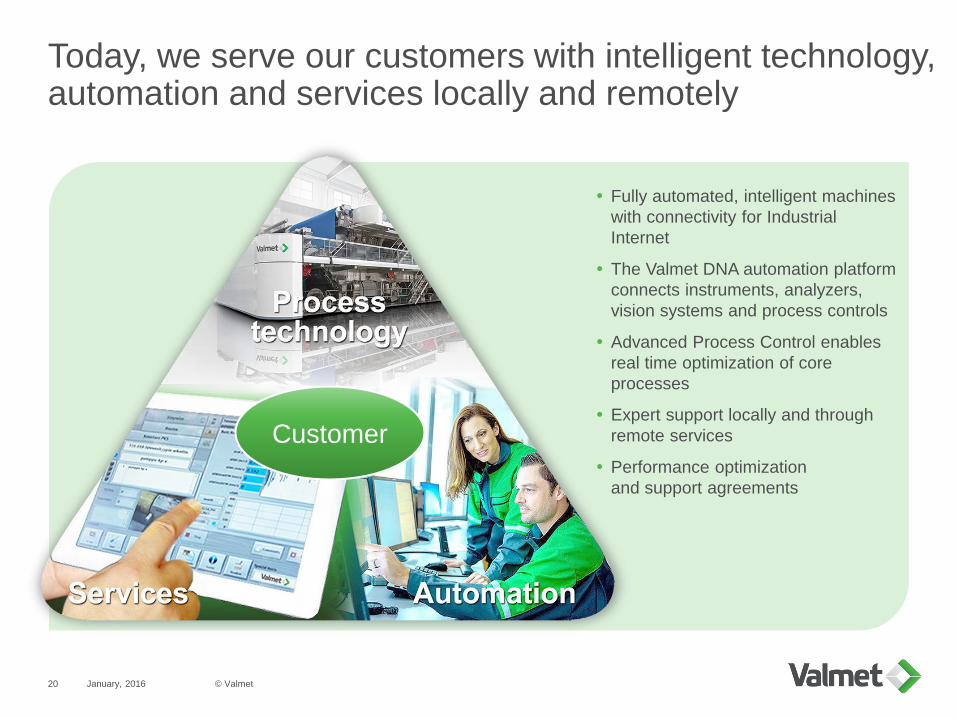
Today, we serve our customers with intelligent technology, automation and services locally and remotely
January, 2016 © Valmet20
Fully automated, intelligent machines
with connectivity for Industrial
Internet
The Valmet DNA automation platform
connects instruments, analyzers,
vision systems and process controls
Advanced Process Control enables
real time optimization of core
processes
Expert support locally and through
remote services
Performance optimization
and support agreements
Customer
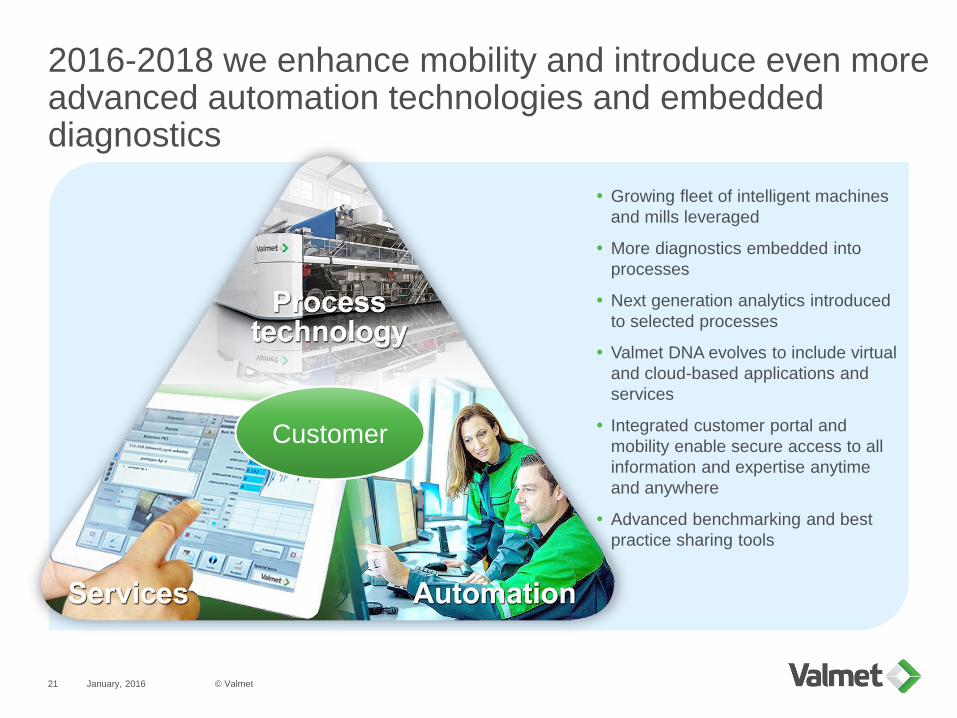
2016-2018 we enhance mobility and introduce even more advanced automation technologies and embedded diagnostics
January, 2016 © Valmet21
Growing fleet of intelligent machines
and mills leveraged
More diagnostics embedded into
processes
Next generation analytics introduced
to selected processes
Valmet DNA evolves to include virtual
and cloud-based applications and
services
Integrated customer portal and
mobility enable secure access to all
information and expertise anytime
and anywhere
Advanced benchmarking and best
practice sharing tools
Customer
Financials
January, 2016
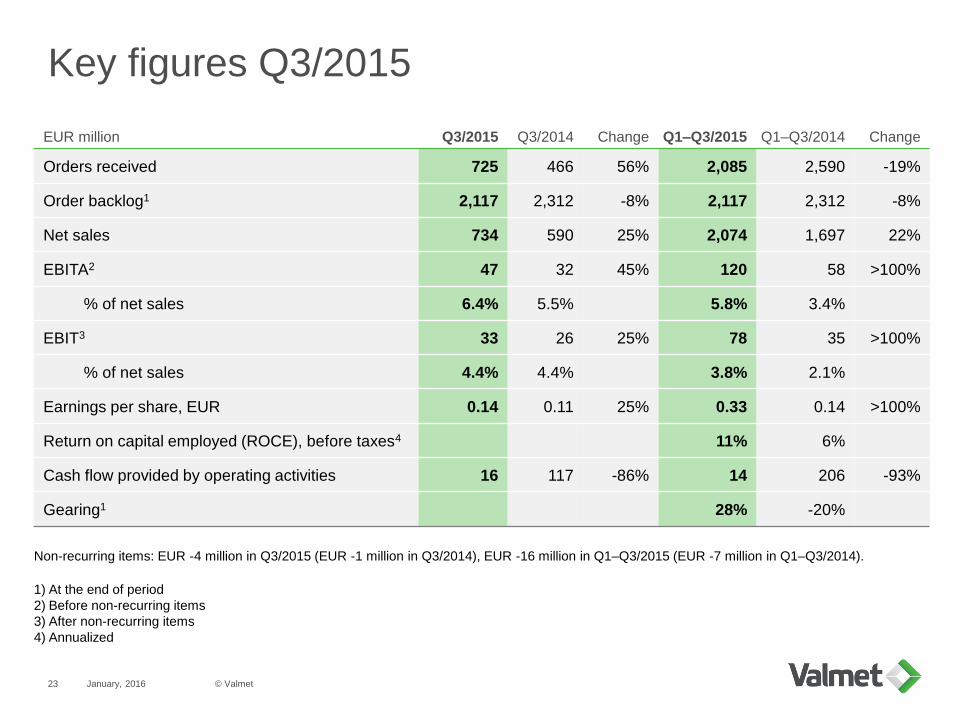
Key figures Q3/2015
© Valmet23
1) At the end of period
2) Before non-recurring items
3) After non-recurring items
4) Annualized
EUR million Q3/2015 Q3/2014 Change Q1–Q3/2015 Q1–Q3/2014 Change
Orders received 725 466 56% 2,085 2,590 -19%
Order backlog1 2,117 2,312 -8% 2,117 2,312 -8%
Net sales 734 590 25% 2,074 1,697 22%
EBITA2 47 32 45% 120 58 >100%
% of net sales 6.4% 5.5% 5.8% 3.4%
EBIT3 33 26 25% 78 35 >100%
% of net sales 4.4% 4.4% 3.8% 2.1%
Earnings per share, EUR 0.14 0.11 25% 0.33 0.14 >100%
Return on capital employed (ROCE), before taxes4 11% 6%
Cash flow provided by operating activities 16 117 -86% 14 206 -93%
Gearing1 28% -20%
Non-recurring items: EUR -4 million in Q3/2015 (EUR -1 million in Q3/2014), EUR -16 million in Q1–Q3/2015 (EUR -7 million in Q1–Q3/2014).
January, 2016
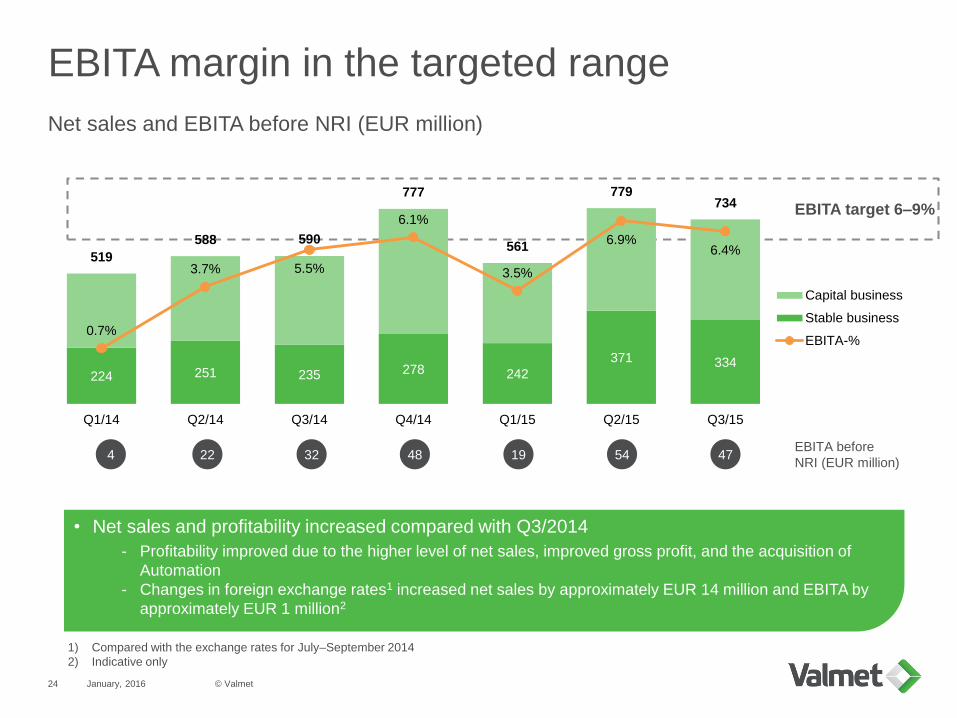
EBITA margin in the targeted range
Net sales and EBITA before NRI (EUR million)
© Valmet24
224 251 235 278 242
371 334
519
588 590
777
561
779734
0.7%
3.7% 5.5%
6.1%
3.5%
6.9%6.4%
Q1/14 Q2/14 Q3/14 Q4/14 Q1/15 Q2/15 Q3/15
Capital business
Stable business
EBITA-%
EBITA target 6–9%
• Net sales and profitability increased compared with Q3/2014
- Profitability improved due to the higher level of net sales, improved gross profit, and the acquisition of
Automation
- Changes in foreign exchange rates1 increased net sales by approximately EUR 14 million and EBITA by
approximately EUR 1 million2
EBITA before
NRI (EUR million)194 22 32 48
1) Compared with the exchange rates for July–September 2014
2) Indicative only
54 47
January, 2016
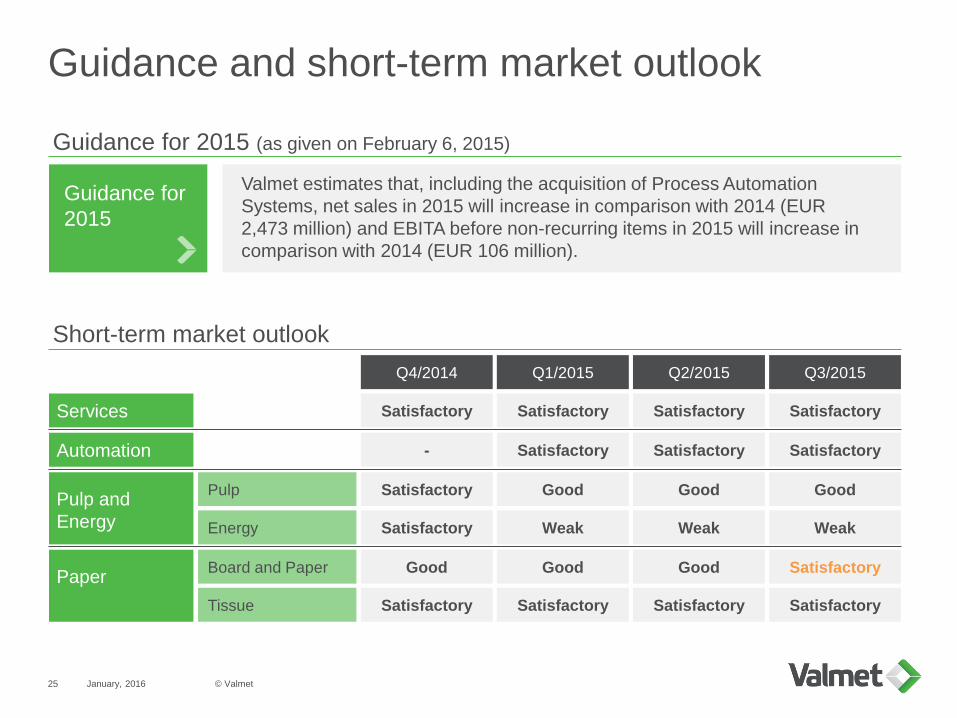
Guidance and short-term market outlook
© Valmet25
GoodPulp and
Energy
Paper
Satisfactory
Pulp
Energy
Board and Paper
Tissue
Guidance for
2015
Services
Short-term market outlook
Guidance for 2015 (as given on February 6, 2015)
Satisfactory
Satisfactory
Good
Satisfactory
Satisfactory
Good
Weak
Good
Satisfactory
Q4/2014 Q1/2015
Satisfactory
Good
Weak
Good
Satisfactory
Q2/2015
Satisfactory
Weak
Satisfactory
Satisfactory
Q3/2015
Valmet estimates that, including the acquisition of Process Automation
Systems, net sales in 2015 will increase in comparison with 2014 (EUR
2,473 million) and EBITA before non-recurring items in 2015 will increase in
comparison with 2014 (EUR 106 million).
- Satisfactory Satisfactory SatisfactoryAutomation
Conclusion
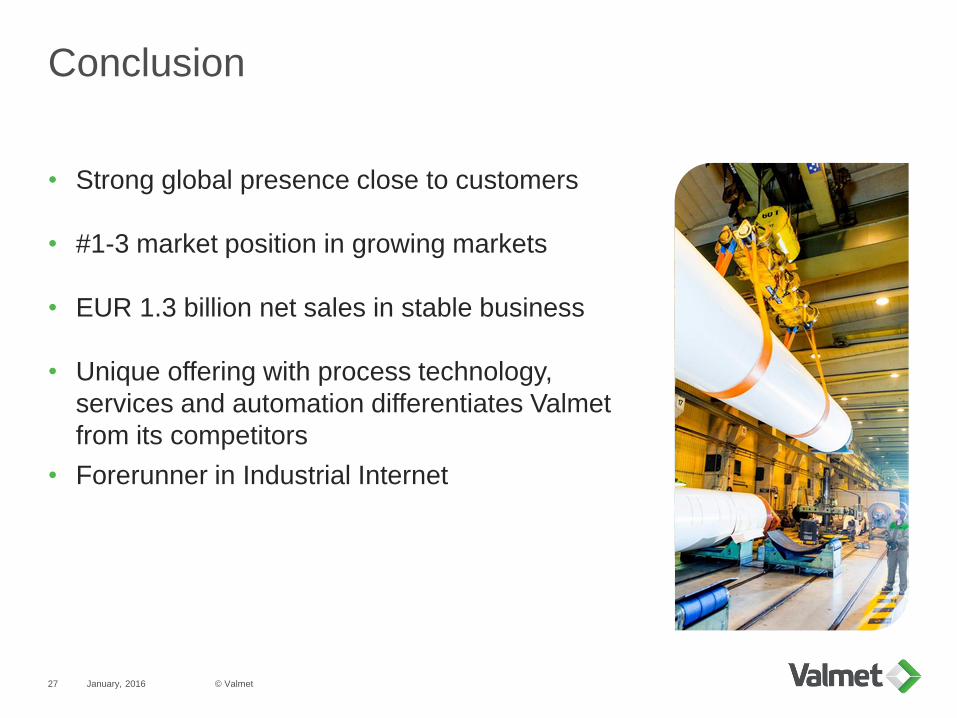
Conclusion
• Strong global presence close to customers
• #1-3 market position in growing markets
• EUR 1.3 billion net sales in stable business
• Unique offering with process technology,
services and automation differentiates Valmet
from its competitors
• Forerunner in Industrial Internet
January, 2016 © Valmet27
Important notice
January, 2016
It should be noted that certain statements herein which are not historical facts, including, without
limitation, those regarding expectations for general economic development and the market situation,
expectations for growth, profitability and investment willingness, expectations for company development,
growth and profitability and the realization of synergy benefits and cost savings, and statements
preceded by “anticipates”, “believes”, ”estimates”, “expects”, ”foresees” or similar expressions, are
forward-looking statements. Since these statements are based on current decisions and plans, estimates
and projections, they involve risks and uncertainties which may cause the actual results to materially
differ from the results currently expressed. Such factors include, but are not limited to:
1) general economic conditions, including fluctuations in exchange rates and interest levels which
influence the operating environment and profitability of customers of the company or economic growth in
the company’s principal geographic markets.
2) industry conditions, intensity of competition situation, especially potential introduction of significant
technological solutions developed by competitors, financial condition of the customers and the
competitors of the company,
3) the company’s own operating factors, such as the success of production, product development and
project management and the efficiencies therein including continuous development and improvement
4) the success of pending and future acquisitions and restructuring.
© Valmet28
Appendix
Management, ownership and share price development
Financials
Automation
1
2
3
Offering4
Market statistics5
AppendixManagement, ownership and share price development
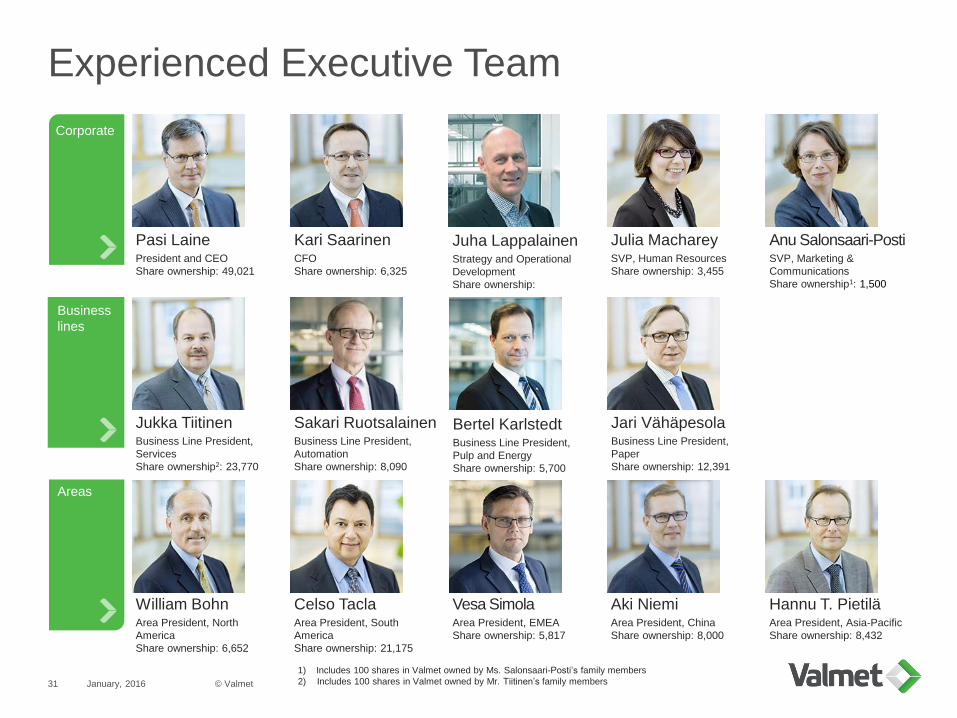
Experienced Executive Team
January, 2016
1) Includes 100 shares in Valmet owned by Ms. Salonsaari-Posti’s family members
2) Includes 100 shares in Valmet owned by Mr. Tiitinen’s family members© Valmet31
Business
lines
Corporate
Pasi LainePresident and CEO
Share ownership: 49,021
Kari SaarinenCFO
Share ownership: 6,325
Julia MachareySVP, Human Resources
Share ownership: 3,455
Anu Salonsaari-PostiSVP, Marketing &
Communications
Share ownership1: 1,500
Jukka TiitinenBusiness Line President,
Services
Share ownership2: 23,770
Bertel KarlstedtBusiness Line President,
Pulp and Energy
Share ownership: 5,700
Jari VähäpesolaBusiness Line President,
Paper
Share ownership: 12,391
William BohnArea President, North
America
Share ownership: 6,652
Celso TaclaArea President, South
America
Share ownership: 21,175
Vesa SimolaArea President, EMEA
Share ownership: 5,817
Aki NiemiArea President, China
Share ownership: 8,000
Hannu T. PietiläArea President, Asia-Pacific
Share ownership: 8,432
Sakari RuotsalainenBusiness Line President,
Automation
Share ownership: 8,090
Areas
Juha LappalainenStrategy and Operational
Development
Share ownership:
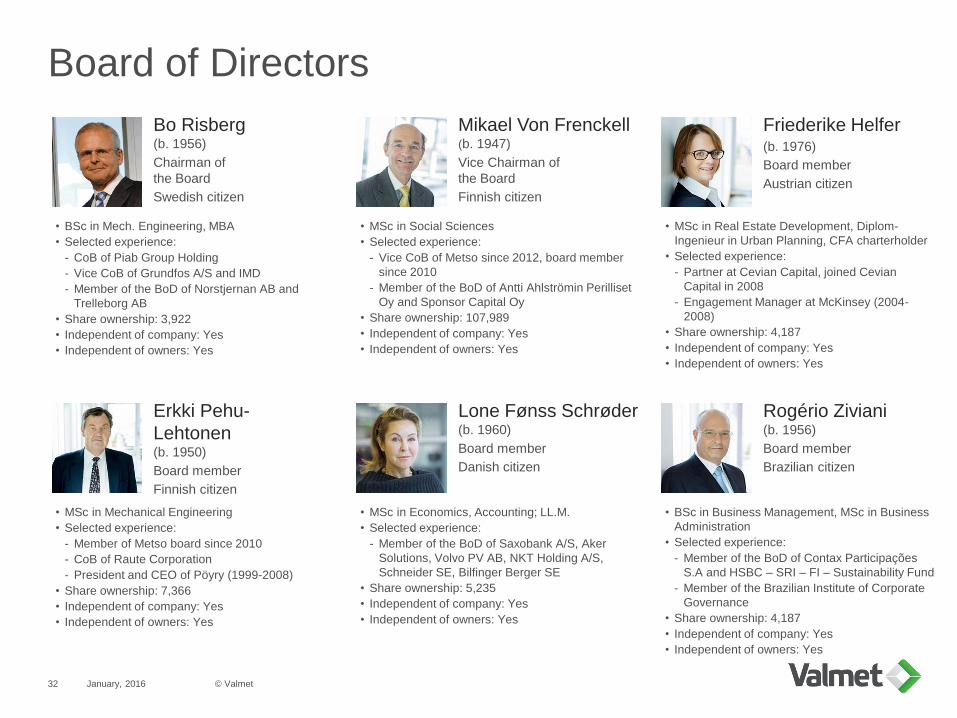
• MSc in Real Estate Development, Diplom-
Ingenieur in Urban Planning, CFA charterholder
• Selected experience:
- Partner at Cevian Capital, joined Cevian
Capital in 2008
- Engagement Manager at McKinsey (2004-
2008)
• Share ownership: 4,187
• Independent of company: Yes
• Independent of owners: Yes
Friederike Helfer(b. 1976)
Board member
Austrian citizen
Board of Directors
• BSc in Mech. Engineering, MBA
• Selected experience:
- CoB of Piab Group Holding
- Vice CoB of Grundfos A/S and IMD
- Member of the BoD of Norstjernan AB and
Trelleborg AB
• Share ownership: 3,922
• Independent of company: Yes
• Independent of owners: Yes
• MSc in Social Sciences
• Selected experience:
- Vice CoB of Metso since 2012, board member
since 2010
- Member of the BoD of Antti Ahlströmin Perilliset
Oy and Sponsor Capital Oy
• Share ownership: 107,989
• Independent of company: Yes
• Independent of owners: Yes
• MSc in Mechanical Engineering
• Selected experience:
- Member of Metso board since 2010
- CoB of Raute Corporation
- President and CEO of Pöyry (1999-2008)
• Share ownership: 7,366
• Independent of company: Yes
• Independent of owners: Yes
• MSc in Economics, Accounting; LL.M.
• Selected experience:
- Member of the BoD of Saxobank A/S, Aker
Solutions, Volvo PV AB, NKT Holding A/S,
Schneider SE, Bilfinger Berger SE
• Share ownership: 5,235
• Independent of company: Yes
• Independent of owners: Yes
Bo Risberg(b. 1956)
Chairman of
the Board
Swedish citizen
Mikael Von Frenckell(b. 1947)
Vice Chairman of
the Board
Finnish citizen
Erkki Pehu-
Lehtonen(b. 1950)
Board member
Finnish citizen
Lone Fønss Schrøder(b. 1960)
Board member
Danish citizen
• BSc in Business Management, MSc in Business
Administration
• Selected experience:
- Member of the BoD of Contax Participações
S.A and HSBC – SRI – FI – Sustainability Fund
- Member of the Brazilian Institute of Corporate
Governance
• Share ownership: 4,187
• Independent of company: Yes
• Independent of owners: Yes
Rogério Ziviani(b. 1956)
Board member
Brazilian citizen
January, 2016 © Valmet32
January, 2016
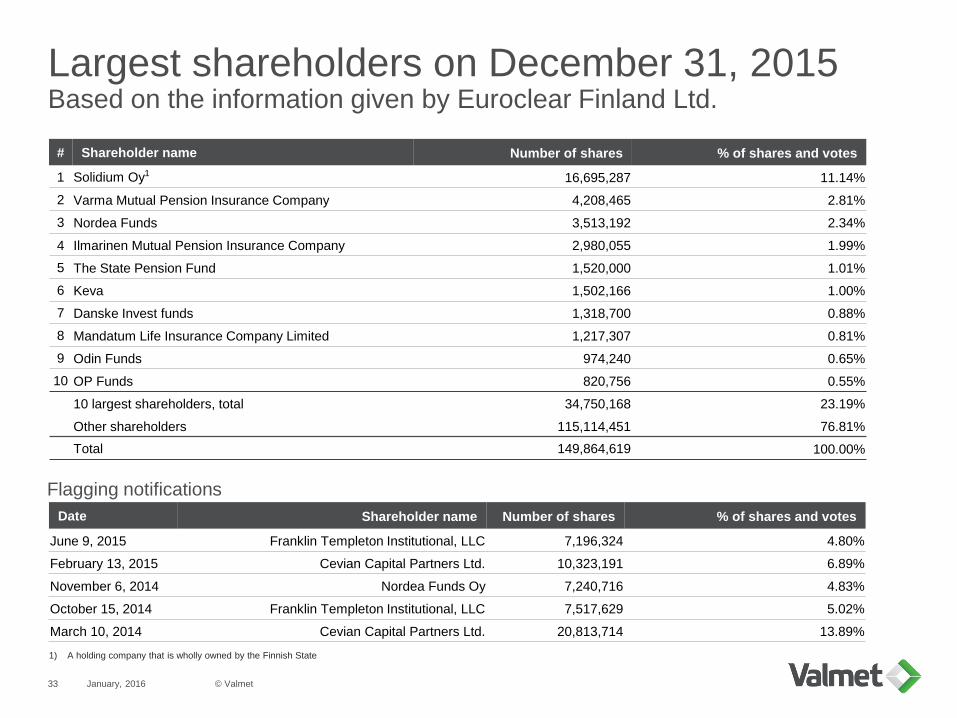
Largest shareholders on December 31, 2015Based on the information given by Euroclear Finland Ltd.
1) A holding company that is wholly owned by the Finnish State
# Shareholder name Number of shares % of shares and votes
1 Solidium Oy1 16,695,287 11.14%
2 Varma Mutual Pension Insurance Company 4,208,465 2.81%
3 Nordea Funds 3,513,192 2.34%
4 Ilmarinen Mutual Pension Insurance Company 2,980,055 1.99%
5 The State Pension Fund 1,520,000 1.01%
6 Keva 1,502,166 1.00%
7 Danske Invest funds 1,318,700 0.88%
8 Mandatum Life Insurance Company Limited 1,217,307 0.81%
9 Odin Funds 974,240 0.65%
10 OP Funds 820,756 0.55%
10 largest shareholders, total 34,750,168 23.19%
Other shareholders 115,114,451 76.81%
Total 149,864,619 100.00%
Date Shareholder name Number of shares % of shares and votes
June 9, 2015 Franklin Templeton Institutional, LLC 7,196,324 4.80%
February 13, 2015 Cevian Capital Partners Ltd. 10,323,191 6.89%
November 6, 2014 Nordea Funds Oy 7,240,716 4.83%
October 15, 2014 Franklin Templeton Institutional, LLC 7,517,629 5.02%
March 10, 2014 Cevian Capital Partners Ltd. 20,813,714 13.89%
Flagging notifications
© Valmet33
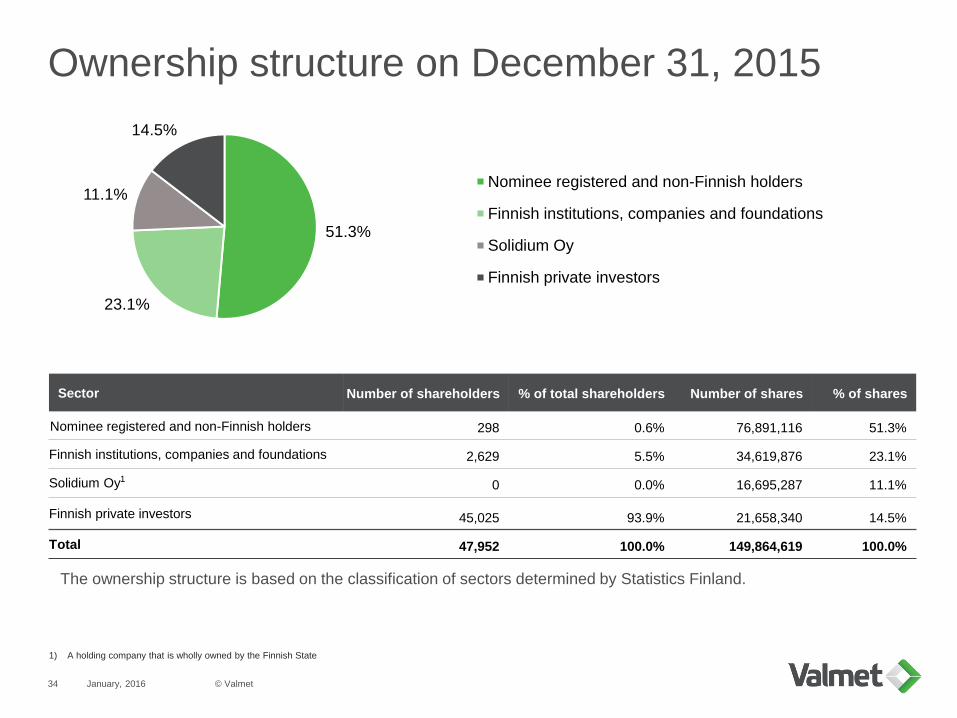
Ownership structure on December 31, 2015
January, 2016
1) A holding company that is wholly owned by the Finnish State
The ownership structure is based on the classification of sectors determined by Statistics Finland.
Sector Number of shareholders % of total shareholders Number of shares % of shares
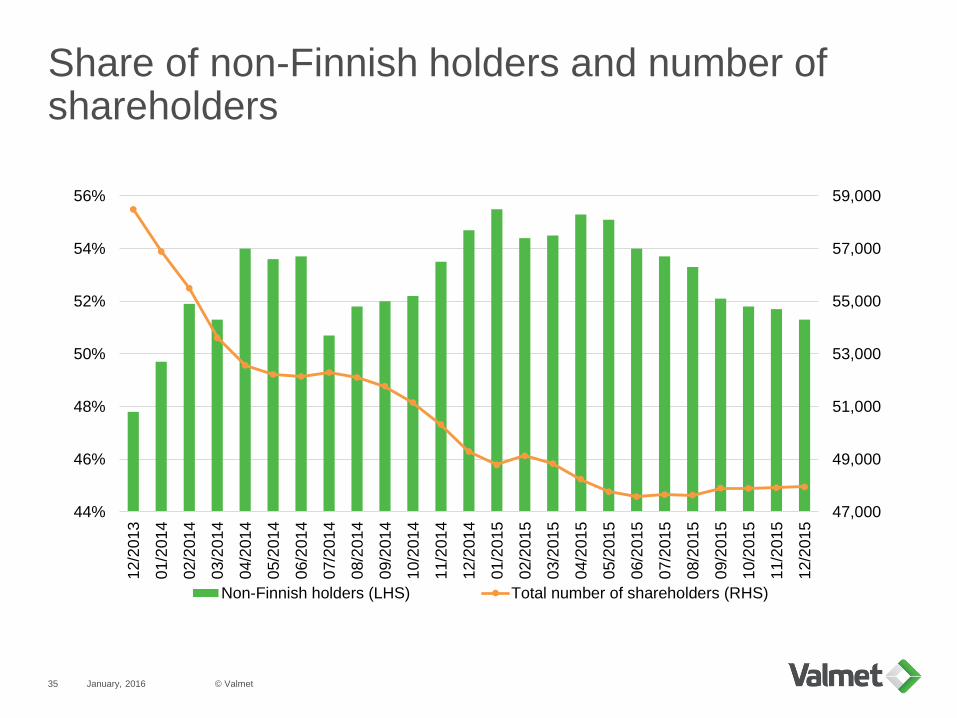
Nominee registered and non-Finnish holders 298 0.6% 76,891,116 51.3%
Finnish institutions, companies and foundations 2,629 5.5% 34,619,876 23.1%
Solidium Oy10 0.0% 16,695,287 11.1%
Finnish private investors 45,025 93.9% 21,658,340 14.5%
Total 47,952 100.0% 149,864,619 100.0%
© Valmet34
51.3%
23.1%
11.1%
14.5%
Nominee registered and non-Finnish holders
Finnish institutions, companies and foundations
Solidium Oy
Finnish private investors
47,000
49,000
51,000
53,000
55,000
57,000
59,000
44%
46%
48%
50%
52%
54%
56%
12/2
01
3
01/2
01
4
02/2
01
4
03/2
01
4
04/2
01
4
05/2
01
4
06/2
01
4
07/2
01
4
08/2
01
4
09/2
01
4
10/2
01
4
11/2
01
4
12/2
01
4
01/2
01
5
02/2
01
5
03/2
01
5
04/2
01
5
05/2
01
5
06/2
01
5
07/2
01
5
08/2
01
5
09/2
01
5
10/2
01
5
11/2
01
5
12/2
01
5
Non-Finnish holders (LHS) Total number of shareholders (RHS)
January, 2016
Share of non-Finnish holders and number of shareholders
© Valmet35
6.00
7.00
8.00
9.00
10.00
11.00
12.00
01/1
4
02/1
4
03/1
4
04/1
4
05/1
4
06/1
4
07/1
4
08/1
4
09/1
4
10/1
4
11/1
4
12/1
4
01/1
5
02/1
5
03/1
5
04/1
5
05/1
5
06/1
5
07/1
5
08/1
5
09/1
5
10/1
5
11/1
5
12/1
5
Valmet OMX Helsinki (rebased)
012345678
01/1
4
02/1
4
03/1
4
04/1
4
05/1
4
06/1
4
07/1
4
08/1
4
09/1
4
10/1
4
11/1
4
12/1
4
01/1
5
02/1
5
03/1
5
04/1
5
05/1
5
06/1
5
07/1
5
08/1
5
09/1
5
10/1
5
11/1
5
12/1
5
Mil
lio
n s
ha
res
Valmet volume (million shares)
January, 2016
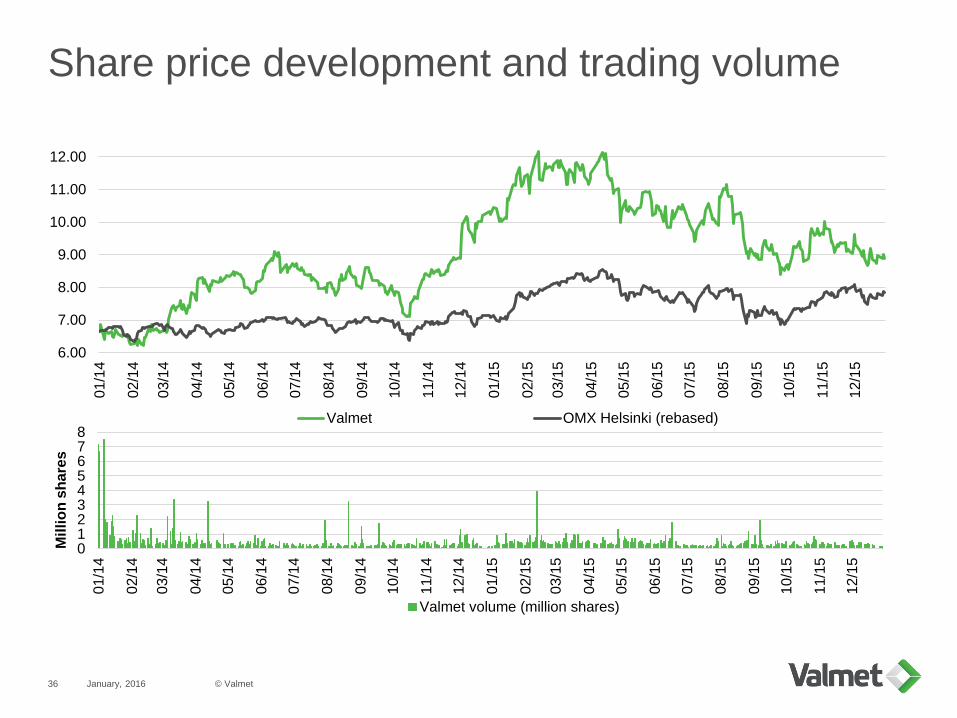
Share price development and trading volume
© Valmet36

AppendixFinancials
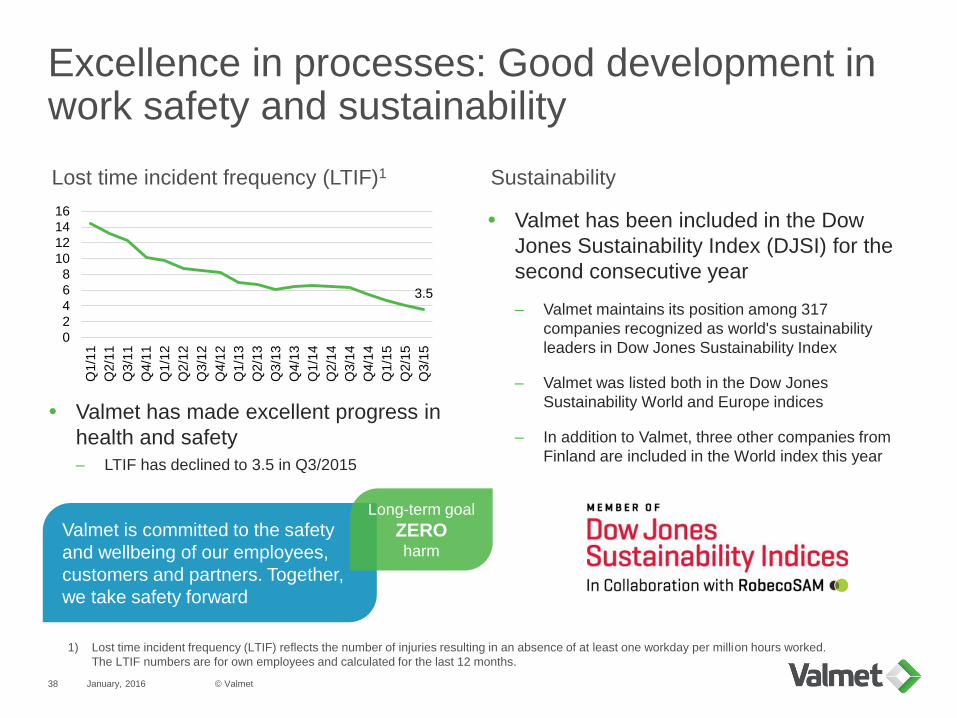
Excellence in processes: Good development in work safety and sustainability
January, 2016 © Valmet38
Valmet has made excellent progress in
health and safety
– LTIF has declined to 3.5 in Q3/2015
1) Lost time incident frequency (LTIF) reflects the number of injuries resulting in an absence of at least one workday per million hours worked.
The LTIF numbers are for own employees and calculated for the last 12 months.
Lost time incident frequency (LTIF)1 Sustainability
Valmet is committed to the safety
and wellbeing of our employees,
customers and partners. Together,
we take safety forward
Long-term goal
ZEROharm
3.5
0
2
4
6
8
10
12
14
16
Q1/1
1
Q2/1
1
Q3/1
1
Q4/1
1
Q1/1
2
Q2/1
2
Q3/1
2
Q4/1
2
Q1/1
3
Q2/1
3
Q3/1
3
Q4/1
3
Q1/1
4
Q2/1
4
Q3/1
4
Q4/1
4
Q1/1
5
Q2/1
5
Q3/1
5
Valmet has been included in the Dow
Jones Sustainability Index (DJSI) for the
second consecutive year
– Valmet maintains its position among 317
companies recognized as world's sustainability
leaders in Dow Jones Sustainability Index
– Valmet was listed both in the Dow Jones
Sustainability World and Europe indices
– In addition to Valmet, three other companies from
Finland are included in the World index this year
January, 2016
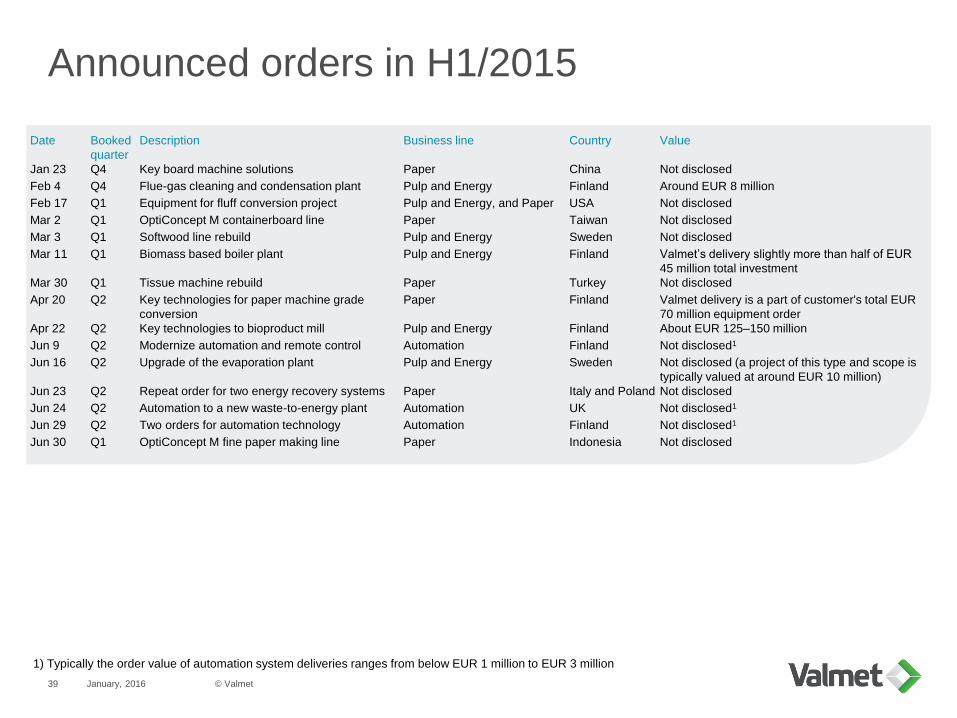
Announced orders in H1/2015
Date Booked
quarter
Description Business line Country Value
Jan 23 Q4 Key board machine solutions Paper China Not disclosed
Feb 4 Q4 Flue-gas cleaning and condensation plant Pulp and Energy Finland Around EUR 8 million
Feb 17 Q1 Equipment for fluff conversion project Pulp and Energy, and Paper USA Not disclosed
Mar 2 Q1 OptiConcept M containerboard line Paper Taiwan Not disclosed
Mar 3 Q1 Softwood line rebuild Pulp and Energy Sweden Not disclosed
Mar 11 Q1 Biomass based boiler plant Pulp and Energy Finland Valmet’s delivery slightly more than half of EUR
45 million total investment
Mar 30 Q1 Tissue machine rebuild Paper Turkey Not disclosed
Apr 20 Q2 Key technologies for paper machine grade
conversion
Paper Finland Valmet delivery is a part of customer's total EUR
70 million equipment order
Apr 22 Q2 Key technologies to bioproduct mill Pulp and Energy Finland About EUR 125–150 million
Jun 9 Q2 Modernize automation and remote control Automation Finland Not disclosed1
Jun 16 Q2 Upgrade of the evaporation plant Pulp and Energy Sweden Not disclosed (a project of this type and scope is
typically valued at around EUR 10 million)
Jun 23 Q2 Repeat order for two energy recovery systems Paper Italy and Poland Not disclosed
Jun 24 Q2 Automation to a new waste-to-energy plant Automation UK Not disclosed1
Jun 29 Q2 Two orders for automation technology Automation Finland Not disclosed1
Jun 30 Q1 OptiConcept M fine paper making line Paper Indonesia Not disclosed
1) Typically the order value of automation system deliveries ranges from below EUR 1 million to EUR 3 million
© Valmet39
January, 2016
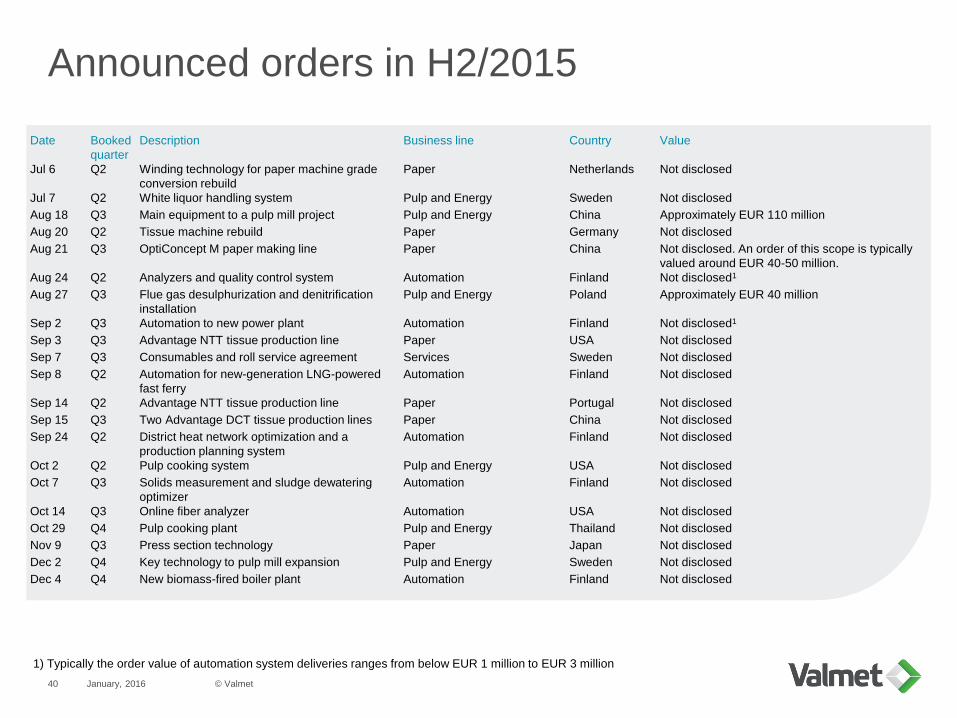
Announced orders in H2/2015
Date Booked
quarter
Description Business line Country Value
Jul 6 Q2 Winding technology for paper machine grade
conversion rebuild
Paper Netherlands Not disclosed
Jul 7 Q2 White liquor handling system Pulp and Energy Sweden Not disclosed
Aug 18 Q3 Main equipment to a pulp mill project Pulp and Energy China Approximately EUR 110 million
Aug 20 Q2 Tissue machine rebuild Paper Germany Not disclosed
Aug 21 Q3 OptiConcept M paper making line Paper China Not disclosed. An order of this scope is typically
valued around EUR 40-50 million.
Aug 24 Q2 Analyzers and quality control system Automation Finland Not disclosed1
Aug 27 Q3 Flue gas desulphurization and denitrification
installation
Pulp and Energy Poland Approximately EUR 40 million
Sep 2 Q3 Automation to new power plant Automation Finland Not disclosed1
Sep 3 Q3 Advantage NTT tissue production line Paper USA Not disclosed
Sep 7 Q3 Consumables and roll service agreement Services Sweden Not disclosed
Sep 8 Q2 Automation for new-generation LNG-powered
fast ferry
Automation Finland Not disclosed
Sep 14 Q2 Advantage NTT tissue production line Paper Portugal Not disclosed
Sep 15 Q3 Two Advantage DCT tissue production lines Paper China Not disclosed
Sep 24 Q2 District heat network optimization and a
production planning system
Automation Finland Not disclosed
Oct 2 Q2 Pulp cooking system Pulp and Energy USA Not disclosed
Oct 7 Q3 Solids measurement and sludge dewatering
optimizer
Automation Finland Not disclosed
Oct 14 Q3 Online fiber analyzer Automation USA Not disclosed
Oct 29 Q4 Pulp cooking plant Pulp and Energy Thailand Not disclosed
Nov 9 Q3 Press section technology Paper Japan Not disclosed
Dec 2 Q4 Key technology to pulp mill expansion Pulp and Energy Sweden Not disclosed
Dec 4 Q4 New biomass-fired boiler plant Automation Finland Not disclosed
1) Typically the order value of automation system deliveries ranges from below EUR 1 million to EUR 3 million
© Valmet40
January, 2016
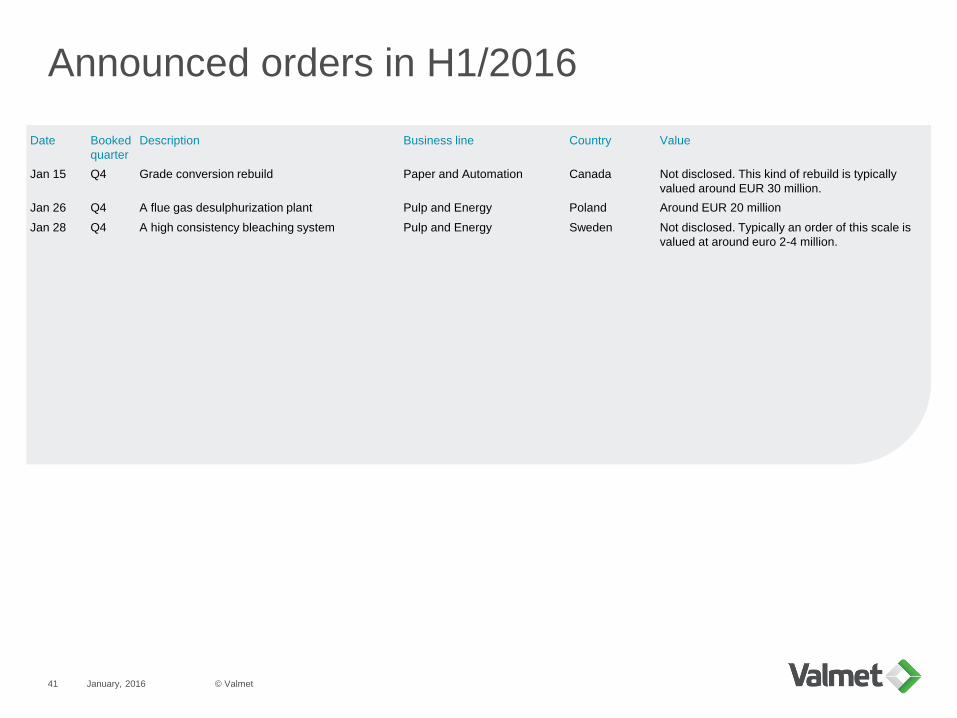
Announced orders in H1/2016
Date Booked
quarter
Description Business line Country Value
Jan 15 Q4 Grade conversion rebuild Paper and Automation Canada Not disclosed. This kind of rebuild is typically
valued around EUR 30 million.
Jan 26 Q4 A flue gas desulphurization plant Pulp and Energy Poland Around EUR 20 million
Jan 28 Q4 A high consistency bleaching system Pulp and Energy Sweden Not disclosed. Typically an order of this scale is
valued at around euro 2-4 million.
© Valmet41
January, 2016
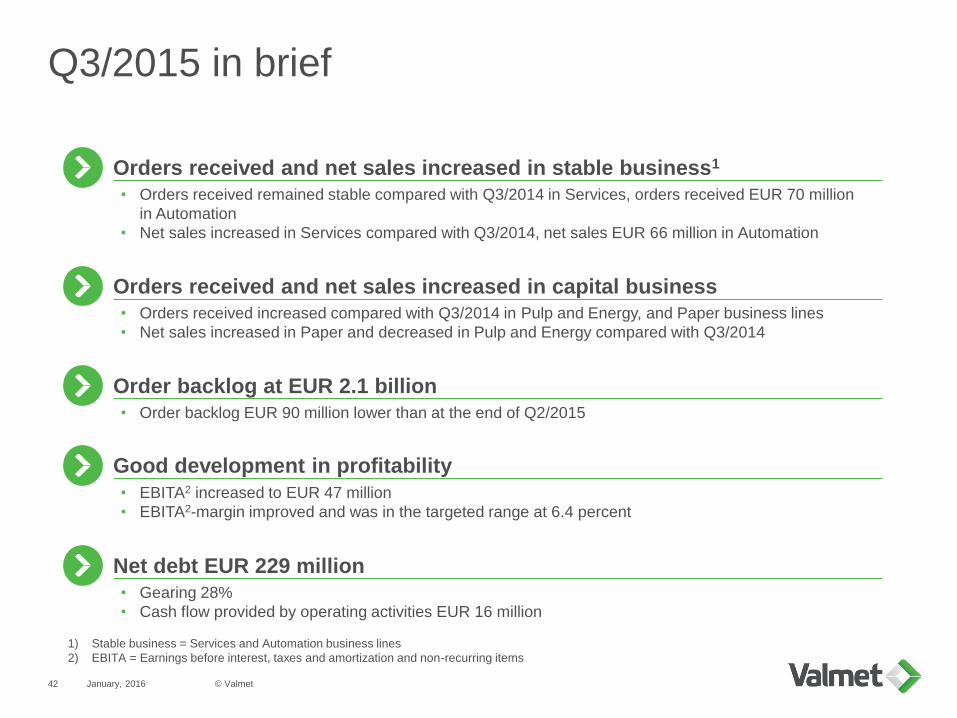
Q3/2015 in brief
© Valmet42
• Orders received increased compared with Q3/2014 in Pulp and Energy, and Paper business lines
• Net sales increased in Paper and decreased in Pulp and Energy compared with Q3/2014
Orders received and net sales increased in capital business
• Orders received remained stable compared with Q3/2014 in Services, orders received EUR 70 million
in Automation
• Net sales increased in Services compared with Q3/2014, net sales EUR 66 million in Automation
Orders received and net sales increased in stable business1
1) Stable business = Services and Automation business lines
2) EBITA = Earnings before interest, taxes and amortization and non-recurring items
• EBITA2 increased to EUR 47 million
• EBITA2-margin improved and was in the targeted range at 6.4 percent
Good development in profitability
Net debt EUR 229 million
• Gearing 28%
• Cash flow provided by operating activities EUR 16 million
• Order backlog EUR 90 million lower than at the end of Q2/2015
Order backlog at EUR 2.1 billion
January, 2016
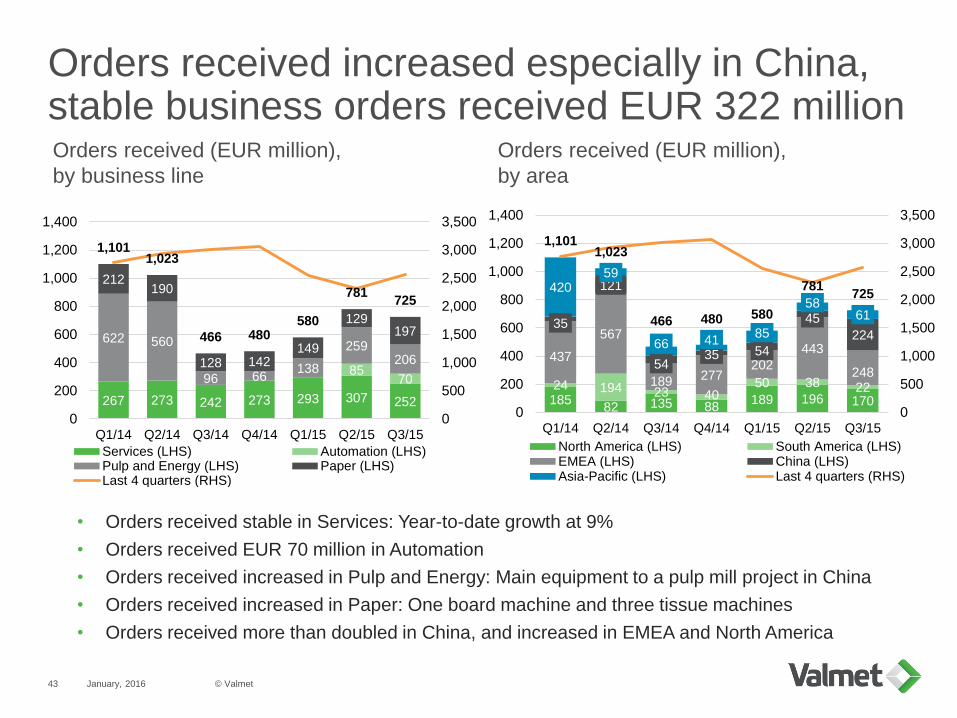
Orders received increased especially in China, stable business orders received EUR 322 million
© Valmet43
267 273 242 273 293 307 252
8570
622 560
96 66138
259206
212190
128 142149
129197
1,1011,023
466 480580
781725
0
500
1,000
1,500
2,000
2,500
3,000
3,500
0
200
400
600
800
1,000
1,200
1,400
Q1/14 Q2/14 Q3/14 Q4/14 Q1/15 Q2/15 Q3/15
Services (LHS) Automation (LHS)Pulp and Energy (LHS) Paper (LHS)Last 4 quarters (RHS)
• Orders received stable in Services: Year-to-date growth at 9%
• Orders received EUR 70 million in Automation
• Orders received increased in Pulp and Energy: Main equipment to a pulp mill project in China
• Orders received increased in Paper: One board machine and three tissue machines
• Orders received more than doubled in China, and increased in EMEA and North America
Orders received (EUR million),
by business line
Orders received (EUR million),
by area
18582 135 88
189 196 170
24 194 23 4050 38 22
437
567
189 277202
443
248
35
121
5435 54
45
224
42059
66 4185
5861
1,1011,023
466 480 580
781725
0
500
1,000
1,500
2,000
2,500
3,000
3,500
0
200
400
600
800
1,000
1,200
1,400
Q1/14 Q2/14 Q3/14 Q4/14 Q1/15 Q2/15 Q3/15
North America (LHS) South America (LHS)EMEA (LHS) China (LHS)Asia-Pacific (LHS) Last 4 quarters (RHS)
January, 2016
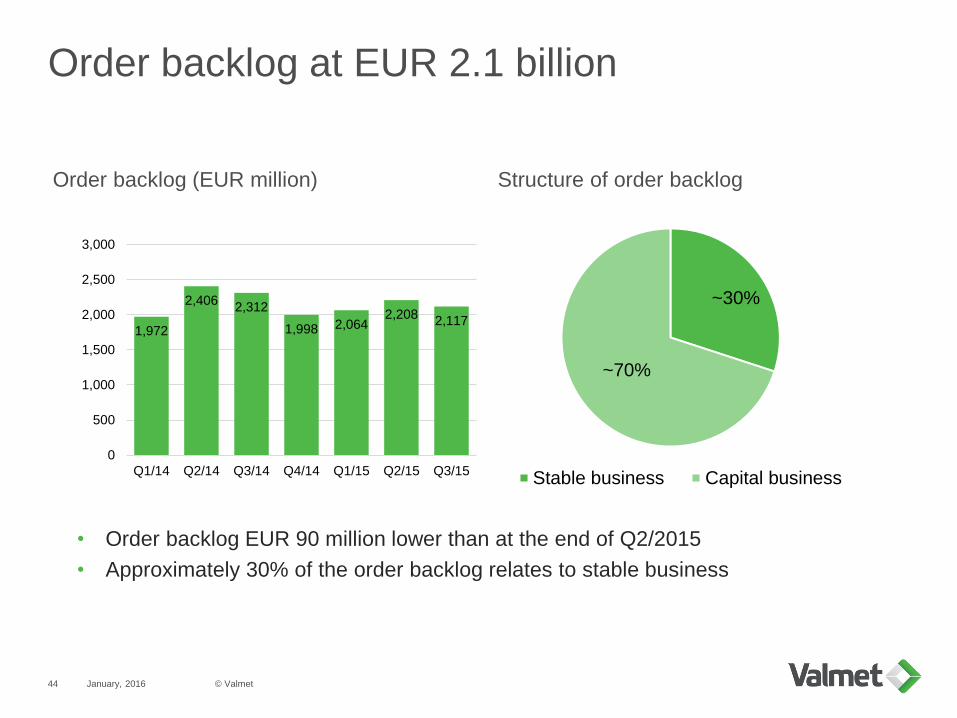
Order backlog at EUR 2.1 billion
© Valmet44
1,972
2,4062,312
1,998 2,0642,208
2,117
0
500
1,000
1,500
2,000
2,500
3,000
Q1/14 Q2/14 Q3/14 Q4/14 Q1/15 Q2/15 Q3/15
• Order backlog EUR 90 million lower than at the end of Q2/2015
• Approximately 30% of the order backlog relates to stable business
Order backlog (EUR million)
~30%
~70%
Stable business Capital business
Structure of order backlog
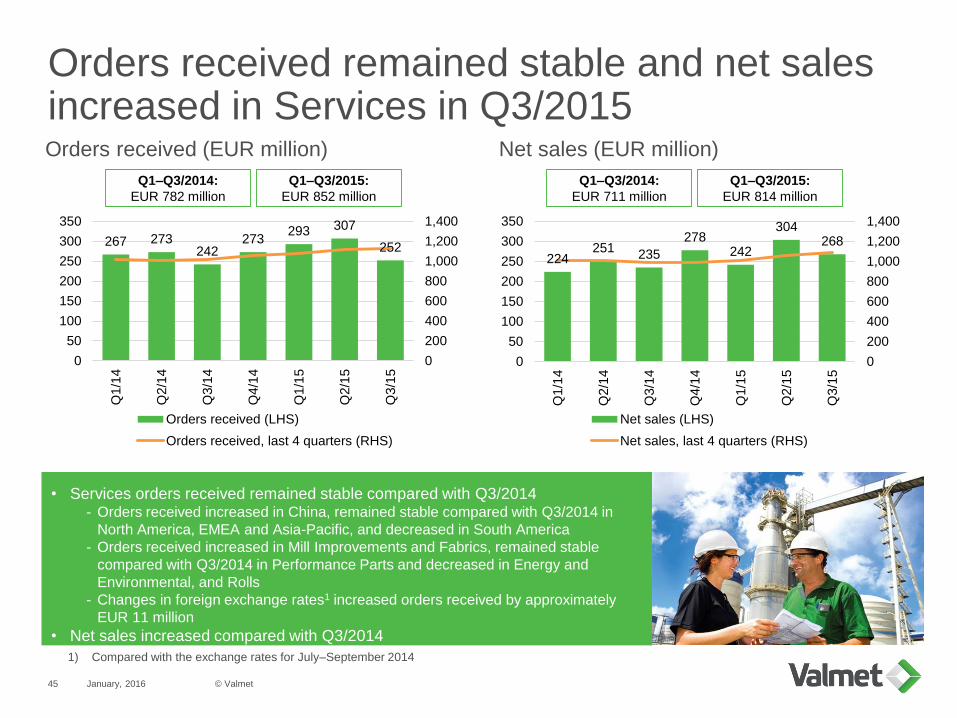
Orders received remained stable and net sales increased in Services in Q3/2015
January, 2016 © Valmet45
Net sales (EUR million)Orders received (EUR million)
• Services orders received remained stable compared with Q3/2014- Orders received increased in China, remained stable compared with Q3/2014 in
North America, EMEA and Asia-Pacific, and decreased in South America
- Orders received increased in Mill Improvements and Fabrics, remained stable
compared with Q3/2014 in Performance Parts and decreased in Energy and
Environmental, and Rolls
- Changes in foreign exchange rates1 increased orders received by approximately
EUR 11 million
• Net sales increased compared with Q3/2014
1) Compared with the exchange rates for July–September 2014
Q1–Q3/2014:
EUR 782 million
Q1–Q3/2015:
EUR 852 million
Q1–Q3/2014:
EUR 711 million
Q1–Q3/2015:
EUR 814 million
267 273242
273293 307
252
0
200
400
600
800
1,000
1,200
1,400
0
50
100
150
200
250
300
350
Q1/1
4
Q2/1
4
Q3/1
4
Q4/1
4
Q1/1
5
Q2/1
5
Q3/1
5
Orders received (LHS)
Orders received, last 4 quarters (RHS)
224251
235
278242
304268
0
200
400
600
800
1,000
1,200
1,400
0
50
100
150
200
250
300
350
Q1/1
4
Q2/1
4
Q3/1
4
Q4/1
4
Q1/1
5
Q2/1
5
Q3/1
5
Net sales (LHS)
Net sales, last 4 quarters (RHS)
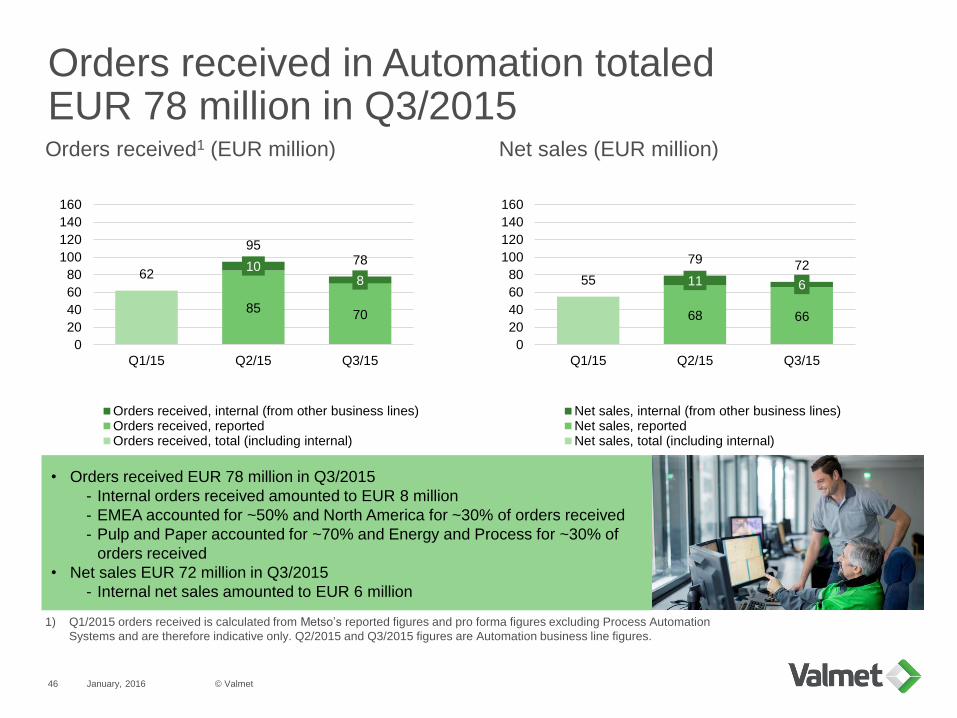
Orders received in Automation totaled EUR 78 million in Q3/2015
January, 2016 © Valmet46
Net sales (EUR million)Orders received1 (EUR million)
• Orders received EUR 78 million in Q3/2015
- Internal orders received amounted to EUR 8 million
- EMEA accounted for ~50% and North America for ~30% of orders received
- Pulp and Paper accounted for ~70% and Energy and Process for ~30% of
orders received
• Net sales EUR 72 million in Q3/2015
- Internal net sales amounted to EUR 6 million
1) Q1/2015 orders received is calculated from Metso’s reported figures and pro forma figures excluding Process Automation
Systems and are therefore indicative only. Q2/2015 and Q3/2015 figures are Automation business line figures.
8570
108
62
9578
0
20
40
60
80
100
120
140
160
Q1/15 Q2/15 Q3/15
Orders received, internal (from other business lines)Orders received, reportedOrders received, total (including internal)
68 66
11 655
79 72
0
20
40
60
80
100
120
140
160
Q1/15 Q2/15 Q3/15
Net sales, internal (from other business lines)Net sales, reportedNet sales, total (including internal)
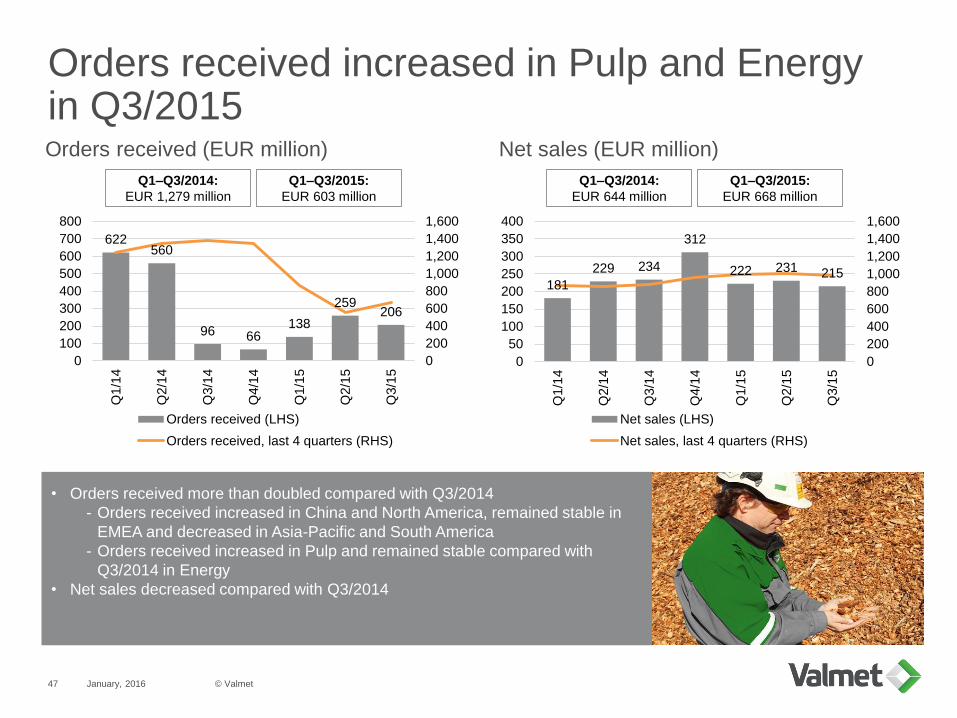
Orders received increased in Pulp and Energy in Q3/2015
January, 2016 © Valmet47
Net sales (EUR million)Orders received (EUR million)
• Orders received more than doubled compared with Q3/2014
- Orders received increased in China and North America, remained stable in
EMEA and decreased in Asia-Pacific and South America
- Orders received increased in Pulp and remained stable compared with
Q3/2014 in Energy
• Net sales decreased compared with Q3/2014
Q1–Q3/2014:
EUR 1,279 million
Q1–Q3/2015:
EUR 603 million
Q1–Q3/2014:
EUR 644 million
Q1–Q3/2015:
EUR 668 million
622560
96 66138
259206
0
200
400
600
800
1,000
1,200
1,400
1,600
0
100
200
300
400
500
600
700
800
Q1/1
4
Q2/1
4
Q3/1
4
Q4/1
4
Q1/1
5
Q2/1
5
Q3/1
5
Orders received (LHS)
Orders received, last 4 quarters (RHS)
181
229 234
312
222 231 215
0
200
400
600
800
1,000
1,200
1,400
1,600
0
50
100
150
200
250
300
350
400
Q1/1
4
Q2/1
4
Q3/1
4
Q4/1
4
Q1/1
5
Q2/1
5
Q3/1
5
Net sales (LHS)
Net sales, last 4 quarters (RHS)
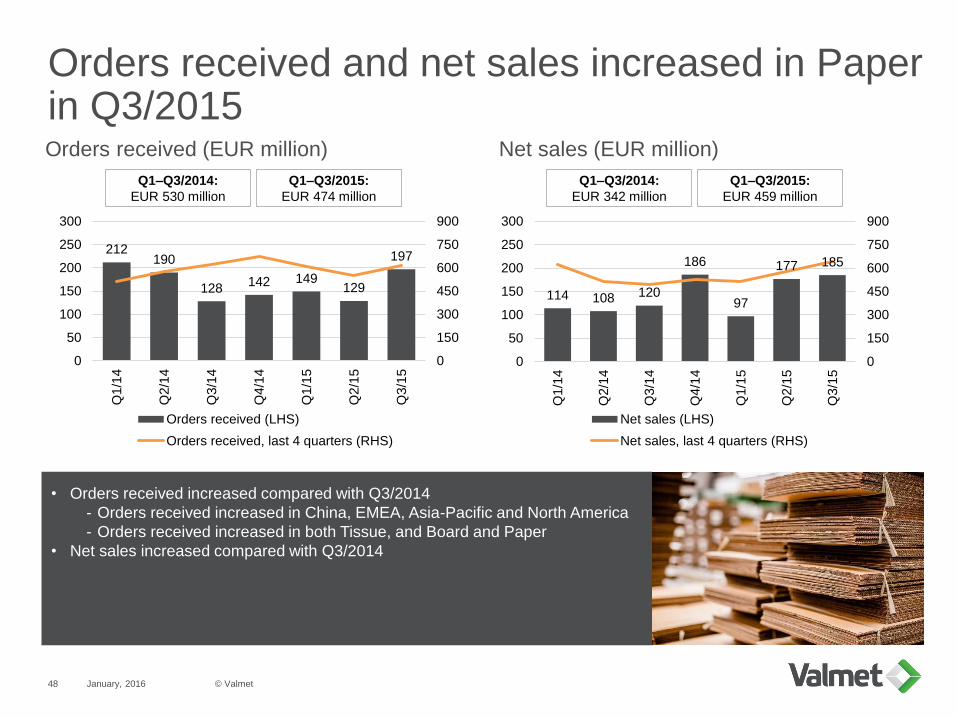
Orders received and net sales increased in Paper in Q3/2015
January, 2016 © Valmet48
Net sales (EUR million)Orders received (EUR million)
• Orders received increased compared with Q3/2014
- Orders received increased in China, EMEA, Asia-Pacific and North America
- Orders received increased in both Tissue, and Board and Paper
• Net sales increased compared with Q3/2014
Q1–Q3/2014:
EUR 530 million
Q1–Q3/2015:
EUR 474 million
Q1–Q3/2014:
EUR 342 million
Q1–Q3/2015:
EUR 459 million
212190
128142 149
129
197
0
150
300
450
600
750
900
0
50
100
150
200
250
300
Q1/1
4
Q2/1
4
Q3/1
4
Q4/1
4
Q1/1
5
Q2/1
5
Q3/1
5
Orders received (LHS)
Orders received, last 4 quarters (RHS)
114 108 120
186
97
177 185
0
150
300
450
600
750
900
0
50
100
150
200
250
300
Q1/1
4
Q2/1
4
Q3/1
4
Q4/1
4
Q1/1
5
Q2/1
5
Q3/1
5
Net sales (LHS)
Net sales, last 4 quarters (RHS)
January, 2016
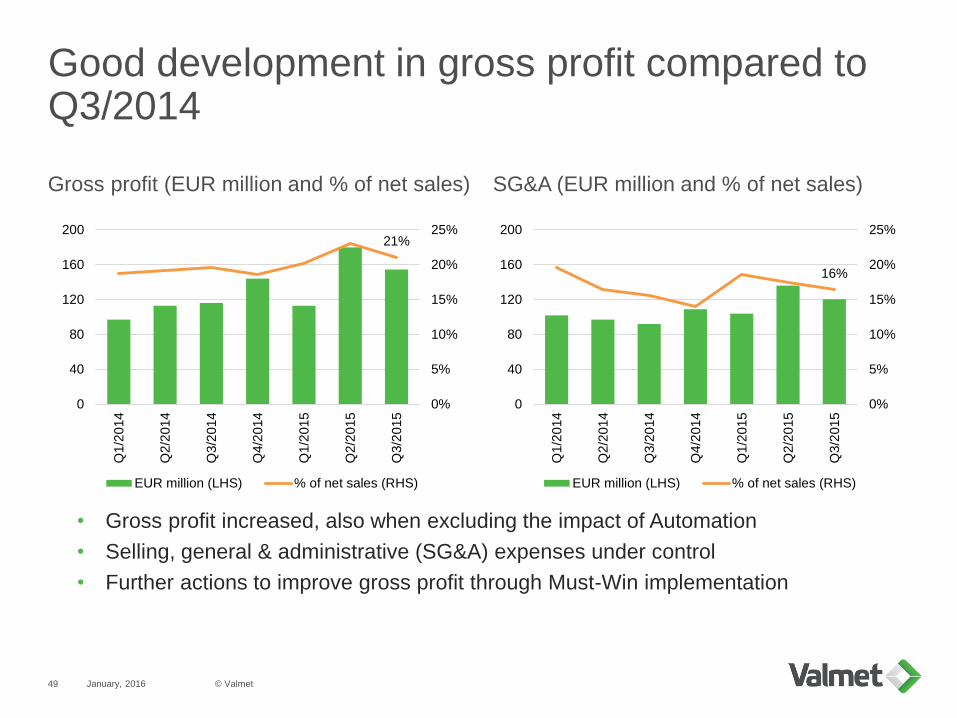
Good development in gross profit compared to Q3/2014
© Valmet49
21%
0%
5%
10%
15%
20%
25%
0
40
80
120
160
200
Q1/2
014
Q2/2
014
Q3/2
014
Q4/2
014
Q1/2
015
Q2/2
015
Q3/2
015
EUR million (LHS) % of net sales (RHS)
16%
0%
5%
10%
15%
20%
25%
0
40
80
120
160
200
Q1/2
014
Q2/2
014
Q3/2
014
Q4/2
014
Q1/2
015
Q2/2
015
Q3/2
015
EUR million (LHS) % of net sales (RHS)
Gross profit (EUR million and % of net sales)
• Gross profit increased, also when excluding the impact of Automation
• Selling, general & administrative (SG&A) expenses under control
• Further actions to improve gross profit through Must-Win implementation
SG&A (EUR million and % of net sales)
January, 2016
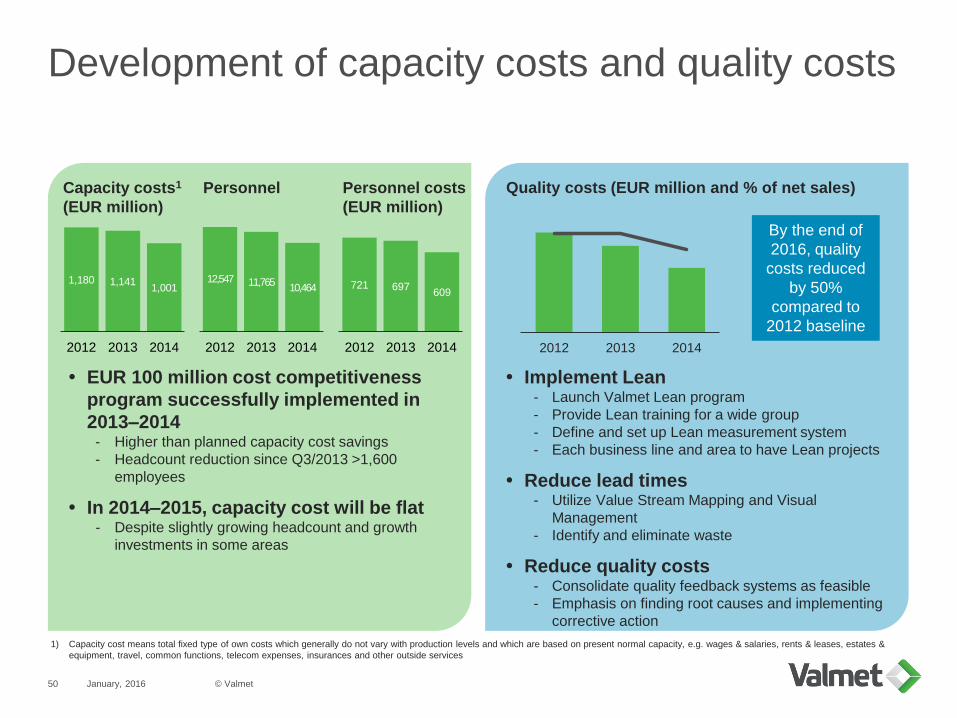
Development of capacity costs and quality costs
Implement Lean- Launch Valmet Lean program
- Provide Lean training for a wide group
- Define and set up Lean measurement system
- Each business line and area to have Lean projects
Reduce lead times - Utilize Value Stream Mapping and Visual
Management
- Identify and eliminate waste
Reduce quality costs- Consolidate quality feedback systems as feasible
- Emphasis on finding root causes and implementing
corrective action
EUR 100 million cost competitiveness
program successfully implemented in
2013–2014- Higher than planned capacity cost savings
- Headcount reduction since Q3/2013 >1,600
employees
In 2014–2015, capacity cost will be flat- Despite slightly growing headcount and growth
investments in some areas
Capacity costs1
(EUR million)
1,180 1,1411,001
2012 2013 2014
Personnel
12,547 11,76510,464
2012 2013 2014
Personnel costs
(EUR million)
721 697609
2012 2013 2014
1) Capacity cost means total fixed type of own costs which generally do not vary with production levels and which are based on present normal capacity, e.g. wages & salaries, rents & leases, estates &
equipment, travel, common functions, telecom expenses, insurances and other outside services
Quality costs (EUR million and % of net sales)
2012 2013 2014
By the end of
2016, quality
costs reduced
by 50%
compared to
2012 baseline
© Valmet50
January, 2016
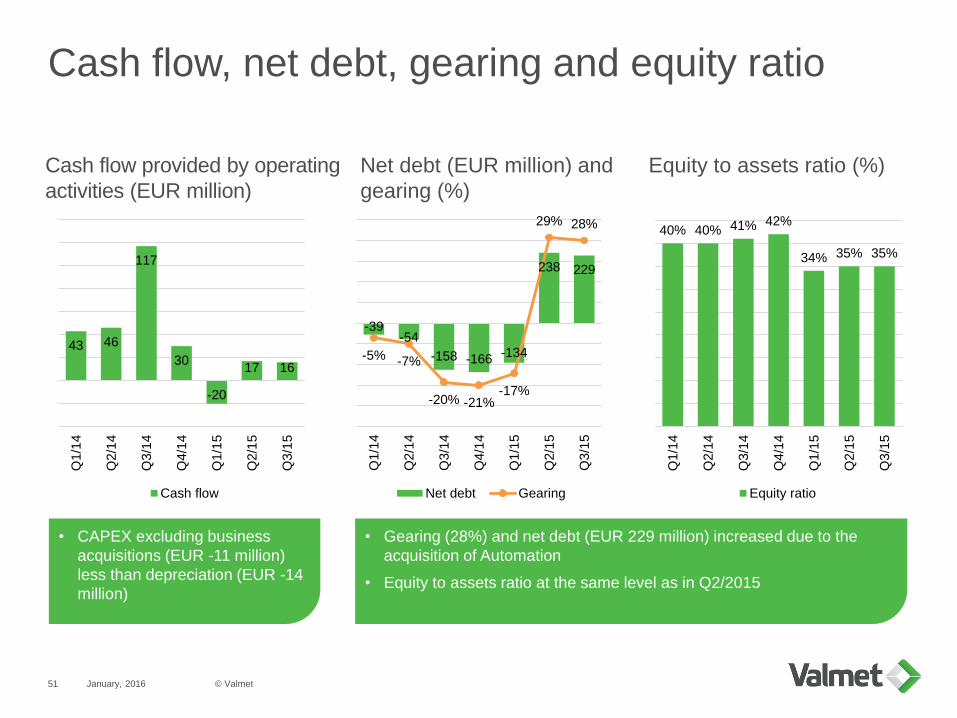
Cash flow, net debt, gearing and equity ratio
• Gearing (28%) and net debt (EUR 229 million) increased due to the
acquisition of Automation
• Equity to assets ratio at the same level as in Q2/2015
Net debt (EUR million) and
gearing (%)
Equity to assets ratio (%)Cash flow provided by operating
activities (EUR million)
• CAPEX excluding business
acquisitions (EUR -11 million)
less than depreciation (EUR -14
million)
© Valmet51
-39-54
-158 -166-134
238 229
-5% -7%
-20% -21%-17%
29% 28%
Q1/1
4
Q2/1
4
Q3/1
4
Q4/1
4
Q1/1
5
Q2/1
5
Q3/1
5
Net debt Gearing
40% 40% 41% 42%
34% 35% 35%
Q1/1
4
Q2/1
4
Q3/1
4
Q4/1
4
Q1/1
5
Q2/1
5
Q3/1
5
Equity ratio
43 46
117
30
-20
17 16
Q1/1
4
Q2/1
4
Q3/1
4
Q4/1
4
Q1/1
5
Q2/1
5
Q3/1
5
Cash flow
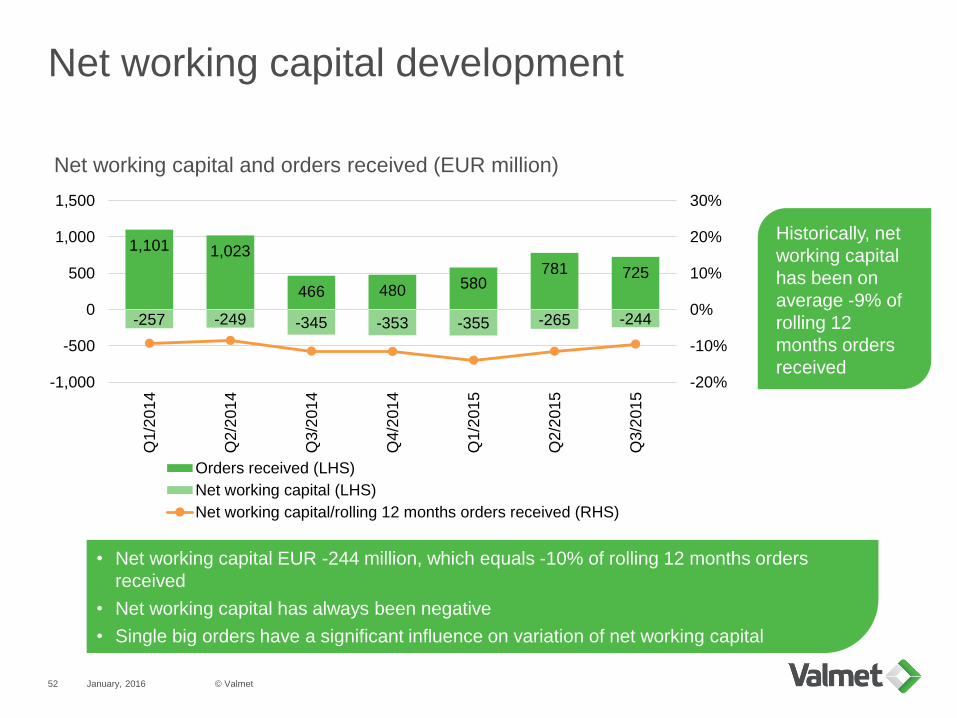
Net working capital development
January, 2016
• Net working capital EUR -244 million, which equals -10% of rolling 12 months orders
received
• Net working capital has always been negative
• Single big orders have a significant influence on variation of net working capital
© Valmet52
-257 -249 -345 -353 -355 -265 -244
1,101 1,023
466 480 580781 725
-20%
-10%
0%
10%
20%
30%
-1,000
-500
0
500
1,000
1,500
Q1/2
01
4
Q2/2
01
4
Q3/2
01
4
Q4/2
01
4
Q1/2
01
5
Q2/2
01
5
Q3/2
01
5
Orders received (LHS)
Net working capital (LHS)
Net working capital/rolling 12 months orders received (RHS)
Net working capital and orders received (EUR million)
Historically, net
working capital
has been on
average -9% of
rolling 12
months orders
received
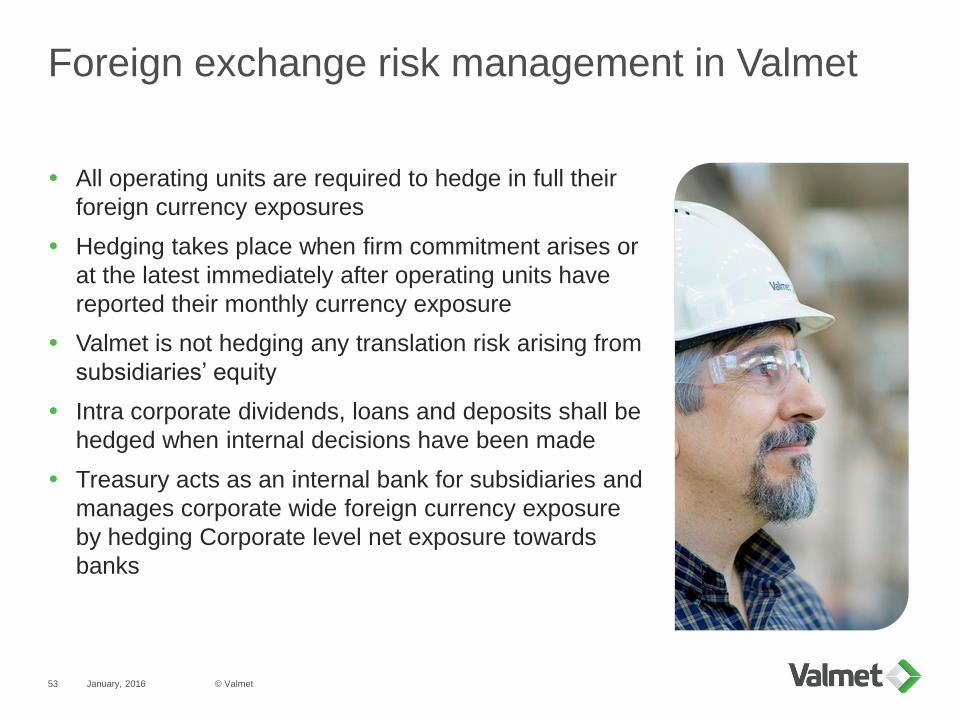
Foreign exchange risk management in Valmet
All operating units are required to hedge in full their
foreign currency exposures
Hedging takes place when firm commitment arises or
at the latest immediately after operating units have
reported their monthly currency exposure
Valmet is not hedging any translation risk arising from
subsidiaries’ equity
Intra corporate dividends, loans and deposits shall be
hedged when internal decisions have been made
Treasury acts as an internal bank for subsidiaries and
manages corporate wide foreign currency exposure
by hedging Corporate level net exposure towards
banks
January, 2016 © Valmet53
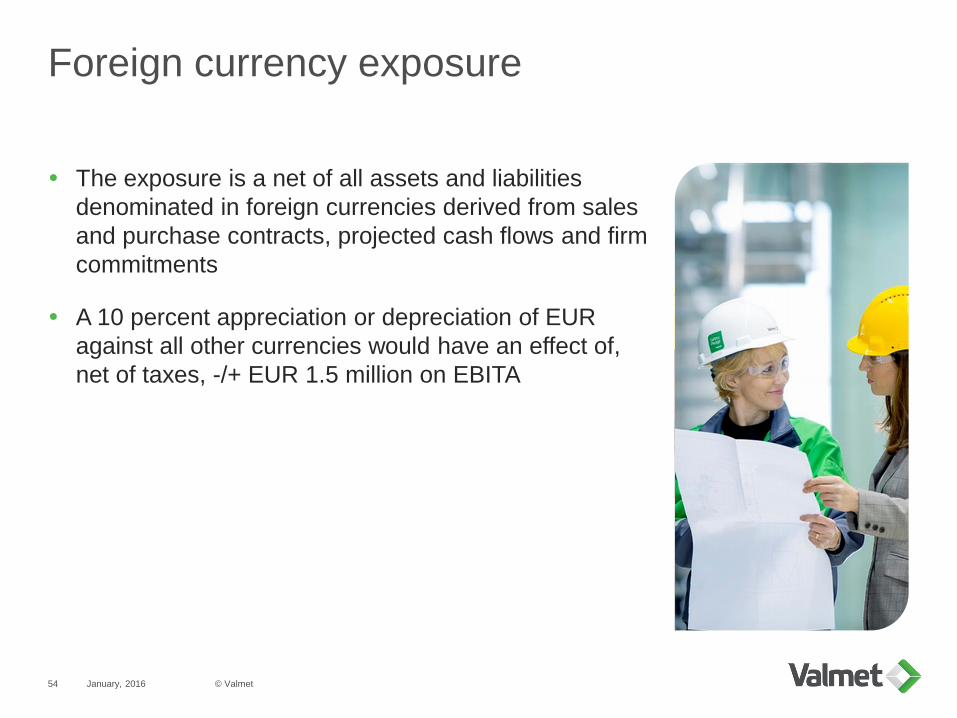
Foreign currency exposure
The exposure is a net of all assets and liabilities
denominated in foreign currencies derived from sales
and purchase contracts, projected cash flows and firm
commitments
A 10 percent appreciation or depreciation of EUR
against all other currencies would have an effect of,
net of taxes, -/+ EUR 1.5 million on EBITA
January, 2016 © Valmet54
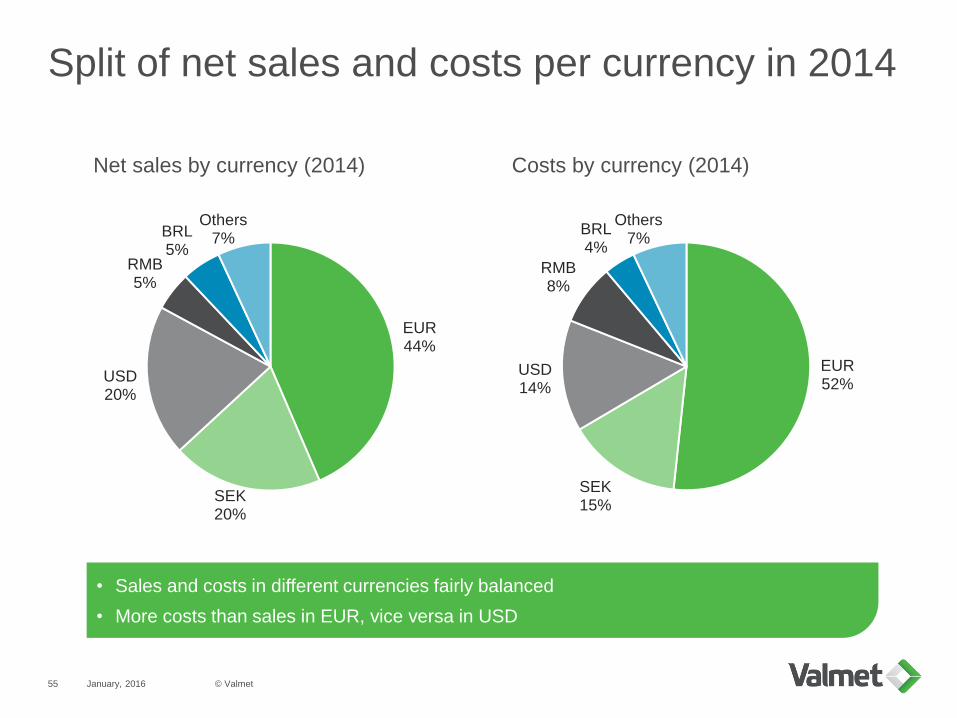
Split of net sales and costs per currency in 2014
January, 2016
Net sales by currency (2014) Costs by currency (2014)
EUR44%
SEK20%
USD20%
RMB5%
BRL5%
Others7%
EUR52%
SEK15%
USD14%
RMB8%
BRL4%
Others7%
• Sales and costs in different currencies fairly balanced
• More costs than sales in EUR, vice versa in USD
© Valmet55
January, 2016
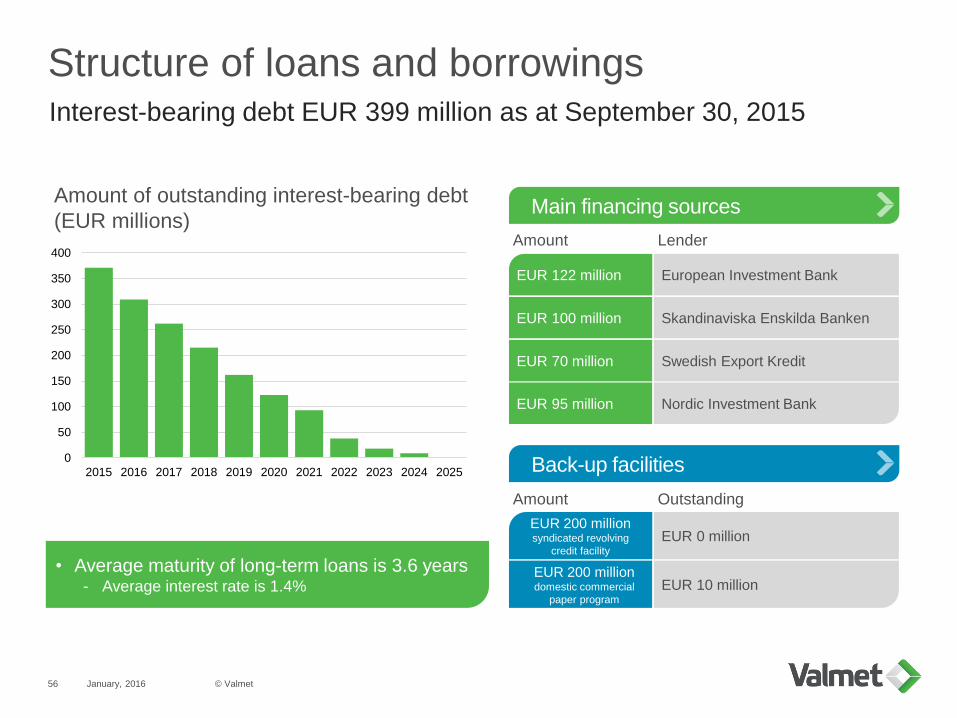
Structure of loans and borrowingsInterest-bearing debt EUR 399 million as at September 30, 2015
© Valmet56
0
50
100
150
200
250
300
350
400
2015 2016 2017 2018 2019 2020 2021 2022 2023 2024 2025
Amount of outstanding interest-bearing debt
(EUR millions)
• Average maturity of long-term loans is 3.6 years- Average interest rate is 1.4%
Main financing sources
Back-up facilities
EUR 122 million
EUR 100 million
European Investment Bank
Skandinaviska Enskilda Banken
Nordic Investment Bank
Amount Lender
EUR 70 million Swedish Export Kredit
EUR 95 million
EUR 0 million
EUR 200 million domestic commercial
paper program
EUR 200 million syndicated revolving
credit facility
Amount Outstanding
EUR 10 million
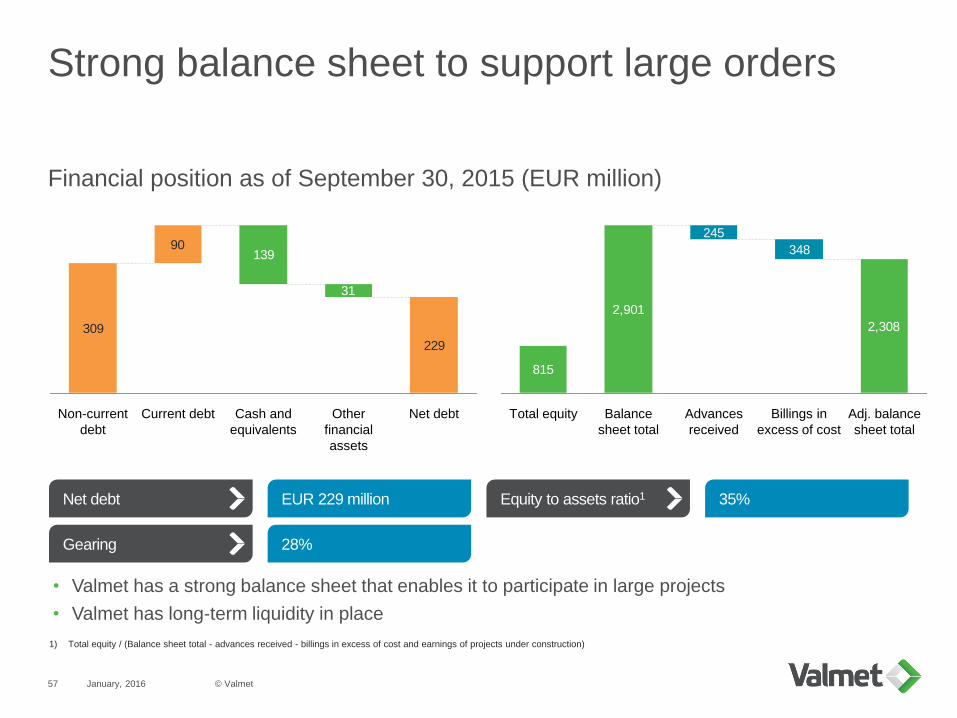
Strong balance sheet to support large orders
Financial position as of September 30, 2015 (EUR million)
January, 2016
Net debt
Gearing
EUR 229 million
28%
Equity to assets ratio1 35%
• Valmet has a strong balance sheet that enables it to participate in large projects
• Valmet has long-term liquidity in place
1) Total equity / (Balance sheet total - advances received - billings in excess of cost and earnings of projects under construction)
309
90
229
31
139
Non-current
debt
Cash and
equivalents
Current debt Other
financial
assets
Net debt
815
2,901
245
348
2,308
Total equity Adj. balance
sheet total
Billings in
excess of cost
Advances
received
Balance
sheet total
© Valmet57
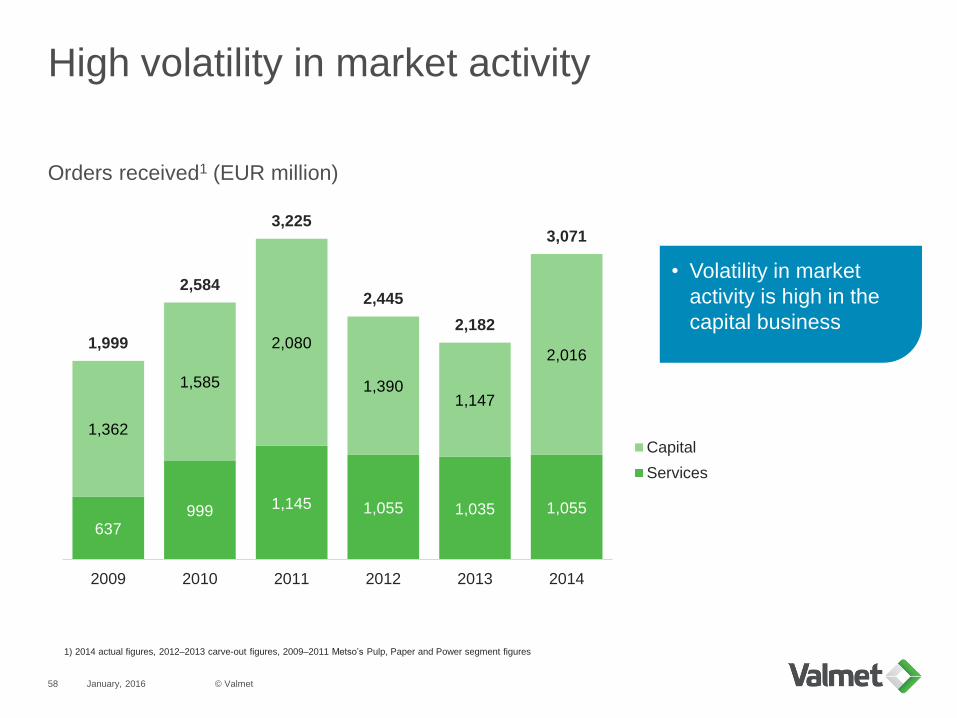
High volatility in market activity
January, 2016
1) 2014 actual figures, 2012–2013 carve-out figures, 2009–2011 Metso’s Pulp, Paper and Power segment figures
637999 1,145 1,055 1,035 1,055
1,362
1,585
2,080
1,3901,147
2,0161,999
2,584
3,225
2,445
2,182
3,071
2009 2010 2011 2012 2013 2014
Capital
Services
Orders received1 (EUR million)
• Volatility in market
activity is high in the
capital business
© Valmet58
January, 2016
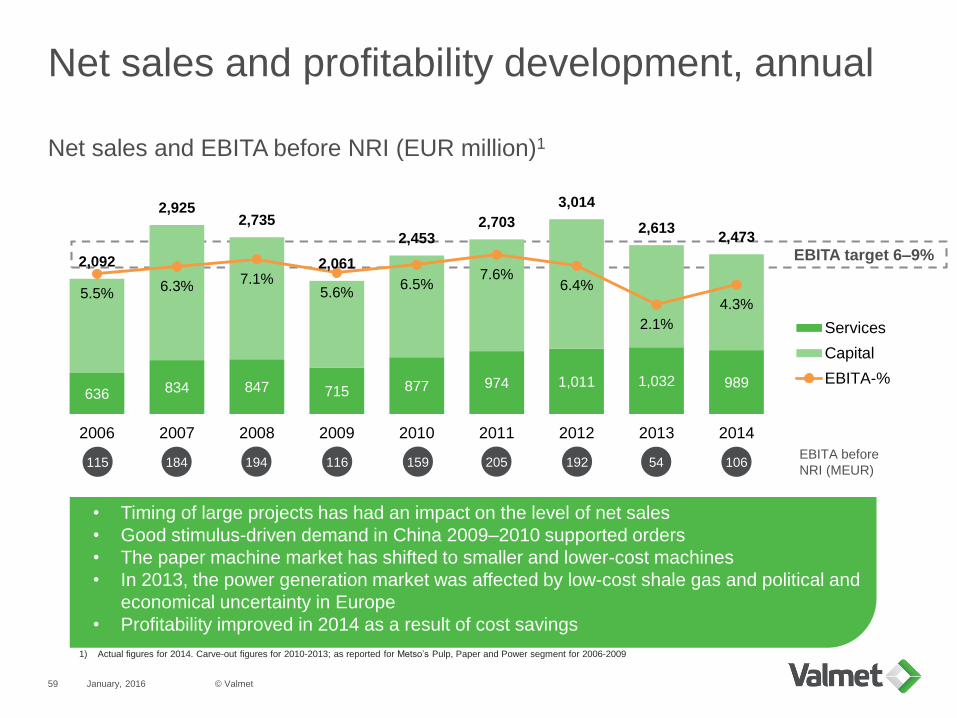
Net sales and profitability development, annual
Net sales and EBITA before NRI (EUR million)1
1) Actual figures for 2014. Carve-out figures for 2010-2013; as reported for Metso’s Pulp, Paper and Power segment for 2006-2009
• Timing of large projects has had an impact on the level of net sales
• Good stimulus-driven demand in China 2009–2010 supported orders
• The paper machine market has shifted to smaller and lower-cost machines
• In 2013, the power generation market was affected by low-cost shale gas and political and
economical uncertainty in Europe
• Profitability improved in 2014 as a result of cost savings
EBITA before
NRI (MEUR)
EBITA target 6–9%
636 834 847 715 877 974 1,011 1,032 989
2,092
2,9252,735
2,061
2,4532,703
3,014
2,6132,473
5.5%6.3%
7.1%5.6%
6.5%7.6%
6.4%
2.1%
4.3%
2006 2007 2008 2009 2010 2011 2012 2013 2014
Services
Capital
EBITA-%
115 184 194 116 159 205 192 54 106
© Valmet59
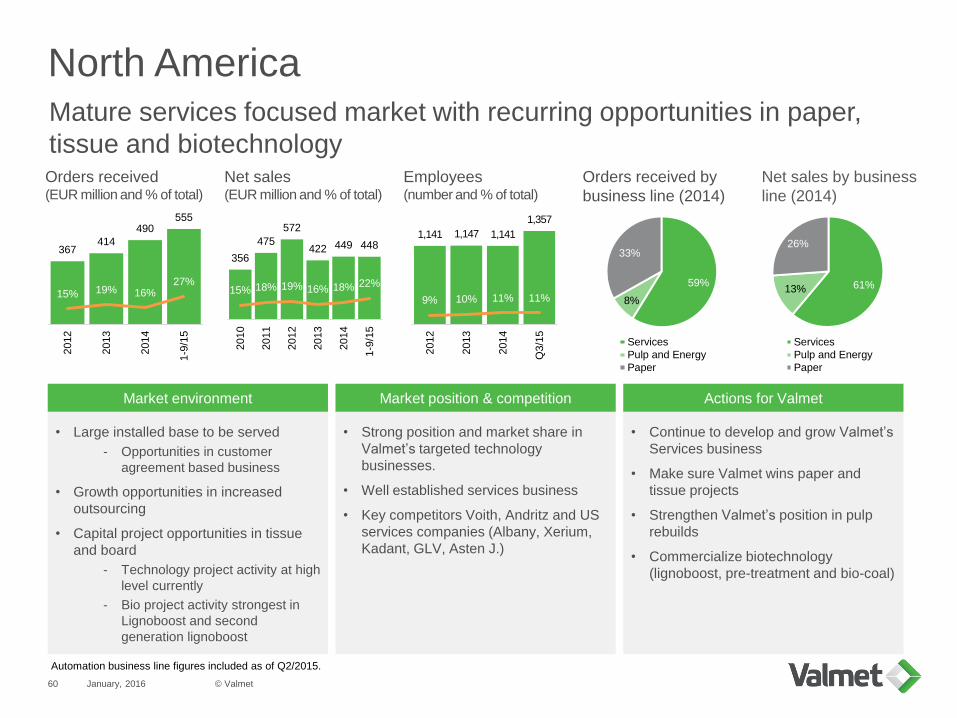
North America
January, 2016
Mature services focused market with recurring opportunities in paper,
tissue and biotechnologyOrders received(EUR million and % of total)
Net sales(EUR million and % of total)
Employees(number and % of total)
Orders received by
business line (2014)
Net sales by business
line (2014)
367414
490555
15% 19% 16%27%
2012
2013
2014
1-9
/15
• Large installed base to be served
- Opportunities in customer
agreement based business
• Growth opportunities in increased
outsourcing
• Capital project opportunities in tissue
and board
- Technology project activity at high
level currently
- Bio project activity strongest in
Lignoboost and second
generation lignoboost
• Strong position and market share in
Valmet’s targeted technology
businesses.
• Well established services business
• Key competitors Voith, Andritz and US
services companies (Albany, Xerium,
Kadant, GLV, Asten J.)
• Continue to develop and grow Valmet’s
Services business
• Make sure Valmet wins paper and
tissue projects
• Strengthen Valmet’s position in pulp
rebuilds
• Commercialize biotechnology
(lignoboost, pre-treatment and bio-coal)
Market environment Market position & competition Actions for Valmet
356
475
572
422 449 448
15% 18% 19% 16% 18% 22%
2010
2011
2012
2013
2014
1-9
/15
1,141 1,147 1,141
1,357
9% 10% 11% 11%
2012
2013
2014
Q3/1
5
59%
8%
33%
Services
Pulp and Energy
Paper
61%13%
26%
Services
Pulp and Energy
Paper
Automation business line figures included as of Q2/2015.
© Valmet60
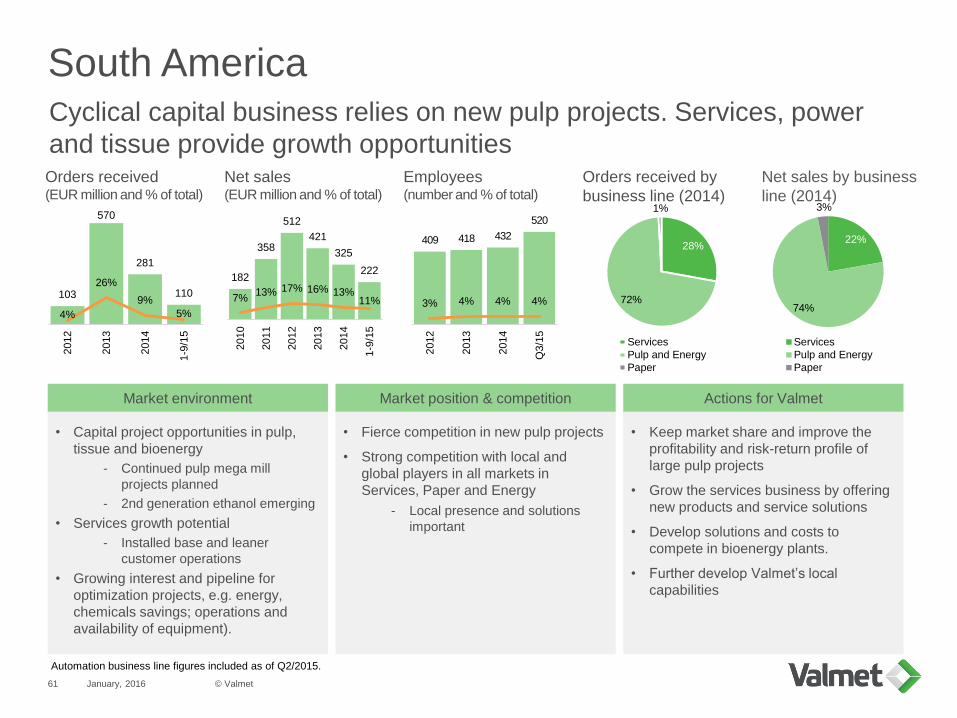
South America
January, 2016
Cyclical capital business relies on new pulp projects. Services, power
and tissue provide growth opportunitiesOrders received(EUR million and % of total)
Net sales(EUR million and % of total)
Employees(number and % of total)
Orders received by
business line (2014)
Net sales by business
line (2014)
103
570
281
110
4%
26%
9%
5%
2012
2013
2014
1-9
/15
• Capital project opportunities in pulp,
tissue and bioenergy
- Continued pulp mega mill
projects planned
- 2nd generation ethanol emerging
• Services growth potential
- Installed base and leaner
customer operations
• Growing interest and pipeline for
optimization projects, e.g. energy,
chemicals savings; operations and
availability of equipment).
• Fierce competition in new pulp projects
• Strong competition with local and
global players in all markets in
Services, Paper and Energy
- Local presence and solutions
important
• Keep market share and improve the
profitability and risk-return profile of
large pulp projects
• Grow the services business by offering
new products and service solutions
• Develop solutions and costs to
compete in bioenergy plants.
• Further develop Valmet’s local
capabilities
Market environment Market position & competition Actions for Valmet
182
358
512
421
325
222
7%13% 17% 16% 13%
11%
2010
2011
2012
2013
2014
1-9
/15
409 418 432
520
3% 4% 4% 4%
2012
2013
2014
Q3/1
5
28%
72%
1%
Services
Pulp and Energy
Paper
22%
74%
3%
Services
Pulp and Energy
Paper
Automation business line figures included as of Q2/2015.
© Valmet61
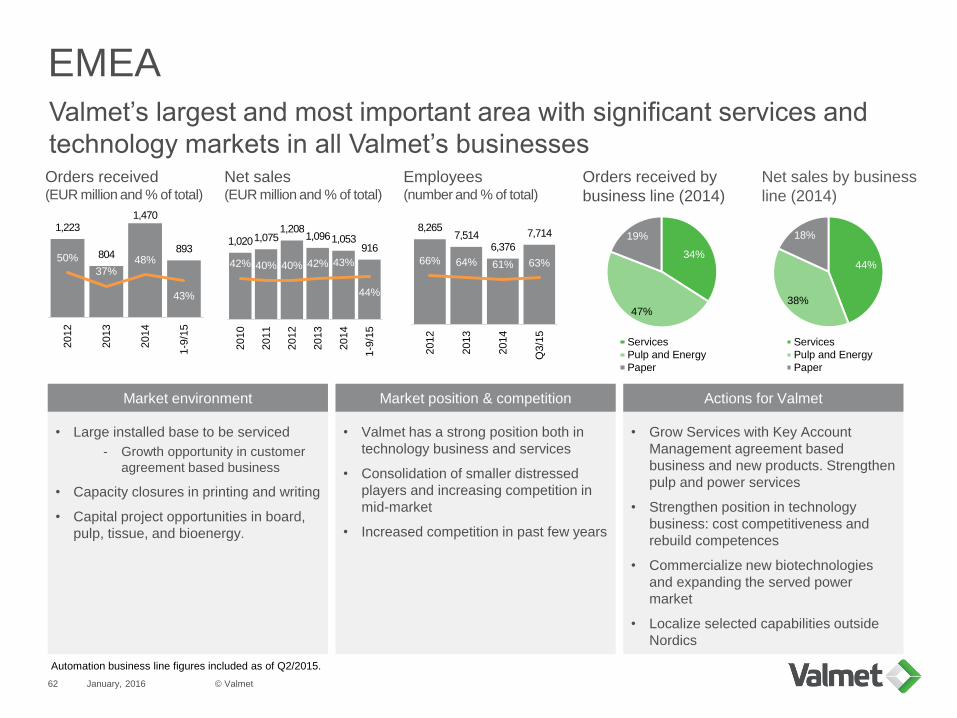
EMEA
January, 2016
Valmet’s largest and most important area with significant services and
technology markets in all Valmet’s businessesOrders received(EUR million and % of total)
Net sales(EUR million and % of total)
Employees(number and % of total)
Orders received by
business line (2014)
Net sales by business
line (2014)
1,223
804
1,470
89350%
37%48%
43%
2012
2013
2014
1-9
/15
• Large installed base to be serviced
- Growth opportunity in customer
agreement based business
• Capacity closures in printing and writing
• Capital project opportunities in board,
pulp, tissue, and bioenergy.
• Valmet has a strong position both in
technology business and services
• Consolidation of smaller distressed
players and increasing competition in
mid-market
• Increased competition in past few years
• Grow Services with Key Account
Management agreement based
business and new products. Strengthen
pulp and power services
• Strengthen position in technology
business: cost competitiveness and
rebuild competences
• Commercialize new biotechnologies
and expanding the served power
market
• Localize selected capabilities outside
Nordics
Market environment Market position & competition Actions for Valmet
1,0201,0751,208
1,0961,053916
42% 40% 40% 42% 43%
44%
2010
2011
2012
2013
2014
1-9
/15
8,2657,514
6,376
7,714
66% 64% 61% 63%
2012
2013
2014
Q3/1
5
34%
47%
19%
Services
Pulp and Energy
Paper
44%
38%
18%
Services
Pulp and Energy
Paper
Automation business line figures included as of Q2/2015.
© Valmet62
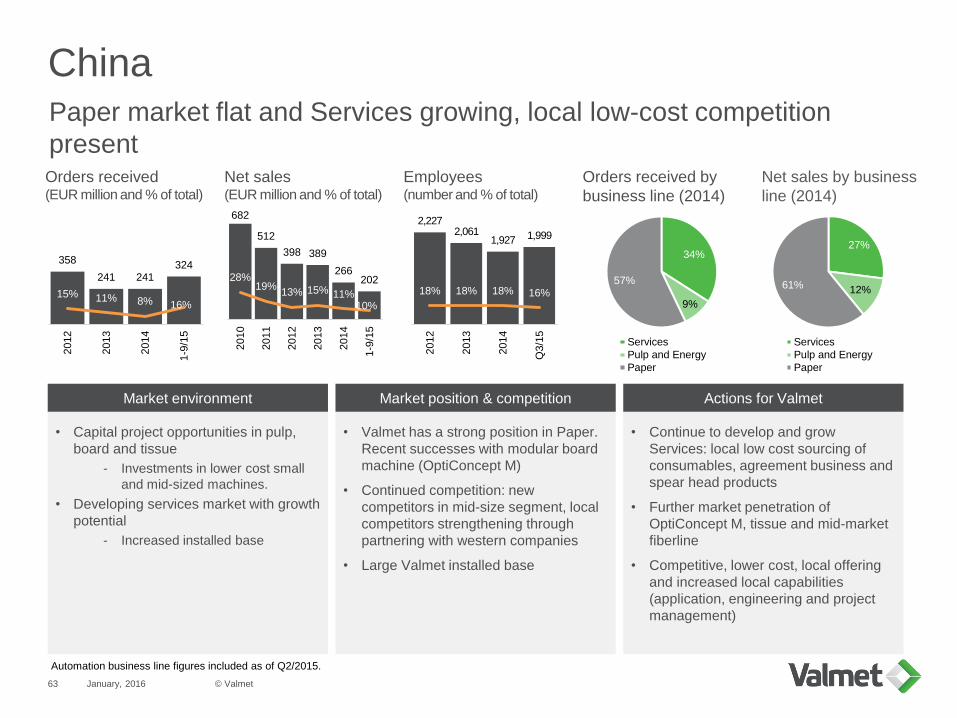
China
January, 2016
Paper market flat and Services growing, local low-cost competition
presentOrders received(EUR million and % of total)
Net sales(EUR million and % of total)
Employees(number and % of total)
Orders received by
business line (2014)
Net sales by business
line (2014)
358
241 241324
15% 11% 8% 16%
2012
2013
2014
1-9
/15
• Capital project opportunities in pulp,
board and tissue
- Investments in lower cost small
and mid-sized machines.
• Developing services market with growth
potential
- Increased installed base
• Valmet has a strong position in Paper.
Recent successes with modular board
machine (OptiConcept M)
• Continued competition: new
competitors in mid-size segment, local
competitors strengthening through
partnering with western companies
• Large Valmet installed base
• Continue to develop and grow
Services: local low cost sourcing of
consumables, agreement business and
spear head products
• Further market penetration of
OptiConcept M, tissue and mid-market
fiberline
• Competitive, lower cost, local offering
and increased local capabilities
(application, engineering and project
management)
Market environment Market position & competition Actions for Valmet
682
512
398 389
26620228%
19%13% 15% 11%
10%
2010
2011
2012
2013
2014
1-9
/15
2,2272,061
1,927 1,999
18% 18% 18% 16%
2012
2013
2014
Q3/1
5
34%
9%
57%
Services
Pulp and Energy
Paper
27%
12%61%
Services
Pulp and Energy
Paper
Automation business line figures included as of Q2/2015.
© Valmet63
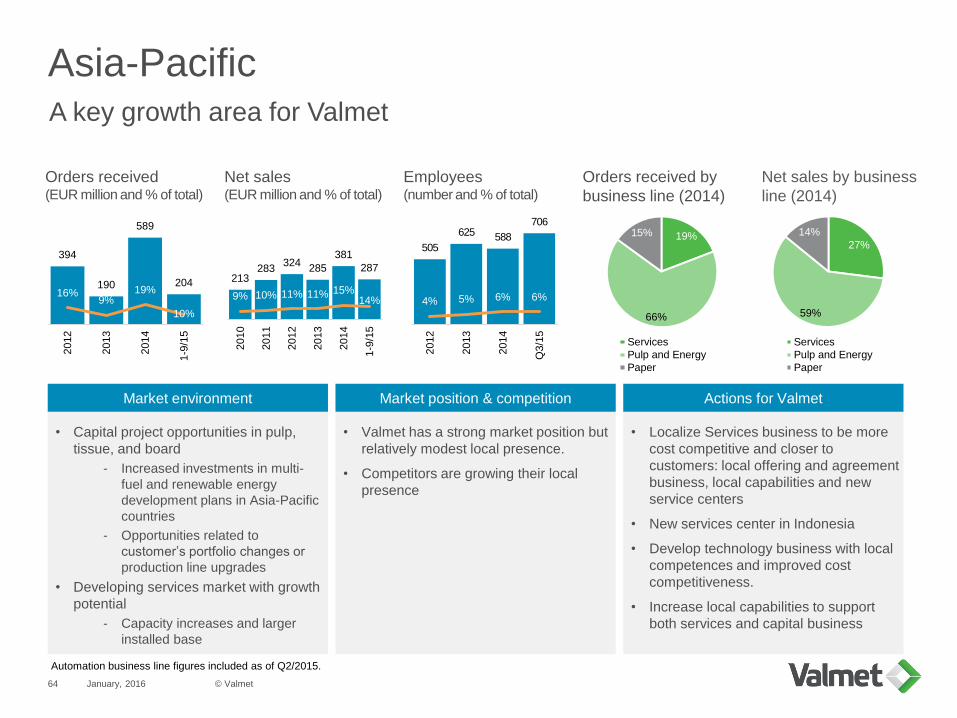
Asia-Pacific
January, 2016
A key growth area for Valmet
Orders received(EUR million and % of total)
Net sales(EUR million and % of total)
Employees(number and % of total)
Orders received by
business line (2014)
Net sales by business
line (2014)
394
190
589
20416%
9%19%
10%
2012
2013
2014
1-9
/15
• Capital project opportunities in pulp,
tissue, and board
- Increased investments in multi-
fuel and renewable energy
development plans in Asia-Pacific
countries
- Opportunities related to
customer’s portfolio changes or
production line upgrades
• Developing services market with growth
potential
- Capacity increases and larger
installed base
• Valmet has a strong market position but
relatively modest local presence.
• Competitors are growing their local
presence
• Localize Services business to be more
cost competitive and closer to
customers: local offering and agreement
business, local capabilities and new
service centers
• New services center in Indonesia
• Develop technology business with local
competences and improved cost
competitiveness.
• Increase local capabilities to support
both services and capital business
Market environment Market position & competition Actions for Valmet
213283
324285
381
287
9% 10% 11% 11% 15%14%
2010
2011
2012
2013
2014
1-9
/15
505
625 588
706
4% 5% 6% 6%
2012
2013
2014
Q3/1
5
19%
66%
15%
Services
Pulp and Energy
Paper
27%
59%
14%
Services
Pulp and Energy
Paper
Automation business line figures included as of Q2/2015.
© Valmet64
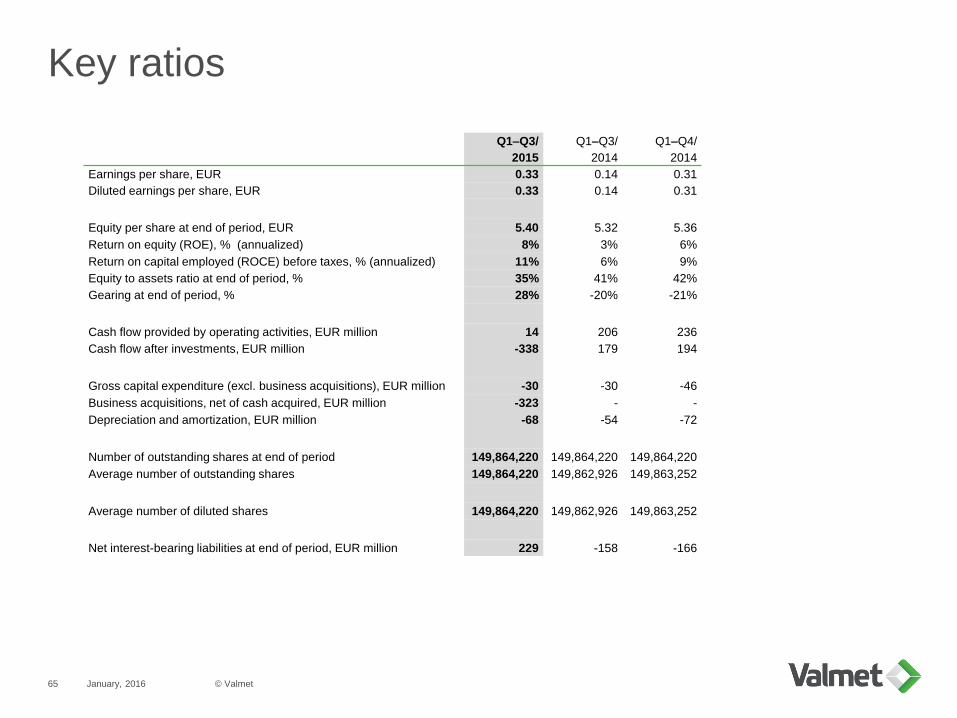
Key ratios
January, 2016 © Valmet65
Q1–Q3/
2015
Q1–Q3/
2014
Q1–Q4/
2014
Earnings per share, EUR 0.33 0.14 0.31
Diluted earnings per share, EUR 0.33 0.14 0.31
Equity per share at end of period, EUR 5.40 5.32 5.36
Return on equity (ROE), % (annualized) 8% 3% 6%
Return on capital employed (ROCE) before taxes, % (annualized) 11% 6% 9%
Equity to assets ratio at end of period, % 35% 41% 42%
Gearing at end of period, % 28% -20% -21%
Cash flow provided by operating activities, EUR million 14 206 236
Cash flow after investments, EUR million -338 179 194
Gross capital expenditure (excl. business acquisitions), EUR million -30 -30 -46
Business acquisitions, net of cash acquired, EUR million -323 - -
Depreciation and amortization, EUR million -68 -54 -72
Number of outstanding shares at end of period 149,864,220 149,864,220 149,864,220
Average number of outstanding shares 149,864,220 149,862,926 149,863,252
Average number of diluted shares 149,864,220 149,862,926 149,863,252
Net interest-bearing liabilities at end of period, EUR million 229 -158 -166
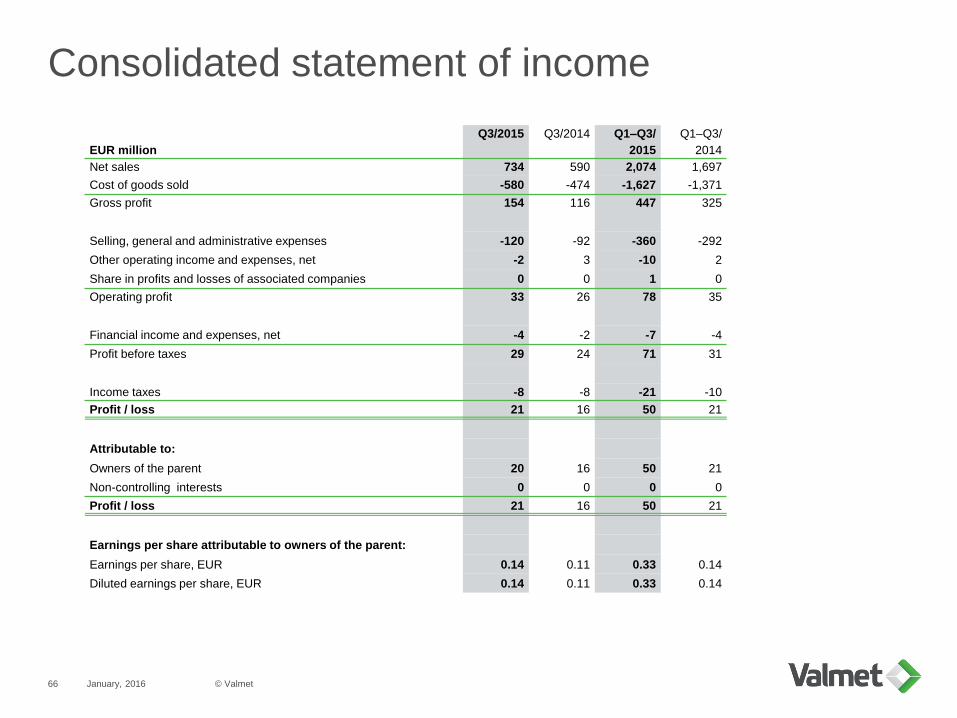
Consolidated statement of income
January, 2016
EUR million
Q3/2015 Q3/2014 Q1–Q3/
2015
Q1–Q3/
2014
Net sales 734 590 2,074 1,697
Cost of goods sold -580 -474 -1,627 -1,371
Gross profit 154 116 447 325
Selling, general and administrative expenses -120 -92 -360 -292
Other operating income and expenses, net -2 3 -10 2
Share in profits and losses of associated companies 0 0 1 0
Operating profit 33 26 78 35
Financial income and expenses, net -4 -2 -7 -4
Profit before taxes 29 24 71 31
Income taxes -8 -8 -21 -10
Profit / loss 21 16 50 21
Attributable to:
Owners of the parent 20 16 50 21
Non-controlling interests 0 0 0 0
Profit / loss 21 16 50 21
Earnings per share attributable to owners of the parent:
Earnings per share, EUR 0.14 0.11 0.33 0.14
Diluted earnings per share, EUR 0.14 0.11 0.33 0.14
© Valmet66
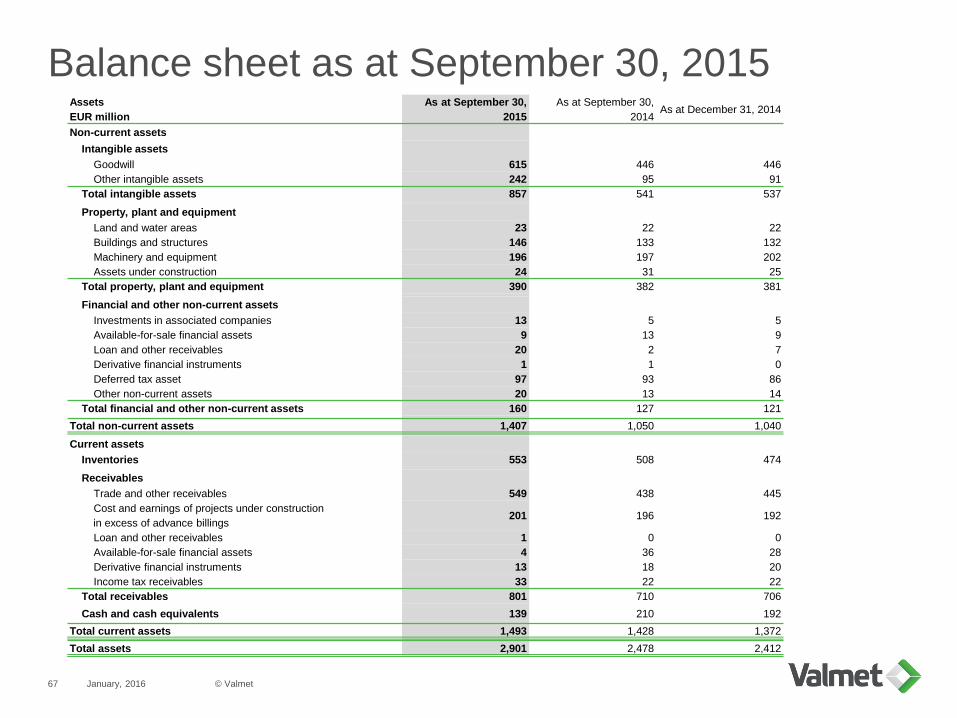
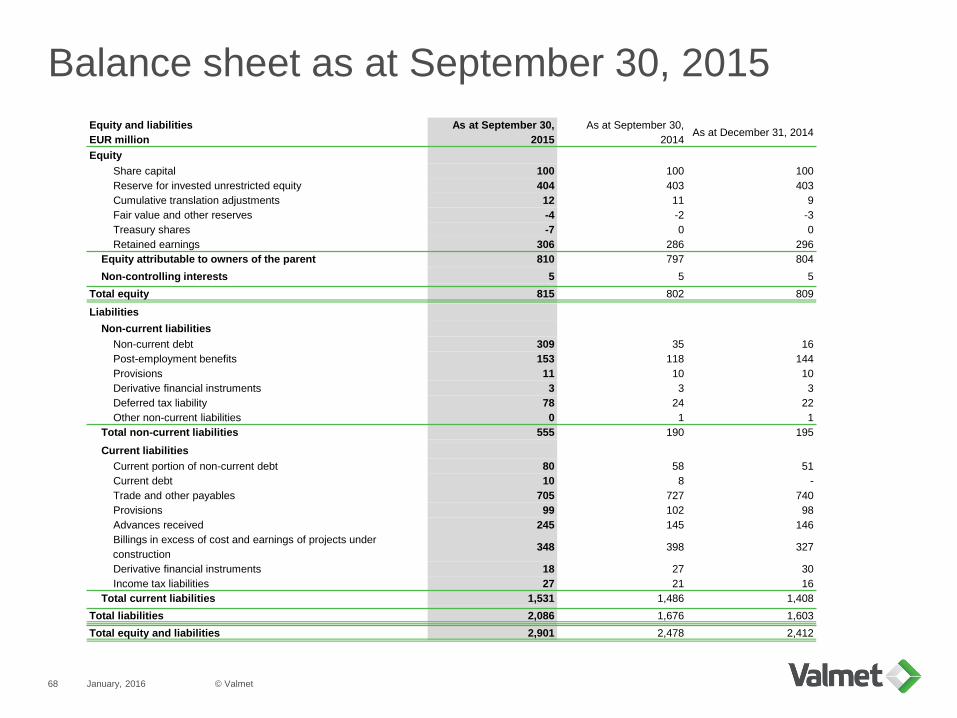
Balance sheet as at September 30, 2015
January, 2016 © Valmet67
Assets
EUR million
As at September 30,
2015
As at September 30,
2014As at December 31, 2014
Non-current assets
Intangible assets
Goodwill 615 446 446
Other intangible assets 242 95 91
Total intangible assets 857 541 537
Property, plant and equipment
Land and water areas 23 22 22
Buildings and structures 146 133 132
Machinery and equipment 196 197 202
Assets under construction 24 31 25
Total property, plant and equipment 390 382 381
Financial and other non-current assets
Investments in associated companies 13 5 5
Available-for-sale financial assets 9 13 9
Loan and other receivables 20 2 7
Derivative financial instruments 1 1 0
Deferred tax asset 97 93 86
Other non-current assets 20 13 14
Total financial and other non-current assets 160 127 121
Total non-current assets 1,407 1,050 1,040
Current assets
Inventories 553 508 474
Receivables
Trade and other receivables 549 438 445
Cost and earnings of projects under construction
in excess of advance billings201 196 192
Loan and other receivables 1 0 0
Available-for-sale financial assets 4 36 28
Derivative financial instruments 13 18 20
Income tax receivables 33 22 22
Total receivables 801 710 706
Cash and cash equivalents 139 210 192
Total current assets 1,493 1,428 1,372
Total assets 2,901 2,478 2,412
January, 2016
Balance sheet as at September 30, 2015
© Valmet68
Equity and liabilities
EUR million
As at September 30,
2015
As at September 30,
2014As at December 31, 2014
Equity
Share capital 100 100 100
Reserve for invested unrestricted equity 404 403 403
Cumulative translation adjustments 12 11 9
Fair value and other reserves -4 -2 -3
Treasury shares -7 0 0
Retained earnings 306 286 296
Equity attributable to owners of the parent 810 797 804
Non-controlling interests 5 5 5
Total equity 815 802 809
Liabilities
Non-current liabilities
Non-current debt 309 35 16
Post-employment benefits 153 118 144
Provisions 11 10 10
Derivative financial instruments 3 3 3
Deferred tax liability 78 24 22
Other non-current liabilities 0 1 1
Total non-current liabilities 555 190 195
Current liabilities
Current portion of non-current debt 80 58 51
Current debt 10 8 -
Trade and other payables 705 727 740
Provisions 99 102 98
Advances received 245 145 146
Billings in excess of cost and earnings of projects under
construction348 398 327
Derivative financial instruments 18 27 30
Income tax liabilities 27 21 16
Total current liabilities 1,531 1,486 1,408
Total liabilities 2,086 1,676 1,603
Total equity and liabilities 2,901 2,478 2,412
January, 2016
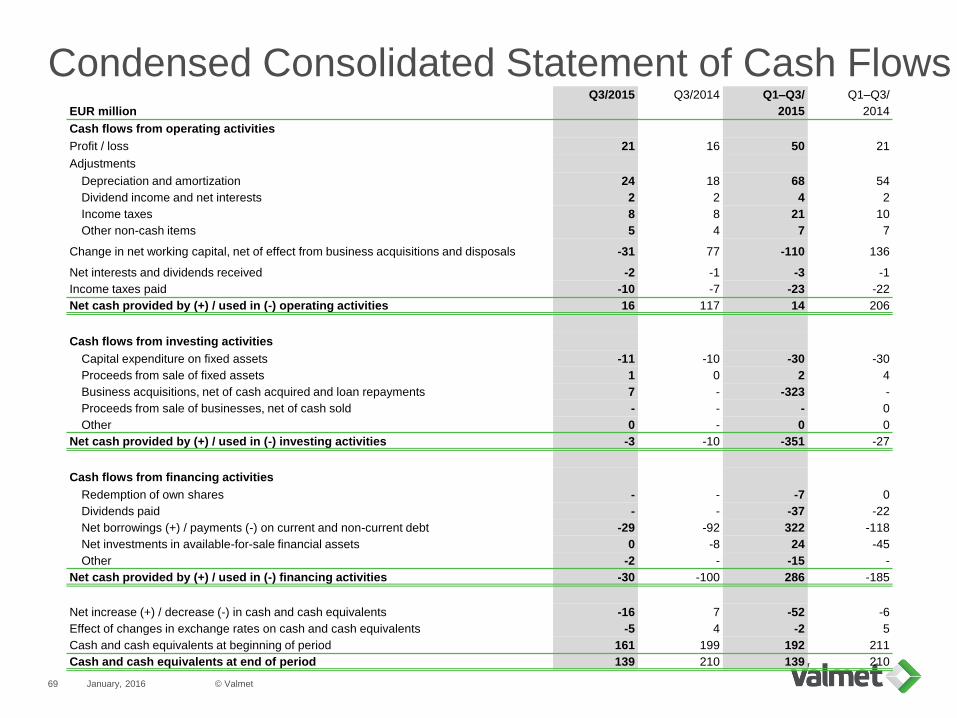
Condensed Consolidated Statement of Cash Flows
© Valmet69
EUR million
Q3/2015 Q3/2014 Q1–Q3/
2015
Q1–Q3/
2014
Cash flows from operating activities
Profit / loss 21 16 50 21
Adjustments
Depreciation and amortization 24 18 68 54
Dividend income and net interests 2 2 4 2
Income taxes 8 8 21 10
Other non-cash items 5 4 7 7
Change in net working capital, net of effect from business acquisitions and disposals -31 77 -110 136
Net interests and dividends received -2 -1 -3 -1
Income taxes paid -10 -7 -23 -22
Net cash provided by (+) / used in (-) operating activities 16 117 14 206
Cash flows from investing activities
Capital expenditure on fixed assets -11 -10 -30 -30
Proceeds from sale of fixed assets 1 0 2 4
Business acquisitions, net of cash acquired and loan repayments 7 - -323 -
Proceeds from sale of businesses, net of cash sold - - - 0
Other 0 - 0 0
Net cash provided by (+) / used in (-) investing activities -3 -10 -351 -27
Cash flows from financing activities
Redemption of own shares - - -7 0
Dividends paid - - -37 -22
Net borrowings (+) / payments (-) on current and non-current debt -29 -92 322 -118
Net investments in available-for-sale financial assets 0 -8 24 -45
Other -2 - -15 -
Net cash provided by (+) / used in (-) financing activities -30 -100 286 -185
Net increase (+) / decrease (-) in cash and cash equivalents -16 7 -52 -6
Effect of changes in exchange rates on cash and cash equivalents -5 4 -2 5
Cash and cash equivalents at beginning of period 161 199 192 211
Cash and cash equivalents at end of period 139 210 139 210
AppendixAutomation
18%
13%
44%
11%
15%
North America South AmericaEMEA ChinaAsia-Pacific
January, 2016
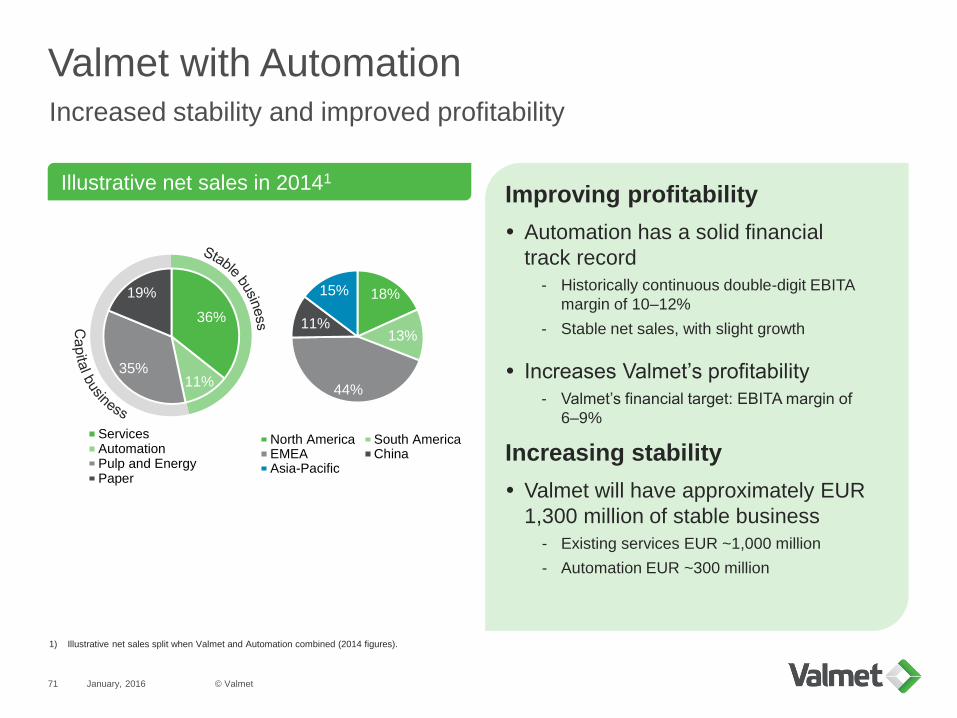
Valmet with AutomationIncreased stability and improved profitability
1) Illustrative net sales split when Valmet and Automation combined (2014 figures).
Illustrative net sales in 20141
Improving profitability
Automation has a solid financial
track record
- Historically continuous double-digit EBITA
margin of 10–12%
- Stable net sales, with slight growth
Increases Valmet’s profitability
- Valmet’s financial target: EBITA margin of
6–9%
Increasing stability
Valmet will have approximately EUR
1,300 million of stable business
- Existing services EUR ~1,000 million
- Automation EUR ~300 million
36%
11%35%
19%
ServicesAutomationPulp and EnergyPaper
© Valmet71
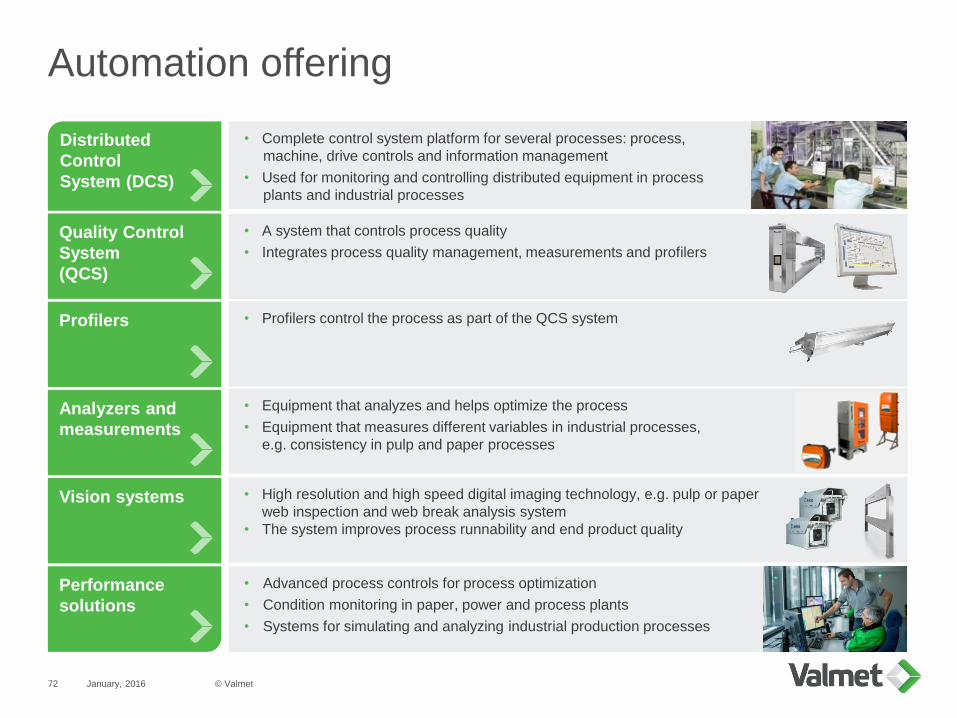
Automation offering
January, 2016
• Complete control system platform for several processes: process,
machine, drive controls and information management
• Used for monitoring and controlling distributed equipment in process
plants and industrial processes
• Advanced process controls for process optimization
• Condition monitoring in paper, power and process plants
• Systems for simulating and analyzing industrial production processes
Distributed
Control
System (DCS)
• A system that controls process quality
• Integrates process quality management, measurements and profilers
Quality Control
System
(QCS)
• Profilers control the process as part of the QCS systemProfilers
• Equipment that analyzes and helps optimize the process
• Equipment that measures different variables in industrial processes,
e.g. consistency in pulp and paper processes
Analyzers and
measurements
• High resolution and high speed digital imaging technology, e.g. pulp or paper
web inspection and web break analysis system
• The system improves process runnability and end product quality
Vision systems
Performance
solutions
© Valmet72
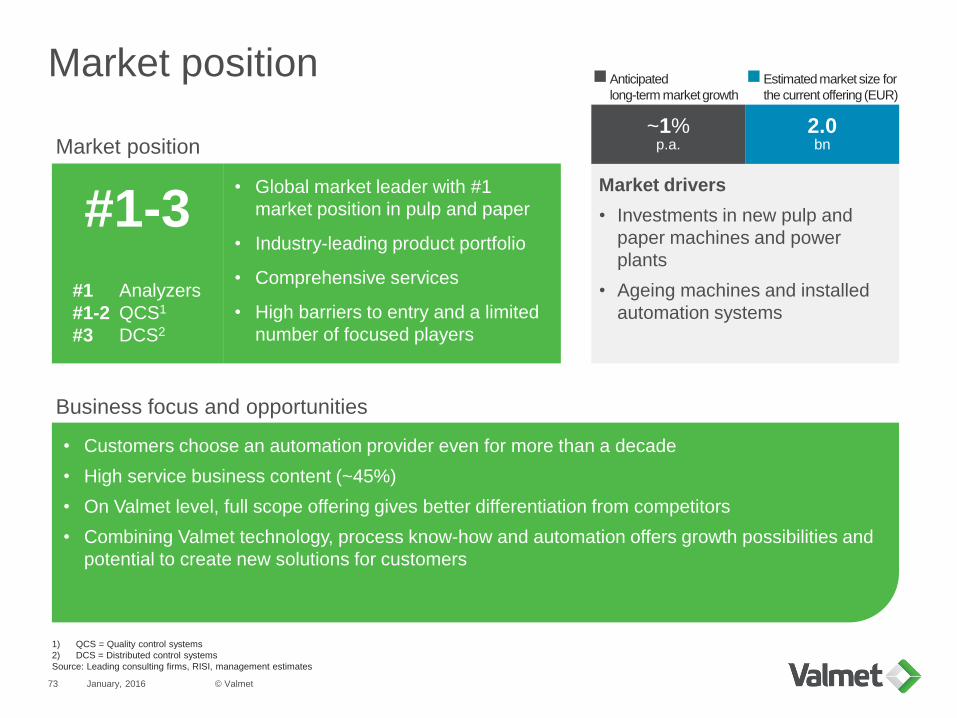
Market position
January, 2016
• Global market leader with #1
market position in pulp and paper
• Industry-leading product portfolio
• Comprehensive services
• High barriers to entry and a limited
number of focused players
1) QCS = Quality control systems
2) DCS = Distributed control systems
Source: Leading consulting firms, RISI, management estimates
• Customers choose an automation provider even for more than a decade
• High service business content (~45%)
• On Valmet level, full scope offering gives better differentiation from competitors
• Combining Valmet technology, process know-how and automation offers growth possibilities and
potential to create new solutions for customers
#1-3
#1 Analyzers
#1-2 QCS1
#3 DCS2
Market position
Business focus and opportunities
Estimated market size for
the current offering (EUR)
Anticipated
long-term market growth
Market drivers
• Investments in new pulp and
paper machines and power
plants
• Ageing machines and installed
automation systems
~1%p.a.
2.0bn
© Valmet73
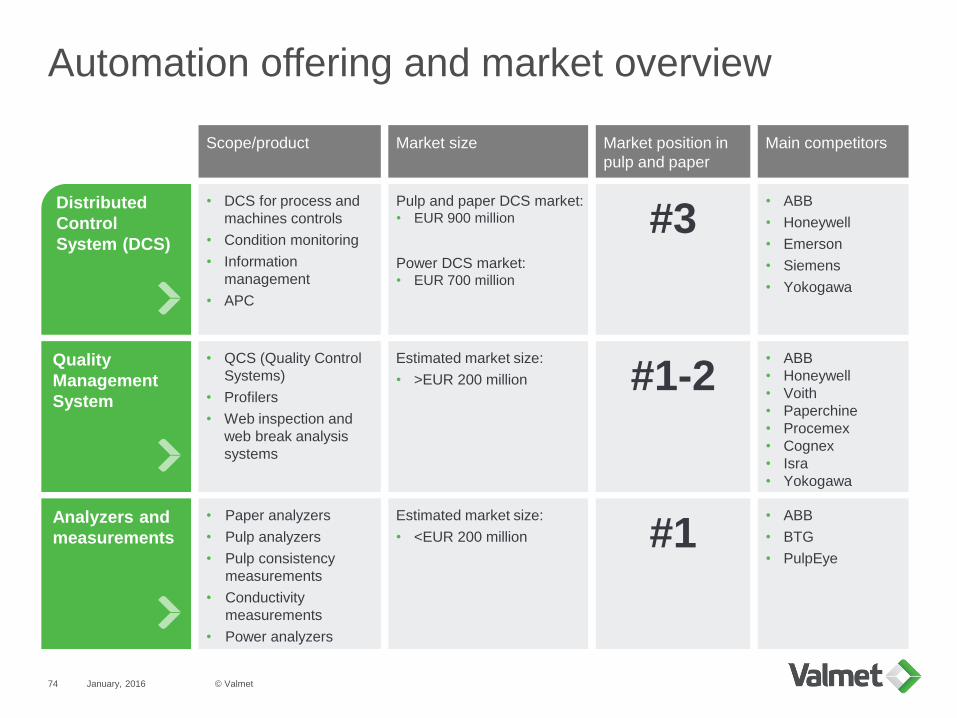
Automation offering and market overview
January, 2016
• DCS for process and
machines controls
• Condition monitoring
• Information
management
• APC
• Paper analyzers
• Pulp analyzers
• Pulp consistency
measurements
• Conductivity
measurements
• Power analyzers
Distributed
Control
System (DCS)
• QCS (Quality Control
Systems)
• Profilers
• Web inspection and
web break analysis
systems
Quality
Management
System
Analyzers and
measurements
Scope/product
Pulp and paper DCS market:• EUR 900 million
Power DCS market:• EUR 700 million
Estimated market size:
• <EUR 200 million
Estimated market size:
• >EUR 200 million
Market size
#3
#1
#1-2
Market position in
pulp and paper
• ABB
• Honeywell
• Emerson
• Siemens
• Yokogawa
• ABB
• BTG
• PulpEye
• ABB
• Honeywell
• Voith
• Paperchine
• Procemex
• Cognex
• Isra
• Yokogawa
Main competitors
© Valmet74
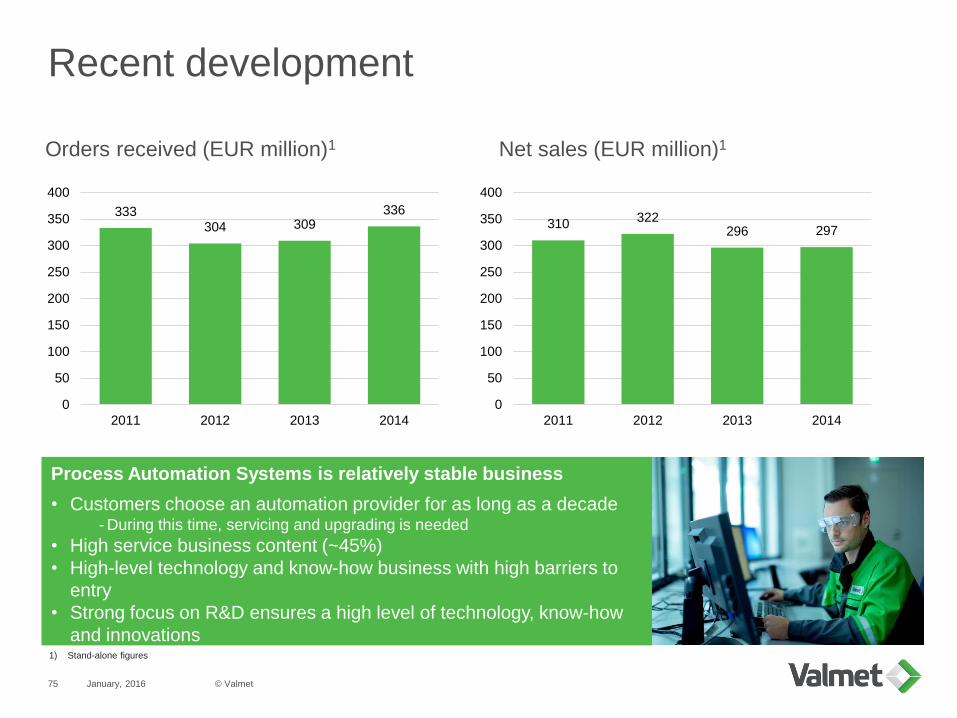
333304 309
336
0
50
100
150
200
250
300
350
400
2011 2012 2013 2014
Recent development
January, 2016
Net sales (EUR million)1Orders received (EUR million)1
Process Automation Systems is relatively stable business
• Customers choose an automation provider for as long as a decade- During this time, servicing and upgrading is needed
• High service business content (~45%)
• High-level technology and know-how business with high barriers to
entry
• Strong focus on R&D ensures a high level of technology, know-how
and innovations1) Stand-alone figures
310322
296 297
0
50
100
150
200
250
300
350
400
2011 2012 2013 2014
© Valmet75

AppendixOffering
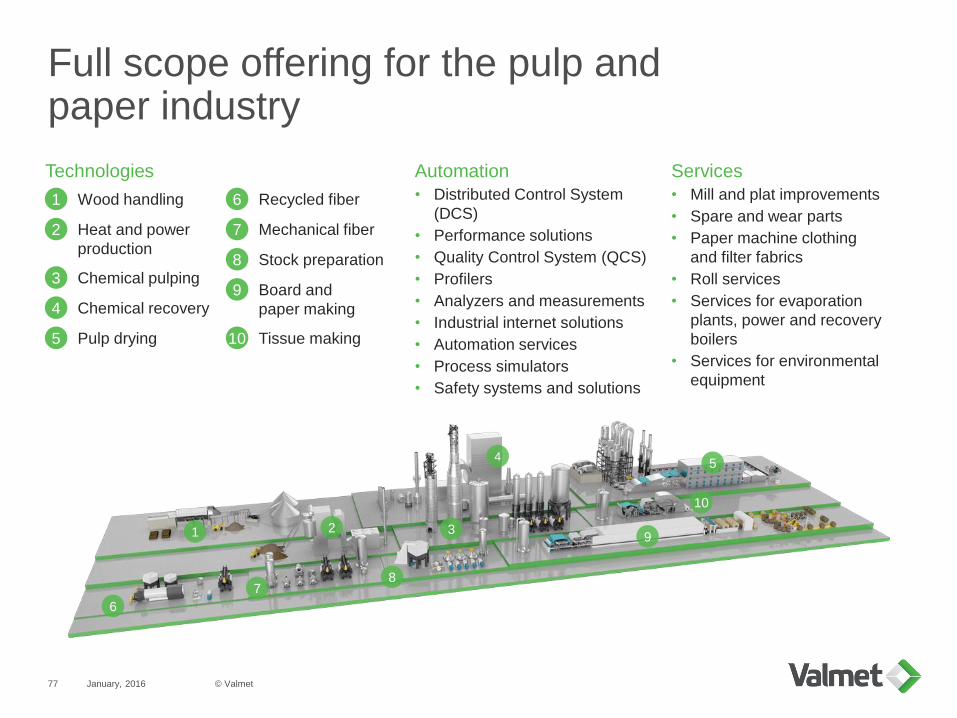
Full scope offering for the pulp andpaper industry
January, 2016
1
6
7
2
8
3
4
9
5
10
1 Wood handling
2 Heat and power
production
3 Chemical pulping
4 Chemical recovery
5 Pulp drying
6 Recycled fiber
7 Mechanical fiber
8 Stock preparation
9 Board and
paper making
10 Tissue making
Automation
• Distributed Control System
(DCS)
• Performance solutions
• Quality Control System (QCS)
• Profilers
• Analyzers and measurements
• Industrial internet solutions
• Automation services
• Process simulators
• Safety systems and solutions
Services
• Mill and plat improvements
• Spare and wear parts
• Paper machine clothing
and filter fabrics
• Roll services
• Services for evaporation
plants, power and recovery
boilers
• Services for environmental
equipment
Technologies
© Valmet77
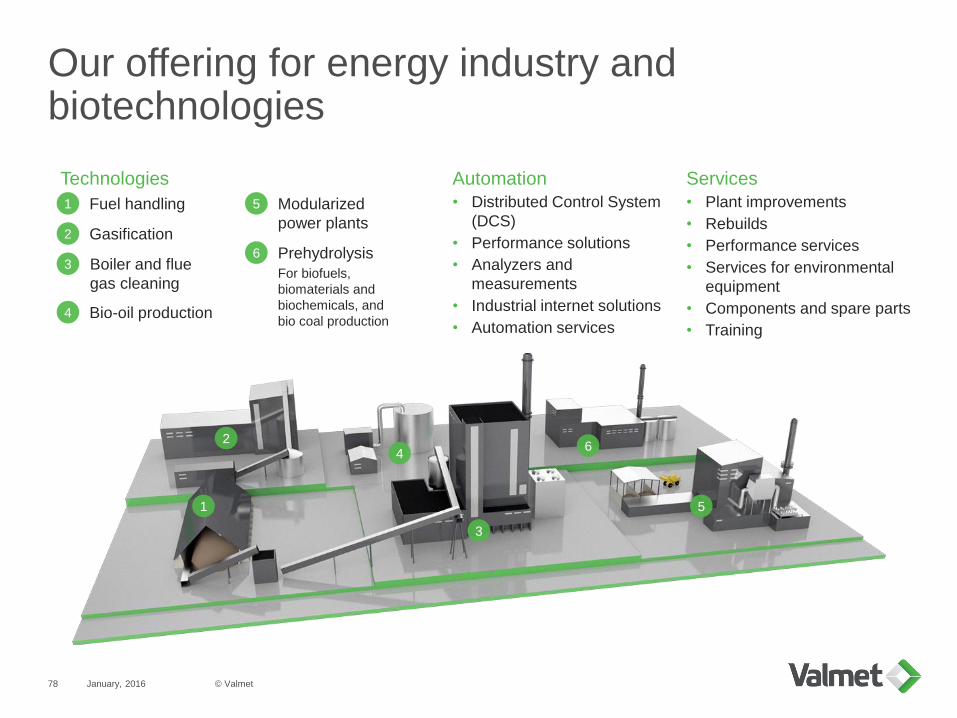
Our offering for energy industry and biotechnologies
January, 2016
Automation
• Distributed Control System
(DCS)
• Performance solutions
• Analyzers and
measurements
• Industrial internet solutions
• Automation services
Services
• Plant improvements
• Rebuilds
• Performance services
• Services for environmental
equipment
• Components and spare parts
• Training
1
2
3
46
5
1 Fuel handling
2 Gasification
3 Boiler and flue
gas cleaning
4 Bio-oil production
5 Modularized
power plants
6 Prehydrolysis
For biofuels,
biomaterials and
biochemicals, and
bio coal production
Technologies
© Valmet78
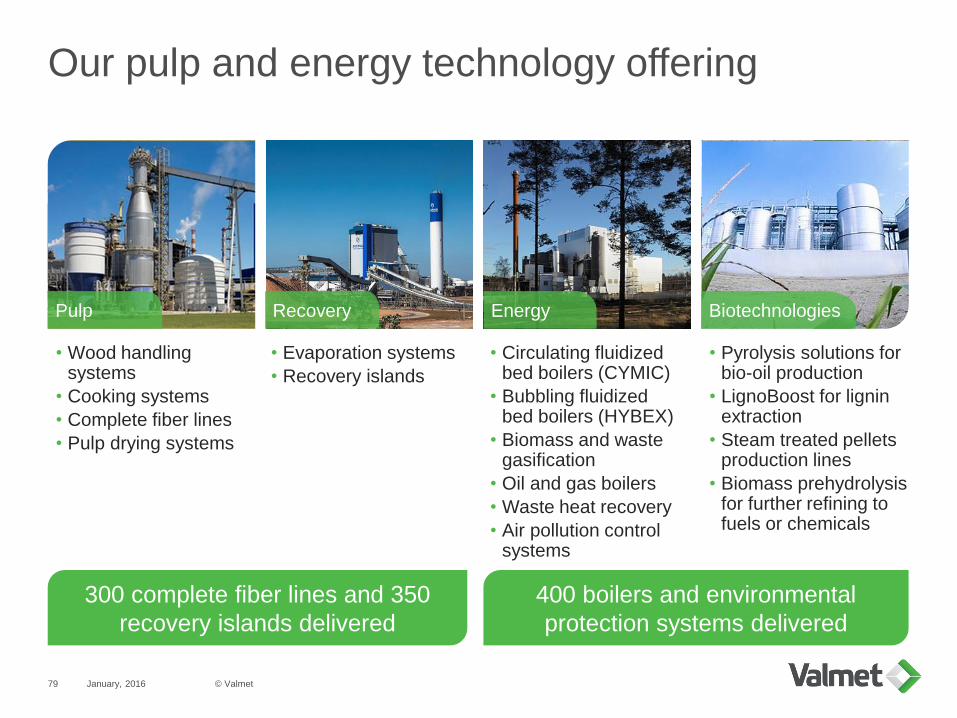
Our pulp and energy technology offering
January, 2016
Pulp Recovery Energy Biotechnologies
400 boilers and environmental
protection systems delivered
300 complete fiber lines and 350
recovery islands delivered
• Wood handling systems
• Cooking systems
• Complete fiber lines
• Pulp drying systems
• Evaporation systems
• Recovery islands
• Circulating fluidized bed boilers (CYMIC)
• Bubbling fluidized bed boilers (HYBEX)
• Biomass and waste gasification
• Oil and gas boilers
• Waste heat recovery
• Air pollution control systems
• Pyrolysis solutions for bio-oil production
• LignoBoost for lignin extraction
• Steam treated pellets production lines
• Biomass prehydrolysisfor further refining to fuels or chemicals
© Valmet79
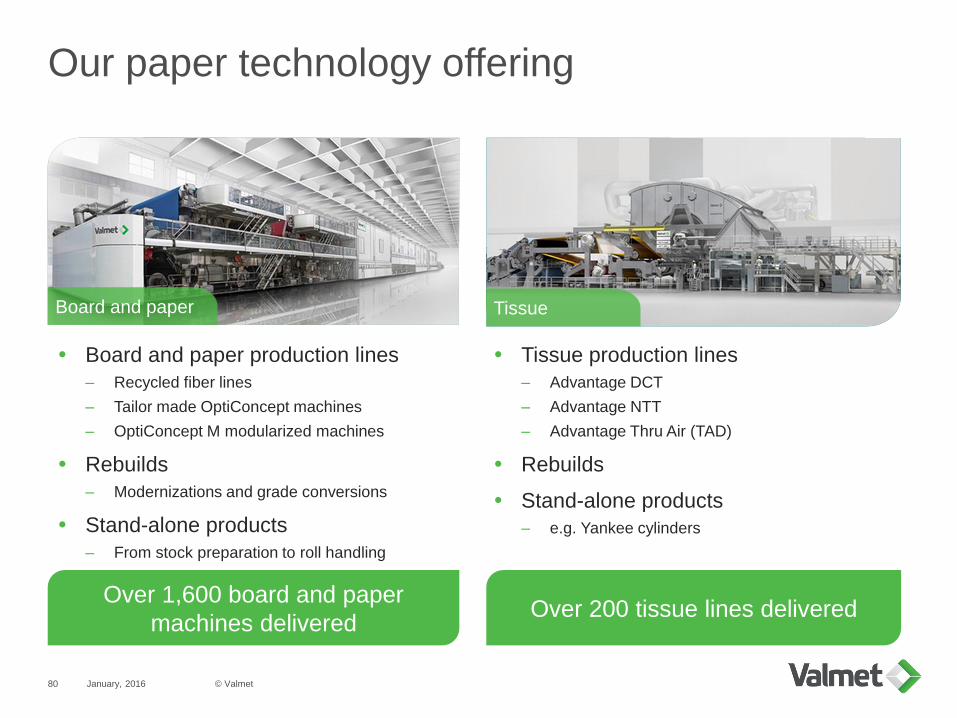
January, 2016
Our paper technology offering
Board and paper Tissue
Board and paper production lines
– Recycled fiber lines
– Tailor made OptiConcept machines
– OptiConcept M modularized machines
Rebuilds
– Modernizations and grade conversions
Stand-alone products
– From stock preparation to roll handling
Over 200 tissue lines delivered
Tissue production lines
– Advantage DCT
– Advantage NTT
– Advantage Thru Air (TAD)
Rebuilds
Stand-alone products
– e.g. Yankee cylinders
Over 1,600 board and paper
machines delivered
© Valmet80
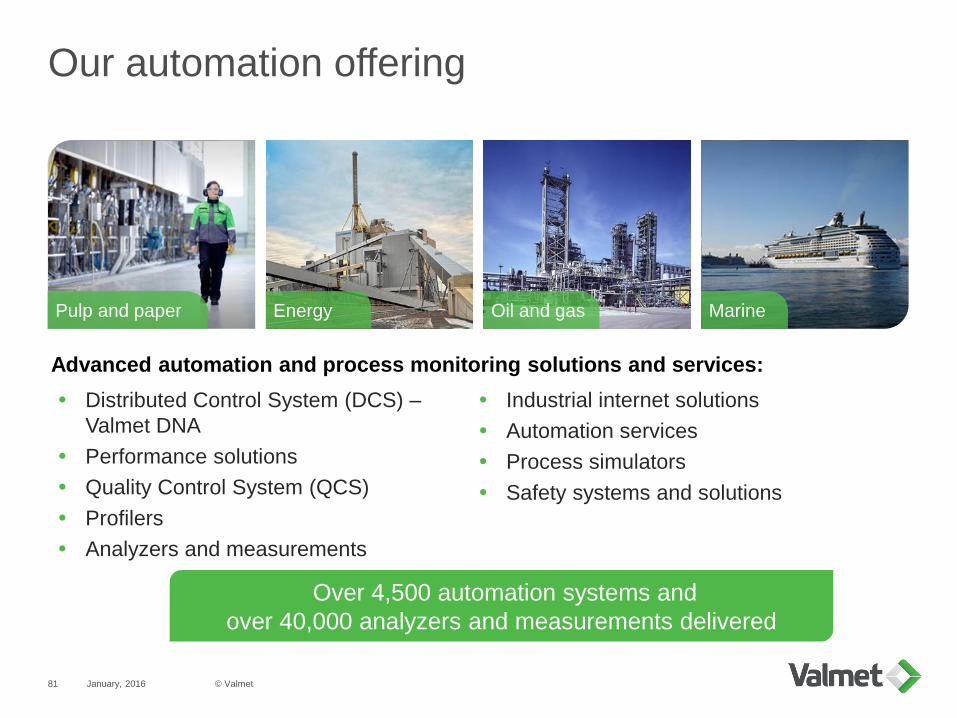
Our automation offering
January, 2016
Pulp and paper Energy Oil and gas Marine
Distributed Control System (DCS) –
Valmet DNA
Performance solutions
Quality Control System (QCS)
Profilers
Analyzers and measurements
Industrial internet solutions
Automation services
Process simulators
Safety systems and solutions
Over 4,500 automation systems and
over 40,000 analyzers and measurements delivered
Advanced automation and process monitoring solutions and services:
© Valmet81
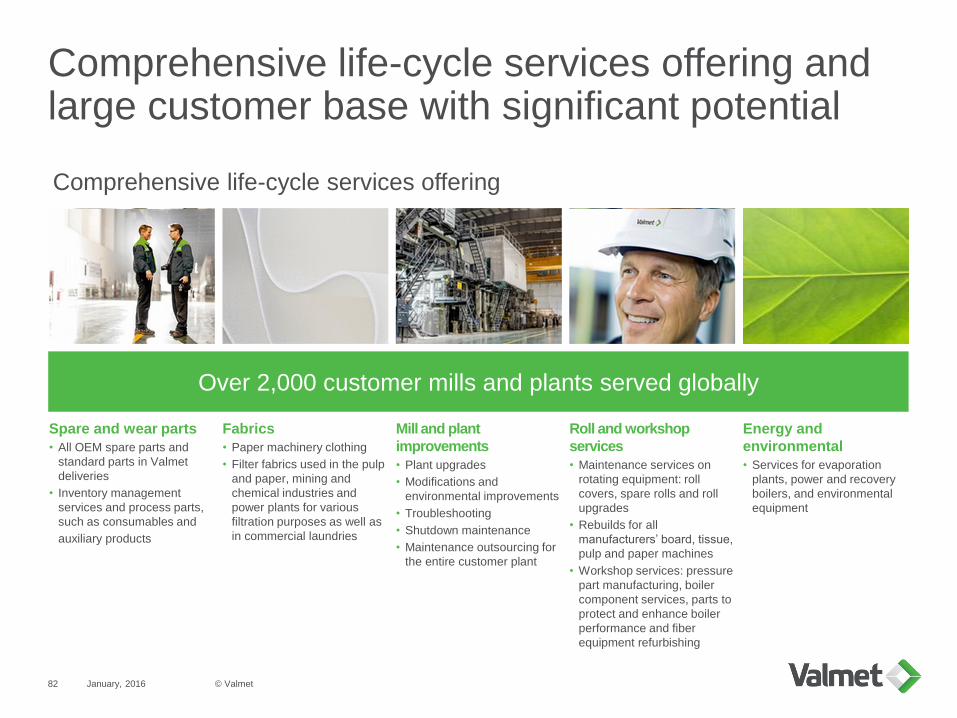
January, 2016
Comprehensive life-cycle services offering and large customer base with significant potential
Comprehensive life-cycle services offering
Spare and wear parts
• All OEM spare parts and
standard parts in Valmet
deliveries
• Inventory management
services and process parts,
such as consumables and
auxiliary products
Fabrics
• Paper machinery clothing
• Filter fabrics used in the pulp
and paper, mining and
chemical industries and
power plants for various
filtration purposes as well as
in commercial laundries
Mill and plant
improvements
• Plant upgrades
• Modifications and
environmental improvements
• Troubleshooting
• Shutdown maintenance
• Maintenance outsourcing for
the entire customer plant
Roll and workshop
services
• Maintenance services on
rotating equipment: roll
covers, spare rolls and roll
upgrades
• Rebuilds for all
manufacturers’ board, tissue,
pulp and paper machines
• Workshop services: pressure
part manufacturing, boiler
component services, parts to
protect and enhance boiler
performance and fiber
equipment refurbishing
Over 2,000 customer mills and plants served globally
Energy and
environmental
• Services for evaporation
plants, power and recovery
boilers, and environmental
equipment
© Valmet82
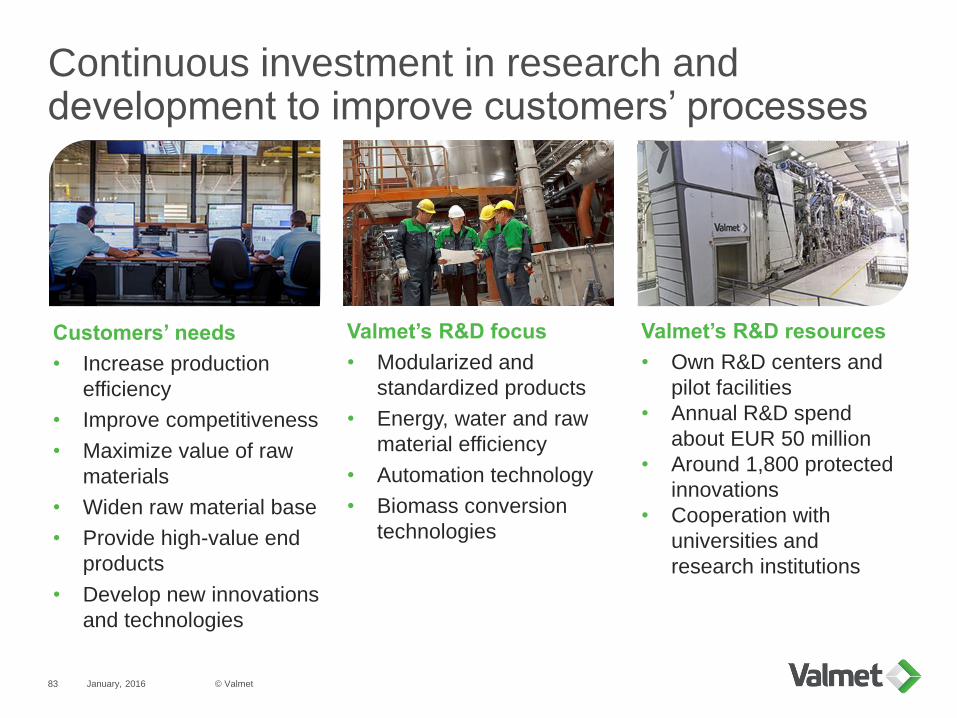
Continuous investment in research and development to improve customers’ processes
Customers’ needs
• Increase production
efficiency
• Improve competitiveness
• Maximize value of raw
materials
• Widen raw material base
• Provide high-value end
products
• Develop new innovations
and technologies
Valmet’s R&D focus
• Modularized and
standardized products
• Energy, water and raw
material efficiency
• Automation technology
• Biomass conversion
technologies
Valmet’s R&D resources
• Own R&D centers and
pilot facilities
• Annual R&D spend
about EUR 50 million
• Around 1,800 protected
innovations
• Cooperation with
universities and
research institutions
January, 2016 © Valmet83
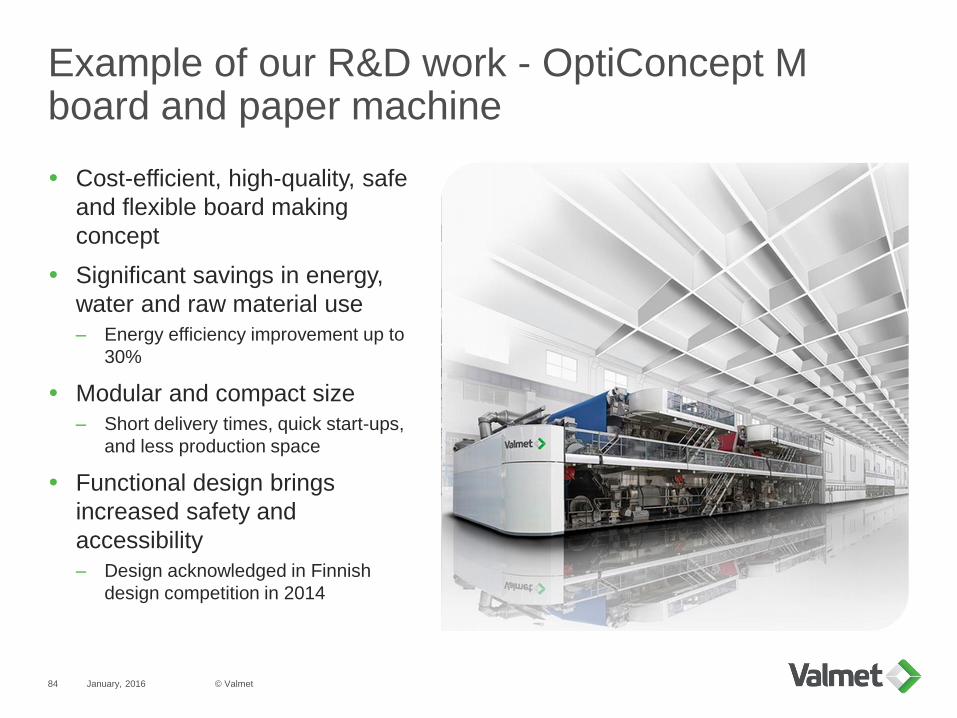
Example of our R&D work - OptiConcept M board and paper machine
Cost-efficient, high-quality, safe
and flexible board making
concept
Significant savings in energy,
water and raw material use
– Energy efficiency improvement up to
30%
Modular and compact size
– Short delivery times, quick start-ups,
and less production space
Functional design brings
increased safety and
accessibility
– Design acknowledged in Finnish
design competition in 2014
January, 2016 © Valmet84
AppendixMarket statistics
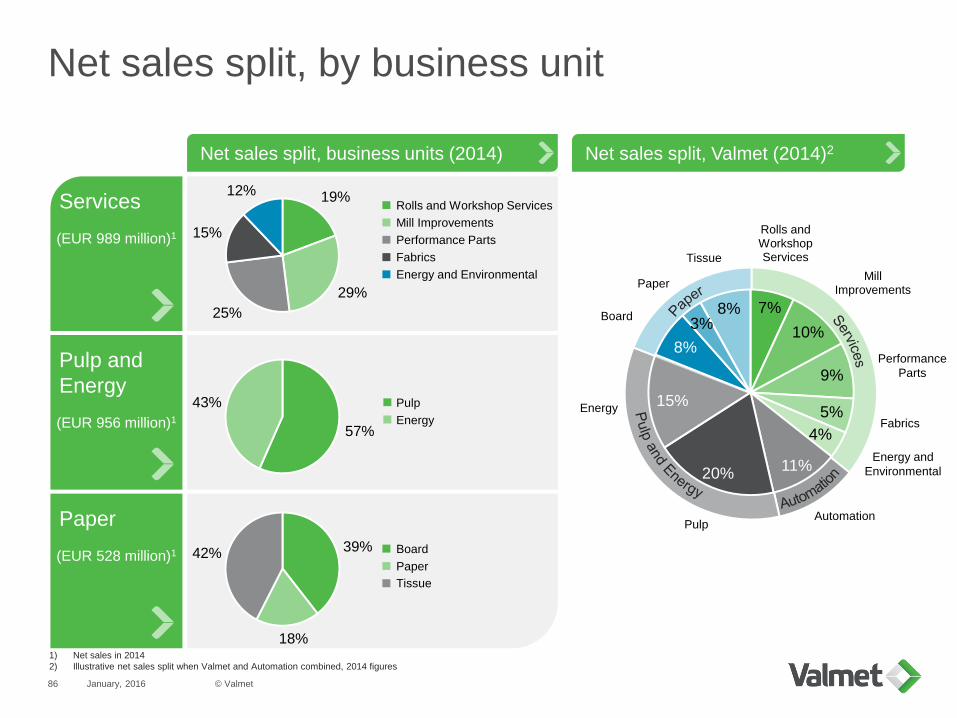
Rolls and Workshop Services
Mill Improvements
Fabrics
AutomationPulp
Energy
Board
Paper
Tissue
Paper
(EUR 528 million)1
Net sales split, by business unit
January, 2016
19%
29%
25%
15%
12%
57%
43% Pulp
Energy
39%
18%
42% Board
Paper
Tissue
Rolls and Workshop Services
Performance Parts
Mill Improvements
Energy and Environmental
Fabrics
Services
(EUR 989 million)1
Pulp and
Energy
(EUR 956 million)1
Net sales split, business units (2014) Net sales split, Valmet (2014)2
1) Net sales in 2014
2) Illustrative net sales split when Valmet and Automation combined, 2014 figures
© Valmet86
Performance
Parts
Energy and
Environmental
7%
10%
9%
5%
4%
11%20%
15%
8%
3%8%
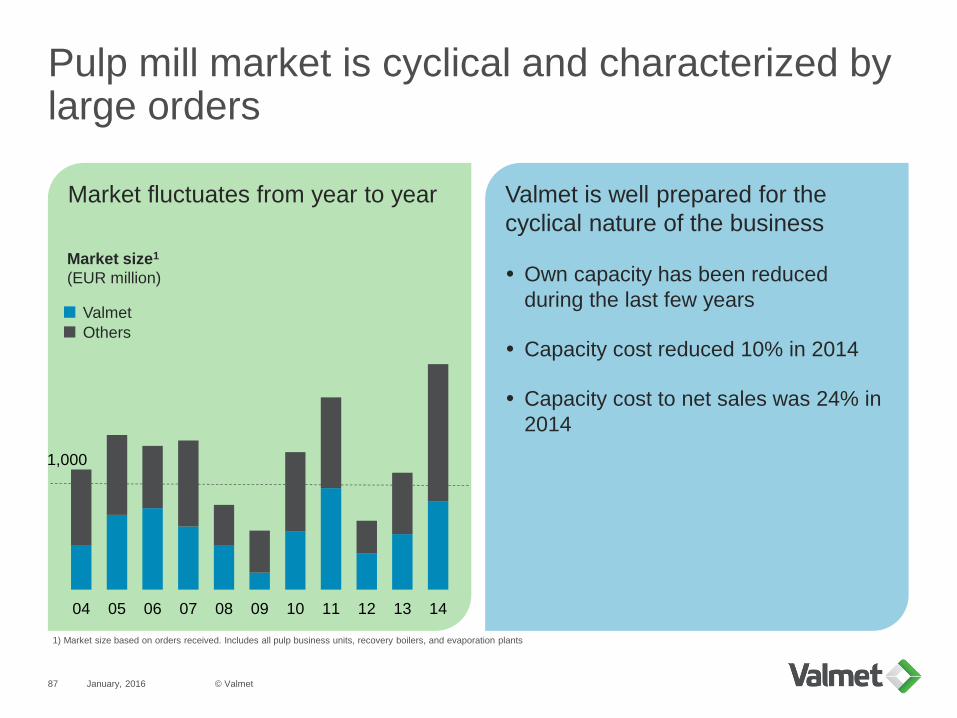
Pulp mill market is cyclical and characterized by large orders
Market fluctuates from year to year Valmet is well prepared for the
cyclical nature of the business
Own capacity has been reduced
during the last few years
Capacity cost reduced 10% in 2014
Capacity cost to net sales was 24% in
2014
January, 2016
Valmet
Others
Market size1
(EUR million)
04 05 06 07 08 09 10 11 12 13 14
1,000
1) Market size based on orders received. Includes all pulp business units, recovery boilers, and evaporation plants
© Valmet87
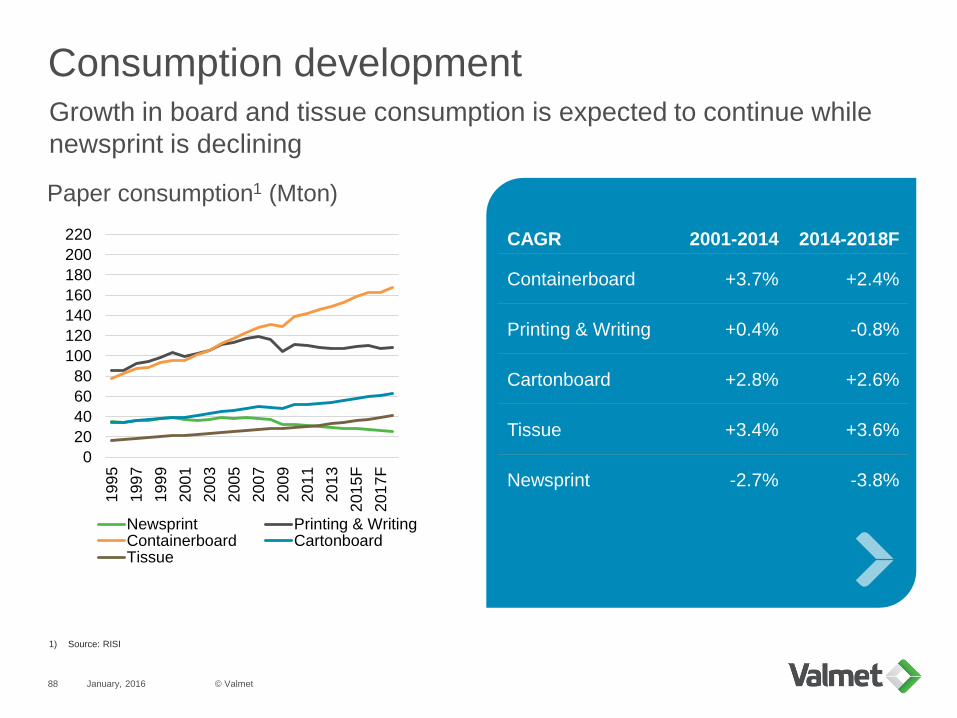
0
20
40
60
80
100
120
140
160
180
200
220
199
5
199
7
199
9
200
1
200
3
200
5
200
7
200
9
201
1
201
3
201
5F
201
7F
Newsprint Printing & WritingContainerboard CartonboardTissue
January, 2016
Consumption developmentGrowth in board and tissue consumption is expected to continue while
newsprint is declining
1) Source: RISI
Paper consumption1 (Mton)
© Valmet88
CAGR 2001-2014 2014-2018F
Containerboard +3.7% +2.4%
Printing & Writing +0.4% -0.8%
Cartonboard +2.8% +2.6%
Tissue +3.4% +3.6%
Newsprint -2.7% -3.8%
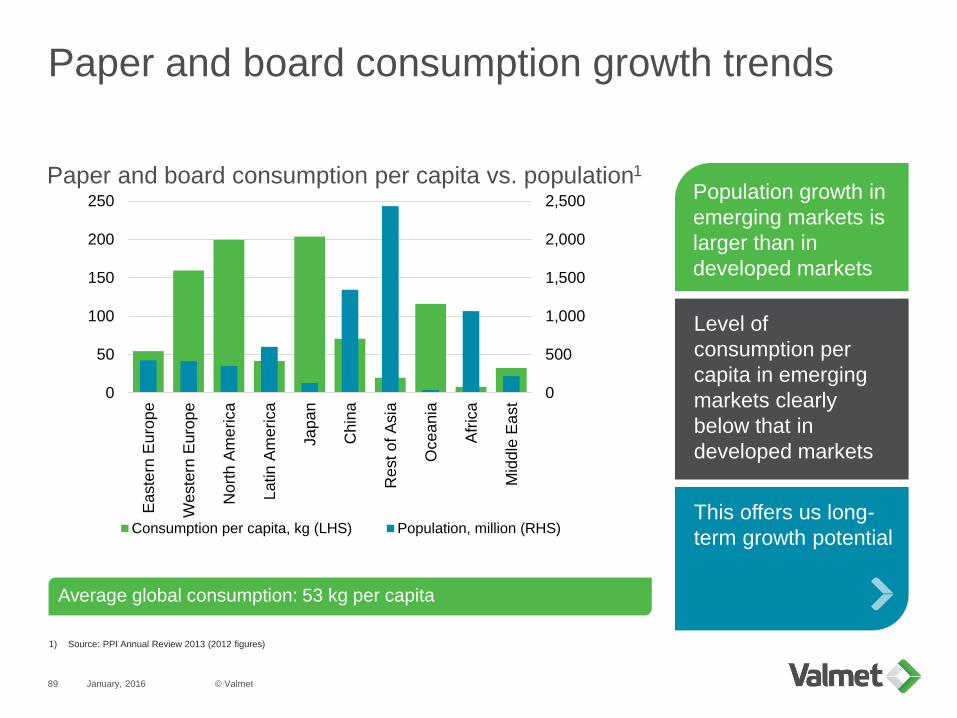
Paper and board consumption growth trends
January, 2016
Population growth in
emerging markets is
larger than in
developed markets
Level of
consumption per
capita in emerging
markets clearly
below that in
developed markets
This offers us long-
term growth potential
Paper and board consumption per capita vs. population1
Average global consumption: 53 kg per capita
1) Source: PPI Annual Review 2013 (2012 figures)
0
500
1,000
1,500
2,000
2,500
0
50
100
150
200
250
Easte
rn E
uro
pe
We
ste
rn E
uro
pe
Nort
h A
me
rica
Latin
Am
eri
ca
Ja
pa
n
Chin
a
Rest o
f A
sia
Ocea
nia
Afr
ica
Mid
dle
Ea
st
Consumption per capita, kg (LHS) Population, million (RHS)
© Valmet89
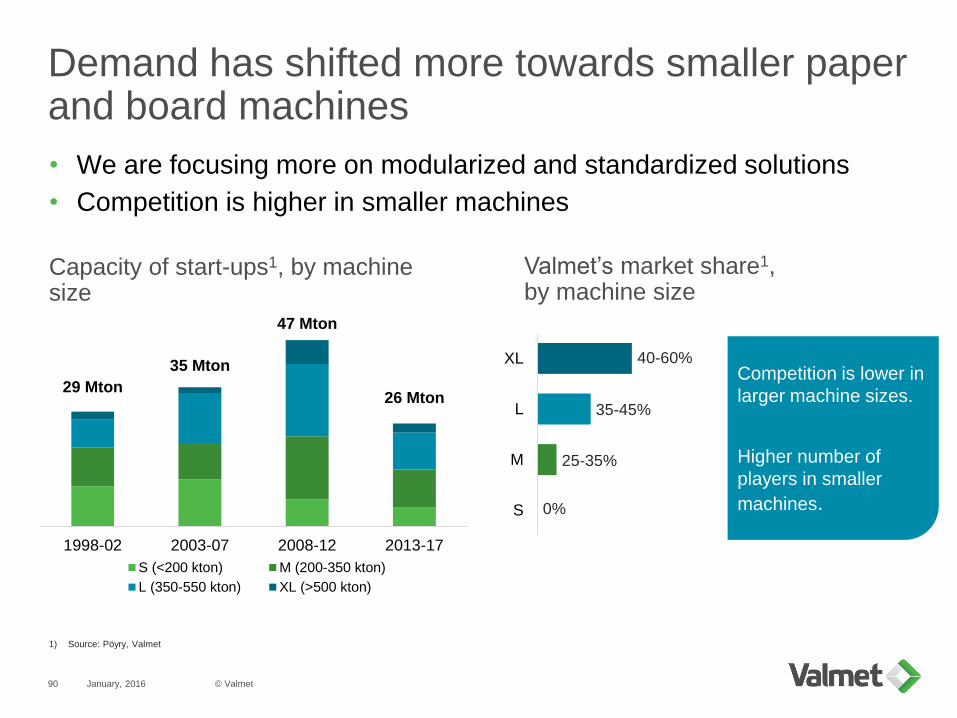
Demand has shifted more towards smaller paper and board machines
January, 2016
• We are focusing more on modularized and standardized solutions
• Competition is higher in smaller machines
Capacity of start-ups1, by machine size
29 Mton
35 Mton
47 Mton
26 Mton
1998-02 2003-07 2008-12 2013-17
S (<200 kton) M (200-350 kton)
L (350-550 kton) XL (>500 kton)
S
M
L
XL
Valmet’s market share1, by machine size
Competition is lower in
larger machine sizes.
Higher number of
players in smaller
machines.
1) Source: Pöyry, Valmet
40-60%
35-45%
25-35%
0%
© Valmet90
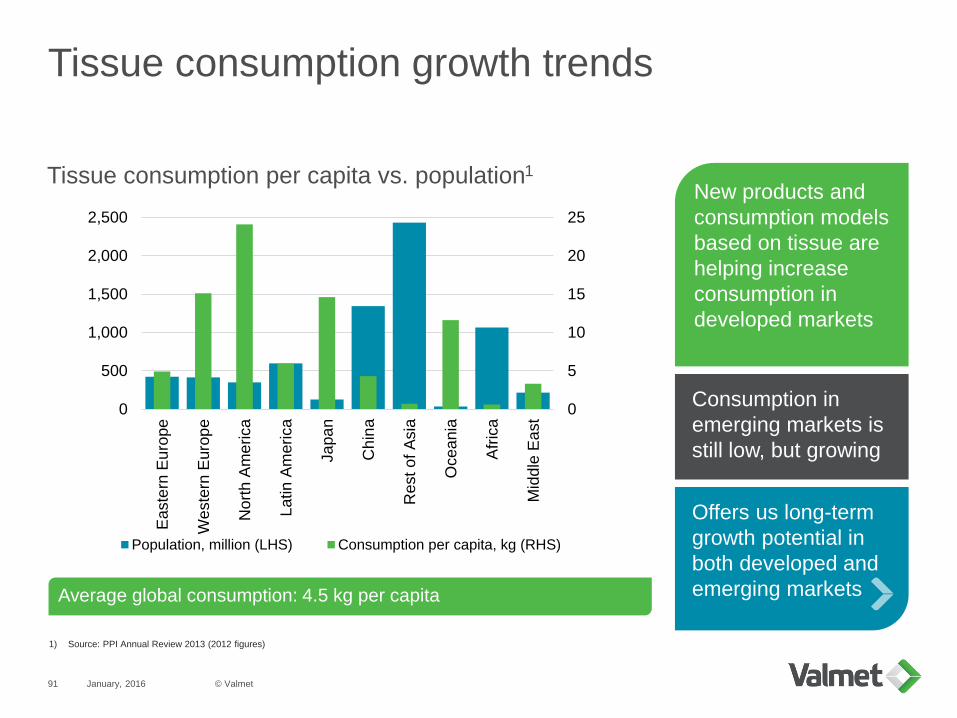
0
5
10
15
20
25
0
500
1,000
1,500
2,000
2,500
Easte
rn E
uro
pe
We
ste
rn E
uro
pe
Nort
h A
me
rica
Latin
Am
eri
ca
Ja
pa
n
Ch
ina
Rest o
f A
sia
Ocea
nia
Afr
ica
Mid
dle
Ea
st
Population, million (LHS) Consumption per capita, kg (RHS)
Tissue consumption growth trends
January, 2016
New products and
consumption models
based on tissue are
helping increase
consumption in
developed markets
Consumption in
emerging markets is
still low, but growing
Offers us long-term
growth potential in
both developed and
emerging markets
Tissue consumption per capita vs. population1
Average global consumption: 4.5 kg per capita
1) Source: PPI Annual Review 2013 (2012 figures)
© Valmet91
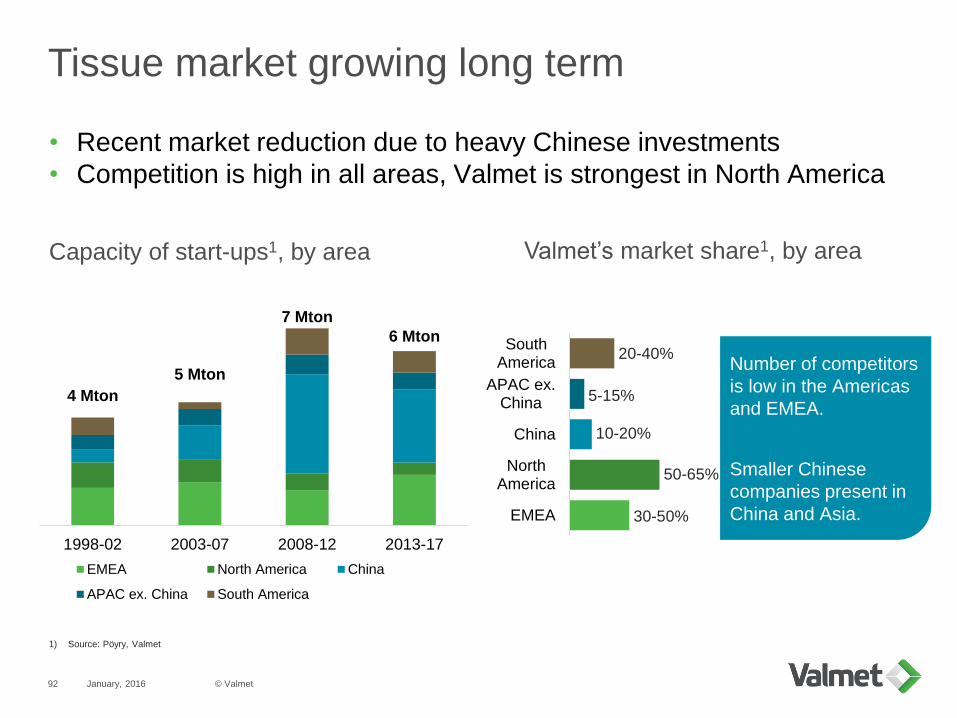
Tissue market growing long term
January, 2016
EMEA
NorthAmerica
China
APAC ex.China
SouthAmerica
• Recent market reduction due to heavy Chinese investments
• Competition is high in all areas, Valmet is strongest in North America
Capacity of start-ups1, by area Valmet’s market share1, by area
4 Mton
5 Mton
7 Mton
6 Mton
1998-02 2003-07 2008-12 2013-17
EMEA North America China
APAC ex. China South America
Number of competitors
is low in the Americas
and EMEA.
Smaller Chinese
companies present in
China and Asia.
1) Source: Pöyry, Valmet
20-40%
5-15%
10-20%
50-65%
30-50%
© Valmet92
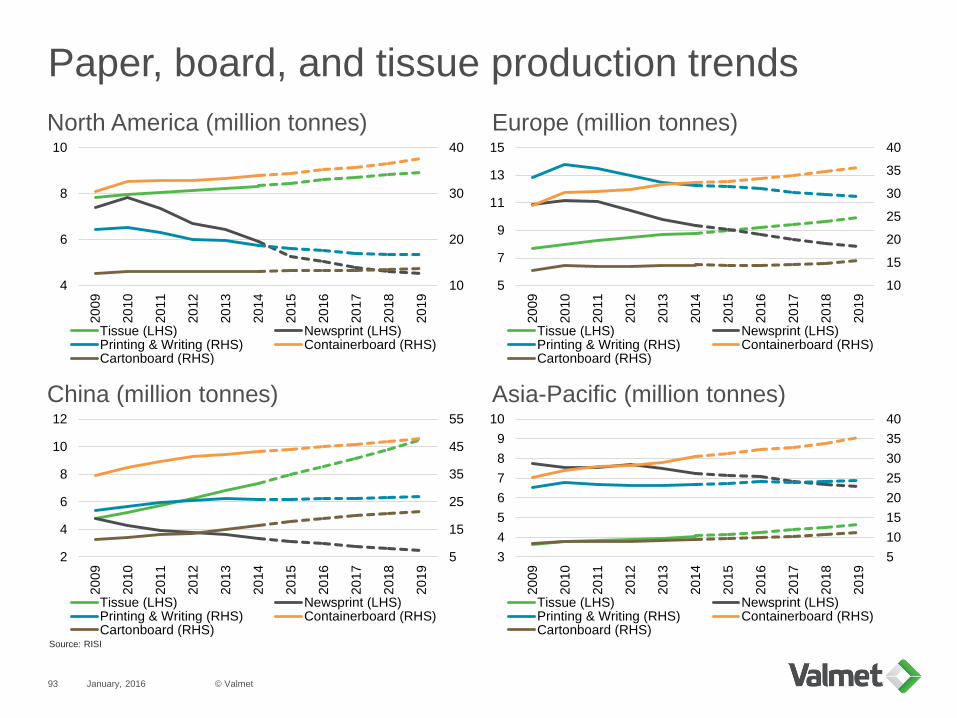
January, 2016
Paper, board, and tissue production trends
Source: RISI
North America (million tonnes) Europe (million tonnes)
China (million tonnes) Asia-Pacific (million tonnes)
10
20
30
40
4
6
8
10
20
09
20
10
20
11
20
12
20
13
20
14
20
15
20
16
20
17
20
18
20
19
Tissue (LHS) Newsprint (LHS)Printing & Writing (RHS) Containerboard (RHS)Cartonboard (RHS)
10
15
20
25
30
35
40
5
7
9
11
13
15
20
09
20
10
20
11
20
12
20
13
20
14
20
15
20
16
20
17
20
18
20
19
Tissue (LHS) Newsprint (LHS)Printing & Writing (RHS) Containerboard (RHS)Cartonboard (RHS)
5
15
25
35
45
55
2
4
6
8
10
12
20
09
20
10
20
11
20
12
20
13
20
14
20
15
20
16
20
17
20
18
20
19
Tissue (LHS) Newsprint (LHS)Printing & Writing (RHS) Containerboard (RHS)Cartonboard (RHS)
5
10
15
20
25
30
35
40
3
4
5
6
7
8
9
10
20
09
20
10
20
11
20
12
20
13
20
14
20
15
20
16
20
17
20
18
20
19
Tissue (LHS) Newsprint (LHS)Printing & Writing (RHS) Containerboard (RHS)Cartonboard (RHS)
© Valmet93
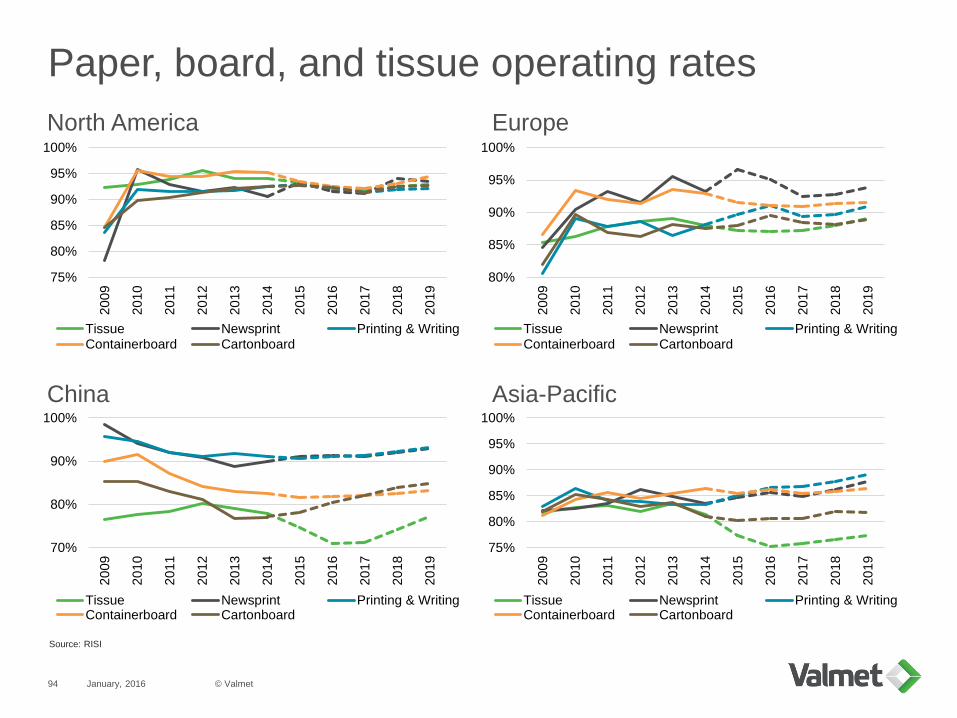
January, 2016
Paper, board, and tissue operating rates
Source: RISI
North America Europe
China Asia-Pacific
75%
80%
85%
90%
95%
100%
20
09
20
10
20
11
20
12
20
13
20
14
20
15
20
16
20
17
20
18
20
19
Tissue Newsprint Printing & WritingContainerboard Cartonboard
80%
85%
90%
95%
100%
20
09
20
10
20
11
20
12
20
13
20
14
20
15
20
16
20
17
20
18
20
19
Tissue Newsprint Printing & WritingContainerboard Cartonboard
70%
80%
90%
100%
20
09
20
10
20
11
20
12
20
13
20
14
20
15
20
16
20
17
20
18
20
19
Tissue Newsprint Printing & WritingContainerboard Cartonboard
75%
80%
85%
90%
95%
100%
20
09
20
10
20
11
20
12
20
13
20
14
20
15
20
16
20
17
20
18
20
19
Tissue Newsprint Printing & WritingContainerboard Cartonboard
© Valmet94
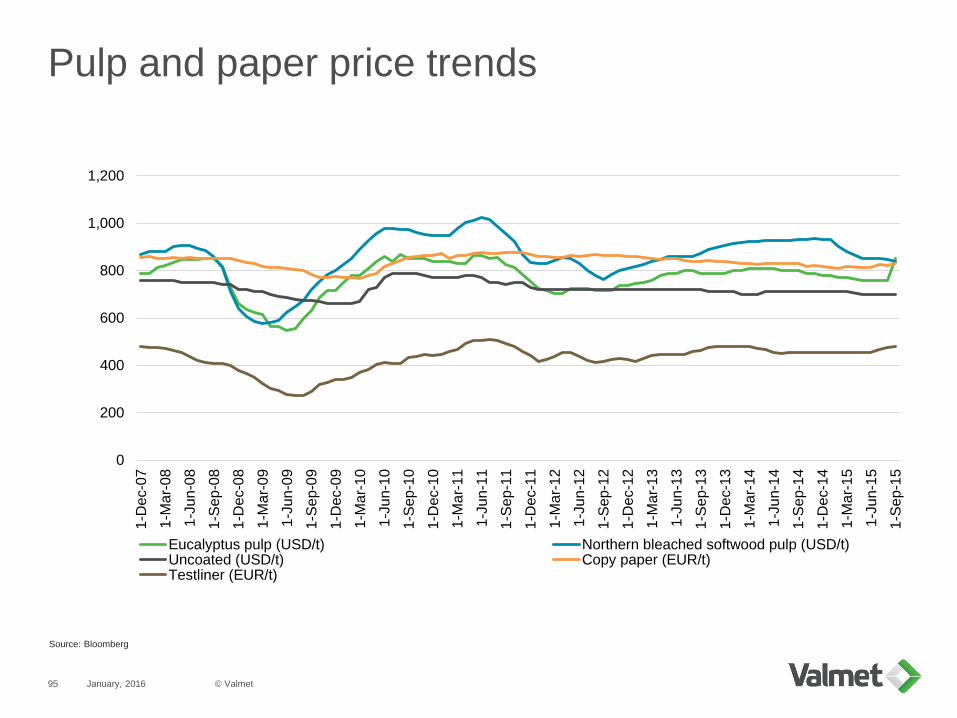
Pulp and paper price trends
January, 2016
Source: Bloomberg
© Valmet95
0
200
400
600
800
1,000
1,200
1-D
ec-0
7
1-M
ar-
08
1-J
un-0
8
1-S
ep
-08
1-D
ec-0
8
1-M
ar-
09
1-J
un-0
9
1-S
ep
-09
1-D
ec-0
9
1-M
ar-
10
1-J
un-1
0
1-S
ep
-10
1-D
ec-1
0
1-M
ar-
11
1-J
un-1
1
1-S
ep
-11
1-D
ec-1
1
1-M
ar-
12
1-J
un-1
2
1-S
ep
-12
1-D
ec-1
2
1-M
ar-
13
1-J
un-1
3
1-S
ep
-13
1-D
ec-1
3
1-M
ar-
14
1-J
un-1
4
1-S
ep
-14
1-D
ec-1
4
1-M
ar-
15
1-J
un-1
5
1-S
ep
-15
Eucalyptus pulp (USD/t) Northern bleached softwood pulp (USD/t)Uncoated (USD/t) Copy paper (EUR/t)Testliner (EUR/t)
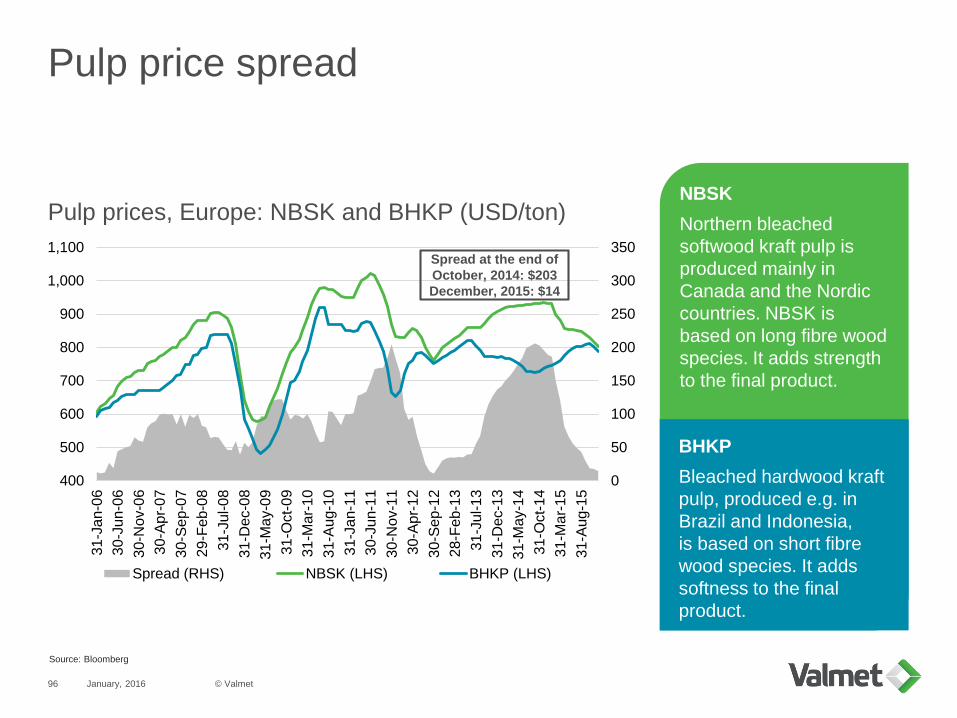
0
50
100
150
200
250
300
350
400
500
600
700
800
900
1,000
1,100
31-J
an-0
6
30-J
un-0
6
30
-No
v-0
6
30-A
pr-
07
30-S
ep-0
7
29-F
eb
-08
31-J
ul-0
8
31
-De
c-0
8
31-M
ay-0
9
31-O
ct-
09
31-M
ar-
10
31-A
ug-1
0
31-J
an-1
1
30-J
un-1
1
30
-No
v-1
1
30-A
pr-
12
30-S
ep-1
2
28-F
eb
-13
31-J
ul-1
3
31
-De
c-1
3
31-M
ay-1
4
31-O
ct-
14
31-M
ar-
15
31-A
ug-1
5Spread (RHS) NBSK (LHS) BHKP (LHS)
Spread at the end of
October, 2014: $203
December, 2015: $14
January, 2016
Pulp price spread
NBSK
Northern bleached
softwood kraft pulp is
produced mainly in
Canada and the Nordic
countries. NBSK is
based on long fibre wood
species. It adds strength
to the final product.
BHKP
Bleached hardwood kraft
pulp, produced e.g. in
Brazil and Indonesia,
is based on short fibre
wood species. It adds
softness to the final
product.
Pulp prices, Europe: NBSK and BHKP (USD/ton)
Source: Bloomberg
© Valmet96
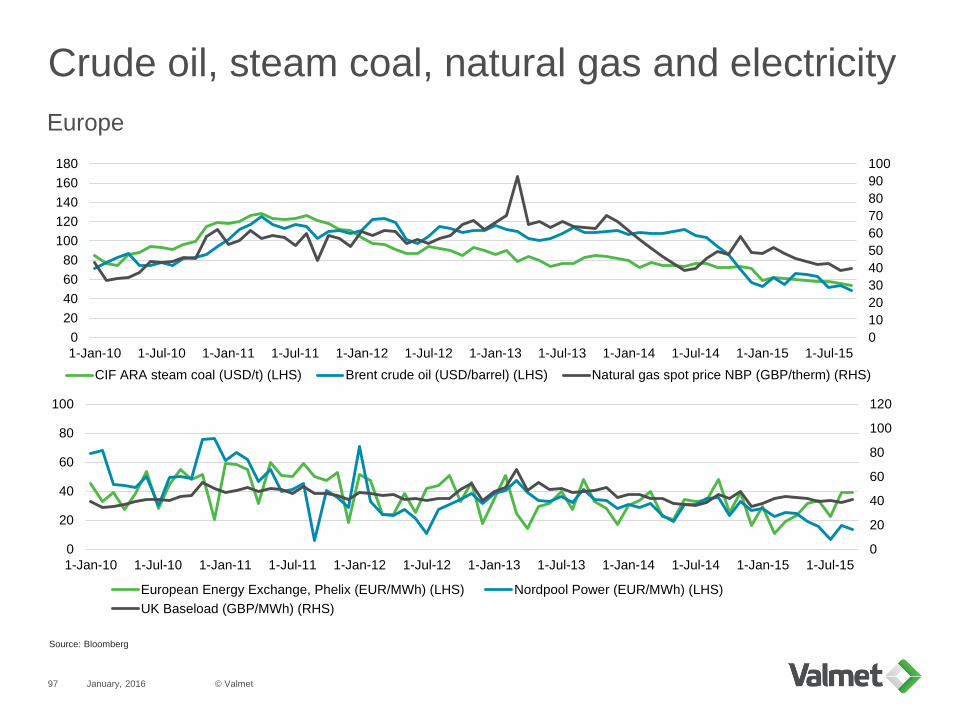
Crude oil, steam coal, natural gas and electricity
January, 2016
Source: Bloomberg
Europe
© Valmet97
0
10
20
30
40
50
60
70
80
90
100
0
20
40
60
80
100
120
140
160
180
1-Jan-10 1-Jul-10 1-Jan-11 1-Jul-11 1-Jan-12 1-Jul-12 1-Jan-13 1-Jul-13 1-Jan-14 1-Jul-14 1-Jan-15 1-Jul-15
CIF ARA steam coal (USD/t) (LHS) Brent crude oil (USD/barrel) (LHS) Natural gas spot price NBP (GBP/therm) (RHS)
0
20
40
60
80
100
120
0
20
40
60
80
100
1-Jan-10 1-Jul-10 1-Jan-11 1-Jul-11 1-Jan-12 1-Jul-12 1-Jan-13 1-Jul-13 1-Jan-14 1-Jul-14 1-Jan-15 1-Jul-15
European Energy Exchange, Phelix (EUR/MWh) (LHS) Nordpool Power (EUR/MWh) (LHS)
UK Baseload (GBP/MWh) (RHS)
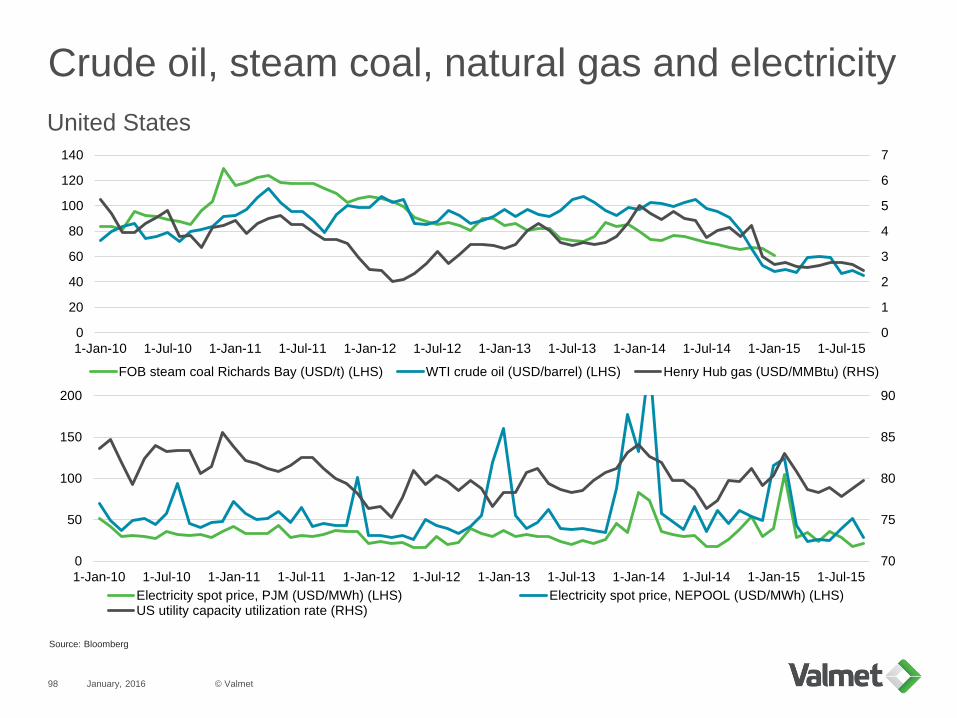
Crude oil, steam coal, natural gas and electricity
January, 2016
Source: Bloomberg
United States
© Valmet98
0
1
2
3
4
5
6
7
0
20
40
60
80
100
120
140
1-Jan-10 1-Jul-10 1-Jan-11 1-Jul-11 1-Jan-12 1-Jul-12 1-Jan-13 1-Jul-13 1-Jan-14 1-Jul-14 1-Jan-15 1-Jul-15
FOB steam coal Richards Bay (USD/t) (LHS) WTI crude oil (USD/barrel) (LHS) Henry Hub gas (USD/MMBtu) (RHS)
70
75
80
85
90
0
50
100
150
200
1-Jan-10 1-Jul-10 1-Jan-11 1-Jul-11 1-Jan-12 1-Jul-12 1-Jan-13 1-Jul-13 1-Jan-14 1-Jul-14 1-Jan-15 1-Jul-15
Electricity spot price, PJM (USD/MWh) (LHS) Electricity spot price, NEPOOL (USD/MWh) (LHS)US utility capacity utilization rate (RHS)
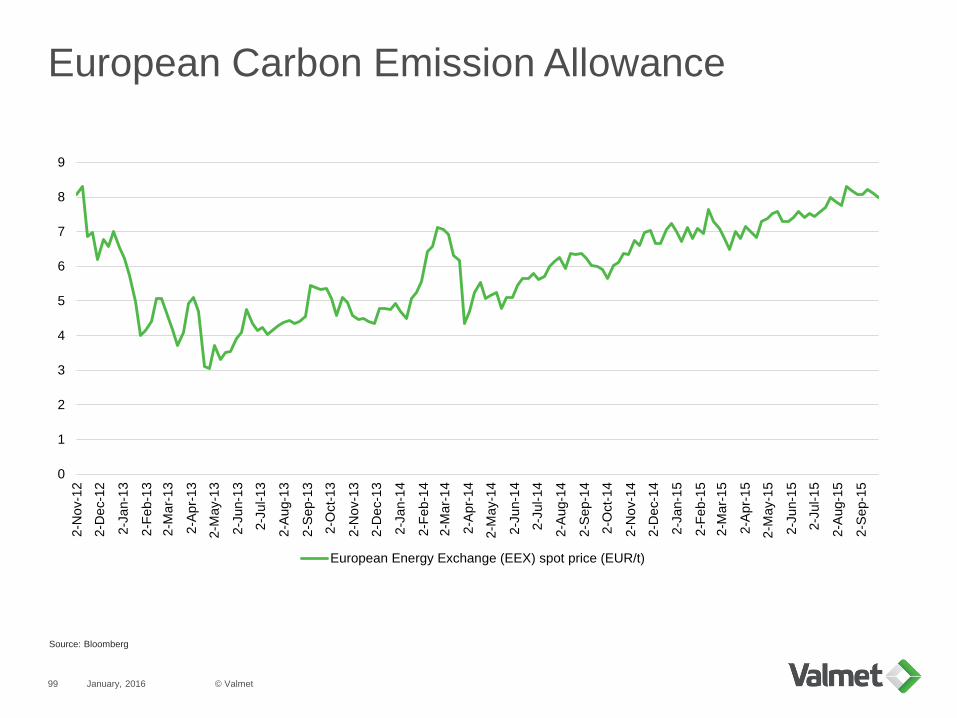
European Carbon Emission Allowance
January, 2016
Source: Bloomberg
© Valmet99
0
1
2
3
4
5
6
7
8
9
2-N
ov-1
2
2-D
ec-1
2
2-J
an-1
3
2-F
eb
-13
2-M
ar-
13
2-A
pr-
13
2-M
ay-1
3
2-J
un-1
3
2-J
ul-1
3
2-A
ug-1
3
2-S
ep-1
3
2-O
ct-
13
2-N
ov-1
3
2-D
ec-1
3
2-J
an-1
4
2-F
eb
-14
2-M
ar-
14
2-A
pr-
14
2-M
ay-1
4
2-J
un-1
4
2-J
ul-1
4
2-A
ug-1
4
2-S
ep-1
4
2-O
ct-
14
2-N
ov-1
4
2-D
ec-1
4
2-J
an-1
5
2-F
eb
-15
2-M
ar-
15
2-A
pr-
15
2-M
ay-1
5
2-J
un-1
5
2-J
ul-1
5
2-A
ug-1
5
2-S
ep-1
5
European Energy Exchange (EEX) spot price (EUR/t)


![Grass Airmatic Pin - mondragonline.com1].pdf · Grass Airmatic Pin Másconfortenlaspuertas 9,5 32 17 32 correr 0 10 +0.2-0.1 mi60 37 28 3232 Base para aplicación de tramas (paracadaplacadeadaptadordebeencargarseel](https://static.documents.pub/doc/80x56/5b4f531d7f8b9a2a6e8c105e/grass-airmatic-pin-1pdf-grass-airmatic-pin-masconfortenlaspuertas-95-32.jpg)


