44
Value chain analysis of Lake Nasser fisheries in Aswan, Upper Egypt

Value chain analysis of Lake Nasser fisheries in Aswan, Upper Egypt

2
VALUE CHAIN ANALYSIS OF LAKE NASSER FISHERIES IN ASWAN, UPPER EGYPT
VALUE CHAIN ANALYSIS OF LAKE NASSER FISHERIES IN ASWAN, UPPER EGYPT
AuthorsAhmed Mohamed Nasr-Allah, Olfat Anwar Habib, Malcolm Dickson and Cathryn Dickson
CitationThis publication should be cited as: Nasr-Allah AM, Habib OA, Dickson M and Dickson C. 2016. Value chain analysis of Lake Nasser fisheries in Aswan, Upper Egypt. Penang, Malaysia: WorldFish. Program Report: 2016-11.
AcknowledgmentsThis research was funded by the Swiss Agency for Development and Cooperation as part of the Youth Employment in Aswan Governorate project, managed by CARE.
The authors would like to express thanks and appreciation to the study team: Mohamed Abdel-Aal, Madkour Ibraheim, Tag El-Den Abdel-Reheem, Adel Abdel-Rahman, Moustafa Mahmoud, Yasser Abdel-Hammed, El-Aref Eid, Fathi Hammed and Hussein Abu-Hassan for their effort in data collection and validation; and the data entry team: Amr El-Terry, Ahmed Negm and Mahmoud Hassan.
Thanks are also due to Waseem Emam for data analysis and initial report layout.
3
CONTENTSCONTENTS List of figures 4
List of tables 4
List of abbreviations 5
Executive summary 6
Introduction and background 8
Study methodology and approach 10
Overview of Egyptian fisheries 12
Lake Nasser fisheries value chain mapping 17
Analysis of critical factors and challenges 30
Benchmarking: Farmed vs. wild-caught fish 35
Recommendations 36
References 39
Appendix 1. Average size and sales price of fish reported by fishers 41
Appendix 2. Average sales price for fish at the three trading nodes 42
Appendix 3. Average sales price for fish produced by processors 43

4
LIST OF FIGURES/LIST OF TABLES
LIST OF FIGURES
LIST OF TABLES
Figure 1. Distribution of fishing zones among fisheries organizations (four cooperatives and a company) and location of landing harbors in Lake Nasser. 10
Figure 2. Relative capture fisheries catches (excluding aquaculture) from Egyptian waterbodies in 2013 (% of catch). 12
Figure 3. Geographical position of Aswan governorate within Egypt. 13
Figure 4. Annual trend of catch by fish group from Lake Nasser, 2004–2013. 14
Figure 5. Catch distribution of all species by month in year 2012. 15
Figure 6. Schematic chart for Lake Nasser fisheries value chain. 18
Figure 7. Monthly prices for Aswan tilapia and grade one farmed tilapia in El-Obour wholesale market in 2013. 35
Table 1. Characteristics of the fisheries organizations in Lake Nasser. 11
Table 2. Number of value chain interviewees. 11
Table 3. List of scientific and common names of fish species in Lake Nasser. 14
Table 4. Salted fish processing. 19
Table 5. Employment creation in the Lake Nasser fisheries value chain. 19
Table 6. Characteristics of fishers interviewed in this study. 20
Table 7. Fishing nets and boats used by fishers in Lake Nasser. 21
Table 8. Operational data for the fishing subsector in Lake Nasser. 22
Table 9. Financial performance of fishers interviewed in this study. 23
Table 10. Characteristics of intermediaries, wholesalers and retailers in Aswan. 23
Table 11. Operational and financial performance for intermediaries, wholesalers and retailers. 25
Table 12. Characteristics of fish processors interviewed in this study. 26
Table 13. Average operational data for the fish processing subsector of the fisheries value chain in Lake Nasser. 27
Table 14. Financial performance of fish processors interviewed in this study. 28
Table 15. Gross output values (average prices) for the Lake Nasser fisheries value chain. 28
Table 16. Operational and net profits created in the Lake Nasser fisheries value chain. 28
Table 17. Total value added created in Aswan fisheries value chain. 29
Table 18. Fish processing summary table. 29
Table 19. Summary of critical issues constraining the fisheries of Lake Nasser. 30

5
LIST OF ABBREVIATIONSLIST OF ABBREVIATIONS CITES Convention on International Trade in Endangered Species of Wild Fauna and Flora
EEAA Egyptian Environmental Affairs Agency
EGP Egypt pound (1 USD = EGP 7.73)
FTE full-time equivalent (jobs)
GAFRD General Authority for Fishery Resources Development
HDLDA High Dam Lake Development Authority
kg kilogram(s)
km kilometer(s)
NGO nongovernmental organization
NIOF National Institute for Oceanography and Fisheries
NRNA Nile River Navigation Authority
SDC Swiss Agency for Development and Cooperation
t metric ton(s)
YEAG Youth Employment in Aswan Governorate
6
EXECUTIVE SUMMARY
EXECUTIVE SUMMARY Lake Nasser is an artificial lake established after construction of the High Dam in Aswan to generate electricity, control river flooding and supply water for various uses throughout the year. The lake extends for more than 300 kilometers (km) inside Egypt’s border, with a shoreline of about 7000 km. The lake has become an important source of fish for residents of Aswan and adjacent governorates in Upper Egypt. Capture fisheries from Lake Nasser represented 55% of the total production from inland lakes in Egypt in 2013.
Although the fishery in Lake Nasser has existed for more than 40 years, its economic performance is not well understood or documented. To improve understanding of fisheries performance in Lake Nasser, this report presents the outputs of a value chain analysis of the sector. Individual interviews and focus group discussions with fishers, traders (intermediaries, wholesalers and retailers) and processors were used to collect quantitative and qualitative information about financial performance, employment creation and critical factors impacting performance of each node throughout the chain.
Tilapia (bolti) account for 75% of capture volume, while Alestes spp. (raya) and tigerfish (kalb el samak) together account for about 13% of total capture. Other fish recorded in the catch are Nile perch (samoos), squeaker catfish (shall), sharptooth catfish (karmout) and Bagrus catfish (bayad). The key features of the fisheries value chain are as follows:
• Trammel and gill nets are the main fishing nets used by fishers in Lake Nasser.• All fish caught are destined for local consumption, with no record of exports. This is similar to
the value chain for Egyptian aquaculture.• Fish processing is an important subsector of the Aswan fisheries value chain. Some fish species
(mainly tigerfish and Alestes spp.) are only consumed after going through a salting process. These species comprise about 13% of total catch. Processing of fresh tilapia and Nile perch (fillets and degutted) has developed more recently to meet demand from local tourist hotels.
• Tilapia and Nile perch are sold fresh on ice. Since fishing trips take on average 2.5 days from the fishing ground to landing harbors, ice is essential to maintain quality during transport to landing sites and during delivery to markets. However, availability of a sufficient supply of clean ice is an ongoing problem.
• Intermediaries play an important role in collecting catches from fishers in their fishing camps and selling on to wholesalers at landing sites or in the market.
• The fisheries sector contributes significantly to direct job creation, including for youth. One hundred metric tons (t) of fish caught and sold provides an average of 29.99 full-time equivalent jobs (FTE). Fish processing also contributes to direct job creation, providing 5.8 FTE for each hundred tons processed. No women are employed in the fisheries or fish processing sectors in Aswan, although there are prospects for female employment in fish processing. Most of the fishers (57%) are under 30 years old and 49%–59% of other employees are under 30. Using official General Authority for Fishery Resources Development (GAFRD) fish catch statistics for Lake Nasser, this leads to a total employment estimate for the value chain of 8227 FTE.
Examining costs and earnings for each node in the value chain allowed comparison across the various subsectors. Some key findings from data analysis in this study are the following:
• The average catch in the three fishing harbors per boat per day was 42 kilograms (kg), and the average catch per fisher per day was 20 kg.
• Fishers obtained a relatively low percentage (49%) of the final consumer price, due to the long supply chain.

7
EXECUTIVE SUMMARY
• The average total cost in the three fishing harbors was EGP 5210/t. This represents the break-even sales price; i.e. the average price of all fish sold by a fisher must be more than EGP 5210/t if the fisher is to cover operational costs.
• Wages of fishers represented the highest proportion of operational costs in the three harbors (54%). Similarly, fishing nets represented 54% of annual fixed costs of fishing.
• Operating costs represented the highest percentage (73%) of total costs for all fisheries subsectors in the value chain, while fixed costs accounted for the remainder (27%).
• For the fishing subsector, operating profits were 37% and net profits were 15% of sales. For intermediaries, operating profits were 13.4% and net profits were 10.8% of sales. Corresponding figures for the wholesaler subsector were 21.7% and 20.5% of sales, and for the retail subsector, 25% and 22.2% of sales.
• Operating profits generated throughout the value chain were EGP 8972/t for fish caught and sold, net profits were EGP 6896/t, and value added (net profits plus wage earnings) was EGP 10,375/t. The fishing and retail subsectors together contributed more than 60% of total profits and value added for all of these indicators, with intermediaries and wholesalers contributing the remaining 40%.
• Fish processing is an important subsector of the fisheries value chain in Aswan. Processing of fresh fish generated 5.7 FTE/100 t of processed fish, while salted fish processing generated 5.5 FTE/100 t processed. Fresh fish processing led to higher value added (EGP 3652/t) than salted fish processing (EGP 2507/t).
The above figures confirm that the fishery in Lake Nasser generates considerable profits and employment. However, the current study also suggests that the fishery is under pressure from overfishing. Critical factors facing the fisheries sector and impacting profitability can be grouped into those related to (i) inputs, (ii) capture, and (iii) marketing, transportation and sale of product.
With regard to inputs, the availability and price of fuel have had a critical impact on costs and profits. Additional problems of considerable importance include (i) availability of daily work requirements (bread and other food), (ii) availability and quality of fishing gears, (iii) access to credit, (iv) availability and quality of ice and salt, and (v) obtaining licenses and permission for fishing or processing.
At the capture level, critical factors are (i) lack of services to fishers while fishing, (ii) poor living conditions in the lake, (iii) competition at the fishing grounds, and (iv) absence of security in and around the lake. Other capture problems are lack of experience in using new fishing methods and consumption of fish by predators.
With regard to the marketing and distribution of fish, the study showed that the critical factors are (i) poor postharvest handling practices and facilities throughout the value chain and (ii) the absence of a fish auction in Aswan. Other important limiting factors include manipulation of fish prices, fluctuating selling prices and lack of export opportunities. Demand for processed fish fell after the revolution in 2011 due to a decline in the number of tourists visiting Aswan.
This report provides recommendations for support to the fisheries sector in Aswan, which follow directly from these challenges and critical factors. It is recommended that some of the necessary actions be the responsibility of the sector itself, some the responsibility of the government, and some the responsibility of donors and nongovernmental organizations (NGOs). For meaningful improvements to take place in value chain performance, substantial action and investments will be needed by many stakeholders.

8
INTRODUCTION AND BACKGROUND
INTRODUCTION AND BACKGROUND
Background This report documents the outputs of the Aswan fisheries value chain study that took place in January and February 2015. This value chain analysis forms part of the Youth Employment in Aswan Governorate (YEAG) project funded by the Swiss Agency for Development and Cooperation (SDC) and led by CARE Egypt in partnership with WorldFish.
The aim of the YEAG project is to increase incomes and employment for youth, women and men in Aswan by focusing on improving the performance of key value chains and enhancing the enabling environment. The current study concentrates on mapping and documenting fisheries value chains from fishers to retailers to identify the scope for job creation, livelihood improvement and poverty reduction.
This work was carried out by the WorldFish team together with a team of local experts from the High Dam Lake Development Authority (HDLDA).
Introduction to value chain analysisA value chain is a sequence of related enterprises (operators) conducting activities (functions) so as to add value to a product from its primary production, through its processing and marketing, to the final sale of the product to consumers. The functions of each link in the chain involve sourcing inputs, making and producing, and then delivering and selling the product to the next link in the chain (Kaplinsky and Morris 2001; Macfadyen et al. 2011). Value chain analysis was first described and popularized by Michael Porter in the mid-1980s (Porter 1985). The methodology is used to assess the relative importance of factors affecting competitiveness and the costs and earnings for those involved in the value chain. It helps to identify gaps or weaknesses in value chain performance and, perhaps most importantly, it aids identification of levers and targeted action programs to upgrade and improve value chain performance. Value chain analysis also involves benchmarking changes over time and allows a focus on distributional
issues and pro-poor growth. In the case of export products it can highlight global linkages.Value chain analysis is composed of a number of steps described in detail by Macfadyen et al. (2011). The first is to describe the overall market within which the specific value chain operates. The second is to describe the value chain itself. This includes considering who is involved and tries to capture quantitative and qualitative information on employment, revenues, profits and unit product values for those involved in the value chain. Analysis is also conducted to assess the critical challenges and factors impacting value addition through the chain. Finally, these descriptive and analytical steps can be used to identify possible interventions to the critical challenges, and to specify an implementation plan to bring about an upgrade or development of the value chain.
An important component of value chain analysis is the recognition that support and action for improving performance can be achieved both by those within the value chain itself and by those outside it. Businesses in the chain can improve performance by reducing costs, increasing outputs and/or increasing the prices of their products. Typically, mechanisms to do so involve value chain actors being more efficient at what they do and improving the quality or value of the product being sold to the next actor in the value chain.
The development of a detailed value chain analysis can highlight the various opportunities and constraints associated with the system in question as well as help to explain the market dynamics at play. This helps identify areas where there is potential to increase the value added, either through improving the product itself, through producing it in a more efficient way, or by introducing additional higher-value services. After this process has been undergone, appropriate livelihood interventions can then be identified and pursued.
External influencing factors, such as national policy, the presence of other projects (either private sector or government-administered) and the infrastructure in place must also be considered. Such factors represent the enabling

9
INTRODUCTION AND BACKGROUNDenvironment for the governance of the value chain and influence the likelihood of success for each activity.
Given SDC’s interest in addressing youth unemployment, the present study focuses on the potential to achieve job creation within fishing communities and low-income groups. This is the first study of the fisheries value chain in Lake Nasser and could form the basis of further studies.
The YEAG project and fisheriesThe YEAG project is a 3-year intervention that began in September 2014. The aim of the YEAG project is to increase incomes and employment for youth, women and men in Aswan in the agriculture sector, including fisheries. WorldFish was subcontracted through CARE International (Egypt) to lead the fisheries activities of the project. WorldFish solicited feedback from local fishers regarding problems faced and ideas on how to address them during scoping trips to Aswan in January and February 2014. During project preparation, the WorldFish team identified the need to carry out a value chain analysis to identify potential areas for intervention to improve performance of the fisheries sector and create employment.
Study objectivesThe objectives of the Lake Nasser fisheries value chain study were to do the following: • Identify and describe the products and
any distinct subgroups that constitute the main focus for this study (wild-caught fish) and, where possible, provide an estimate of applicable production volumes (e.g. by landing, main market or region).
• Map the value chain for fish caught from Lake Nasser and the flow of fish products through the chain(s). In doing so, identify the various actors, their functions and existing linkages in these fisheries value chains; identify and as far as possible describe any significant chains that lead into other markets.
• Conduct a preliminary analysis of the input-output structure and the distribution of margins and return on investment along the chain.
• Identify significant trends and policy changes influencing fisheries value chains.
• From the perspective of fish value chain livelihoods, analyze the constraints and opportunities in the value chain (from the point of initial sale at the landing).
• Make recommendations on pilot interventions and partnerships with the potential to significantly expand livelihood opportunities in the value chains.
• Consider job creation by the sector across the chain.
• Understand the costs and benefits of the different subsectors of the value chain.
• Where apparent during the course of field work, note and describe any significant planned or proposed investments targeting the fishing economy in Aswan governorate (e.g. new port or processing facilities); where possible, identify key levers and/or approaches that would improve the poverty impacts of such investments.
• Identify the problems and opportunities facing different actors in the fisheries value chain.

10
STUDY METHODOLOGY AND APPROACH
STUDY METHODOLOGY AND APPROACH
Figure 1. Distribution of fishing zones among fisheries organizations (four cooperatives and a company) and location of landing harbors in Lake Nasser.
Source: High Dam Lake Development Authority (HDLDA).
1. Misr Aswan Company (187 km shoreline)
2. Aswan Sons Cooperative Society (300 km shoreline)
3. Fishermen Cooperative Society (Mother) (800 km shoreline)
4. Nubian Cooperative Society (370 km shoreline)
5. El-Takamol Cooperative Society (66 km shoreline)
1
2
3
4
5
Distribution of fishing areas of Lake Nasser
Aswan harbor
Garf Hussein harbor
Abu Simbel harbor
The study was completed by two teams: data collection (eight individuals) and data entry (three individuals). Both teams had previous experience in data collection from fishers in Lake Nasser through their work in the Water and Food Challenge Program (waterandfood.org). Three main target groups were identified in this study: fishers, traders (intermediaries, wholesalers and retailers) and fish processors.
The work for this study consisted of three main stages: planning, data collection and data entry.
PlanningThe study team carried out the following activities during planning: • The study team leader made a presentation
on value chain analysis to the rest of the team.• The team designed and drafted (in Arabic)
three questionnaires to be used in the study (one for fishers, one for processors—of both fresh and salted fish—and one for the postharvest subsector; i.e. intermediaries, wholesalers and retailers).
• The study team tested and revised the questionnaires—adding questions, rephrasing and simplifying wording for the interviewees as appropriate.
• The questionnaires were translated into English for data entry and reporting.
• The team discussed and agreed on a detailed activity and travel schedule and finalized and printed multiple copies of the questionnaire for fieldwork.
As shown in Figure 1, Lake Nasser is divided into five fishing zones that have been allocated to four fishing cooperative societies through two national decrees: Decree No. 621, issued in 1981, and Decree No. 45, issued in 1985 (van Zweiten et al. 2011; Halls et al. 2015). The numbers of fishing boats and fishers and the designated landing harbor for each cooperative are displayed in Table 1.
To ensure equal representation in the value chain analysis survey, fishers were selected on a stratified random basis in the three fish landing sites (Aswan, Garf Hussein and Abu Simbel). For fish processors, who are only based in Aswan, the sample was selected randomly from a list of fish processors. Fish traders were selected to represent different trading activities (intermediaries, wholesalers and retailers).

11
STUDY METHODOLOGY AND APPROACH
Interviewee category Number interviewed Number included in the analysisFishers 170 162Processors (fresh and salted) 23 22Traders (intermediaries, wholesalers and retailers)
24 23
Table 2. Number of value chain interviewees.
Landing site # of transport cars**
# of carrier boats*
# of fishers
# of fishing boats
Cooperative society or company
AswanAswanGarf HusseinAbu SimbelAbu Simbel
-3520
8-
3 (3)25 (20)84 (20)33 (18)
4 (4)
7802,3007,8802,230
260
218615
1,632520
61
Misr Aswan CompanyAswan Sons Cooperative SocietyFishermen Cooperative Society (Mother)Nubian Cooperative SocietyEl-Takamol Cooperative Society
63149 (65)13,4503,046Total* Numbers in parentheses refer to the estimated number of carrier boats actually operating and landing fish in the
harbors. ** The number of fish transport cars operated by wholesalers and traders (harbor manager’s estimate).
Table 1. Characteristics of the fisheries organizations in Lake Nasser.
Source: Halls et al. (2015).
Data collectionThe data collectors were organized into three groups, one for each of the three landing harbors: Aswan, Garf Hussein and Abu Simbel. The strategy was to interview fishers at their campsites at the lake and/or at the landing harbors while they were landing their catch. A group of four or five data collectors also hired boats to reach fishers at their fishing camps near the Aswan High Dam, at Garf Hussein and in the Abu Simbel area.
Fish processors are based only in Aswan and were usually visited by two data collectors at their site of operation. Fish traders were interviewed in Aswan and Abu Simbel, where most of their activities were concentrated. The number of interviewees for each category are listed in Table 2. A few interviews with fishers were excluded after data validation meetings with data collectors and managers of the three fishing harbors. One fish processor was excluded because he worked in processing of both fresh and salted fish. Another trader was excluded because he worked in more than one segment of the fish trade.
Data entry and analysisThe responses to the questionnaires were entered into an Excel spreadsheet. Each completed questionnaire was reviewed and checked for validity by the corresponding interviewer. The data was then analyzed to generate the outputs presented in this report.
Operating and fixed costs estimation: Operating costs for fishers are the costs that vary depending on the amount of fish captured. Typical costs include boat fuel, fishing gears, labor, transport, ice, and sales commission paid to intermediaries or wholesalers. For fish traders and processors, operating costs include fish bought, transportation, ice, fuel, electricity and wages.
Fixed costs are the costs that do not vary depending on production volumes. These typically include boat or equipment repair and maintenance and government license fees. Depreciation costs have been estimated by obtaining information on the replacement of fixed assets and depreciation over standardized lifespans for each item; e.g. nets over 3 years, boats over 7 years, freezers and fridges over 7 years, and fish handling boxes over 3 years.

12
OVERVIEW OF EGYPTIAN FISHERIES
OVERVIEW OF EGYPTIAN FISHERIES
Figure 2. Relative capture fisheries catches (excluding aquaculture) from Egyptian waterbodies in 2013 (% of catch).
% of total fisheries catch
42%
19%
18%
12%
6%4%
Northern lakes and lagoons
Mediterranean Sea
Nile River
Red Sea
Lake Nasser
Other inland lakes
Source: GAFRD (2015).
National overviewDespite receiving little rainfall, Egypt has extensive marine and freshwater aquatic resources for fish production. It has over 1800 km of marine shoreline on the Mediterranean to the north and the Red Sea to the east. Inland but close to the Mediterranean coast, there are five brackish-water lakes: Bardawel, Manzala, Burullus, Edku and Mariout, most of which are fed indirectly from the Nile through water from agricultural irrigation schemes. There are a few brackish-water lakes further inland, including Lake Qaroun and the Rayan Lakes near Fayoum. The Nile River itself is also an important fishery. In Upper Egypt, Lake Nasser is the major fishery, providing an important source of income and livelihood generation for fishers, traders and processors in Aswan and attracting large numbers of fishers from other governorates in Upper Egypt.
While Egypt has a long history of fishing activities, yields from capture fisheries have shown only limited increases in recent years. Capture fisheries output increased from 305,000 t in 1993 to 357,000 t in 2013 (GAFRD 2015). In contrast, aquaculture production (mainly from ponds near the Nile delta lakes) increased from 54,000 to 1.08 million metric tons over the same period (GAFRD 2015), indicating that aquaculture now provides the main source of fish for Egyptians.
Despite this, the Lake Nasser fishery is locally important as the main source of fish for Upper Egypt, where aquaculture has not yet developed. Figure 3 shows the location of the Aswan governorate within Egypt. Due to the high quality of catch, processors of tilapia and Nile perch in Aswan began targeting tourist hotels and restaurants after the lake was created in the late 1960s. Also, there is potential for export of fish from Lake Nasser if good postharvest handling practices are adopted.
National macroeconomic and food security context affecting the sectorWith an estimated population of 87 million (CAPMAS 2014), Egypt has the 15th largest population in the world, the third-largest population in Africa and the largest population in the Arab region. The population has been increasing in recent years by around 2 million per year. Lake Nasser represents an important source of livelihood and food security not only for the 1.4 million residents of Aswan, but also for many people living in surrounding governorates, including Sohage (4.5 million), Qena (2.9 million) and Luxor (1.1 million; CAPMAS 2014).

13
OVERVIEW OF EGYPTIAN FISHERIES
Figure 3. Geographical position of Aswan governorate within Egypt.
Abu Simbel
Esna
IdfuNagaa ARRitaj Al Bahari
Nagaa Baqlawis
Al MadiqDabudIzbat AlKhamr Al Qibil
NagaaEl-Shaikh
Lake Nasser
Aswan
Iqlit
Daraw
Al Aqabahas Saghirah
Since Upper Egypt is far from the main farmed fish production centers in the Nile Delta, fish captured from the lake is an important source of animal protein for local consumers. Aswan is famous for production of salted fish (muluha) made from particular species caught in Lake Nasser. There is good market demand for muluha in Aswan and other governorates of Upper Egypt, especially during Easter and Eid celebrations.
The economic importance of Lake Nasser fisheriesLake Nasser is a rich waterbody home to 52 fish species belonging to 15 families (van Zwieten et al. 2011). During recent decades, the lake’s ecosystem has undergone change and species diversity has declined (Béné et al. 2009). Some species are restricted to the southern part of the lake, while others are found only occasionally in the catch. Table 3 lists the important species recorded in the catch from Lake Nasser. Tilapia, including Oreochomis niloticus, Sarotherodon galilaeus, Tilapia zillii and Oreochromis aureus, form the bulk of the catch, comprising as much as 80% of the total catch by weight.
Official statistics of fish catches from Lake Nasser by species group for the past 10 years are presented in Figure 4. It shows that recorded fish catches declined in the last 5 years mainly due to reduced tilapia and Nile perch catches.
However, data anomalies such as the rapid increase in recorded catch of Nile perch between 2008 and 2009 suggest that there have been inconsistencies in data collection and recording.
Distribution of catches in 2012 (Figure 5) shows that the lowest catches were recorded in April and May and the highest in June, July and November.
Institutional, policy and legal context governing the fisheries sector in EgyptThe Ministry of Agriculture and Land Reclamation has overall responsibility for managing the fisheries and aquaculture sector. Implementation of sector policy and management was delegated to GAFRD in 1983, when Presidential Decree No. 90/183 articulated the powers and duties of GAFRD. Act No. 124 (1983) on fishing, aquatic life and aquaculture is the main body of fisheries legislation regarding the sector. The act focuses on maintaining the fisheries catch in the Mediterranean Sea and Red Sea, as well as inland waters. The act covers the issuing of fishing licenses to fishers and fishing boat licenses. The act also mentions specifications for fishing nets used by fishers in their fishing activities. This act names the National Institute of Oceanography and Fisheries (NIOF) as the scientific institution responsible for stock assessment studies and issuing advice on fisheries management.

14
OVERVIEW OF EGYPTIAN FISHERIES
Scientific name Common namesEnglish Arabic transliteration Arabic
Oreochromis niloticus Nile tilapia Bolti nily بلطى نيىل- بلطى ابيض
Sarotherodon galilaeus Tilapia Bolti galily بلطى جليىل
Oreochromis aureus Blue tilapia Bolti azrag بلطى اوريا- بلطى ازرق
Tilapia zillii Tilapia zillii Bolti akhdar/shabar بلطى اخ�ض – شبار اخ�ض
Lates niloticus Nile perch Samoos ق�ش بياض- ساموس
Bagrus bayad, B. docmak Bagrus catfish Bayad بياض
Labeo niloticus, L. coubei, L. horie
Nile carp, black carp Lebis لبيس
Barbus bynni Barbel Binni ب�ض
Hydrocynus forskalii Tigerfish Kalb el samak كلب السمك
Alestes dentex, A. baremoze, A. nurse
Silverside/pebbly fish Raya الراية
Schilbe mystus Silver catfish Shelba شلبة
Mormyrus kannume, M. caschive
Bottlenose Bweeza بويزة
Clarias gariepinus Sharptooth catfish Karmout قرموط –حوت
Heterobranchus bidorsalis
Vundu Karmout قرموط –حوت
Synodontis schall, S. serratus
Squeaker/shieldhead catfish
Shall الشال- قرقور
Auchenoglanis biscutatus
Black spotted catfish Krafsh الحلوف )كرفش شال - زمر-دقمان(
Malapterurus electricus Electric catfish Raash الرعاد/الرعاش
Table 3. List of scientific and common names of fish species in Lake Nasser.
2004 20082006 2010 20122005 20092007 2011 2013
Met
ric
tons
/yea
r
40,000
20,000
30,000
10,000
35,000
15,000
25,000
5,000
0
Figure 4. Annual trend of catch by fish group from Lake Nasser, 2004–2013.
Note: “Other” includes tigerfish, raya, labeos and unidentified species.
Total Tilapia Nile perch Other
Source: GAFRD (2015).

15
OVERVIEW OF EGYPTIAN FISHERIES
Management of fisheries in Lake Nasser is a special case compared to other inland lakes in Egypt. Since 1973 the lake was managed under the Ministry of Construction and Housing and Land Reclamation through HDLDA. The Fishery Management Center was responsible for development and research within Lake Nasser. After Act No.124 (1983), GAFRD became responsible for issuing fishing cards (for fishers) and fishing licenses (for boats). Then in 1996 HDLDA became part of the Ministry of Agriculture and Land Reclamation and in 2001 became fully responsible for fisheries management. In 2010, according to a memorandum of understanding between GAFRD and HDLDA, responsibility for licenses and supervision of fisher societies reverted to GAFRD. However, responsibility for management of harbors remained with HDLDA.
Allocation of fishing zones in Lake Nasser is decided according to Ministry of Construction and Housing and Land Reclamation Decree No. 621 (1981) and modified in Decree No. 45 (1985).
Since 1979, Lake Nasser has been the only lake in Egypt that was subject to compulsory pricing of fish sales according to several decrees by the Minister of Food Supply. Landing of fresh fish coming from the lake was shared between two state-owned companies, the Egyptian Fish Marketing Company and Misr Aswan Company. The two companies were responsible for processing, freezing, packing and transporting fish to market.
On 14 June 2001, the Prime Minister issued several decrees to end the monopoly of the marketing companies and liberalize fish trade. The Prime Minister’s decree allocated 60% of the shoreline of the lake to members of cooperative societies and 40% to investment by companies or persons with the relevant technical and financial abilities. In 2004, the lake was divided into six sectors. A tender took place and six companies were selected through the tender.
Due to the social importance of the Lake Nasser fishery to surrounding societies, the Governor of Aswan decided in 2004 to organize price setting for fish catches. The Governor formed a committee from representatives of different organizations to determine the fish price. This committee decided fish prices every 2 weeks according to the price of fish at the wholesale market in Cairo (El-Obour market). The Governor also allocated the Egyptian Fish Marketing Company and Misr Aswan Company the entire fish catch in their sectors. However, these measures were unpopular, and in 2008 the fish pricing committee was disbanded and fishers now sell their catch freely.
The Ministry of Interior through the Aquatic Police is responsible for security on the lake. Fishing is only allowed by those with licenses. The Ministry of Interior also works closely with GAFRD to prohibit the use of illegal fishing nets and fishing gear in the lake. Border guards have a limited role in controlling smugglers.
Met
ric
tons
2,000
3,000
1,000
3,500
1,500
2,500
500
0
Jan. Mar. MayFeb. Apr. Jun. Jul. Aug. Sep. Oct. Nov. Dec.
Figure 5. Catch distribution of all species by month in 2012.
Source: GAFRD (2015).
16
Phot
o Cr
edit:
Moh
amed
Abd
el-A
al/W
orld
Fish
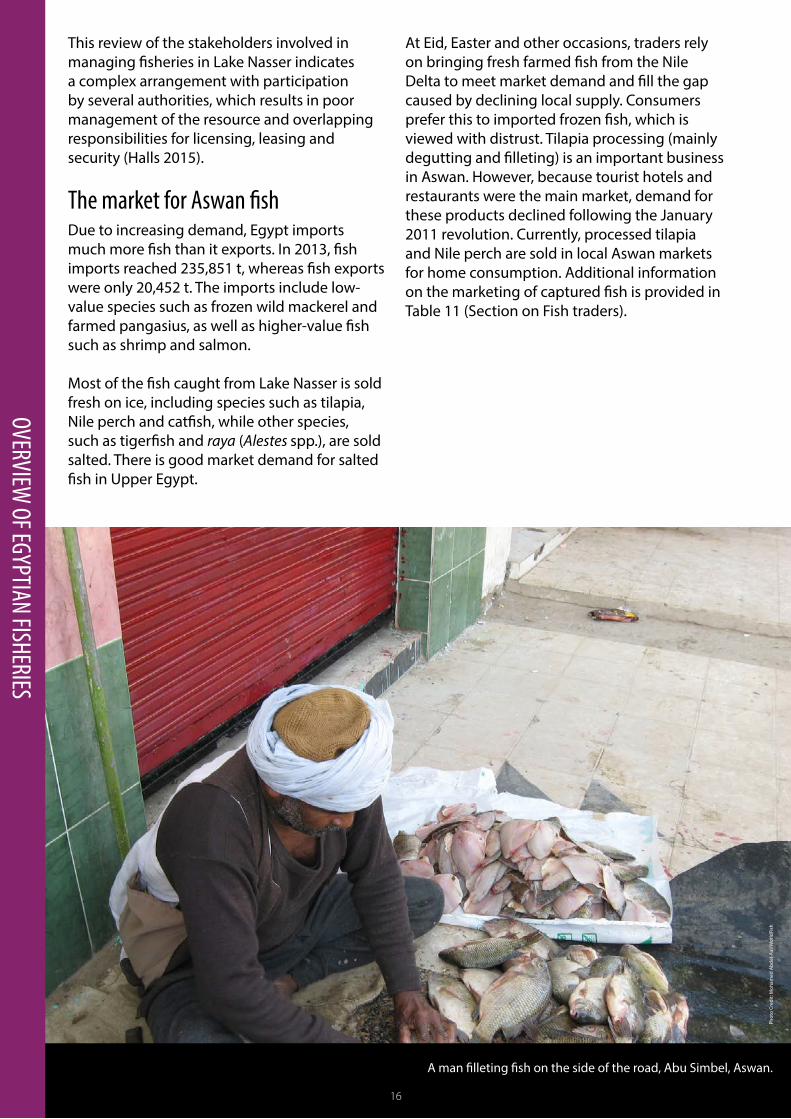
A man filleting fish on the side of the road, Abu Simbel, Aswan.
16
OVERVIEW OF EGYPTIAN FISHERIES
This review of the stakeholders involved in managing fisheries in Lake Nasser indicates a complex arrangement with participation by several authorities, which results in poor management of the resource and overlapping responsibilities for licensing, leasing and security (Halls 2015).
The market for Aswan fishDue to increasing demand, Egypt imports much more fish than it exports. In 2013, fish imports reached 235,851 t, whereas fish exports were only 20,452 t. The imports include low-value species such as frozen wild mackerel and farmed pangasius, as well as higher-value fish such as shrimp and salmon.
Most of the fish caught from Lake Nasser is sold fresh on ice, including species such as tilapia, Nile perch and catfish, while other species, such as tigerfish and raya (Alestes spp.), are sold salted. There is good market demand for salted fish in Upper Egypt.
At Eid, Easter and other occasions, traders rely on bringing fresh farmed fish from the Nile Delta to meet market demand and fill the gap caused by declining local supply. Consumers prefer this to imported frozen fish, which is viewed with distrust. Tilapia processing (mainly degutting and filleting) is an important business in Aswan. However, because tourist hotels and restaurants were the main market, demand for these products declined following the January 2011 revolution. Currently, processed tilapia and Nile perch are sold in local Aswan markets for home consumption. Additional information on the marketing of captured fish is provided in Table 11 (Section on Fish traders).

17
LAKE NASSER FISHERIES VALUE CHAIN MAPPING
Figure 6 summarizes the results of the value chain mapping and analysis, while further details are set out in subsequent sections.
While most of the fish (all the tilapia and Nile perch) is handled and traded as fresh fish, salted fish (muluha) is a product that is unique to Upper Egypt and comes mainly from Lake Nasser. It is important because the fishers can begin processing the fish in their remote camps on the lake. In addition, it is a stable product, which unlike fresh fish does not need to be chilled or transported on ice.
Muluha is made from tigerfish, raya (Alestes spp.), Nile carp (Labeo spp.) and other species that cannot be sold as fresh fish. This means that fishers can continue fishing and processing even when they are not being visited by carrier boats or cannot land their fresh fish to shore-based traders. The steps and actors involved in muluha processing are described in Table 4.
Processing starts in the fishing camp immediately after the fish has been landed. The first step is to open the belly cavity of large fish, remove the gut contents and wash. The fish are then sorted and graded before being placed on mats in layers with salt spread on each layer (20 kg salt per 100 kg fish) and covered with a blanket or mat to protect them from the sun. After 2–3 days, the moisture level in the fish has dropped and they are ready to be placed in plastic barrels, during which a further 10 kg of salt is added to each 100 kg of fish. After 5–7 days in barrels, the fish are repacked into tins (usually 20-liter cooking oil tins) and again 10 kg of salt is added to each 100 kg of fish. At this stage, 100 kg of fresh fish results in around 80 kg of salted fish.
The salted fish remain in tins for 15–20 days at ambient temperatures. During this time the fish is transported to the premises of one of the 50 muluha processing businesses based in Aswan. After arrival the fish is re-sorted and graded and the salt is replaced (around 3–5 kg salt for each 20 kg of fish). The final product from 100 kg of fresh fish is around 70 kg of salted fish (muluha), which the processors sell to traders in Aswan, in Upper Egypt, or in Cairo and the Nile delta.
LAKE NASSER FISHERIES VALUE CHAIN MAPPING
Employment creation in the fisheries value chainBecause the main focus of the YEAG project is on youth employment and creating jobs for youth, interviewers made special efforts to collect information on this topic during fieldwork. In addition to information on the number of people employed, interviewees were asked to provide the following information for each subsector of the value chain:
• whether employment is full-time, part-time or seasonal;
• the number of working days per year for part-time and seasonal workers;
• whether employees are men or women;• whether employees are over or under the
age of 30;• where labor comes from.
After information on employment was acquired, the data was analyzed and converted into FTE jobs, thereby enabling the generation of quantitative information on employment creation in the value chain (Table 5). From the interview responses about the number of days typically worked in the various subsectors, the following FTE estimates were obtained: 1 FTE = 300 days in fishing, fish processing and the intermediary subsector; and 1 FTE = 330 days in the wholesaling and retail trading subsectors.
The greatest number of jobs was in the fishing subsector at 18.1 FTE per 100 t of fish sold. This equates to 60% of FTE across the value chain, whereas wholesaler employment contributed only 5% of total FTE. Based on the FTE calculations, it is estimated that each 100 t of fish caught generates around 30 jobs in the value chain. More than 90% of fishers working in Lake Nasser are from Upper Egypt governorates (Fayoum, Sohag and Qena). Meanwhile, 50% of wholesalers and 65% of retailers are also from outside Aswan (Table 5). This indicates that the fisheries sector is an important source of job creation not just for Aswan but also for other governorates, including those of Upper Egypt.

18
LAKE NASSER FISHERIES VALUE CHAIN MAPPING
Fishers
Average fishing trip is 2.5 days; average catch is 20 kg/day; average sales price is EGP 6.3/kg (all species)
Quantities: Tilapia 76%; raya and tigerfish 13.6%; Nile perch, bayad and other 10.4%Employment: 18.1 FTE per 100 t of fish caught
Intermediaries• Sell 620 kg/day, average EGP 9.32/kg• Average sales value/year: EGP 1.744 million• Tilapia and Nile perch sold on ice• Raya and tigerfish sold salted in tins• 3.19 FTE per 100 t sold
Retailers• Sell 104 kg/day, average sales price: EGP 12.79/kg• Average sales value: EGP 438,573/year• Tilapia and Nile perch sold on ice for local consumers• Raya and tigerfish sold salted in tins• 7.08 FTE per 100 t sold
14% of fresh fish 26% of salted fish66.5% of fresh fish
Upper Egypt markets: 35% fresh fish, 50% salted fish and 24% processed fresh
El-Obour (Cairo) and other markets in Delta: 50% fresh fish, 24% salted fish and 9% processed fresh
Wholesalers• Sell 1730 kg/day, average EGP 10.4/kg• Average sales value/year: EGP 5.4 million• Tilapia and Nile perch sold on ice• Raya and tigerfish sold salted in tins• 1.63 FTE per 100 t sold
Fish processorsFresh fish processors: 98.4 t/year• Hold fish on average for 4–5 days• Average sales price: EGP 21/kg• Average sales: EGP 1.77 million/year• By volume degutted: fish 84%; fillet 16%• Product sold frozen• 5.7 FTE per 100 t
Salted fish processors: 71 t/year• Hold fish an average for 4–5 days• Average sales price: EGP 13.7/kg• Average sales: EGP 0.975 million/year• Raya and tigerfish represent 93%• Product sold in salt in tins or jars• 5.5 FTE per 100 t
Figure 6. Schematic chart for Lake Nasser fisheries value chain.

19
LAKE NASSER FISHERIES VALUE CHAIN MAPPINGStep Capture Initial curing Final curing RetailingBy whom Fishers Fishers Processors Retailers or
wholesalersInputs required
Fishing boats, nets, fuel, food, labor, fish (raya, tigerfish, labeos)
Salt, tins or containers for packing fish, food, fuel, labor, fish
Salted fish, salt, tins or containers for repacking fish, weighing balance, storeroom, transport, labor
Whole salted fish, fillets of salted fish
Details Average muluha fish catch/boat is 1,688 kg/year: 963 kg raya, 150 kg large tigerfish, 250 kg medium tigerfish and 325 kg small tigerfish
Activities carried out in fishing camps:• Sort and grade• Open gut and
clean• Use 40 kg salt
per 100 kg fish• Initial curing for
5–7 days• Later packed
into tins for transfer to fish processor
• 100 kg fresh fish produces 75–80 kg salted fish
Activities in the fish processing store:• Re-sort and grade• Add more salt
(3–5 kg/tin)• Final curing for
15–30 days
Average production per processor per year:• 25 t raya • 8.4 t large tigerfish • 12.6 t medium
tigerfish • 20 t small tigerfish • 2.5 t salted fish fillet
• 26% sold by retailers in Aswan
• 50% sold to wholesalers from Upper Egypt
• 24% sold to wholesalers in Cairo and Delta
Table 4. Salted fish processing.
Employment Jobs (FTE) per 100 t sold
Proportion of FTE across the value chain
Full-time jobs (% of FTE)
Youth (% less than 30 years old)
Source of labor
Aswan Other governorates
Fishers 18.1 60% 79% 57% 9% 91%Intermediaries 3.19 11% 78% 53% 47% 53%Wholesalers 1.63 5% 95% 59% 50% 50%Fish retailers 7.08 24% 97% 49% 35% 65%TOTAL 29.99 100%
Table 5. Employment creation in the Lake Nasser fisheries value chain.

20
LAKE NASSER FISHERIES VALUE CHAIN MAPPING
General information Aswan Garf Hussein Abu Simbel OverallNumber interviewed 55 51 56 162Average age of respondents 35 47 40 41% possessing a fishing license 82% 98% 70% 83%Number of licenses in operation 66 129 63 258Level of education attainedUniversity 2% 4% 4% 3%High school 27% 27% 23% 26%Primary school 11% 10% 11% 10%No education 60% 59% 63% 60%Years of experience in fishing 19
±1.429
±1.824
±1.724
Number of years fishing in the same location 15±1.4
17±1.7
15±1.7
16
% that are married 73% 92% 82% 82%Family size (individuals) 5.4
±0.35.1
±0.35.9
±0.55.5
Have another income source 13% 12% 5% 10%
Table 6. Characteristics of fishers interviewed in this study.
Across all subsectors, most work was full time (>79%), while in fish retailing and wholesaling, almost all employment was full time (97% and 95% respectively). The number of FTE days contributed by those under 30 years of age was 49%–59%, indicating that working in the fisheries value chain is an acceptable option for young men. All fishers interviewed were men, which was attributed to the remoteness of fishing grounds from harbors and poor living conditions in fishing camps. However, the study team met a few families who were living in the Lake Nasser area and also women who were not involved in the fishing sector. Job creation in fish processing activities is presented separately in Table 12, as only a limited percentage of catches undergoes processing. Fresh fish processing generates slightly more jobs compared to salted fish processing (5.7 and 5.5 FTE/100 t, respectively).
The 10-year average estimated by GAFRD for fish catches from Lake Nasser is 26,704 t, which results in total estimated employment
across the value chain of 8227 FTE, with 4785 FTE engaged directly in fishing. However, it is very likely that GAFRD figures are significantly underestimated because of underreporting of catches to avoid fish landing taxes, which also casts doubt on the total employment figure (Halls et al. 2015).
FishersThe characteristics of the fishers interviewed in this study are described in Table 6. Similar numbers of fishers were interviewed at each fish landing site. Most fishers were married (82%), were in possession of a fishing license (83%), and had no access to alternative sources of income (90%). The average number of family dependents was 5.5. The average time spent working in fishing was 24 years (ranging from 6 to 44 years) and the average time spent working at the same fishing location was 16 years, indicating a high level of stability within the sector.

21
LAKE NASSER FISHERIES VALUE CHAIN MAPPING
Table 7. Fishing nets and boats used by fishers in Lake Nasser.
Data on the four types of fishing nets and three types of boats used by fishers in the lake is presented in Table 7. Trammel nets (duk) were the most widely used for catching species for fresh fish sales; e.g. tilapia, Nile perch, bayad and large-sized catfish. These are reported to have higher catch rates compared with floating gill nets (Habib et al. 2014). Bottom gill nets (kobok) were used on a semipermanent basis, mostly set in the khors and sometimes in open waters. Fish caught by these nets include Nile perch, tilapia, benni and catfish. Floating gill nets (sakarota) were used to capture species destined for salting; i.e. raya (Alestes spp.) and tigerfish (Hydrocynus spp.). Long-line fishing methods were commonly used in deep waters to catch Nile perch (samoos) and bayad in the summer season (Habib et al. 2014).
Fishing boats were constructed from wood, metal or fiberglass. Wooden boats were the most common boat type in Aswan (52%) and Garf Hussein (45%), while in Abu Simbel, metal boats predominated (57%). Wooden boats are cheaper than fiberglass and metal boats, but they last for only 2 to 3 years. Metal boats are more durable than wood and fiberglass boats. Fiberglass boats are easy to clean but need higher maintenance to avoid damage by sunlight.
The average operational data for fishers at the three landing sites sampled is presented in Table 8. The data shows that the highest total catch per boat per year was in Abu Simbel and the lowest in Aswan, while the sale price for captured fish was highest in Garf Hussein and again lowest in Aswan. The highest FTE
Operational data Aswan Garf Hussein Abu Simbel OverallProportion of fishing gear used (as % of total)Trammel net (duk) 47% 28% 49% 39%Bottom gill net (kobok) 24% 25% 23% 24%Floating gill net (sakarota) 14% 24% 12% 18%Long line 15% 23% 16% 19%Proportion of fishing boats used (as % of total)Wooden 52% 45% 33% 44%Metal 14% 36% 57% 35%Fiberglass 34% 20% 10% 21%
generated per hundred metric tons (20.8) was recorded in Aswan, followed by Garf Hussein (18.4), while the lowest was in Abu Simbel (15.4 FTE/100 t). In all areas, tilapia made up the bulk of the catch (average 76%). However, in the Aswan area, a higher proportion of the total catch (57.6%) was small-sized tilapia (around 250 grams [g] average weight) compared with Garf Hussein and Abu Simbel (43.2% and 42.7% respectively). This is important, as it may explain the lower annual catch volume and sales price and higher FTE/100 t observed in Aswan and may indicate higher fishing pressure in this area.
Fish species for salting (raya and tigerfish) represented on average 13.5% of the total catch, while Nile perch and other species represented on average the remaining 10.6% of capture volume. The average sizes of different species of fish and size grades for selected species are presented in Appendix 1. The distribution of catch by species indicated that fishers were catching small-sized fish, which was previously not allowed and suggests that the lake may be under pressure from overfishing. Lake fisheries management bodies and fishers’ associations need to take action to improve fish stocks in the lake to maintain the fishery for future generations.
The operational data for fishers should be evaluated with data on the financial performance of the fishers interviewed (Table 9). The average fish sales revenue per boat was higher in Garf Hussein and Abu Simbel compared with Aswan. This was due to higher catches and sales prices in both Garf

22
LAKE NASSER FISHERIES VALUE CHAIN MAPPING
Hussein and Abu Simbel compared with Aswan. Despite lower average operating costs, average income above operating costs per boat was lower in Aswan than in both Garf Hussein and Abu Simbel, following the same trend as sales revenue per boat. Operating profit per boat as a percentage of sales ranged from 26% in Aswan to 44% in Abu Simbel. Fixed costs per boat were noticeably higher in Garf Hussein than Abu Simbel and lowest in Aswan. Income above total costs was similar in Garf Hussein and Abu Simbel, but lowest in Aswan. Net profit as a percentage of sales was noticeably lower in Aswan (5%) compared with the other two fishing areas (20%–21%), giving an average of 15%. Value added was calculated as revenue minus operational and fixed costs, excluding labor costs. Estimates of value added per metric ton were lowest in Aswan and highest in Garf Hussein, with an average of EGP 3148/t.
Fish traders The trading subsector consists of three distinct functions or roles: intermediaries, wholesalers and retailers. Intermediaries play an important role in the fish trade in Aswan. They own or manage carrier boats and collect fish from fishers to deliver to wholesalers in the landing harbors. With liberation of fish trade (Prime Minister Decree, 14 June 2001), intermediaries started to use pickup cars instead of carrier boats (Table 10). The advantage of cars is that they are faster than carrier boats and can collect fish from fishers around the lakeshore. Use of cell phones allows the intermediaries to arrange lakeside meetings with fishers and enables fish to be transported to wholesalers more quickly. This also means that fish is landed at locations where there is no system for recording catches or for collection of landing taxes.
Operational data Aswan Garf Hussein Abu Simbel OverallNumber interviewed 55 51 56 162Average yearly catch (kg/boat/year) 10,651
±34212,995
±41013,907
±34512,506
Average daily catch (kg/boat/day) 36±1.1
43±1.4
46±1.1
42
Average FTE/100 t 20.8±0.8
18.4±0.6
15.1±0.5
18.1
Average sales price (EGP/kg; all species) 5.4±0.2
7.2±0.3
6.2±0.2
6.3
Proportion of catch (as % of total)Large-sized tilapia* 17.6% 11.3% 22.1% 17.3%Medium-sized tilapia* 5.6% 9.5% 17.8% 11.6%Small-sized tilapia* 57.6% 43.2% 42.7% 47.1%Large-sized Nile perch 3.0% 4.6% 1.4% 2.9%Small-sized Nile perch 4.8% 5.0% 1.3% 3.5%Raya or Alestes spp. 5.8% 7.0% 9.7% 7.7%Large-sized tigerfish 0.5% 2.3% 0.7% 1.2%Medium-sized tigerfish 1.3% 3.4% 1.2% 2.0%Small-sized tigerfish 0.7% 5.7% 1.3% 2.6%Shieldhead catfish 1.2% 3.6% 0.9% 1.9%Catfish 1.6% 2.8% 0.6% 1.6%Bayad 0.2% 1.7% 0.1% 0.6%Other 0.1% 0.2% 0.1% 0.1%
* Tilapia size grades as reported by fishers: large size, greater than or around 1 kg average weight; medium size, around 0.5 kg average weight; small size, around or less than 250 g average weight.
Table 8. Operational data for the fishing subsector in Lake Nasser.

23
LAKE NASSER FISHERIES VALUE CHAIN MAPPINGFinancial performance data Aswan Garf Hussein Abu Simbel OverallFish sales (EGP/boat/year) 57,767
±2,50692,720±3,366
86,383±3,054
78,621
Operational cost (EGP/boat/year) 40,293±1,512
51,517±1,699
47,895±2,025
46,447
Income above operational cost (EGP/boat/year) 17,474±2,028
41,444±3,048
38,555±2,541
32,273
Average operational cost (EGP/t catch) 3,912±154
4,059±137
3,466±131
3,807
Average operational profit (EGP/t) 1,560±176
3,253±259
2,772±175
2,511
Average operational profit as % of sales 26% ±2.9
42%±2.2
44%±2
37%
Labor cost (EGP/t) 2,187±87
2,206±73
1,812±59
2,065
Fixed cost per boat (EGP/year) 12,264±970
20,977±1,581
18,831±929
17,269
Total cost per boat (EGP/year) 52,557±2,116
72,493±2,678
66,726±2,506
63,717
Income above total cost (EGP/boat/year) 5,209±1,872
20,468±2,859
19,724±2,766
15,004
Fixed cost per metric ton (EGP/t) 1,158±86
1,673±146
1,398±87
1,403
Average total cost (EGP/t catch) 5,071±154
5,732±137
4,865±131
5,210
Average net profit (EGP/t) 401±168
1,580±240
1,374±202
1,107
Net profit as % of sales 5%±3
20%±2.7
21%±2.7
15%
Average total value added (EGP/t) 2,588±144
3,786±242
3,186±184
3,172
Table 9. Financial performance of fishers interviewed in this study.
Table 10. Characteristics of intermediaries, wholesalers and retailers in Aswan.
General information Intermediaries Wholesalers Retailers OverallNumber interviewed (sample size) 8 5 10 23Average age of respondents 42 40 37 39.4Level of education attainedUniversity 25% 0% 0% 8.7%High school 37.5% 80% 60% 56.5%Primary school 37.5% 0% 0% 13%No formal education 0% 20% 40% 21.7%Average years of experience (years) 12.5 16.2 18 15.7Family informationProportion married 100% 100% 100% 100%Average family size (individuals) 5 5.8 4.7 5Proportion with other income source 12.5% 20% 0% 9%

24
LAKE NASSER FISHERIES VALUE CHAIN MAPPING
Wholesalers have land-based storage facilities and are able to sell fish in bulk outside Aswan (to El-Obour market in Cairo and other Upper Egypt governorates). They sell small quantities to retailers in Aswan according to retail market capacity. The number of registered wholesale traders in Aswan governorate is 23 (6 in Aswan harbor, 6 in Garf Hussein harbor and 11 in Abu Simbel).
Table 10 displays the general characteristics of business operators at the different trading stages. Most intermediaries and wholesalers had attained some level of education, whereas a high proportion of retailers had no formal education. Of those interviewed, retailers had the most experience in their jobs, followed by wholesalers, then intermediaries. All interviewees were married, with an average family size of 4–6 individuals. For retailers, fish sales were their only source of income, while middle and wholesaler traders had some additional sources of income (12% and 20%, respectively).
Prices of different fish species as they move through trader subsectors are listed in Appendix 2. Large Nile perch and large tigerfish were the highest-priced fish products from Lake Nasser (average sales price >EGP 24/kg) while the lowest-priced fish were small-sized tilapia, squeaker catfish, sharptooth catfish and raya. The retail price for tilapia fillets was EGP 49.3/kg, while the wholesale price for Nile perch fillets was EGP 60/kg.
Profit margins for retail sales of tigerfish appear to be higher than for all the other fish available in Lake Nasser. The average wholesale price was EGP 29/kg and average retail was price EGP 40/kg (Appendix 2).
The operational and financial performance results for the fish trading, wholesaling and retailing subsector of the value chain are displayed in Table 11. The individuals involved in this subsector play a pivotal role within the value chain, as they are involved in setting selling prices.
The average volume of fish sales was high for wholesalers (519 t/year) compared with intermediaries (187 t/year), and only 34 t/year for retailers. Similarly, the average sales value
per day for wholesalers was EGP 18,003, while for intermediaries it was EGP 5815 and for retailers EGP 1462. Tilapia sales prices indicated that wholesalers made around EGP 1/kg and retailers added more than EGP 2/kg to cover their expenses and generate income.
The financial performance data for each type of trader indicated that they were all making good profits from their businesses. The highest return on operating costs was for retailers, with an average of 25%, followed by an average of 22% for wholesalers, while intermediaries had the lowest return (13%). Average net profits as a percentage of sales were similar for wholesalers and retailers, but again lower for intermediaries.
The results show that based on FTE/100 t, the highest level of employment was in retailing (7.08 FTE/100 t), followed by intermediaries (3.19 FTE/100 t), but only 1.63 FTE/100 t within wholesaling. Labor costs per metric ton were highest for retailers and lowest for wholesalers, while fixed costs were highest for wholesalers and lowest for retailers. The results indicate that the highest value added per 100 t fish sold was in the retailer subsector, followed by wholesaling, and the lowest was within the intermediary subsector.
Fish processorsBasic information about fish processors is presented in Table 12. The total number of fish processors interviewed was 22, of which 14 were salted fish processors and 8 were fresh fish processors. The overall level of education among fresh fish processors was higher than among salted fish processors. The percentage of fresh fish processors attaining high and medium levels of education reached 75%, compared with 35% for salted fish processors. Also, the number of years in the business was higher for salted fish processors (21.7) than fresh fish processors (9.9). These observations reflect the traditional nature of salted fish processing, where sons are employed in the family business from a young age. By contrast, fresh fish processing is a newer business, offering more diverse opportunities, and may be attractive to well-educated individuals. Most fish processors did not have access to alternative sources of income other than their fish processing jobs. Almost all interviewed

25
LAKE NASSER FISHERIES VALUE CHAIN MAPPINGIntermediaries Wholesalers Retailers Overall
Number interviewed (sample size) 8 5 10 23Operational dataAverage annual sales volume (t/year) 187
±22519
±12134±7
-
Average daily sales volume (t/day) 0.62±0.07
1.73±0.4
0.104±0.02
-
Average FTE/100 t of sales 3.19±0.5
1.63±0.4
7.08±0.9
4.5
Average sales price (EGP/kg; all species) 9.32±0.4
10.40±0.6
12.79±0.7
-
Average daily sales value (EGP/day) 5,815±812
18,003±3,838
1,462±398
-
Financial performanceAverage annual sales value (EGP/year) 1,744,425
±243,6475,400,780
±1,151,466438,573
±119,3931,971,523
Average operating costs (EGP/year) 1,481,428±189,029
4,319,974±1,055,661
341,312±97,380
1,602,800
Average operating profit (EGP/year) 262,998±71,242
1,080,806±151,294
97,261±22,982
368,723
Average labor costs (EGP/t) 494±71
299±64
622±178
507
Average operating profit (EGP/t) 1,249±275
2,340±364
2,873±187
2,192
Average operating profit as % of sales 13%±2.6
22%±2.8
25%±2.2
20%
Average fixed costs (EGP/year) 39,256±5,966
64,450±17,292
10,059±1,951
32,038
Average net profit (EGP/year) 223,741±74,822
1,016,356±136,887
87,203±21,711
336,684
Average net profit (EGP/t) 1,009±314
2,214±363
2,565±191
1,948
Average net profit as % of sales 11%±3.1
21%±2.8
22%±2
18%
Average total value added (EGP/t) 1,503±254
2,513±406
3,187±235
2,455
Table 11. Operational and financial performance for intermediaries, wholesalers and retailers.

26
LAKE NASSER FISHERIES VALUE CHAIN MAPPING
individuals were married and had families consisting of an average of 5.4 and 7.5 members (fresh and salted fish processors respectively). However, approximately one-third of the processors had other sources of income; for example, some owned fishing boats and collected salted fish from their boats or fishers for processing.
Table 13 presents the average operational data for processors of fresh and salted fish in Aswan. Average sales volume per processor was higher for fresh fish compared to salted fish (98.4 and 70.9 t/year respectively). Basket prices of all fish were also higher for fresh fish (EGP 20.9/kg) compared to salted fish (EGP 13.6/kg). Fresh fish processing focused mainly on tilapia, which represented 97% of species processed. By contrast, Nile perch represented only 1.5% of the total volume (either fillets or degutted) of fresh fish processed. Most tilapia (81.8%) was processed as degutted, while tilapia fillets represented only 15% of processing volume. Salted fish processing focused mainly on raya (35%) and different size grades of tigerfish (58%).
The financial performance of fish processors in this study is presented in Table 14. The average value of sales was higher for fresh fish processors than for salted due to higher sales volume and price per kilogram (see Table 13). This contributed to higher overall operating costs. Average operating profit for fresh fish processors was also higher, but when labor costs per metric ton were included, the
average operating profit as a percentage of sales was lower than for salted fish producers. The average net profit as a percentage of sales and the average profit per metric ton were also lower for fresh fish producers due to the higher level of investment associated with these businesses (e.g. freezers and cold storage facilities).
Data summaryThis section maps the value chain and constructs models of costs and earnings for each link (or subsector) in the value chain, thus allowing comparison across various value chain subsectors. This comparison is laid out in Tables 15–17.
Changes in the average product price across the value chain are shown in Table 15. This includes the average sales price for each link in the value chain (i.e. the basket price). It is evident that prices increase at each node of the chain. This table also gives information on the percentage of final retail price achieved by each node in the value chain. The data indicates that fishers receive just below 50% of the final retail price.
The operational and net profits (per metric ton) at each link in the value chain are displayed in Table 16. Results show that the retailing subsector generated the highest operational and net profits (EGP/t of fish sold). In terms of percentage of return to own sales, fishers have the highest return on operation costs, followed
Table 12. Characteristics of fish processors interviewed in this study.
General information Salted fish processors
Fresh fish processors
Overall
Number interviewed (sample size) 14 8 22Average age of respondents 46 44 45Average years of experience in fish processing 21.7 9.9 17.4% married 92.9% 100% 95%Average family size (individuals) 7.5 5.4 6.7Existence of other income source 35.7% 25.0% 32%Maximum level of education attainedUniversity 7.1% 37.5% 18%High school 28.6% 37.5% 32%Primary school 28.6% 12.5% 23%No education 35.7% 12.5% 27%

27
LAKE NASSER FISHERIES VALUE CHAIN MAPPINGOperational data Salted fish
processorsFresh fish processors
Overall
Number interviewed (sample size) 14 8 22Average annual sales volume (t) 70.94
±1198.25
±2781
Average FTE/100 t 5.5±0.6
5.7±1.6
5.5
Average sales price (EGP/kg; all species) 13.6±0.7
20.9±3.6
16.3
Sales volume distribution by species and as % of totalTilapia fillet (kg) - 14,953
(15.2%)-
Nile perch fillet (kg) - 513 (0.5%)
-
Tilapia, large, degutted (kg) - 5,588 (5.8%)
-
Tilapia, medium, degutted (kg) - 13,650 (13.9%)
-
Tilapia, small, degutted (kg) - 61,125 (62.2%)
-
Nile perch, large, degutted (kg) - 375 (0.4%)
-
Nile perch, small, degutted (kg) - 600 (0.6%)
-
Squeaker catfish, degutted (kg) 1,071 (1.5%)
250 (0.3%)
-
Sharptooth catfish, degutted (kg) - 375 (0.4%)
-
Bayad, degutted (kg) - 825 (0.8%)
-
Squeaker catfish, salted (kg) 1,071 (1.5%)
- -
Raya or Alestes spp. (kg) 25,071 (35.3%)
- -
Tigerfish, large (kg) 8,411 (11.9%)
- -
Tigerfish, medium (kg) 12,643 (17.8%)
- -
Tigerfish, small (kg) 20,143 (28.4%)
- -
Salted fish, fillet (kg) 2,529 (3.6%)
- -
Note: Numbers in parentheses refer to % of total quantity of fish processed.
Table 13. Average operational data for the fish processing subsector of the fisheries value chain in Lake Nasser.

28
LAKE NASSER FISHERIES VALUE CHAIN MAPPING
Table 14. Financial performance of fish processors interviewed in this study.
Table 15. Gross output values (average prices) for the Lake Nasser fisheries value chain.
Financial performance Salted fish processors
Fresh fish processors
Overall
Average annual sales value (EGP) 975,046±164,388
1,766,025±305,132
1,262,677
Average operating costs (EGP) 788,288±105,105
1,526,789±264,343
1,056,834
Average operating costs (EGP/t) 11,112±634
15,539±2,686
13,820
Average operating profit (EGP/t) 2,091±558
3,028±1,054
2,432
Average operating profit as % of sales 15%±3
12.9%±2.6
14%
Average fixed costs per metric ton 151±24
324±110
214
Average net profit (EGP/t) 1,939±567
2,703±1,058
2,217
Average net profit as % of sales 13.8%±3.1
11.3%±2.9
13%
Average labor costs (EGP/t) 567±71
948±214
706
Average total value added (EGP/t) 2,507±538
3,652±1,036
2,923
Subsector Average price EGP/kg Price as % of retail priceFishers 6.29 49%Intermediaries 9.32 73%Wholesalers 10.40 81%Retailers 12.79 100%
Operational profit EGP/t % of own sales % of value chain net profit creationFishers 2,511 37.3% 28%Intermediaries 1,249 13.4% 14%Wholesalers 2,340 21.7% 26%Retailers 2,873 24.9% 32%Total 8,972 100%Net profit EGP/t % of own sales % of value chain net profit creationFishers 1,107 15.2% 16%Intermediaries 1,009 10.8% 15%Wholesalers 2,214 20.5% 32%Retailers 2,565 22.2% 37%Total 6,896 100%
Table 16. Operational and net profits created in the Lake Nasser fisheries value chain.

29
LAKE NASSER FISHERIES VALUE CHAIN MAPPINGby retailers. Net profit estimates show that retailers and wholesalers generated the highest return on investment.
Value added estimates indicated that retailers and fishers created the highest value added per metric ton (Table 17). Together these subsectors accounted for 61% of value added that was created through the chain. Wholesalers generated EGP 2513/t of value added, representing 24.2% of value added generated per metric ton.
Value-added processing activities within the Aswan fishery started some time ago with the salting of tigerfish and raya. Species of fish used for salting have no market fresh and are consumed only as salted products. Recently
processors started adding value to fresh fish such as tilapia and Nile perch by producing degutted fish and fillets to meet market demand for such products.
Benefits generated by the fish processing subsector are summarized in Table 18. Fresh fish processing generated slightly higher FTE/100 t compared with salted fish processing. Both labor costs and output value per metric ton were higher for fresh fish processing. Similarly, operational and net profits were higher in fresh fish processing. However, this data shows that fresh fish processing generates higher value added per ton (EGP 3652) compared with fish salting processing (EGP 2507/t) due to the high cost of labor in fresh fish processing.
Total value added EGP/t % of value chain value added creationFishers 3,172 30.6%Intermediaries 1,503 14.5%Wholesalers 2,513 24.2%Retailers 3,187 30.7%Total 10,375
Table 17. Total value added created in Aswan fisheries value chain.
Table 18. Fish processing summary.
Salted fish processors Fresh fish processors AllFTE/100 t 5.5 5.7 5.6Output value or basket price (EGP/t) 13,597 20,898 16,252Labor cost (EGP/t) 567 948 706Operational profit (EGP/t) 2,091 3,027 2,431Net profit (EGP/t) 1,939 2,703 2,217Value added (EGP/t) 2,507 3,652 2,923

30
ANALYSIS OF CRITICAL FACTORS AND CHALLENGES
Critical factor or problem Severity of problemInput problems Fuel availability and prices
Living requirements (bread and food)Health and social insurance Access to credit or financeAvailability and quality of fishing gearIce and saltAccess to fishing siteLicenses Handling boxes
HighHighHigh MediumMediumMediumMediumMedium Low
Capture problems Competition on fishing groundsPoor living conditions on the lakeLack of service to fishers on the lakeCurrent legislation does not protect the lakePredator consumption of fishLack of experience with new fishing methods
HighHighHighHighMedium/High Medium
Postharvest and marketing problems
Poor postharvest handling facilities Absence of a fish auction in Aswan Manipulation of fish pricesFluctuations in selling priceLack of export
HighHighMediumMediumMedium
Table 19. Summary of critical issues constraining the fisheries of Lake Nasser.
This section of the report outlines the major challenges facing the Lake Nasser fishery. The fishery is an important source of jobs both within local communities and for those coming from farther afield. Many households are dependent on the Lake Nasser fishery for their livelihoods, including the families of fishers, processors, traders, wholesalers and retailers. The businesses stemming from the fishery are profitable at each stage of the value chain, and across the value chain there is considerable value added. Based on the number of years of experience recorded for those working in each subsector of the value chain, it is also clear that in its current form the value chain is relatively stable.
However, it cannot be overstated that from a management perspective, the Lake Nasser fishery is in a fragile state. Most of the fish being caught at present are small sized, and total catches from the last year of official reporting (GAFRD 2013) are the lowest they have been in almost 10 years (18,716 t), indicating that overfishing in the lake is a serious problem.
The importance of the lake in terms of jobs, income and food security, coupled with the challenges and opportunities identified by the value chain analysis, calls for a change in attitudes by all stakeholders towards management of the Lake Nasser fishery. Effective enforcement of the existing regulations might cause hardship in the short term but is essential if the fishery is to provide employment and financial benefits for fishers, traders, processors and retailers in the future.
The structure used to outline the key challenges facing the Lake Nasser fishery in this section of the report is largely based upon the results of focus group discussions. These were held between members of the study team and board members of the various fishers’ associations from 18 to 20 January 2015. Attempts to identify solutions to these challenges are outlined in the subsequent sections of the report.
ANALYSIS OF CRITICAL FACTORS AND CHALLENGES

31
ANALYSIS OF CRITICAL FACTORS AND CHALLENGESSummary of critical factorsTable 19 summarizes the main issues identified through three focus discussion groups held with board members of fisheries cooperatives (Nubian, El Takamol, Nile River, “Between Dams” and Aswan Sons associations). The 50 board members who participated in the discussion groups represent actors across the value chain (fishers, traders and processors), are experts in their relevant fields, and were familiar with the various business operations across the value chain. These issues are then explored in more detail throughout the following subsections. Although many of the issues identified here are directly related to poor performance of value chain actors, it is evident that some issues relate to factors outside of the value chain, such as health and safety. It is interesting to note that during one of the focus group discussions, participants remarked that it was the first time they had ever been asked about the issues or challenges they were facing.
Input factorsFuel availability and pricesIn recent years, and especially in 2013 and 2014, it was difficult for fishers to buy fuel for fishing boats, carrier boats and small generators in fishing camps. Shortages of fuel supply at gas stations led to the development of a black market and an increase in prices. The high cost of fuel increased operational costs and reduced the number of fishing days and fish catches. Fishers suggested having a fuel quota for each boat to secure their operational needs.
Living requirements (bread and food)Because fishers stay in remote fishing camps most of the time, they need to buy bread and food in bulk to cover their needs for several days. In order to buy bread at subsidized prices, fishers need to stand in line for a long time. The fishers suggested having bread quotas issued through a card system for each boat.
Health, safety, wellbeing and social insuranceParticipants discussed concerns over their safety and wellbeing. Within fishing camps along the lakeshore, living standards were low, with poor housing or shelters and limited services. Service boats were in need of renovation, with only one currently in
service. Obtaining permission to renovate service boats was a problem due to ownership responsibilities.
Similarly, the majority (75%) of carrier boats were out of service due to difficulties in renewing licenses. Moreover, there is no medical or health, accidental death, pension, or social insurance scheme for the fishing community, and there is no compensation mechanism for boat owners in the case of boat damage or theft.
Regarding health and safety, the issue of scorpion stings was raised. The risk of being stung was high, but no antidote was available in remote camps. Within the lake, there was generally an absence of equipment for issuing distress signals in emergencies. Further, the lighting system within the lake was not well maintained and there was no navigation system for boats.
Concerns were expressed around the charge (one piaster per kg of captured fish) levied by the Ministry of Social Services through the fishers’ welfare association (Aquatic Union of Fisheries Cooperatives), for which no perceived benefit is received. Participants complained that this association has not worked or provided any services to fishers for a long time.
Capital and creditMembers of the fisheries associations mentioned that they had limited access to credit to use in their daily operations. There are typically no interactions between the formal banking sector and the fishing sector in Lake Nasser, since fishing is generally considered by the banks to be high risk. Another important factor affecting the ability to access funding is that most fishers working in the lake are not boat owners, and banks do not usually work with people who do not have licenses. Associations could play an important role in buying fishing nets and gear to supply to fishers on credit, but they have not done so for the last 15 years. A lot of work is needed to convince associations to take the responsibility of supporting fishers to buy nets and equipment in bulk at lower prices for the association members.
However, it should be noted that fishers, fish processors, fish traders and retailers generally appear to be able to finance their business
32
ANALYSIS OF CRITICAL FACTORS AND CHALLENGES
operations using their own capital, as they are able to generate cash flow soon after starting business. In terms of the financial impact on the value chain, this issue remains a relatively low priority. However, there is still a need for capital to finance upgrading of fishing gear, investing in newer processing and packaging technologies, and upgrading cold chain transportation of fish and fish products.
LaborThe lack of skilled labor was mentioned many times. Skilled fishers also migrate from Aswan towards Sudan, where fishing is more profitable. A number of focus group participants raised the issue of a lack of training among fishers in the use of long lines for catching large Nile perch. The issue of long working contracts for fish traders was also identified.
License renewalThe difficulty of renewing and obtaining licenses was raised during several focus group discussions. Most fishers are using small boats (less than 40-horsepower [hp] engine); licenses for larger boats such as carrier boats are issued by the Nile River Navigation Authority (NRNA). According to the NRNA, each carrier boat needs to have insurance for two workers before a license can be issued, whereas owners of carrier boats are reluctant to insure boat workers who are working on a casual basis. Fishers would like to simplify the process through carrier boat licensing by the Lake Management Authority or GAFRD (the same authorities that issue fishing licenses).
Other input-related issuesOther input-related issues for the Lake Nasser fishery raised during the focus group discussions included the following:
• The cost of ice is high and the ice is of poor quality; fishers ranked this as a medium-importance problem. Generally ice prices increase in the summer due to high demand for ice in hot weather. Also, fishers are not happy with the quality of ice available in Aswan.
• There is a lack of handling boxes (crates) in Aswan, and there is no supplier of expanded polystyrene foam boxes for use in fish transportation. The use of traditional boxes in fish handling is limited to traders,
while fishers use baskets made from palm fronds and cover the fish with a blanket to protect them from the sun. These materials do not insulate the fish from heat and are unhygienic, as they are difficult to clean. Also, these baskets may cause physical damage to fish, increasing the likelihood of contamination and spoilage.
Production factorsAbsence of security The lack of security in and around Lake Nasser was raised during discussions with all three focus groups, showing its importance. This leads to competition on fishing grounds, as unlicensed fishers compete with licensed fishers for the same areas. All fishers called for border security guards to control and prevent illegal fishers, the use of illegal fishing nets, electrofishing and fish smuggling. It was suggested that part of their enforcement role could be to park all fishing boats in harbors during the spawning season to prevent fishing at this time. Fishers would be allowed to return to the same place to resume activities after the spawning season. There was widespread belief that current legislation did not provide sufficient protection for fish resources, and participants called for the establishment of a special police force for the lake.
Poor living conditions and lack of services on the lakeFisheries association board members complained about poor living conditions in the fishing camps and a lack of services around the lake, as most fishers live in tents on islands within the lake. The only attempt to improve living conditions for fishers was by CARE in the 1970s, when they established houses along the lakeshore (Fraenkel 1981). However, water levels declined, and most of the houses are now too far away from the shore to be useful. Fishers are calling for the establishment of floating houses or tents, which could perhaps be carried out using donor funding. This funding could also include renovation of service boats to provide rescue services to fishers.
Overfishing and reduction in fish resourcesOverfishing in Lake Nasser was a major concern for participants. There were concerns about (i) the lack of enforcement by government authorities, (ii) the inaccessibility of various sites

33
Phot
o Cr
edit:
Ash
ley
Hal
ls/W
orld
Fish
A fishing camp on Lake Nasser.
33
ANALYSIS OF CRITICAL FACTORS AND CHALLENGESto law enforcement officials, (iii) electrofishing, and (iv) the smuggling of captured fish to Sudan. These factors have reportedly led to a depletion of fish stocks in some areas. Also, since 2011, there has been no enforcement of a closed period during the spawning season (usually from 15 April to 15 May) and a lack of restrictions on net mesh sizes (which would prevent catching tilapia of less than 500 g). These factors cause overfishing, indicated by the presence of large quantities of small tilapia (less than 250 g) in the catches.
There were concerns that crocodiles contribute to stock depletion through fish consumption (fishers estimated 30 kg of fish per crocodile per day). On the other hand, the official environmental organization, Egyptian Environmental Affairs Agency (EEAA), stated in a recent report that the contents of crocodiles’ stomachs weighed only 7 kg, including stones. According to EEAA, catching of crocodiles is not allowed in Lake Nasser. Egypt is a member of the Convention on International Trade in Endangered Species of Wild Fauna and Flora
(CITES). CITES lists crocodiles in Appendix 1. (Species listed in Appendix 1 are fully protected, and governments should not allow catching or selling of these species.)
Some fishers are calling for the conservation status of crocodiles to be moved from CITES Appendix 1, which requires full protection, to CITES Appendix 2, which they believe would allow hunting of crocodiles in Lake Nasser. However, a listing in CITES Appendix 2 would probably only allow the catching of crocodiles for cultivation or ranching. Furthermore, Egyptian environmental laws (4/1994 and 9/2009) forbid killing and capturing crocodiles, as well as transporting or trading them or their eggs.
Fishers also mentioned the problem of migratory birds feeding upon shoreline and shallow-water vegetation that serves as fish habitats, thereby negatively affecting fish stocks. The details of this problem were not explained (e.g. types of birds, seasons and vegetation affected).
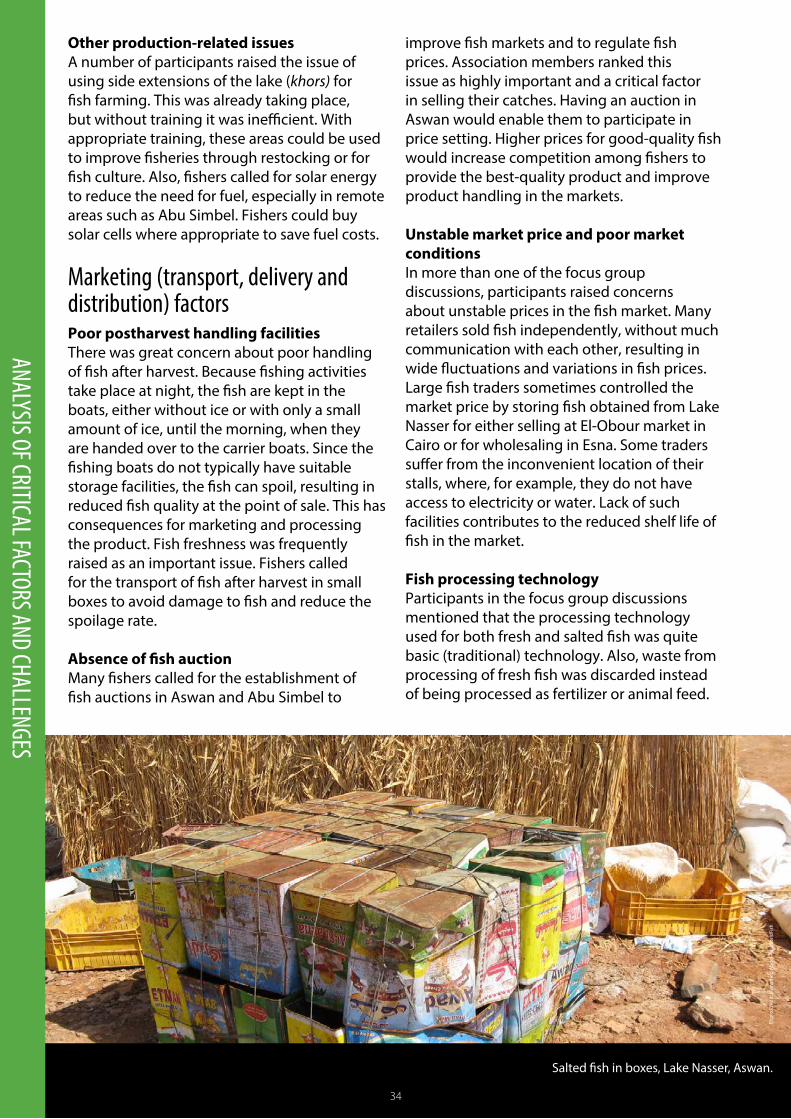
34
Phot
o Cr
edit:
Moh
amed
Abd
el-A
al/W
orld
Fish
Salted fish in boxes, Lake Nasser, Aswan.
34
ANALYSIS OF CRITICAL FACTORS AND CHALLENGES
Other production-related issuesA number of participants raised the issue of using side extensions of the lake (khors) for fish farming. This was already taking place, but without training it was inefficient. With appropriate training, these areas could be used to improve fisheries through restocking or for fish culture. Also, fishers called for solar energy to reduce the need for fuel, especially in remote areas such as Abu Simbel. Fishers could buy solar cells where appropriate to save fuel costs.
Marketing (transport, delivery and distribution) factorsPoor postharvest handling facilitiesThere was great concern about poor handling of fish after harvest. Because fishing activities take place at night, the fish are kept in the boats, either without ice or with only a small amount of ice, until the morning, when they are handed over to the carrier boats. Since the fishing boats do not typically have suitable storage facilities, the fish can spoil, resulting in reduced fish quality at the point of sale. This has consequences for marketing and processing the product. Fish freshness was frequently raised as an important issue. Fishers called for the transport of fish after harvest in small boxes to avoid damage to fish and reduce the spoilage rate.
Absence of fish auction Many fishers called for the establishment of fish auctions in Aswan and Abu Simbel to
improve fish markets and to regulate fish prices. Association members ranked this issue as highly important and a critical factor in selling their catches. Having an auction in Aswan would enable them to participate in price setting. Higher prices for good-quality fish would increase competition among fishers to provide the best-quality product and improve product handling in the markets.
Unstable market price and poor market conditions In more than one of the focus group discussions, participants raised concerns about unstable prices in the fish market. Many retailers sold fish independently, without much communication with each other, resulting in wide fluctuations and variations in fish prices. Large fish traders sometimes controlled the market price by storing fish obtained from Lake Nasser for either selling at El-Obour market in Cairo or for wholesaling in Esna. Some traders suffer from the inconvenient location of their stalls, where, for example, they do not have access to electricity or water. Lack of such facilities contributes to the reduced shelf life of fish in the market.
Fish processing technologyParticipants in the focus group discussions mentioned that the processing technology used for both fresh and salted fish was quite basic (traditional) technology. Also, waste from processing of fresh fish was discarded instead of being processed as fertilizer or animal feed.
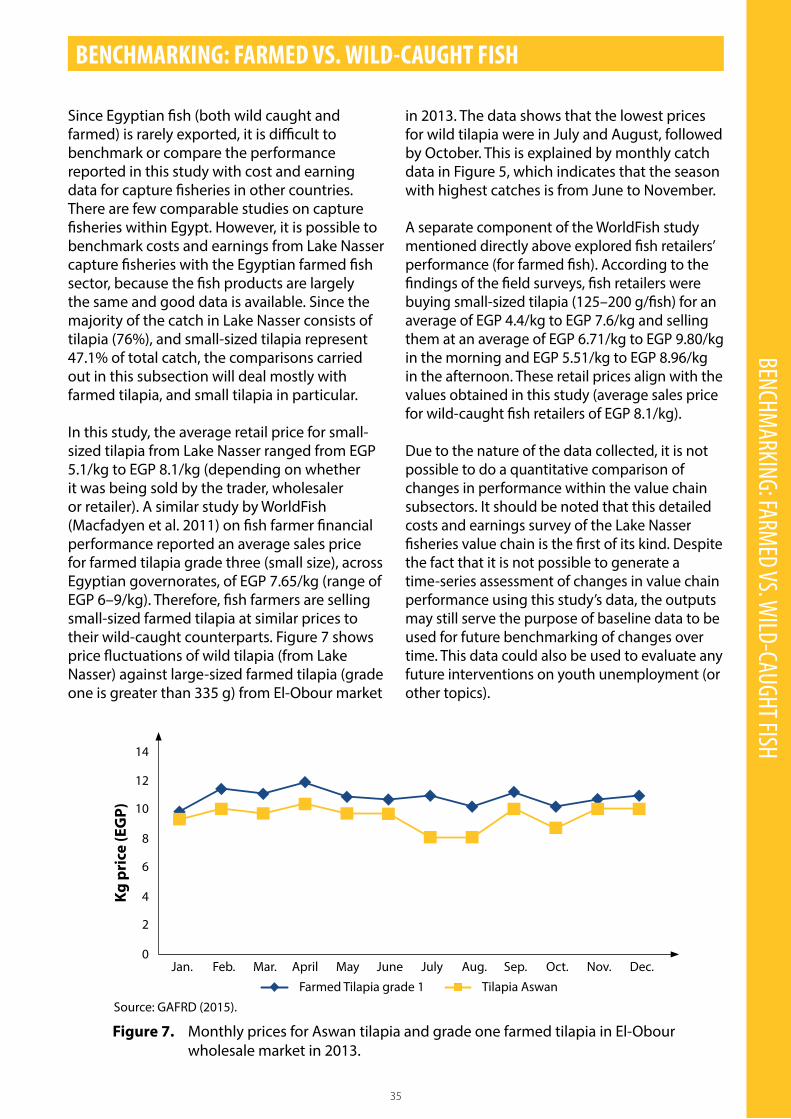
35
BENCHMARKING: FARMED VS. W
ILD-CAUGHT FISHBENCHMARKING: FARMED VS. WILD-CAUGHT FISH
Since Egyptian fish (both wild caught and farmed) is rarely exported, it is difficult to benchmark or compare the performance reported in this study with cost and earning data for capture fisheries in other countries. There are few comparable studies on capture fisheries within Egypt. However, it is possible to benchmark costs and earnings from Lake Nasser capture fisheries with the Egyptian farmed fish sector, because the fish products are largely the same and good data is available. Since the majority of the catch in Lake Nasser consists of tilapia (76%), and small-sized tilapia represent 47.1% of total catch, the comparisons carried out in this subsection will deal mostly with farmed tilapia, and small tilapia in particular.
In this study, the average retail price for small-sized tilapia from Lake Nasser ranged from EGP 5.1/kg to EGP 8.1/kg (depending on whether it was being sold by the trader, wholesaler or retailer). A similar study by WorldFish (Macfadyen et al. 2011) on fish farmer financial performance reported an average sales price for farmed tilapia grade three (small size), across Egyptian governorates, of EGP 7.65/kg (range of EGP 6–9/kg). Therefore, fish farmers are selling small-sized farmed tilapia at similar prices to their wild-caught counterparts. Figure 7 shows price fluctuations of wild tilapia (from Lake Nasser) against large-sized farmed tilapia (grade one is greater than 335 g) from El-Obour market
in 2013. The data shows that the lowest prices for wild tilapia were in July and August, followed by October. This is explained by monthly catch data in Figure 5, which indicates that the season with highest catches is from June to November.
A separate component of the WorldFish study mentioned directly above explored fish retailers’ performance (for farmed fish). According to the findings of the field surveys, fish retailers were buying small-sized tilapia (125–200 g/fish) for an average of EGP 4.4/kg to EGP 7.6/kg and selling them at an average of EGP 6.71/kg to EGP 9.80/kg in the morning and EGP 5.51/kg to EGP 8.96/kg in the afternoon. These retail prices align with the values obtained in this study (average sales price for wild-caught fish retailers of EGP 8.1/kg).
Due to the nature of the data collected, it is not possible to do a quantitative comparison of changes in performance within the value chain subsectors. It should be noted that this detailed costs and earnings survey of the Lake Nasser fisheries value chain is the first of its kind. Despite the fact that it is not possible to generate a time-series assessment of changes in value chain performance using this study’s data, the outputs may still serve the purpose of baseline data to be used for future benchmarking of changes over time. This data could also be used to evaluate any future interventions on youth unemployment (or other topics).
Kg p
rice
(EG
P)
14
6
10
4
12
8
2
0Jan. MayMar. July Sep.Feb. JuneApril Aug. Oct. Nov. Dec.
Figure 7. Monthly prices for Aswan tilapia and grade one farmed tilapia in El-Obour wholesale market in 2013.
Farmed Tilapia grade 1 Tilapia Aswan
Source: GAFRD (2015).

36
RECOMM
ENDATIONS
RECOMMENDATIONS
This section of the report includes a number of recommendations to support the fisheries sector of Lake Nasser. Recommendations include policy changes and suggestions to modify the current institutional arrangements. These recommendations are largely based on the issues identified in the report. For effective implementation of the recommendations, it will be necessary for the various stakeholders to take ownership of the relevant items. This could be done by holding stakeholder workshops to bring together all actors (including GAFRD, HDLDA and the fisheries organizations such as cooperatives and Misr Aswan) to discuss the issues facing the sector and identify solutions.
Recommendations to address input factorsEstablishing general associations to improve access to fishing gear and fishing licensesA number of people (including the Aquatic Union of Fisheries Cooperatives and many fishers) have recommended that new service organizations (provisionally called general associations) be created. These organizations would have wider representation and a wider, more commercial remit compared to the current fisheries organizations and cooperatives, which are limited to not-for-profit activities and only represent fishers. The general associations would be responsible for providing inputs (such as nets) and help with fish marketing and getting licenses. They could also provide the necessary equipment to fishers, such as handling boxes and maybe even fish-salting equipment, where appropriate and feasible. They could be involved in manufacturing or distributing legal-sized nets at affordable prices.
On the issue of fishing cards and boat licenses, one solution would be to put in place an agreement with GAFRD allowing the fisheries organizations (cooperatives and Misr Aswan) to issue licenses. A second action would be to allow GAFRD to issue licenses for carrier boats, without dealing with the NRNA. The current size of the boats used (40-hp motor) is typically within the range permitted to obtain a license directly from GAFRD.
Training fishers to build skills and knowledgeFishers told the study team that they are in need of training in new fishing methods; e.g. instructions on the use of long lines to catch high-value species such as large Nile perch. Other training topics identified during the study were improved fish handling, and fish processing technologies. Where possible, the training courses or programs should be more practical, since previous training has been theoretical. In the short term, the YEAG project will deliver training to fishers to improve their income from fishing. But longer term there is a need to ensure continuation of capacity development of fishers and to improve their awareness of fisheries management. Donors and governmental organizations have to take the lead in these activities to improve the working environment for fishers.
Access to affordable bread and fuelThe high cost of bread and fuel creates tough living conditions for many fishers. It is recommended that a bread oven be built in each association. These bread ovens would sell bread at an affordable price, ensuring continuous supplies for the fishing communities. The HDLDA could take the lead on this by getting permission from the Ministry of Supply to allow the establishment of bread ovens in each of the fishing harbors. Introducing a system of fuel cards per boat (based on a quota) could provide fairer distribution of fuel and could be done in conjunction with the association and Aswan governorate administration.
Ending the monopoly on ice production Fishers complained that there has been a monopoly in ice production and trade in Aswan in recent years. For instance, one producer has hired two ice plants from the Misr Aswan Company since 2007. The same producer has two other plants in Aswan city and the Allaqi area. Associations are calling for permission to hire these ice plants or to establish new ones for each association, thus securing the supply of ice for their members. The monopoly has led to increasing prices for ice blocks and declining quality.

37
RECOMM
ENDATIONSTraining hatchery owners to improve the quality and availability of tilapia seedThe efficiency of tilapia hatcheries needs to improve to provide sufficient quantities of high-quality seed for lake restocking purposes. This can be done by the lake management through delivering technical support to khor owners to spawn tilapia in their khors. Owners should be trained in best management practices on tilapia spawning and release of fingerlings to the lake. A best management practice manual developed by WorldFish Egypt could be used as the guideline for this training.
Recommendations to address production factorsMinimizing or eliminating depletion of fish resourcesIn order to overcome overfishing in the lake and allow for fish stock recovery, the authorities should enforce closed fishing seasons. Security on and around the lake also needs to be improved, which may require the deployment of dedicated police personnel. If possible, border security guards should be tasked with catching illegal fishers. In addition, current legislation needs to be modified to specify legal and illegal fishing gears and to provide greater protection for fish resources. Although the fishers are interested in reducing the numbers of crocodiles and migratory birds, this does not fit with the policies of EEAA.
Improvement of fish stocks is an important issue for securing existing jobs in the sector. Results presented in Table 8 showed that 47% of tilapia catch is under the legal catch size. Such fishing practices represent a real threat to fish stocks in the lake. Using a community-based management approach should create a high level of awareness among stakeholders about the current situation in the lake and was one of the solutions recommended by Halls (2015) to rebuild fish stocks in the lake.
Improving health, safety and wellbeing of fishersThe living standards within the fishing camps in the lake need to be improved as a matter of priority. Lake-based boats providing basic services for fishers should be considered. To increase the number of carrier boats, the carrier boat licensing procedure should be revised and
GAFRD should be allowed to grant permission to renovate carrier boats (this has also been discussed under input factors).
To minimize the risk of serious health consequences from scorpion stings, anti-venom should be distributed through the associations. Fishers should receive appropriate training to deliver first aid to victims until they can reach medical centers to get the appropriate treatment and medical care. This could be done through HDLDA in collaboration with the YEAG project.
One of the benefits of fisheries organization membership should be that the fishers are provided with social insurance. However, there is no provision for pensions, healthcare or accidental damage support. In practice, none of these systems is working, not even the social insurance. Health services used to be provided by a service boat (provided under a previous project by CARE) but this was sold. The responsibilities of the various organizations involved in the fishery need to be reviewed to provide some level of social and insurance protection, particularly for fishers working in a very vulnerable situation.
Safety equipment within the lakeAn agreement should be reached with the border guards to allow the use of wireless equipment in emergency situations. In order to provide a lighting and navigation system in the lake, the use of solar cells can be investigated. The use of solar energy is particularly pertinent in Abu Simbel. Options should be explored to minimize or prevent theft of equipment. The fisheries organizations (cooperatives and Misr Aswan) should take the lead on calling for the development of security systems for fishers in the lake.
Recommendations to address marketing factors (transport, delivery and distribution)Reducing fluctuations in pricesA fish auction should be established in both Aswan and Abu Simbel to regulate fish prices. To limit the effect of large fish traders controlling market prices, fishers should sell fish through associations, thereby restricting the power of the wholesalers. Some wholesalers
38
RECOMM
ENDATIONS
have established fish stores to hold fish until prices increase or until they distribute to markets in Upper Egypt or El-Obour. Diversification of market outlets would also improve marketing. This could be achieved by working with Misr Aswan or selling directly to retailers and restaurants in Aswan. The fisheries organizations should take the lead on this point by asking the governor to allocate land to establish wholesale fish markets.
Improving the health and hygiene conditions in trader marketsFish market auctions or collection centers should be located in a central area that is clean and well connected to major public transportation routes. Water and electricity access should be provided. This is particularly important in the case of Kom Ombo fish traders. This recommendation should be discussed by the project team with the local authority in Aswan.
Improvements to postharvest fish handling, storage and transportationTo reduce fish spoilage, fishers should be provided with ice and iceboxes. Fish should also be handled using small boxes to avoid damage to fish. The movement of fish between fishing sites and carrier boats should be improved. If fishing is known to occur at night, fishers should use ice and appropriate arrangements should be made to supply carrier boats at this time. The YEAG project should demonstrate to the fisheries organizations the importance of good handling practices in maintaining fish quality to obtain higher selling prices.
Investigation into appropriate methods of processing for value additionTo modernize the traditional methods of fish processing currently in use, training should be provided on processing of both fresh and salted fish. The conversion of fish waste into fishmeal should be promoted. Improved fish processing should start with best practices for fish handling after capture. Salted fish processing starts directly after capture in fishers’ camps. Current practices for salted fish processing in camps are basic and need further development to improve product quality and reduce waste. The YEAG project should provide technical support and training to fish processors to improve practices.
Recommendations to support employment creationIf action is taken on the recommendations outlined above, this in itself should safeguard the existing level of employment provided by the sector. This value chain analysis demonstrates the financial viability and profitability of the fisheries in Lake Nasser (from fishing to processing to retailing). Quantitative data shows that the sector generates a large number of jobs, both directly and indirectly. However, overexploitation of fish stocks in Lake Nasser is leading to smaller and fewer fish, as well as declining revenues at each link in the value chain.
The number of jobs created by the sector can be increased through a number of methods. First, minimizing or eliminating overfishing would allow catch levels to rebound after a short lag period. This would directly translate into more jobs (i.e. the highest level of employment in this value chain is in the fishing subsection and the proxy used for jobs was number of jobs per metric ton of fish caught). The number of jobs to be created can be estimated using the calculations summarised in Table 5 of this report. Fishing is carried out exclusively by men in remote fishing camps, as is wholesaling and trading at present.
Second, improvements to postharvest handling procedures, and particularly the hygiene conditions during transport and sale of fish, would improve quality and reduce waste. In turn, this would lead to greater employment through increased demand for fish.
Finally, even if catch levels were to remain unchanged, the development of postharvest processing could create more jobs. Although processing is currently limited to salting and a limited amount of filleting and degutting, there is potential for this to increase and to employ more women and youth. The first step is to understand the market conditions, including investigating the existing level of demand for various processed products and determining whether it is feasible for fish processors to meet this demand. The next step is to examine what steps would be needed to incentivize processors (by providing finance and stimulating market demand) to take up new activities.

39
REFERENCES Béné C, Abban EK, Abdel-Rahman SH, Ayyappan S, Brummett R, Dankwa HR, Das AK, Habib OA, Katiha PK, Kolding Jet al. 2009. Improved fisheries productivity and management in tropical reservoirs. CPWF Project Number 34. CGIAR Challenge Program on Water and Food Project Report series. Retrieved from www.waterandfood.org
[CAPMAS] Central Agency for Public Mobilization and Statistics Egypt. 2014. Egypt in figures. Retrieved from http://www.capmas.gov.eg/indicators
[CITES] Convention on International Trade in Endangered Species of Wild Fauna and Flora. 2015. Appendices I, II and III. Geneva, Switzerland: International Environment House. Retrieved from https://cites.org/sites/default/files/eng/.../E-Appendices-2015-02-05.pdf
Fraenkel R. 1981. Evaluation and social analysis of the CARE-Egypt project: Integrated basic services & fishermens’ shelters and afforestation/agriculture activities. PD-ABA-458. United States Agency for International Development. Retrieved from http://pdf.usaid.gov/pdf_docs/PDABA458.pdf
[GAFRD] General Authority for Fishery Resources Development. 2015. Fish Statistics Yearbook for 2013. Ministry of Agriculture and Land Reclamation, Egypt.
Habib OA, Nasr-Allah AM and Dickson M. 2014. Fisheries situation analysis in Aswan. Youth Employment in Aswan Governorate Project Report.
Halls AS. 2015. Lake Nasser fisheries: Recommendations for management, including monitoring and stock assessment. Penang, Malaysia: WorldFish. Program Report: 2015-40.
Halls AS, Habib OA, Nasr-Allah A and Dickson M. 2015. Lake Nasser fisheries: Literature review and situation analysis. Penang, Malaysia: WorldFish. Program Report: 2015-42.
Kaplinsky R and Morris M. 2001. A Handbook for Value Chain Research. Brighton: University of Sussex, Institute for Development Studies.
Law (Act) No. 124 of 1983. Fishing, Aquatic Life and Aquaculture in Egypt.
Law No. 4 of 1994, amended by Law No. 9 of 2009. The Environment Law, Egypt.
Macfadyen G, Nasr Allah A, Kenawy D, Mohamed F, Hebicha H, Diab A, Hussein S, Abouzied R and El-Naggar G. 2011. Value chain analysis of Egyptian aquaculture. Penang, Malaysia: WorldFish. Project Report: 2011-54.
Ministerial Decree No. 621 of 1981. Housing and Construction Minister Allocates Fishing Zones between Cooperatives in Lake Nasser.
Ministerial Decree No. 45 of 1985, amending Decree No. 621 of 1981. Housing and Construction Minister Amends Cooperatives’ Fishing Zones between Cooperatives in Lake Nasser.
Ministerial Decree No. 303 of 1987. Executive Regulations for the Law of Fishing and Aquaculture and Regulation of Fish Farms.
Porter M. 1985. Competitive Advantage: Creating and Sustaining Superior Performance. New York: The Free Press.
REFERENCES

40
REFERENCES
Resolution No. 190 of 1983. Establishing the Public Authority for Fisheries Resources Development. Published in Official Gazette No. 23, 9 June 1983.
van Zwieten PAM, Béné C, Kolding J, Brummett R and Valbo-Jørgensen J. 2011. Review of tropical reservoirs and their fisheries – The cases of Lake Nasser, Lake Volta and Indo-Gangetic Basin reservoirs. FAO Fisheries and Aquaculture Technical Paper No. 557. Rome: FAO.

41
ANNEX 1ANNEX 1 AVERAGE SIZE AND SALES PRICE OF FISH REPORTED BY FISHERS Fish species and grade Average fish size at capture (g)
Aswan Garf Hussein Abu Simbel OverallTilapia – large 1,143 1,057 1,313 1,173Tilapia – medium 472 507 594 536Tilapia – small 232 228 268 243Nile perch – large 1,848 3,134 2,682 2,696Nile perch – small 348 432 507 420Raya or Alestes spp. 222 352 207 306Tigerfish – large 1,585 1,138 1,313 1,209Tigerfish – medium 306 469 533 463Tigerfish – small 192 228 150 221Squeaker catfish 1,208 848 940 895Sharptooth catfish 1,571 2,724 1,275 2,472Bayad 1,500 2,676 2,000 2,595Fish species and grade Average sales price (EGP/kg)
Aswan Garf Hussein Abu Simbel OverallTilapia – large 10.1 12.0 10.4 10.8Tilapia – medium 5.5 6.9 6.5 6.6Tilapia – small 3.1 3.8 3.3 3.4Nile perch – large 19.9 18.7 19.5 19.2Nile perch – small 7.2 9.5 9.7 8.9Raya or Alestes spp. 4.5 6.0 5.6 5.6Tigerfish – large 22.8 24.8 23.5 24.3Tigerfish – medium 8.5 11.4 13.1 11.2Tigerfish – small 3.3 6.2 5.0 5.7Squeaker catfish 2.7 2.4 3.0 2.5Sharptooth catfish 3.0 2.1 2.8 2.3Bayad 7.4 8.1 3.0 7.8Other 8.7 1.3 0.0 2.7

42
ANNEX 2 AVERAGE SALES PRICE FOR FISH AT THE THREE TRADING NODES
ANNEX 2
Fish species and grade Average sales price (EGP/kg)Intermediaries Wholesalers Retailers
Tilapia – large 13.6 14.3 16.1Tilapia – medium 8.6 8.9 10.6Tilapia – small 5.1 6.1 8.1Nile perch – large 24.6 25.5 28.5Nile perch – small 12.0 12.3 12.9Raya or Alestes spp. 5.8 7.0 7.7Tigerfish – large 24.0 29.3 40.0Tigerfish – medium - 10.0 15.0Tigerfish – small - 5.0 10.0Squeaker catfish 5.0 5.6 8.6Sharptooth catfish 5.1 5.5 7.5Bayad 13.9 15.0 18.0Tilapia fillet - - 49.3Nile perch fillet - 60.0 -Salted fish fillet - - -

43
ANNEX 3ANNEX 3 AVERAGE SALES PRICE FOR FISH PRODUCED BY PROCESSORS
Fish species, grade and product form Sales price by species (EGP/kg)Fresh Salted
Tilapia fillet (kg) 49 -Nile perch fillet (kg) 61 -Tilapia – large degutted (kg) 20 -Tilapia – medium degutted (kg) 16 -Tilapia – small degutted (kg) 11 -Nile perch – small degutted (kg) 21 -Raya or Alestes spp. (kg) - 10Tigerfish – large (kg) - 28Tigerfish – medium (kg) - 15Tigerfish – small (kg) - 8Squeaker catfish degutted (kg) 8 10Sharptooth catfish degutted (kg) 8 -Bayad degutted (kg) 21 -Salted fish fillet (kg) - 40Salted fish fillet - -

This publication should be cited as: Nasr-Allah AM, Habib OA, Dickson M and Dickson C. 2016. Value chain analysis of Lake Nasser fisheries in Aswan, Upper Egypt. Penang, Malaysia: WorldFish. Program Report: 2016-11.
© 2016. WorldFish. All rights reserved. This publication may be reproduced without the permission of, but with acknowledgment to, WorldFish.
Paper made fromrecycled material
100% RECYCLED
Contact Details:WorldFish, PO Box 500 GPO,10670 Penang, MALAYSIAwww.worldfishcenter.org
Photo credits: Front and back cover, Mohamed Abdel-Aal/WorldFish


