1 Value Chain Dynamics: Business and Supply Chain Strategy in a Fast-Clockspeed World Excerpts from: Clockspeed Professor Charles Fine Massachusetts Institute of Technology Sloan School of Management Cambridge, Massachusetts 02142 September 2010 http://web.mit.edu/ctpid/www/people/Fine.html
Transcript
1
Value Chain Dynamics: Business and Supply Chain
Strategyin a Fast-Clockspeed World
Excerpts from: Clockspeed
Professor Charles FineMassachusetts Institute of Technology
Sloan School of ManagementCambridge, Massachusetts 02142
September 2010
http://web.mit.edu/ctpid/www/people/Fine.html
2
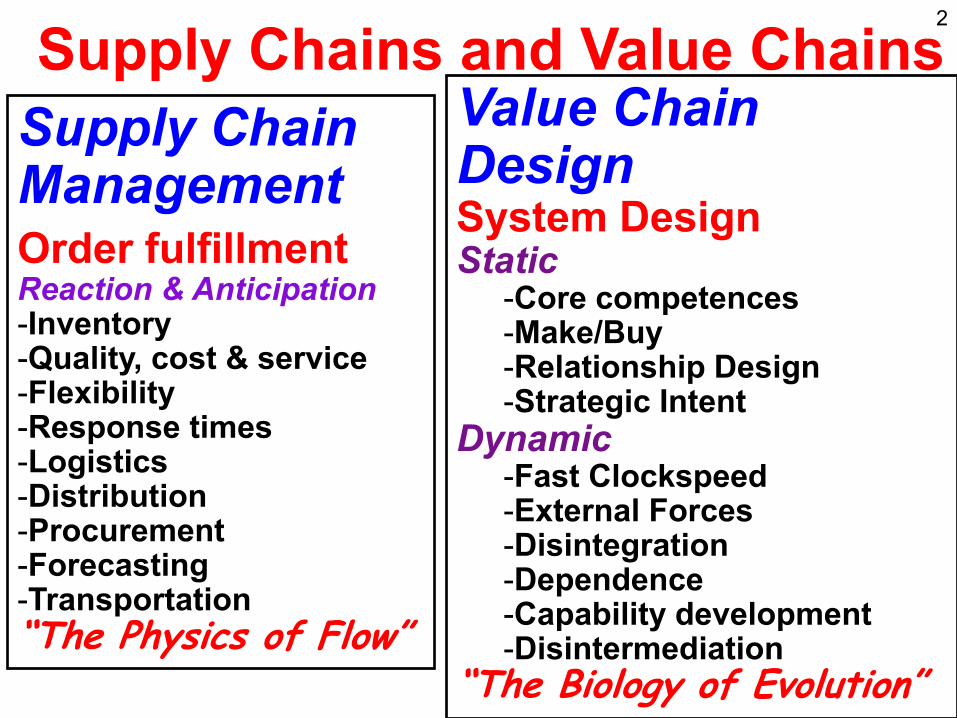
Supply Chains and Value ChainsSupply ChainManagementOrder fulfillment Reaction & Anticipation -Inventory -Quality, cost & service -Flexibility -Response times -Logistics -Distribution -Procurement -Forecasting -Transportation´7KH�3K\VLFV�RI�)ORZµ
Product Attrractive Food Luxury Convenience Premium Fast Entertainment Personalized Social Network Environemntal Predictable Value Value Third Place Value
Invest in Process Ass'y Line Std proc e-centric people heavily std Chef pdtn control Selection customer dep't some proc stds foolproof labor/cap efficient Training
Ladies & Gents
Supply/Va l Chain Japanese mat'ls investors Cars environmental partners
Japanese labor labor IT fair trade innov source Basic ingredients
Marketing Exotic and Safe Luxury Convenience Premium Fast Fun Personalized Social Network Environemntal Predictable
13 What Drives Clockspeeds? technology/innovation push, customer pull,
system complexity, and regulation
Handset or PC Applications
Communications Equipment
and Networks
Semiconductor Components
Handset or PC Platforms
Semiconductor Manufacturing
Equipment
Consumer
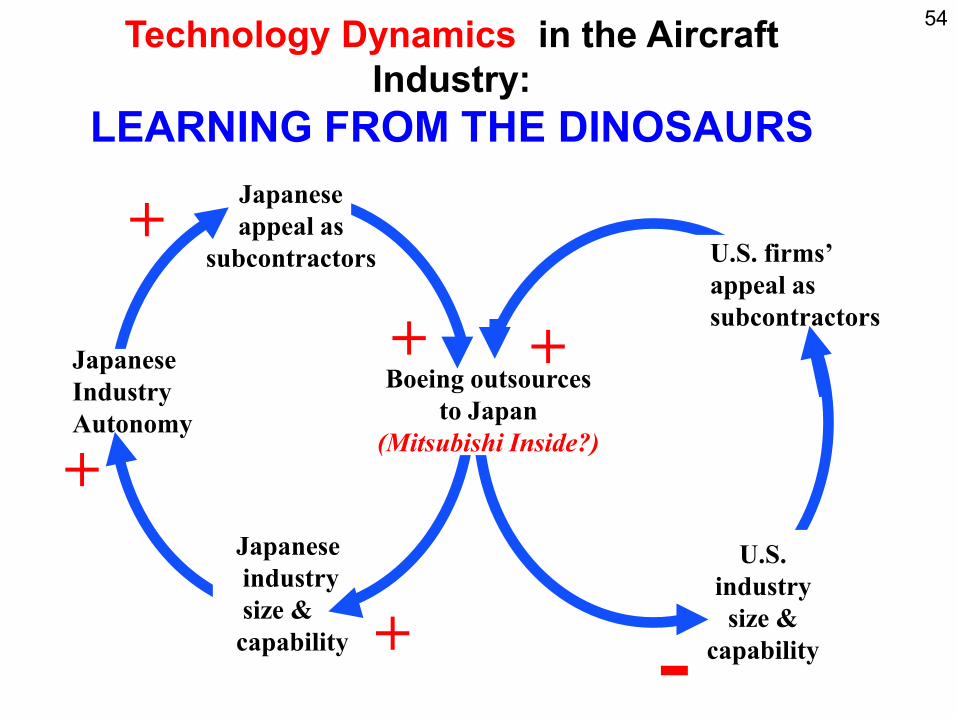
14 ALL COMPETITIVE ADVANTAGE IS TEMPORARY
Autos: Ford in 1920, GM in 1955, Toyota in 2000 Computing: IBM in 1970, Wintel in 1990, Apple in 2010 World Dominion: Greece in 500 BC, Rome in 100AD, G.B. in 1800 Sports: Red Sox in 2007, Celtics in 2008, Yankees in 2009
The faster the clockspeed, the shorter the reign
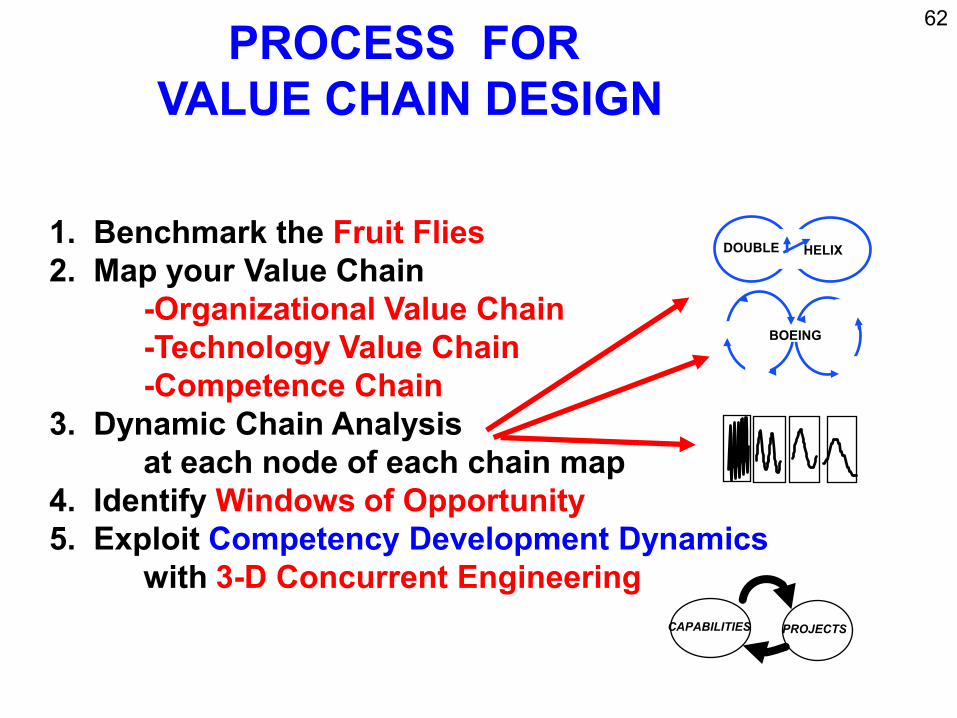
Value Chain Evolution in a Fast-Clockspeed World: 15
Study the Industry Fruitflies
Evolution in the natural world: FRUITFLIES
evolve faster than MAMMALS
evolve faster than REPTILES
THE KEY TOOL:
Cross-SPECIES Benchmarkingof Dynamic Forces
Evolution in the industrial world: INFOTAINMENT is faster than MICROCHIPS is faster than AUTOS evolve faster than AIRCRAFT evolve faster than MINERAL EXTRACTION
THE KEY TOOL: Cross-INDUSTRY Benchmarking of Dynamic Forces
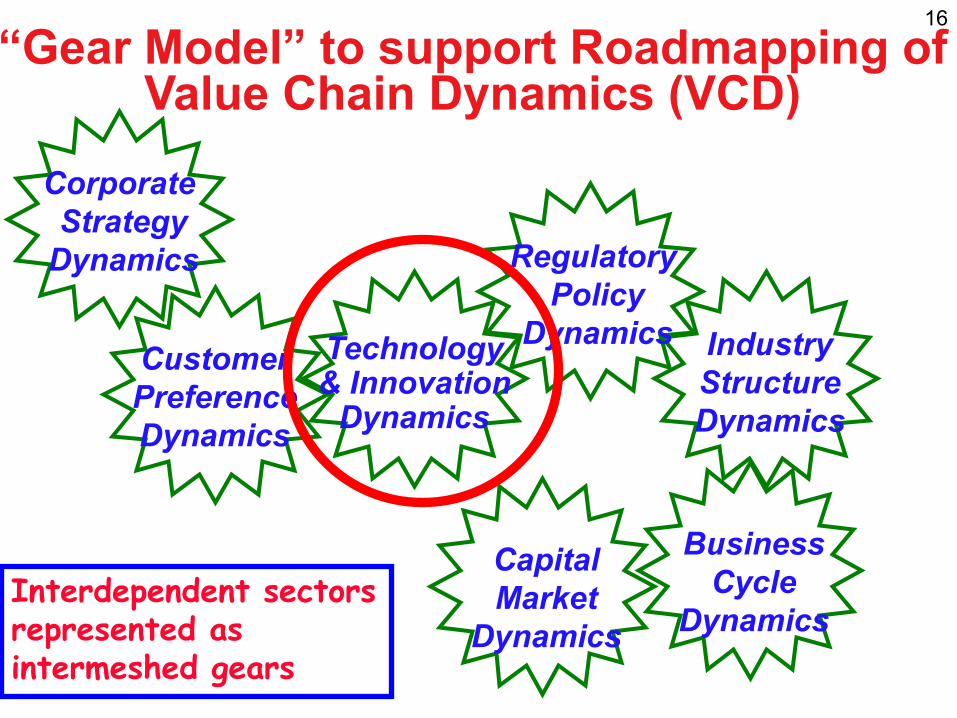
16
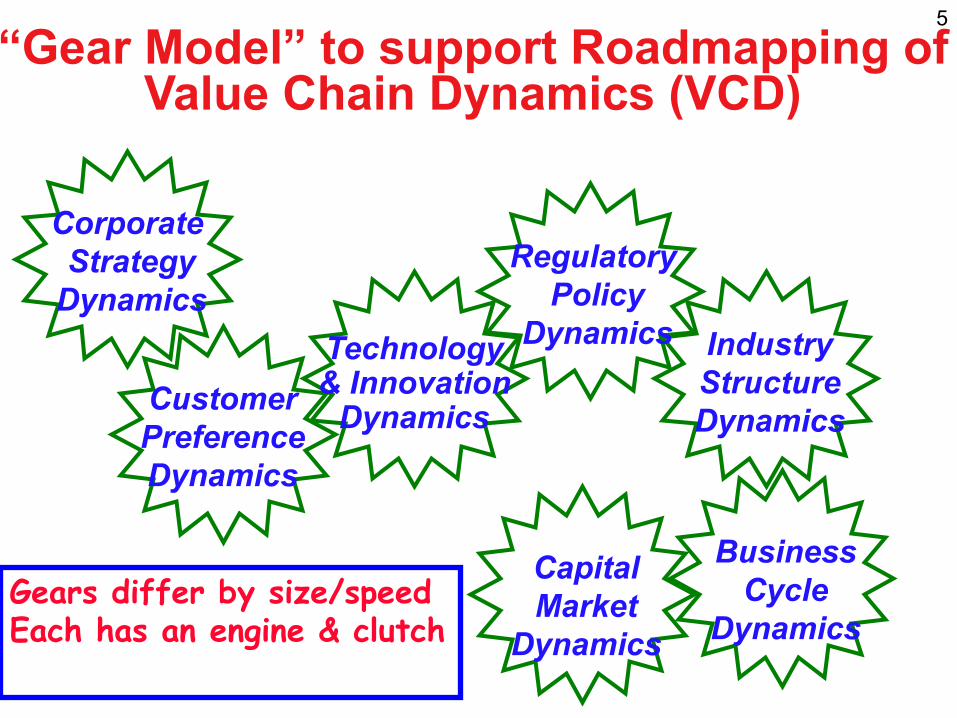
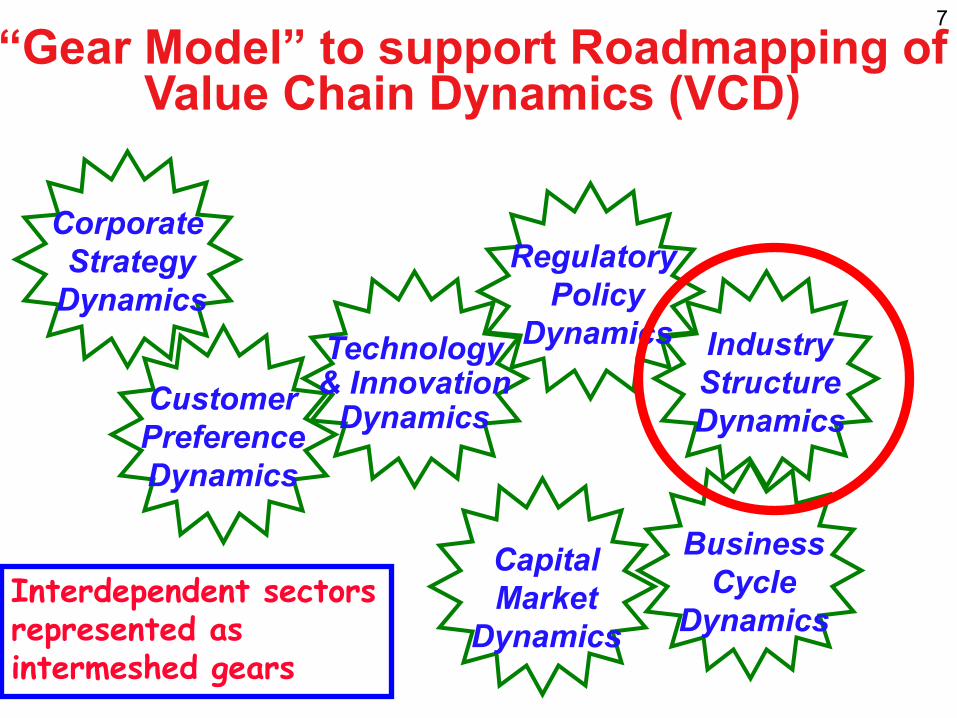
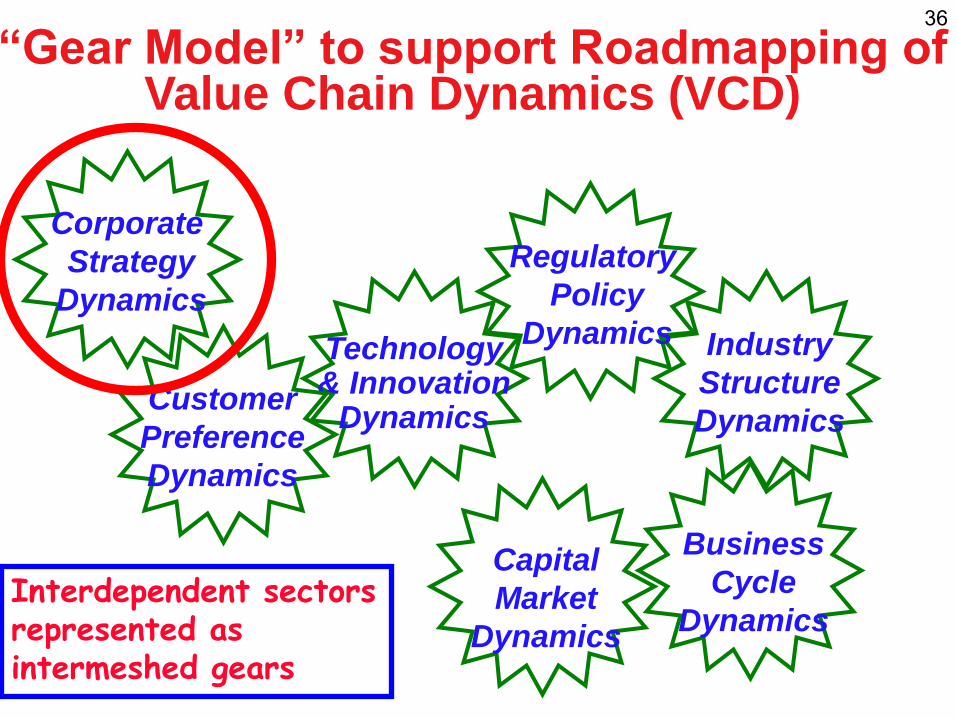
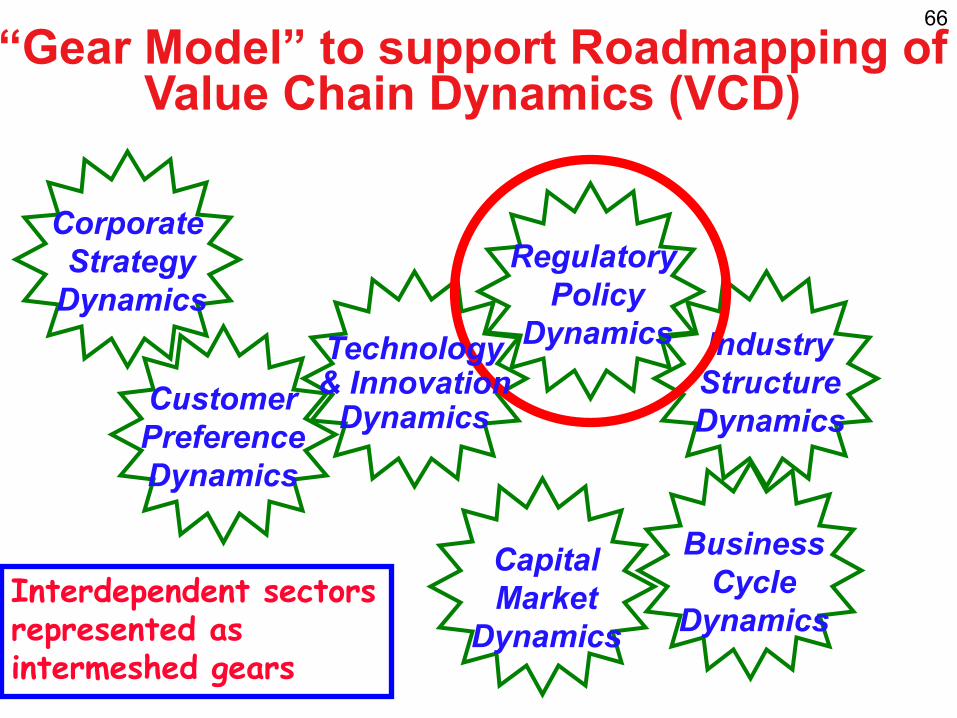
³*HDU�0RGHO´�WR�VXSSRUW�5RDGPDSSLQJ�RI
Business Cycle
Dynamics
Regulatory Policy
Dynamics
Corporate Strategy
Dynamics
Industry Structure Dynamics
Customer Preference Dynamics
Value Chain Dynamics (VCD)
Capital Market
Dynamics Interdependent sectors represented as intermeshed gears
Technology& Innovation
Dynamics
17 Innovation along the Value Chain:How (& why) do Autos & Electronics Differ?
Sales/Marketing /Distribution Production Core
Technology Consumers/ Product Subsystem Suppliers
Users Concept Suppliers
Minivan, Lean Hybrid Aluminum AUTOS Add-ons Internet SUV, Production Engine, Bonding,
Crossover Active Carbon Fiber, Suspension CAD tools
iPod, X-Box, Palm, Contract Html Microprocessor,
ELEC- Napster, Amazon, Office, Digital Photog.
Manufacturing C++ Hard disk drive, TRONICS Apple I Dell Photolithography
Mobile Phone
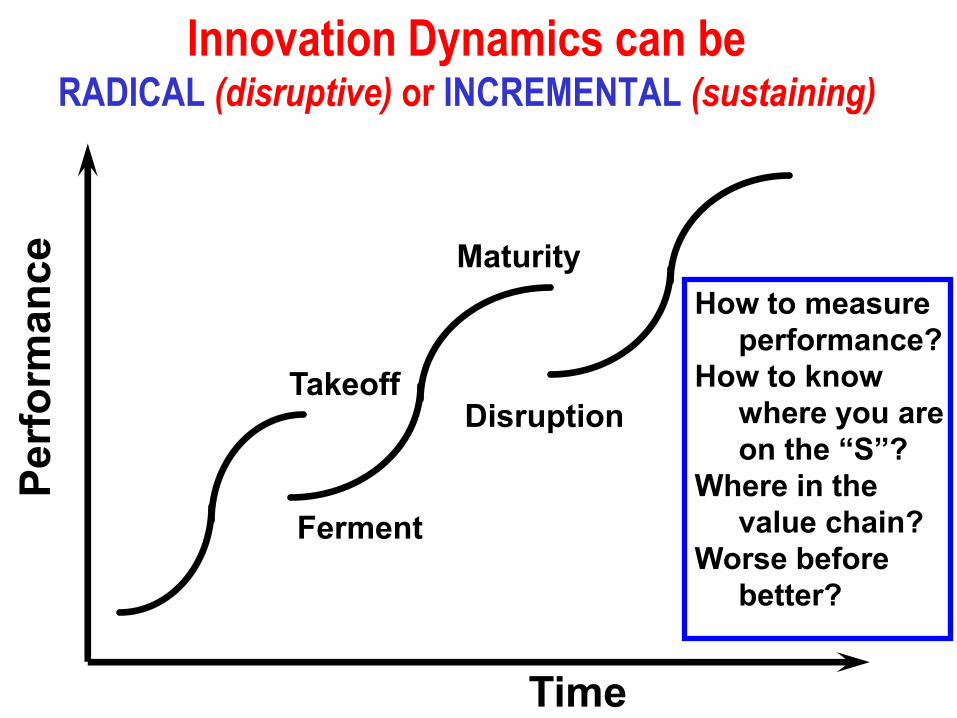
Innovation Dynamics can be RADICAL (disruptive) or INCREMENTAL (sustaining)
Perf
orm
ance
Maturity
Takeoff Disruption
Ferment
Time
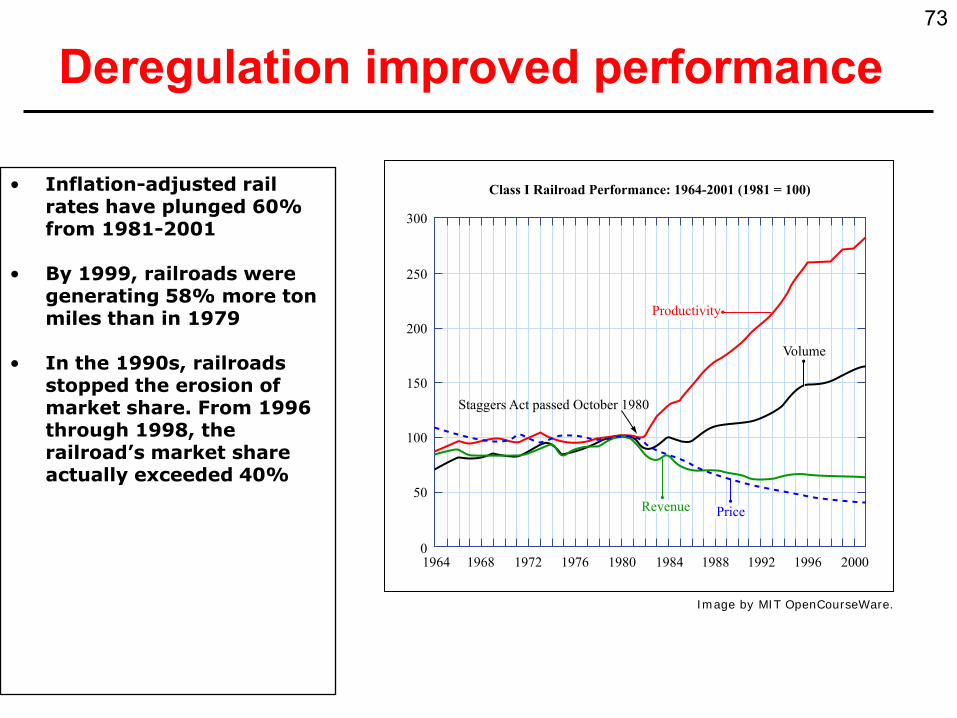
How to measure performance?
How to know where you are RQ�WKH�³6´"
Where in the value chain?
Worse before better?
Disruptive Process Innovation in Autos vs. Disruptive Product Innovation in Electronics
Per
form
ance
Lean Production
Mass Production Process Innovators --Ford --Dell --Wal-mart Craft Production --Southwest Air --Toyota --Li & Fung
Time
Content Publishers
Closed to Apple apps; but one Closed to non- Closed to all
Creative Artists
THE CASE OF APPLE iPod/iPhone ContentApplications Networks
20
non-MP3,then explosive carrier per non-Apple App Store region; slowly formats Growth opening
Content Marketing
Content Distrib.
Content & HW Consumption
Content Sales
iPod/ iPhone
iTunes
iTunes
iTunes homepage
Listening accessories Open, then license
Retail Stores
App Stores
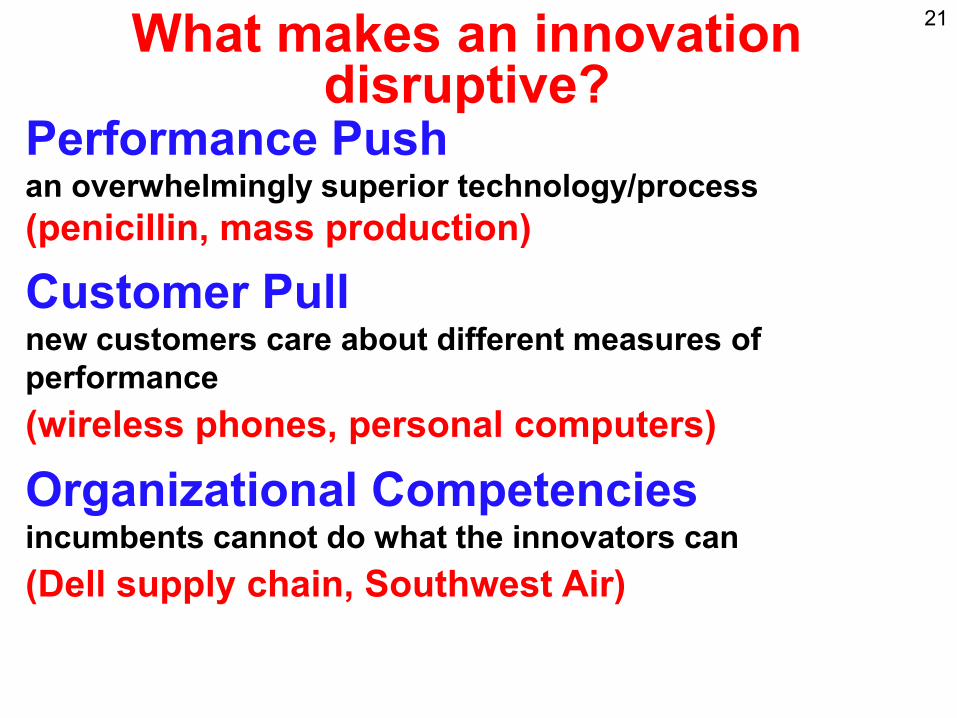
21 What makes an innovation disruptive?
Performance Push an overwhelmingly superior technology/process(penicillin, mass production)
Customer Pull new customers care about different measures of performance (wireless phones, personal computers)
Organizational Competencies incumbents cannot do what the innovators can(Dell supply chain, Southwest Air)
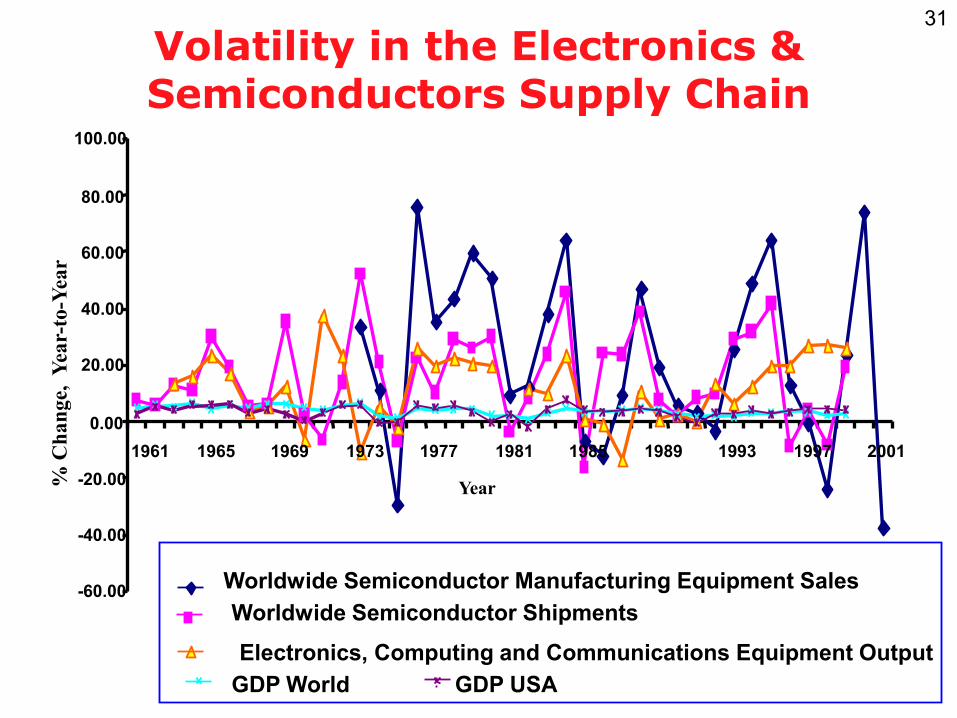
ಯWe are experiencing a 100-\HDU�IORRG�´��-��&KDPEHUV���������
"Upstream Volatility in the Supply Chain: The Machine Tool Industry as a Case Study," E. Anderson, C. Fine & G. Parker Production and Operations Management, Vol. 9, No. 3, Fall 2000, pp. 239-261.
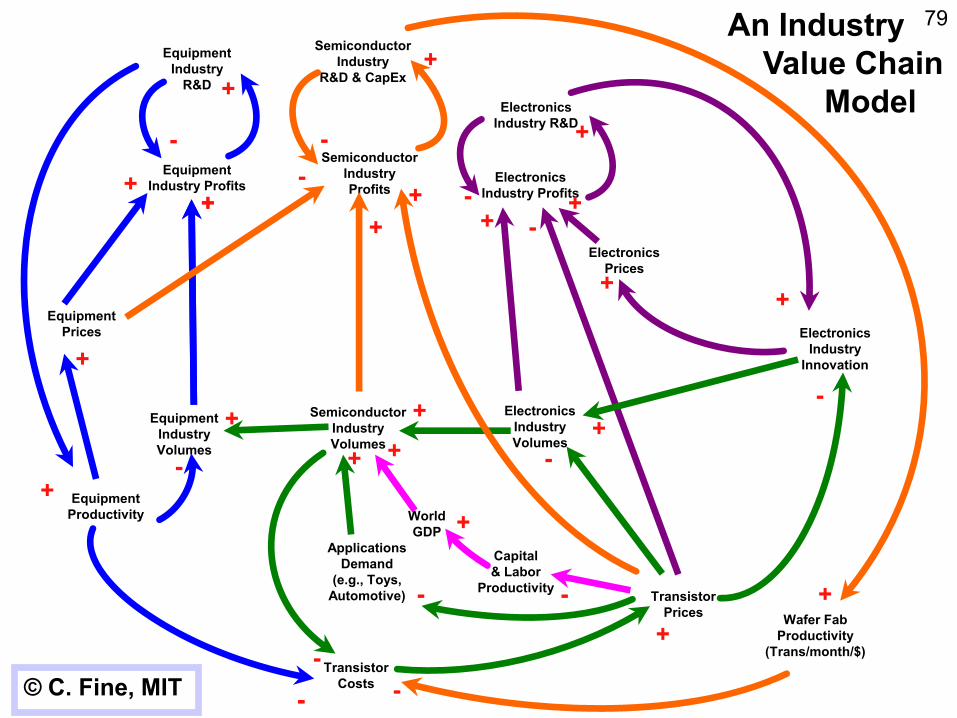
31 Volatility in the Electronics & Semiconductors Supply Chain
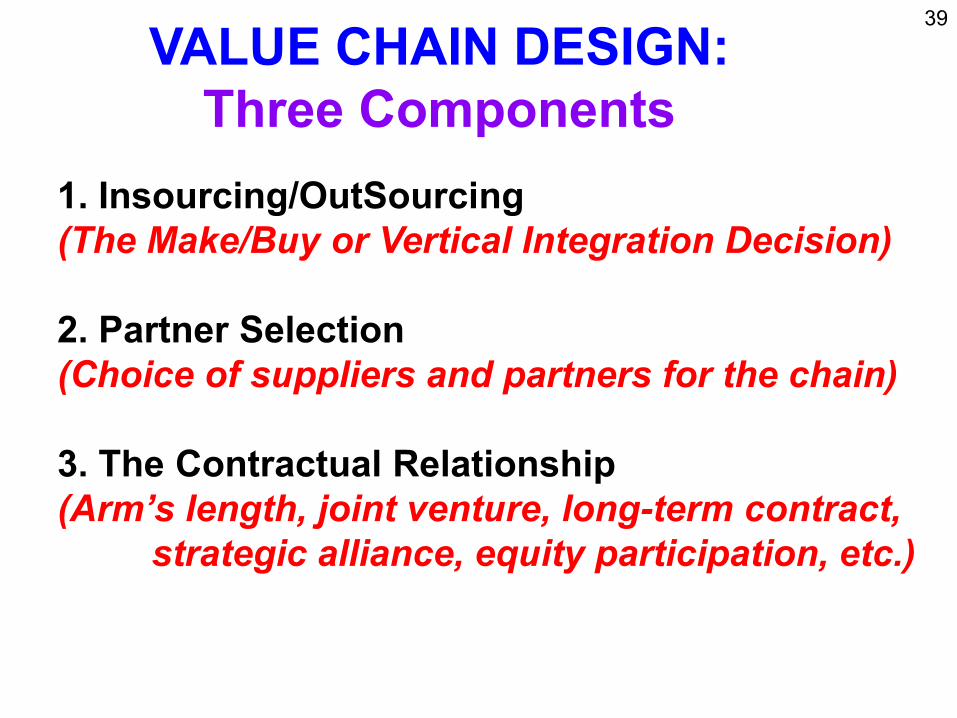
1. Insourcing/OutSourcing (The Make/Buy or Vertical Integration Decision)
2. Partner Selection (Choice of suppliers and partners for the chain)
3. The Contractual Relationship �$UP¶V�OHQJWK��MRLQW�YHQWXUH��ORQJ-term contract,
strategic alliance, equity participation, etc.)
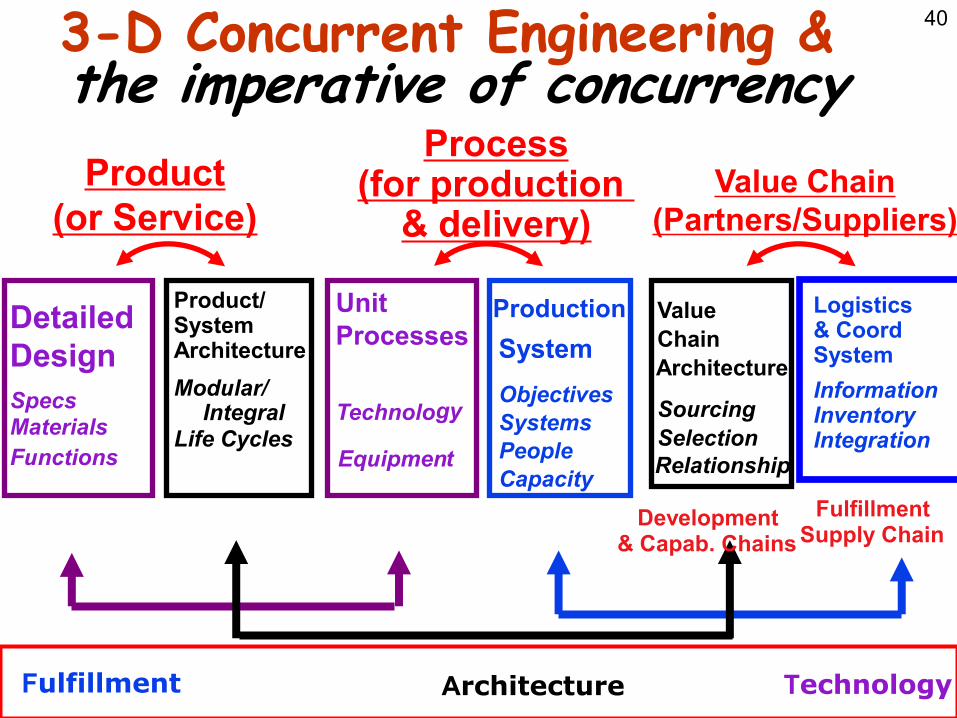
40 3-D Concurrent Engineering &the imperative of concurrency
ProcessProduct (for production Value Chain
(or Service) & delivery) (Partners/Suppliers)
Detailed Design Specs Materials Functions
Product/ System Architecture Modular/
Integral Life Cycles
Unit Process es
Technolo gy
Production System
Objectives Systems People Capacity
Value Chain Architecture
Sourcing Selection Relationship
Logistics& Coord System Information InventoryIntegration
Fulfillment Architecture Technology
t
Fulfillment Supply Chain
Development& Capab. Chains
Equipmen
41
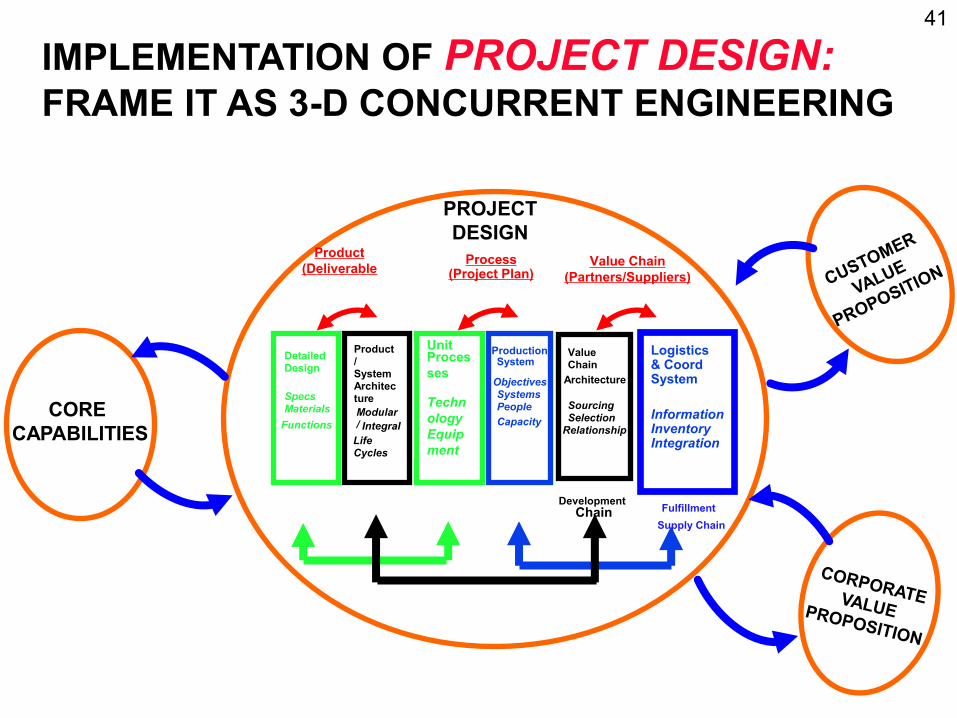
IMPLEMENTATION OF PROJECT DESIGN: FRAME IT AS 3-D CONCURRENT ENGINEERING
PROJECT DESIGN
Product (Deliverable Process
(Project Plan) Value Chain
(Partners/Suppliers)
CORE CAPABILITIES
Detailed Design
Specs Materials
Functions
Unit Proces ses
Techn ology Equip ment
Production System
Objectives Systems People Capacity
Value Chain
Architecture
Sourcing Selection
Relationship
Logistics& Coord System
Information InventoryIntegration
Product / System Architec ture Modular / Integral
Life
Development Fulfillment Supply Chain
Cycles
Chain
42 Do you have to think strategically about every
project?
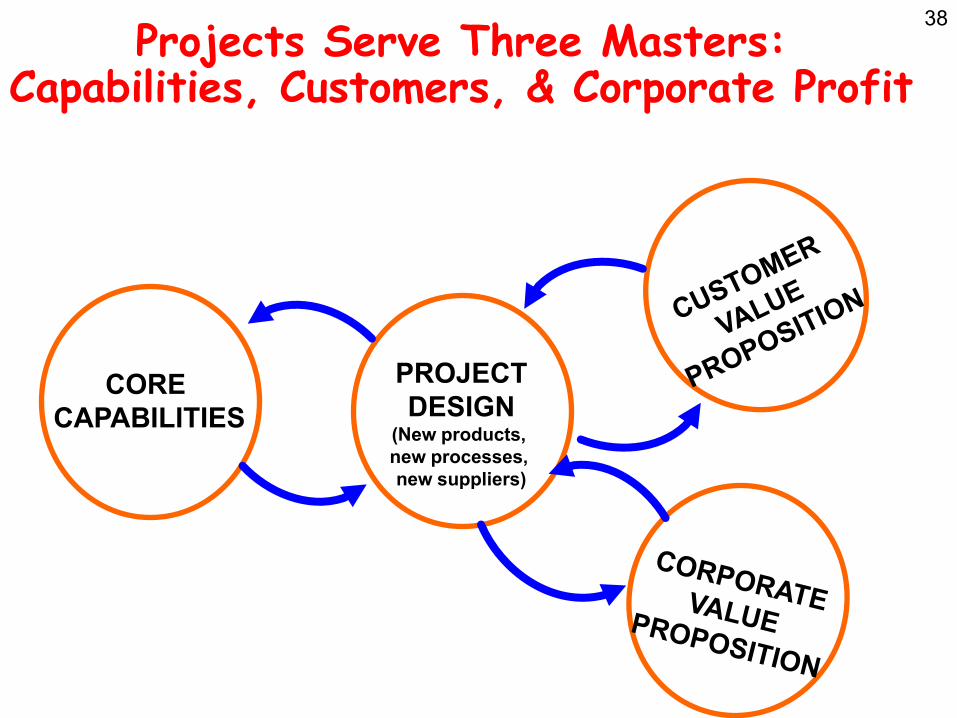
CORE CAPABILITIES
PROJECT DESIGN
(New products, new processes, new suppliers)
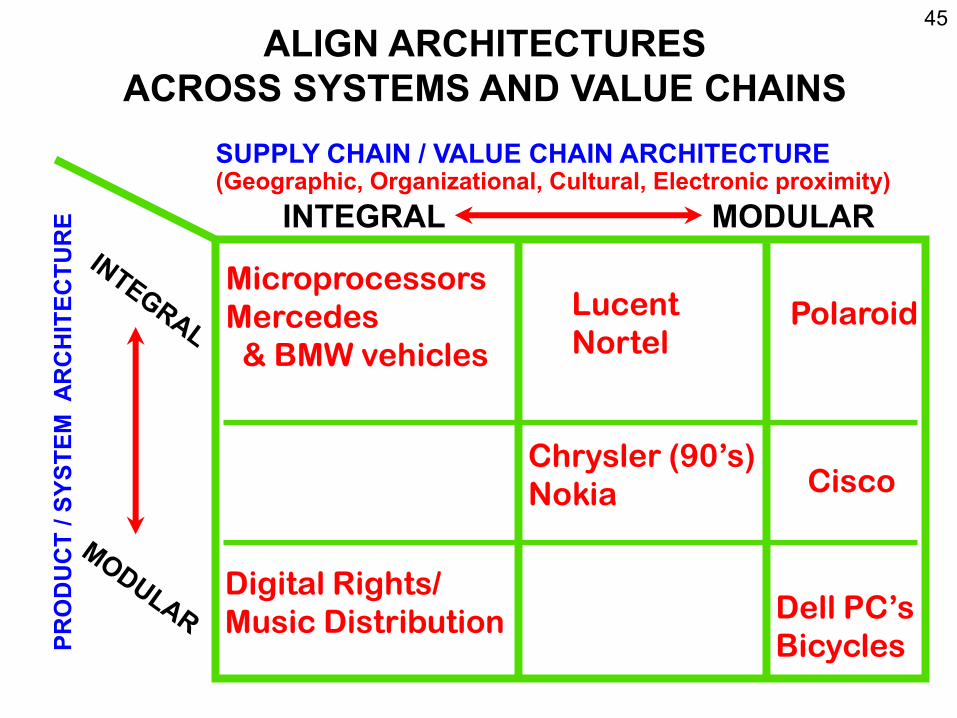
43 ARCHITECTURES IN 3-DINTEGRALITY VS. MODULARITY
Integral product architectures feature close coupling among the elements
- Elements perform many functions- Elements are in close spacial proximity- Elements are tightly synchronized - Ex: jet engine, airplane wing, microprocessor
Modular product architectures feature separation among the elements
- Elements are interchangeable - Elements are individually upgradeable- Element interfaces are standardized - System failures can be localized
- Ex: stereo system, desktop PC, bicycle
44
VALUE CHAIN ARCHITECTURE
Integral value-chain architecture features close proximity among its elements
� Demand Management: � Forecast = Buy = Sell � Buy to Plan, but Build to Order
� ,QYHQWRU\�9HORFLW\�LV�D�ZRQGHUIXO�WKLQJ�«� Customers have immediate access to the latest
technology. � Suppliers get their products to market quickly� Quality is improved with fewer touches.� Cash is generated through negative cash cycle.� Model efficiencies drive Market Share gain.
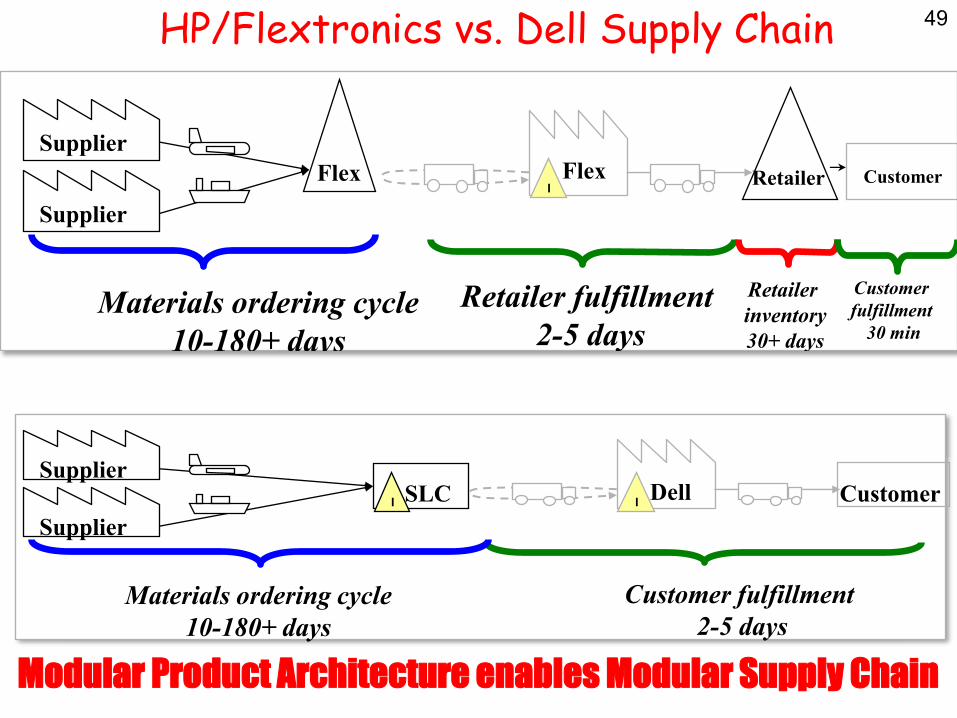
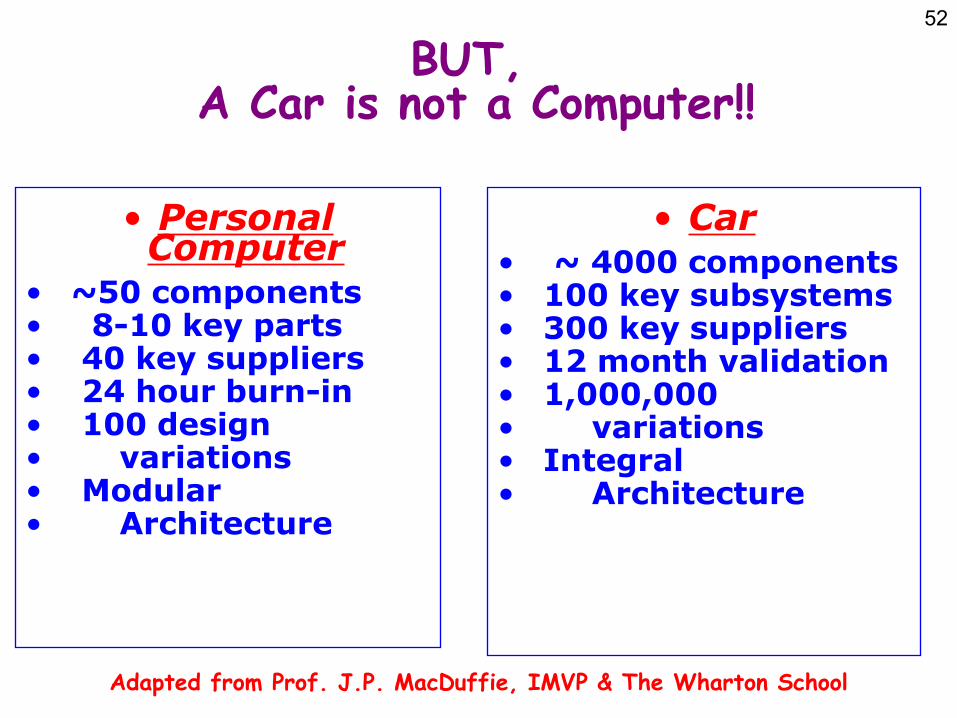
51 Can ´'HOO�'LUHFWµ Work for Autos?
� $SSHDOLQJ�WR�2(0¶V�RQ�0DQ\� Dimensions ± Satisfy customer need for Speed ± Reduce Supply Line Inventories ± Reduce mismatches and discounting± Direct OEM-Customer Relationships (&
Data!) ± Information Transparency
Adapted from Prof. J.P. MacDuffie, IMVP & The Wharton School
Dynamics Interdependent sectors represented as intermeshed gears
Technology& Innovation
Dynamics
67 A long, long time a go in an industry far away . . .
68 Freight Railroads vs. Trucks The Dynamics of Industry
Economicsand the Optimal Timing of
DeregulationRailroads
Too early Too late
Trucks
Shar
e of
Rev
enue
³,Q�WKH�=RQH´
1880 1910 1950 1980 2000
Regulation Shocks happen; Regulation If deregulation is reins in Environment constrains SLOW, LATE, &
³PRQRSRO\´ changes; response; PIECEMEAL; then Substitutes deregulation Economic Dislocation;
mayarise timing is critical Incumbent Collapse
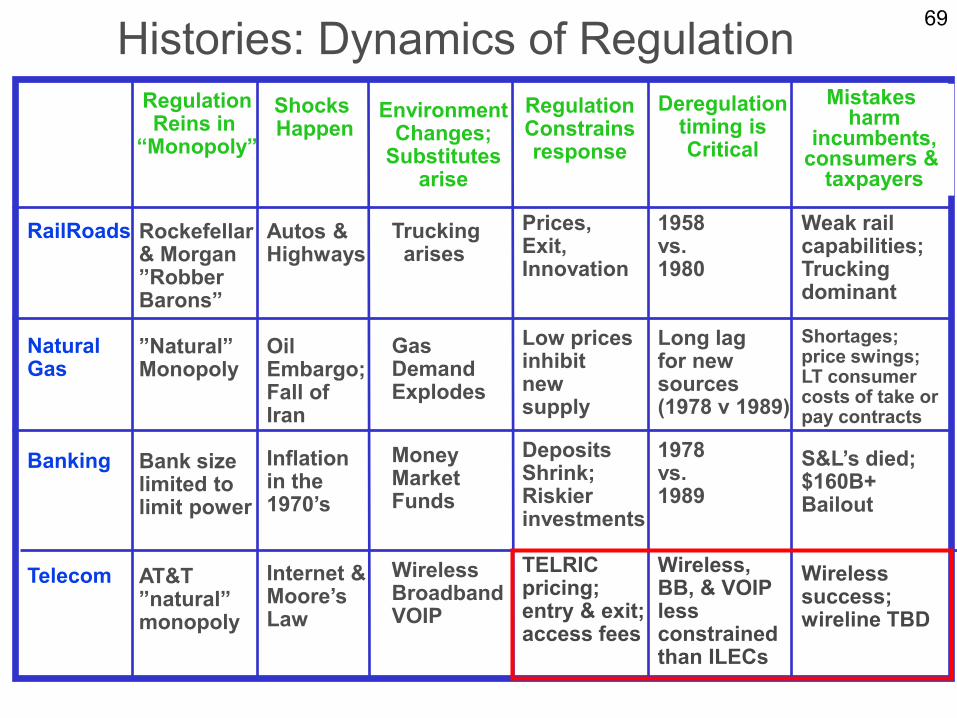
69 Histories: Dynamics of Regulation RegulationReins in ³0RQRSRO\´
Shocks Happen
Environment Changes;
Substitutes arise
RegulationConstrains response
Deregulationtiming isCritical
Mistakes harm
incumbents,consumers &
taxpayers
RailRoads Rockefellar & Morgan´5REEHU� %DURQV´
Autos & Highways
Truckingarises
Prices, Exit, Innovation
1958 vs. 1980
Weak rail capabilities;Truckingdominant
Natural Gas
´1DWXUDO´ Monopoly
Oil Embargo;Fall of Iran
Gas Demand Explodes
Low pricesinhibit new supply
Long lagfor new sources (1978 v 1989)
Shortages;price swings;LT consumer costs of take or pay contracts
Banking Bank size limited to limit power
Inflation in the ����¶V
MoneyMarket Funds
DepositsShrink; Riskier investments
1978 vs. 1989
6/¶V�GLHG�$160B+ Bailout
Telecom AT&T ´QDWXUDO´ monopoly
Internet & 0RRUH¶VLaw
Wireless Broadband VOIP
TELRIC pricing;entry & exit;access fees
Wireless, BB, & VOIP less constrained than ILECs
Wireless success; wireline TBD
Conceptual Model: The Dynamics of 70
Regulation and Deregulation
Perceptionof Monopoly
Deregulation isTOO EARLY and
not well thought out;Electricity (Calif),
CATV (1984)
Costly mistakes; re-regulation;Try, try, again.
Processes Shocks
HappenRegulationReins in ³0RQRSRO\´
Regulationconstrains incumbent response
Deregulation isRAPID, TIMELY, & COMPREHENSIVE;
Airlines(1978),Wireless (1993)
Robust competition;Large jump in
consumer welfare
Environment changes;
Substitutes may arise
Deregulation isSLOW, LATE, &
PIECEMEAL;Railroads(1958-80),
Gas (1973-93),Banking (1978-99)
Economic Dislocation;Incumbent Collapse
Full, but Late, Deregulation
71
What caused the collapse of the freight railroads?
³$�JRRG�ZD\�WR�XQGHUVWDQG�ZKDW�KDV�KDSSHQHG�>WR� railroads] is to imagine a business that is prevented from adjusting its prices to changing market conditions and from negotiating with its customers. Furthermore, imagine that the business is not permitted to decide how much of its principal inputs to purchase, how much it will pay for them or even how to use them, and it may not decide where it will operate. Worse yet, imagine that it faces strong competitors who are not encumbered by similar constraints. It would be surprising if such a business survived at all. This is only a slight exaggeration of the UDLOURDGV¶�SRVLWLRQ�EHIRUH������´
8:00 pm, Friday 17 March 2000: Lightning Strikes an ASIC semiconductor plant of Philips in Albuquerque, New Mexico, USA 8:10 pm: Fire is extinguished. Plant will be down for months.
Navy Pilot: &UDVK��,QYHVWLJDWLRQ��6&�HGXFDWLRQ��³Columbo´ ± Visits, Toyota, Dell, Zara & aircraft supply chain 3LORW¶V�VLVWHU� MIT grad; laid off; discovers entrepreneurship 3LORW¶V�ZLIH� Policy analyst for Senator; 3LORW¶V�VRQ� outsources homework; outsource capacity, not knowledge
3LORW¶V�GDXJKWHU� business student; Zara shopper
�
�
Chinese Entrepreneur: (e.g., Morris Chang/Terry Gou) ± ³%HQHYROHQW�)DWKHU�´��&KLQHVH�FRH[LVWHQFH��+HQU\�)RUG��HongSing
� Ultimately brokers cooperation
Warrior Daughter: Chinese domination; aggressive growth
� Defense contractor: Three Generations ± Grandfather (England), Father (USA), Grandson (affair w/Chinese daughter) ± Makes avionics systems; lobbies senator; Outsource to HongSing ± losing commercial business to Chinese
� U.S. Senator: Loses son in crash, orders investigation ± Pork to military contractors; but cost pressures as well ± How to keep good jobs in USA? ± Campaign contributions from Americans & Chinese ± ³&DXVHG´�WKH�GHDWK�RI�KLV�VRQ ± Ultimately works on collaboration with Chinese CEO & *RY¶W