15
GEOS-CHEM Meeting 2005 Dylan Millet Variability of CH 2 O during ICARTT: Implications for GOME/OMI Dylan Millet GEOS-CHEM Users’ Meeting April 2005
| Date post: | 30-Dec-2015 |
| Category: |
Documents |
| Upload: | miriam-stark |
| View: | 25 times |
| Download: | 1 times |

GEOS-CHEM Meeting 2005Dylan Millet
Variability of CH2O during ICARTT:
Implications for GOME/OMI
Dylan Millet
GEOS-CHEM Users’ MeetingApril 2005

GEOS-CHEM Meeting 2005Dylan Millet
Use ICARTT flight data to address:
• Satellite retrievals– Is GEOS-CHEM accurately representing the
CH2O vertical profile (shape factor)?
– What is the uncertainty/bias in the AMF?
• Variability in CH2O– What are the dominant sources of CH2O
over N.A.?– Implications for satellite retrievals?

GEOS-CHEM Meeting 2005Dylan Millet
Air Mass Factor
d
0
1
)()( dSwAMFAMF GAMFG: Geometric factor
w(): Scattering weights
~ -(lnIB)/
S(): Shape factor
Normalized vertical distribution
From model
AMF: Slant column / vertical column
GEOS-CHEM Meeting 2005Dylan Millet
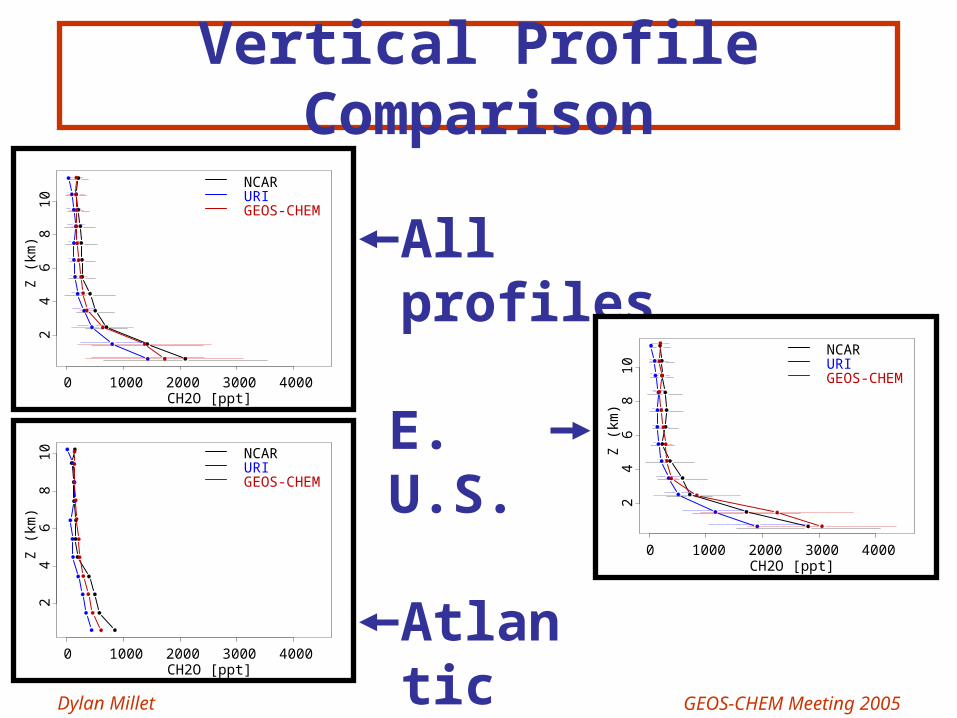
All profiles
E. U.S.
Atlantic
Vertical Profile Comparison
24
68
10
0 1000 2000 3000 4000CH2O [ppt]
Z (
km)
NCARURIGEOS-CHEM
24
68
10
0 1000 2000 3000 4000CH2O [ppt]
Z (
km)
NCARURIGEOS-CHEM
24
68
10
0 1000 2000 3000 4000CH2O [ppt]
Z (
km)
NCARURIGEOS-CHEM
GEOS-CHEM Meeting 2005Dylan Millet
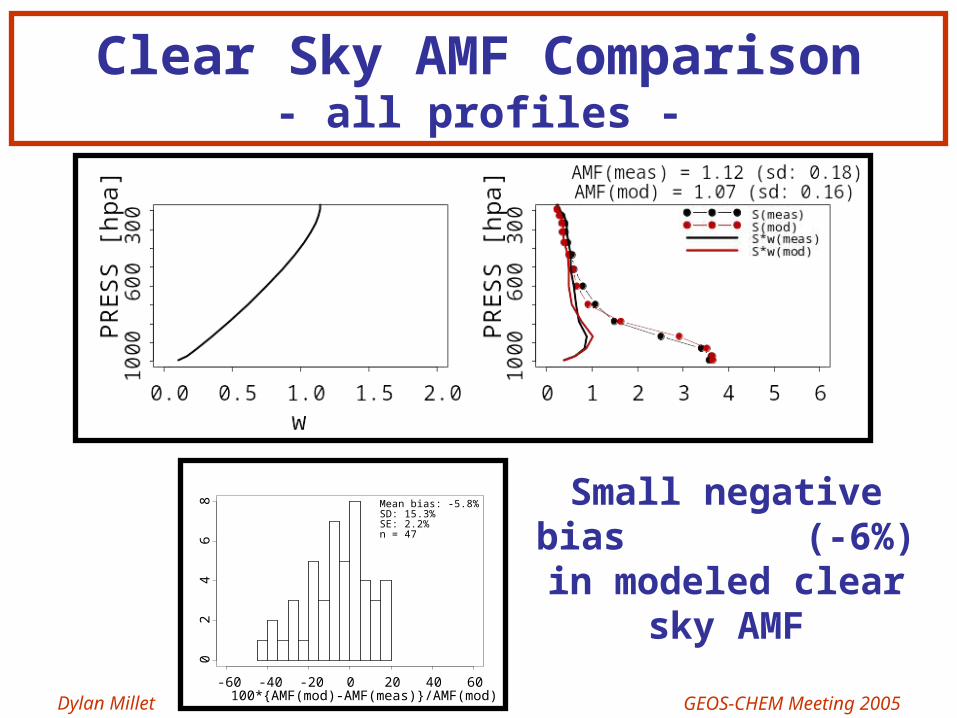
Clear Sky AMF Comparison- all profiles -
Small negative bias (-6%) in modeled clear sky
AMF-60 -40 -20 0 20 40 60
02
46
8
100*{AMF(mod)-AMF(meas)}/AMF(mod)
Mean bias: -5.8%SD: 15.3%SE: 2.2%n = 47

GEOS-CHEM Meeting 2005Dylan Millet
Continental profiles: -7%
Oceanic profiles: +5%

GEOS-CHEM Meeting 2005Dylan Millet
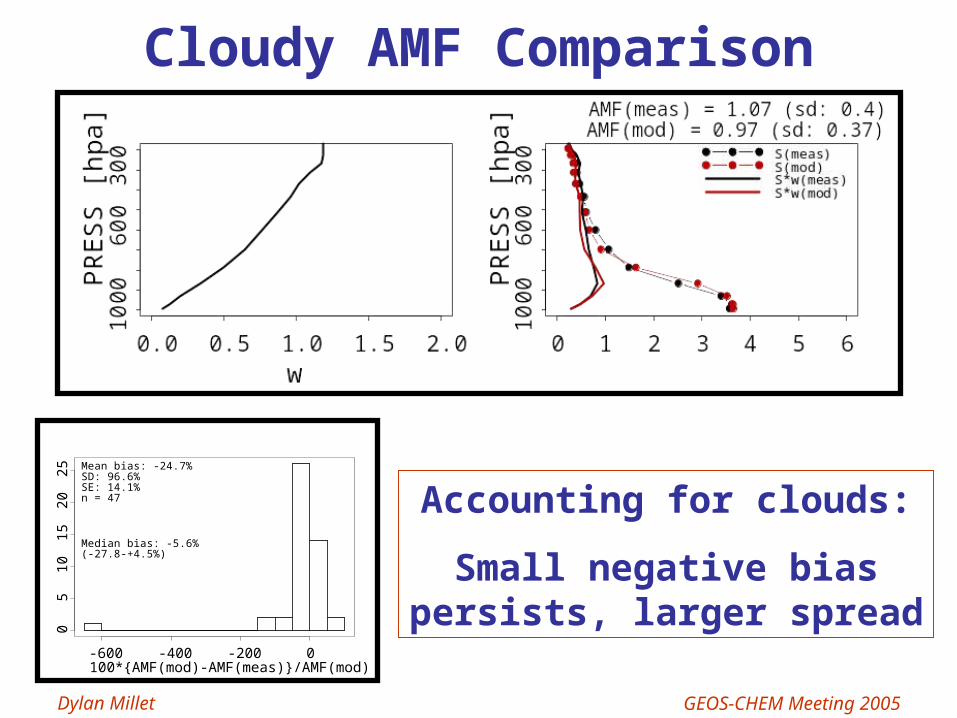
Cloudy AMF Comparison
Clouds:Can act to increase or decrease sensitivity of measurement

GEOS-CHEM Meeting 2005Dylan Millet
Cloudy AMF Comparison
Actual cloud
profile:
Retrieved
cloud:
GEOS-CHEM Meeting 2005Dylan Millet
Cloudy AMF Comparison
Accounting for clouds:
Small negative bias persists, larger spread
-600 -400 -200 0
05
1015
2025
100*{AMF(mod)-AMF(meas)}/AMF(mod)
Mean bias: -24.7%SD: 96.6%SE: 14.1%n = 47
Median bias: -5.6%(-27.8-+4.5%)

GEOS-CHEM Meeting 2005Dylan Millet
Continental profiles: -17%
Oceanic profiles: +3%
GEOS-CHEM Meeting 2005Dylan Millet
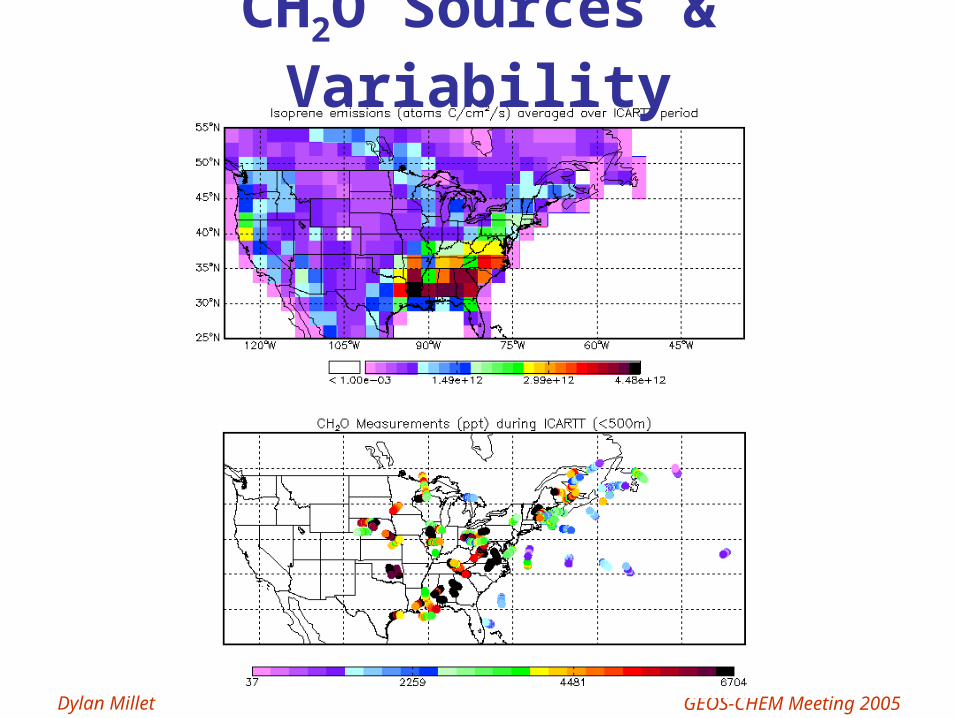
CH2O Sources & Variability

GEOS-CHEM Meeting 2005Dylan Millet
500 1000 1500
0.0
0.2
0.4
0.6
0.8
1.0
[CH2O] (ppt)
P(i)
/P(t
otal
)
Oceanic
OtherNMHCsOVOCsMethaneIsoprene
0 500 1000 1500
0.0
0.2
0.4
0.6
0.8
1.0
[CH2O] (ppt)
P(i
sopr
ene)
/P(t
otal
)
Oceanic
0 1000 2000 3000 40000.
00.
20.
40.
60.
81.
0[CH2O] (ppt)
P(i
sopr
ene)
/P(t
otal
)
Continental
0 1000 2000 3000
0.0
0.2
0.4
0.6
0.8
1.0
[CH2O] (ppt)
P(i)
/P(t
otal
)
Continental
OtherNMHCsOVOCsMethaneIsoprene
CH2O Sources
Importance of measured precursors to CH2O production:
ii
ii
total
i
Yik
Yik
P
P

GEOS-CHEM Meeting 2005Dylan Millet
0.0 0.2 0.4 0.6 0.8
02
46
810
P(isoprene)/P(total)
Z (
km)
Oceanic
0.0 0.2 0.4 0.6 0.8
24
68
10
P(isoprene)/P(total)
Z (
km)
Continental
0.0 0.2 0.4 0.6 0.8 1.0
24
68
10Z
(km
)
P(i)/P(total)
Continental
OtherNMHCsOVOCsMethaneIsoprene
CH2O Sources
0.0 0.2 0.4 0.6 0.8 1.0
24
68
10Z
(km
)
P(i)/P(total)
Oceanic
OtherNMHCsOVOCsMethaneIsoprene

GEOS-CHEM Meeting 2005Dylan Millet
CH2O SourcesContinental boundary layer:
Continental BL:
• P(isoprene) ~ 50% of P(total) on average
• OVOCs, methane important
• Variability in P(isoprene) > 10x P(others)
0 5 10 15 20
010
020
0 IsopreneMean: 3.25SD: 4.8
0.0 0.5 1.0 1.5 2.0
040
80 OVOCMean: 0.51SD: 0.26
0.20 0.22 0.24 0.26 0.28
010
30
MethaneMean: 0.25SD: 0.02
0.0 0.5 1.0 1.5
040
80
NMHCMean: 0.17SD: 0.16
Cou
nts
P(i) (1/s)
GEOS-CHEM Meeting 2005Dylan Millet
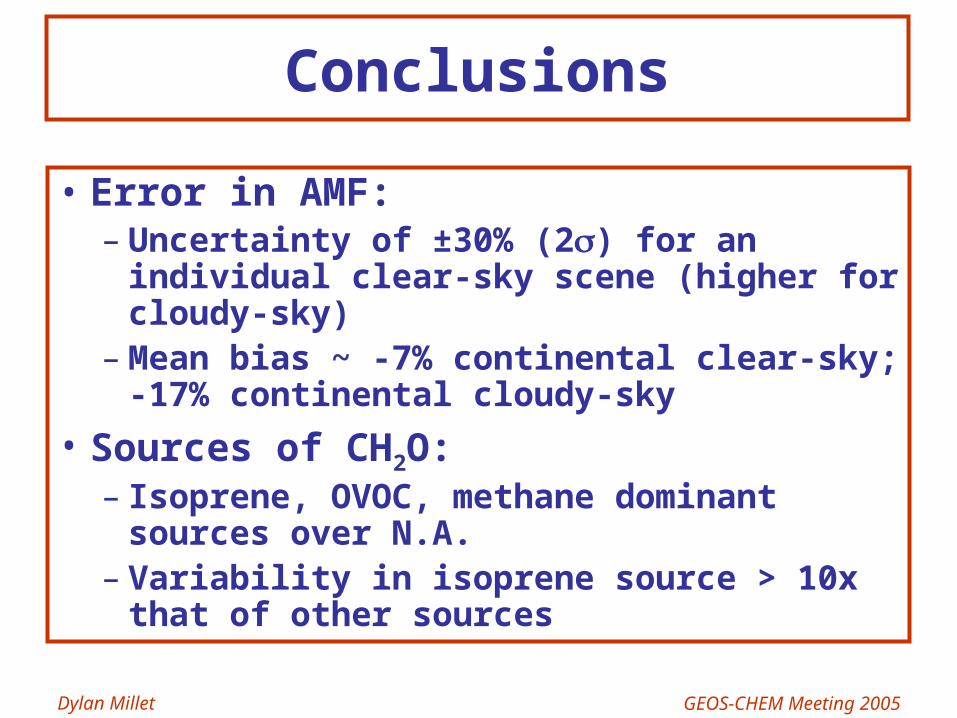
Conclusions
• Error in AMF:– Uncertainty of ±30% (2) for an
individual clear-sky scene (higher for cloudy-sky)
– Mean bias ~ -7% continental clear-sky; -17% continental cloudy-sky
• Sources of CH2O:– Isoprene, OVOC, methane dominant
sources over N.A.– Variability in isoprene source > 10x
that of other sources


