Article Police Quarterly 0(0) 1–30 ! The Author(s) 2018 Article reuse guidelines: sagepub.com/journals-permissions DOI: 10.1177/1098611118796597 journals.sagepub.com/home/pqx Variability of Crime Clearance Among Police Agencies Thomas L. Scott 1 , Charles Wellford 1 , Cynthia Lum 2 , and Heather Vovak 2 Abstract Average crime clearance rates have remained remarkably stable in the United States since the 1980s, despite many advances in investigative technologies or fluctuations in crime. Taking these average trends at face value, some have suggested that this stability indicates that police departments can do little to alter their clearance rates. However, in this study, we find that the average trends mask substantial long-term variation in crime clearance among police agencies. Using group-based trajectory modeling, we test whether large U.S. police departments have reported uniquely different long-term clearance rate trends from 1981 to 2013 and what organizational factors might contribute to different trends. As we discuss, this method has attrac- tive qualities that provide for a more rigorous analysis compared with past compar- ative work. Our results show diverse levels and patterns of clearance both within individual crime types and across multiple crime types that appear to covary with organizational factors. We explain how finite mixture modeling can advance both quantitative and qualitative research by identifying departmental differences in performance for further study. 1 Department of Criminology and Criminal Justice, University of Maryland, College Park, MD, USA 2 Department of Criminology, Law and Society, Center for Evidence-Based Crime Policy, George Mason University, Fairfax, VA, USA Corresponding Author: Thomas L. Scott, Department of Criminology and Criminal Justice, University of Maryland, College Park, MD, USA. Email: [email protected]
Variability of Crime Clearance Among Police Agencies
Thomas L. Scott1 , Charles Wellford1, Cynthia Lum2, and Heather Vovak2
Abstract Average crime clearance rates have remained remarkably stable in the United States since the 1980s, despite many advances in investigative technologies or fluctuations in crime. Taking these average trends at face value, some have suggested that this stability indicates that police departments can do little to alter their clearance rates. However, in this study, we find that the average trends mask substantial long-term variation in crime clearance among police agencies. Using group-based trajectory modeling, we test whether large U.S. police departments have reported uniquely different long-term clearance rate trends from 1981 to 2013 and what organizational factors might contribute to different trends. As we discuss, this method has attrac-tive qualities that provide for a more rigorous analysis compared with past compar-
ative work. Our results show diverse levels and patterns of clearance both within individual crime types and across multiple crime types that appear to covary with organizational factors. We explain how finite mixture modeling can advance both quantitative and qualitative research by identifying departmental differences in performance for further study.
1Department of Criminology and Criminal Justice, University of Maryland, College Park, MD, USA 2Department of Criminology, Law and Society, Center for Evidence-Based Crime Policy, George Mason University, Fairfax, VA, USA
Corresponding Author: Thomas L. Scott, Department of Criminology and Criminal Justice, University of Maryland, College Park, MD, USA. Email: [email protected]
One of the most important functions of law enforcement is the investigation and resolution of crimes. In the last half century, American police agencies have seen a great deal of advancement and innovation in criminal investigations, starting with the standardization and computer automation of case documentation and processing to improvements in forensics and investigations technologies to iden-tify suspects more accurately and quickly. Crime analysts have also become an important part of investigations, assisting with searching for individuals, gath-ering clues, and generating patterns of similarities between cases. Particularly for serious victimizations involving violence and theft, police agencies devote sig-nificant amounts of resources to investigations, often 10% to 20% of their annual budgets.
Despite these recent advances and the resources allocated to investigations, the resolution or clearance of crime in the United States is arguably low. In the latest year for which data are available in the United States (2016), there were approximately 1.25 million violent crimes reported to the police, of which 54% were not cleared by an arrest or exceptional means, including 7,000 homicides. In addition, of the nearly 7.92 million serious property crimes that occurred in 2016, 6.47 million remained unsolved (about 82%). In total, this amounts to approximately 78% of all serious crimes that did not result in a successful resolution.1
Perhaps even more interesting is that average clearance rates have not changed much over the last 30 years for many crime types (Braga, Flynn, Kelling, & Cole, 2011).2 Figure 1 shows the average clearance rates for homi-cide, robbery, aggravated assault, and burglary from 1981 to 2013 for all agen-cies with 100 or more officers as of 1980.3 This figure shows that although clearance rates differ dramatically across crime types, being highest for homicide and lowest for burglary, average national clearance trends within crime types have remained remarkably stable for over three decades. In Figure 2, we repli-cate these average clearance rate trajectories for the 100 largest police agencies as of 1981. For these agencies, while there have been slight declines in clearance rates in three of these four crime types, trends continue to remain fairly consis-tent. Clearance rates for aggravated assaults have declined from around 60% in the 1980s to 50% in the 2000s, robbery rates have hovered around the 30% range, burglary gradually declined from 15% to 10%, and the homicide clear-ance rate dropped from 75% in 1981 to below 70% in recent years.
3 Scott et al.
Figure 1. Yearly crime clearance rates for the United States from 1981 to 2013 (all agencies with 100 or more officers).
Figure 2. Yearly crime clearance rates for the United States from 1981 to 2013 (100 largest agencies subsample).
4 Police Quarterly 0(0)
The long-term stability in clearance rates despite advances in policing and investigation strategies or even major fluctuations in crime types has led some to question whether the police can do anything to improve their ability to solve crimes (Braga et al., 2011, p. 8; Travis, Western, & Redburn, 2014, pp. 48–49). We are reluctant to take these average trends and their assessments at face value. Perhaps some agencies consistently have clearance rates that are much higher (or lower) than our averages shown in Figures 1 and 2. Average trends might mask unique variations in individual agency performance over time, which given further study could offer clues as to why some agencies perform better than others. What is lacking from much research and theory on the dynamic rela-tionship between clearance rates and other important variables, like investiga-tive advances or crime rates, is an explicit statement regarding how agency clearance rate trends are distributed around the national average. One exception is a recent article by Worrall (2016). Worrall was one of the first to apply group-based trajectory modeling to the study of police clearances when he modeled variation in property and violent crime clearance trajectories from 2000 to 2012 for 570 law enforcement agencies.
Such inquiries into variations in clearance rate trends are needed in today’s policing environment. Clearance rates are used as a common measure of police effectiveness in both research and practice, and the resolution of crimes is important for police legitimacy for both individual victims as well as commu-nities. Yet, we know little about how the efficacy and effectiveness of police investigative practices affect crime clearance rates. For example, the Lum, Koper, and Telep (2011) Matrix4 now houses 165 moderate to very strong evaluation studies of policing, yet only 11 seem connected to the work of inves-tigative units (see, e.g., Bynum & Varano, 2003; Eck & Wartell, 1998; Fox & Farrington, 2015; Jolin, Feyerherm, Fountain, & Friedman, 1998; Koper, Taylor, & Woods, 2013; Martin & Sherman, 1986; Nunn, Quinet, Rowe, & Christ, 2006; Spergel, Wa, & Sosa, 2002).
Early research by the RAND Corporation and others raised questions about the utility of investigations by showing that the outcomes of criminal investiga-tions typically depend on information obtained by patrol officers who first respond to the scene, and that follow-up activities by detectives appeared to add little to the apprehension of offenders (Greenwood & Petersilia, 1975). Concern over the ability of police investigations to impact crime rates and crime clearances led researchers to examine what might contribute to crime clearances and, in turn, how might criminal investigations be improved through better management, training, policies, and investigative techniques (e.g., Braga & Doussealt, 2018; Coupe, 2016; Cronin, Murphy, Spahr, Toliver, & Weger, 2007; Eck, 1983; Higginson, Eggins, & Mazerolle, 2017; Keel, Jarvis, & Muirhead, 2009; Ritter, 2008; Wellford & Cronin, 1999). These studies seem to indicate that aside from specific characteristics of crimes themselves, the application of investigative resources may influence whether crimes are resolved.
5 Scott et al.
Understanding variations in crime clearances is an important first step in determining what leads to improved clearance rates for agencies over time, and therefore is the first step of a larger project in which we are engaged with the Laura and John Arnold Foundation since 2015. Using similar techniques applied by Worrall (2016)—group-based trajectory modeling (GBTM; Nagin, 2005)—but on a more targeted group of agencies (very large agencies) and for a longer time series (33 years), we disaggregated violent and property crime types into specific offenses to analyze variations in clearance rate trajectories. We also add to previous work by applying a recent advancement in GBTM—multitra-jectory modeling (Jones & Nagin, 2007; Nagin, Jones, Passos, & Tremblay, 2016)—to test our hypothesis that there may be identifiable groups of law enforcement agencies that have similar long-term clearance rate trends across multiple crime types, and that those group trends are distinct from the national average. This is an innovative approach to understanding clearance rate trends and we explain our approach in detail in the Methods section below.
There is some evidence in addition to Worrall (2016) to support a group-based conception of long-term trends of clearance rates. This is most evident in studies of homicide clearance. Comparative studies (Wellford & Cronin, 2000) and case studies (Carter & Carter, 2016) have identified variations in policing strategies that are associated with variations in agency clearance rates. For example, Wellford and Cronin (2000) collected homicide case files from four large American cities that differed in their homicide (high vs. low) and total (high vs. low) clearance rates between 1994 and 1995. They found 51 factors that were significantly associated with closing a homicide case, of which 37 were deemed within the control of the police. Particularly important were the number of detectives assigned to the case, how fast detectives arrived to the scene, and the use of various types of computer checks.
Importantly, Wellford and Cronin purposefully selected agencies as high or low based on their clearance rates. This approach is limited because it does not allow one to statistically test whether these agencies are in fact “high” or “low” performers with regard to their ability to clear cases or whether the data just reflect random variation in those 2 years measured. Additionally, it does not provide an estimate of the reliability that an agency falls into a given group (Nagin, 2005, pp. 11–15). The methods we use in this article improves this approach by statistically testing for distinct long-term trajectory groups in the data, and by quantifying uncertainty in group membership in the form of pos-terior probabilities. For these reasons, GBTM can advance research that com-pares outcomes between departments.
In addition to more accurately modeling the distribution of clearance rate trajectories, GBTM allows researchers to better study police performance over time. Of the large body of research on crime clearances, most studies are either case studies of agencies selected on 1 or 2 years of data (Carter & Carter, 2016; Davies, 2007; Wellford & Cronin, 1999; Wolfgang, 1958) or multivariate
6 Police Quarterly 0(0)
regressions using yearly changes over a period of time as the design (Jang, Hoover, & Lawton, 2008; Levitt, 1998; Liska, Chamlin, & Reed, 1985; Ousey & Lee, 2010; Puckett & Lundman, 2003). These types of analyses do not provide as strong of a basis for examining organizational differences as does an analysis that accounts for an agency’s complete history of clearance rates. A longitudinal design provides for a more thorough understanding of how an agency has per-formed over time relative to agencies of comparable size, because it can account both for overall trends and distinct changes in those trends across crime types. In this way, the current work advances our understanding of agency-level variation in crime clearances by providing a design that incorporates longitudinal trends and uses these historical patterns to select agencies for further study.
Before describing our research design, it is important to point out that some scholars have criticized the use of officially reported clearance rates as a measure of police performance. One criticism states that a focus on clearance rates (and thereby, arrests) misses the importance of proactive or preventative work of police agencies (Cook, 1979; Nagin, Solow, & Lum, 2015), which might be more valuable to crime reduction and the community. We strongly agree with the importance of studying the effectiveness of police preventative strategies in reducing crime and for including it as a measure of police perfor-mance. However, we also maintain that the study of police clearance rates and investigative strategies remains important. Citizens and politicians judge the police in large part by their ability to solve cases, and high-profile cases often make the news. One only needs to attend Compstat or managerial meetings to see that police executives are frequently concerned about the status of unsolved, high-profile cases. Additionally, particularly for serious vic-timizations involving violence and theft, police agencies devote significant amounts of resources to criminal investigations, often 10% to 20% of their annual budgets. In surveys of police executives, improving investigations was consistently identified as a research priority (International Association of Chiefs of Police, 2008).
Making a very different criticism but with no evidence to support it, Mosher, Miethe, and Hart (2011) called the clearance rate a “gross representation,” noting that it might be inflated for political reasons and suggested that using it as a measure of departmental effectiveness has “little or no scientific utility” (p. 93). To be brief, we find minimal scientific evidence to support the claims that police agencies systematically distort their figures or that differences in recording practices make comparing clearances across agencies a fruitless endeavor. Although there is anecdotal evidence and some weak statistical evidence of manipulation (Eterno & Silverman, 2010, 2012; Seidman & Couzens, 1974), the evidence does not come close to indicating that clearance rates are biased to the point Mosher and colleagues suggest.
In the remaining sections, we discuss how we calculated clearance rates and issues surrounding their interpretation, as well as the use of GBTM to
7 Scott et al.
understand heterogeneity in clearance trajectories. We follow this with descrip-tive “profiles” of agency groups that have unique clearance rate trajectories across multiple crime types, and report results from a series of multiple regres-sion analyses that examined the conditional relationship between several agency-level characteristics and clearance trajectories. Our trajectory group pro-files are meant to show that the clearance trajectory groups do differ in sub-stantively meaningful ways, and the multiple regressions are meant to demonstrate the extent of the relationship between trajectory group membership and relevant agency qualities. As part of a larger study funded by the Laura and John Arnold Foundation, our continued work involves selecting agencies that fall within the various clearance trajectory groups for an in-depth case analysis meant to more systematically understand the factors that identify successful (in terms of longitudinal clearances) police agencies from less successful ones.
Methods
Data and Sample
We examined clearance trajectories for homicide, robbery, aggravated assault, and burglary for agencies in the 100 largest U.S. cities as of 1980 for the years 1981 to 2013. The observation period was selected because of the greater adop-tion of automated records management systems among large agencies by the early 1980s, which has minimized the extent of incident and arrest variations within and between agencies (President’s Commission on Law Enforcement and Administration of Justice, 1967, pp. 25–27). Additionally, prior to 1980, many agencies were still not reporting their clearance rate data to the Federal Bureau of Investigation’s Uniform Crime Reporting (UCR) system (Vovak, 2016), the data source we use here (see below). As stated previously, we examined four crime types because our experience suggests that agencies gave these offenses investigative priority throughout this period, and, as a result, more consistently responded. We included only the larger U.S. jurisdictions in this analysis as they are likely to carry out their own investigations, dedicate resources to these par-ticular crime types, have enough offenses to provide stable estimates of clear-ance rate patterns, and are more similar in size than a larger sample.5
The clearance rates used in this study derive from the “Offenses Known and Clearances by Arrest” summary data as reported to the Federal Bureau of Investigation UCR program.6 The UCR program is a nation-wide statistical compilation of crime reporting and clearance data that is produced from data received from over 18,000 city, university or college, county, state, tribal, and federal law enforcement agencies voluntarily participating in the program. Each year it asks agencies to submit the total number of reported crimes (in various categories) and the total number of offenses cleared by arrest or exceptional means. It is important to note that an agency can report a crime as “cleared” in
8 Police Quarterly 0(0)
2012 that occurred in 2005, for example, but that number is counted as a 2012 clearance in the UCR. While this could present a problem when looking at any one given year of case clearances, our longitudinal approach alleviates this issue (albeit it does not eliminate it).
UCR presents crime and arrest figures in yearly datasets disaggregated by month, per year, for each crime type. To conduct trajectory analysis, we com-piled this data into yearly clearance rates by summing the data across all months for each year, for each agency, and for each crime type. We defined the clearance rate of any given crime as the total number of clearances for that year divided by the total numbers of crimes for that year. We did this separately for homicide, robbery, and burglary.7 For aggravated assaults, because the UCR collects all assaults (both misdemeanor/minor and felonious/aggravated), we parsed out only categories of aggravated assaults (“gun assault,” “knife assault,” “other weapon assault,” and “hand/feet assault”) to create our clearance rates. This process produced 33 annual clearance rates (1981–2013) for each of the four crime types we were interested in and for the 100 agencies in our sample.
For our descriptive profiles and regression analyses, we used information from the Law Enforcement Management and Administrative Statistics (LEMAS) data series. The LEMAS survey has been conducted periodically since 1987, with the latest survey in 2013. The individual surveys include infor-mation on characteristics of police agencies and their officers, though many of the variables are not consistent across collection periods. A major strength of LEMAS is the fact that it includes key pieces of information across much of our observation window. Therefore, we can show descriptively how our clearance groups differ on some of the factors that might explain changes in police clear-ance rates over time.8
The specific information we use from the LEMAS surveys includes the pro-portion of sworn officers per city population, police budget per crime level, the use of computers in crime analyses and investigations, and the proportion of sworn officers assigned to investigations (i.e., detectives). We have information on sworn officers and city population for every collection period, police budgets for every collection period except 1999, and computer use in crime analysis and crime investigation for every collection period except 2013. Unfortunately, information on the number of officers assigned to investigations was only collected in the 2007 and 2013 surveys, so we are restricted in our examination to recent detective rates. The descriptive statistics for the LEMAS variables are provided in the Appendix.
Trajectory Analysis
As described earlier, we believe average crime clearance trajectories mask con-siderable variability in change over time and are better conceptualized as rep-resenting a mixture of qualitatively distinct trajectories of change. It is this
9 Scott et al.
reason that we analyze the rates using GBTM (Nagin, 2005; Nagin & Land, 1993), a unique approach to examining long-term clearance rate trends. GBTM is based on a semiparametric, group-based modeling strategy that allows for longitudinal data for large numbers of units of analysis (see Jones, Nagin, & Roeder, 2001; Nagin, 1999, 2005; Nagin & Land, 1993). It is a finite mixture modeling application that uses trajectory groups to hypothesize about unknown subgroups in the population without assuming any particular population distri-bution (Nagin & Odgers, 2010). In short, this analytic device tests whether there are clearance trends in the aggregated data that are similar enough to some agency trends and distinct enough from other agency trends to represent unique groups of agencies. Using fit statistics, one can test for the optimal number of agency groupings and estimate the probability that a given agency falls into its assigned group. Using the number of groups, the number of agen-cies assigned to each group, and the visual trajectories, it is possible to describe agency clearance differences over time and select agencies for further study in a methodologically rigorous way. In this way, GBTM is often used for explor-atory analysis and to develop hypotheses to explain differences across certain groups (Nagin, 2005).
In 2005, Dan Nagin and his colleague Richard Tremblay spent much time explaining the method and its motivations (Nagin, 2005; Nagin & Tremblay, 2005a, 2005b), and trajectory modeling has enjoyed wide use in the field of criminology (Piquero, 2008). Trajectory modeling has faced a number of criticisms, including that it misrepresents the reality of extremely complex and chaotic social changes (Raudenbush, 2005), that despite claiming the opposite, it implies trajectories groups represent real groups (Sampson, Laub, & Eggleston, 2004; Sampson & Laub, 2005; Raudenbush, 2005), it is sensitive to the number of observations and years included in the analysis (Eggleston, Laub, & Sampson, 2004), the trajectories are biased by the average trend, thus deempha-sizing individual change (Bushway, Sweeten, & Nieuwbeerta, 2009), and it can lead to inaccurate conclusions (Bauer & Curran, 2003; Skardhamar, 2010; Warren, Luo, Halpern-Manners, Raymo, & Palloni, 2015). To be brief, we note that we have reviewed the multiple strengths and weaknesses of the method and believe it is an appropriate and useful method for our study. We are careful throughout this article to remember and emphasize that trajectory groups are merely a simplified statistical approximation to a more com-plex reality.
In our trajectory analyses, we follow the recommendations set forth by Nagin (2005) as well as prior research in selecting the optimal models and numbers of trajectory groups. This includes examining changes in the Bayesian and Akaike Information Criteria, the proportion of agencies assigned to the new group (we treat any group with less than 7% membership with added suspicion), the sta-tistical significance of the group orders and membership probabilities, and the trajectory plots to judge whether the new groups are substantively meaningful.
10 Police Quarterly 0(0)
It was only after applying all these criteria that we selected our final models. We did not use starting values, as the number of groups in each model remained low.9 Finally, while trajectory analysis is not overly sensitive to some missing data (Nagin, 2005), substantial amounts of missing data over consecutive years can cause analytic and conceptual problems. After consulting with trajectory modeling experts on the missing data issue, we eliminated agencies with 10 or more years of missing data as well as agencies with seven or more consecutive years of missing data for each crime type.10 This reduces the sample size to 86 agencies for aggravated assault and 92 agencies for the remaining crime types.11
Since our outcomes are yearly crime clearance rates that have roughly normal distributions, and because GBTM does not have an option for truncated out-comes, we modeled each outcome as censored normal.
In our Results section, we first present findings from the GBTM analyses that attempted to identify the unique trajectory groups in the clearance rate data for each crime type individually. Next, we show results from a multitrajectory model that estimated clearance rate trajectory groups across all four crime types simultaneously. Finally, we take the five trajectory groups estimated in our multitrajectory model and provide descriptive profiles of the groups using information from the LEMAS data previously described.
Results
Homicide
Following the procedure described in the previous section, we first attempted to model homicide clearance rates. Although we initially had difficulty getting a model to converge, we eventually tried increasing the maximum value for the outcome from 4 to 40 (a tenfold increase), which was successful.12 We found a four-group model to be optimal, which consisted of four linear trajectories—two increasing and two decreasing. As shown in Figure 3, around 60% of police agencies from 92 large cities were decreasing in the proportion of homicides they cleared from 1981 to 2013, while around 40% of agencies were increasing their homicide clearance rate during this time. In addition, regardless of slope of change, there was a sizable difference in the scale of the homicide clearance rates between agency groupings over time.
Aggravated Assault
As shown in Figure 4, our sample of large police agencies appears to fall into one of four trajectories for aggravated assault. Nearly 20% of the 86 police agencies cleared an average of 45% of their aggravated assaults in 1981, slowly decreasing over time to an average of 38%. We call this group the low decreasers. The next group, called medium stable, consisted of 35% of the
Figure 3. Trajectories of homicide clearance for largest agencies subsample (n ¼ 92).
Figure 4. Trajectories of aggravated assault clearance for largest agencies subsample (n 86). ¼
sample and evidenced a stable pattern clearing 50% to 55% of their aggravated assaults throughout the 33-year period. The next group, the high decreasers, cleared 70% of aggravated assault cases in 1981, decreasing to 60% in 2013. This group consisted of 30% of the sample. The final trajectory group displayed
12 Police Quarterly 0(0)
Figure 5. Trajectories of robbery clearance for largest agencies subsample (n ¼ 92).
Figure 6. Trajectories of burglary clearance for largest agencies subsample (n ¼ 92).
an unusual pattern, decreasing sharply from 70% in 1981 to 35% in the mid to late 2000s, but then slowly recovered to clearing around 50% of aggravated assault cases in 2013. We call this group the “decreasing recoverers,” and they make up 14.6% of the sample.
13 Scott et al.
Robbery
As shown in Figure 5, the first group in the five-group robbery model displayed an extremely low, stable pattern, which hovered around clearing 15% of rob-beries from 1981 to 2013. Although this group represented only 7 of the 92 agencies, we found their much lower clearance rate meaningfully distinct. The next group (mid stable), representing 40% of the sample, was also low and stable, but cleared around 20% of crimes over the period. The third group (mid increasers) increased from clearing 30% of robberies to 35% between 1981 and 2013. This group contained 19.5% of the sample. The next group showed a similar decreasing and recovering trajectory that was shown in the aggravated assault model, decreasing sharply from a 40% clearance rate in 1981 to a 20% clearance rate in the low to mid 2000s, and then increasing to 30% by 2013. This group held 18.3% of the sample. The final group, the high decreasers, represented 13.4% of the sample and decreased from 45% to the low-to-mid 30%s.
Burglary
The model selection for burglary proceeded the same way as for the other crime types, but more weight was placed on visual inspection of the graphs due to the uniformly low burglary clearance rates across agencies over the observation period. Although an eight-group model fit the data best according to informa-tion criteria, these eight groups were situated between clearance rates of 5% and 30%. This created an incredibly complex and uninformative picture of burglary clearances in America during this time. For example, splitting a group that is stable at 10% into two groups, one rising from 10% to 15% and one dropping from 10% to 5% does not seem practically informative, though it may create a more optimal group solution. For this reason, after modeling burglary and looking at the resulting graphs, the authors chose to select a two-group model, with one group low and stable at 10%, and another group higher and decreasing from 20% to around 12% (see Figure 6). The lower group comprised 60% of the sample and the higher 40%. Again, this parsimonious model rep-resented a clear finding present in the higher group models—some groups were low and stable and some groups were high and decreasing—while having the benefit of being more comprehensible.
Multitrajectory Model
One question that arose from our analyses was whether agencies that followed a certain clearance trajectory for one crime type (e.g., high increasing homicide trajectory) were likely to follow a similar trajectory for another crime type (e.g., high decreasing assault trajectory). In other words, if agencies were improving in their ability to solve homicides over time, were they also improving in their
14 Police Quarterly 0(0)
ability to clear aggravated assaults relative to other agencies. While GBTM is useful for describing latent classes in one longitudinal outcome, it is limited to describing one outcome at a time. Past research has utilized joint trajectory modeling, which allows a researcher to link trajectory models across two out-comes. In our analysis of four crime types, joint trajectory modeling would not be helpful because displaying the results from multiple tables of joint and con-ditional probabilities would be unmanageable. Fortunately, a recent advance in trajectory modeling includes multitrajectory modeling, a technique that esti-mates trajectory groups for multiple outcomes simultaneously. This provides us with a more manageable way of describing heterogeneity in clearance rate trajectories across all four crime types (Jones & Nagin, 2007; Nagin et al., 2016).13 The result of this multitrajectory analysis is shown in Figure 7.
Following the same technique for choosing the optimal number of groups to include in the model, we decided on a five-group final model. The most straight-forward way of interpreting the results is to examine whether patterns exist across crime types within each group. As predicted from the overall trend, most agencies show patterns of decreasing clearance rates across crime types.
Figure 7. Multitrajectory model of crime clearance rates (n ¼ 86).
Some significant differences stand out, though. For example, although agencies in both Group 1 and Group 4 display decreasing trends across crime types, the agencies in Group 4 cleared more crimes throughout the period for every crime type. Agencies in Group 5 and Group 4 have similar trajectories for every crime type except homicide, where Group 5 shows a stable pattern, clearing around 90% of homicides for over 30 years. In addition, agencies in Group 5 consis-tently cleared more crimes than agencies in Group 4 across all crime types.
Moving from an examination of groups at the extreme, we see a more com-plex picture unfold for the middle groups. For example, the agencies in Group 2 showed improvements in clearance rates during the first half of the observation period, which began declining in the second half. Group 3 displays the opposite pattern of Group 2 for most crime types, showing declining clearance rates during the first part of the period, followed by a recent increase in clearance rates. Interestingly, Group 2 showed a steadily increasing robbery clearance rate while showing less positive changes in clearance rates for the other crime types, especially homicide.
In sum, these results suggest most agencies followed similar clearance trajec-tories for multiple crime types, and that agencies that outperformed (or under-performed) other agencies in clearing one crime type did the same for other
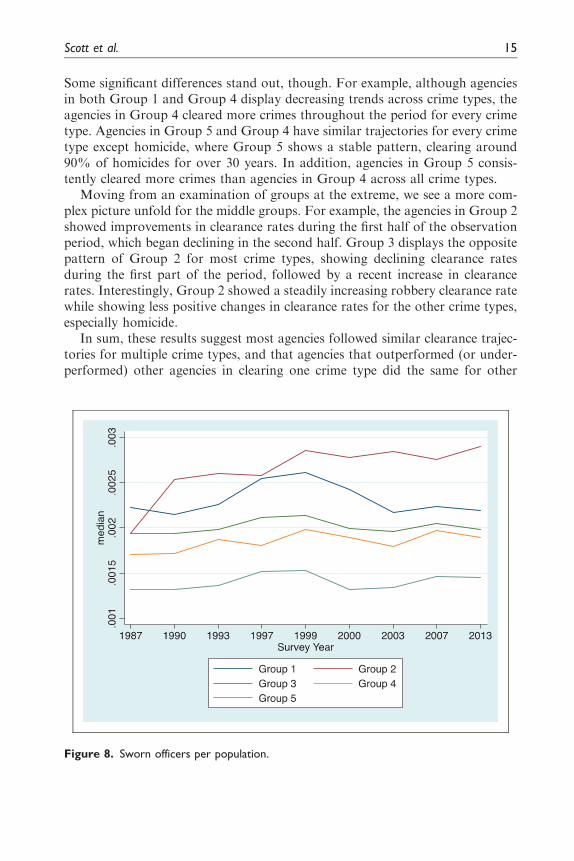
Figure 8. Sworn officers per population.
16 Police Quarterly 0(0)
crime types. The results also show that while most agencies demonstrated a linear declining clearance rate across crime types, some agencies were able to avoid that pattern for a particular crime. Other agencies had distinct periods of improving and worsening performance over the last 30 years across crime types. These results have the potential to help agencies determine their strengths and weaknesses relative to similarly sized agencies and to evaluate how their current performance relates to their longer history of crime clearances. As an additional check that we are not merely capturing random noise in clearance trajectory distributions, we next examine whether these five groups differed over time on meaningful agency-level characteristics.
Descriptive Profiles
The current analysis is purely descriptive. It is meant to demonstrate how agency-level clearance rates are distributed around the average over time for different crime types. Thus, at this time, we do not attempt to identify factors that may explain agency-level differences in longitudinal trajectories.14
However, it is useful to show whether the agency groupings estimated in our multitrajectory analysis reflect substantively different agencies outside of their
clearance rates and the conditional associations between trajectory group mem-
bership and important agency-level factors. For this reason, we provide profile plots for five agency-level factors—the proportion of sworn officers per city population (Figure 8), the police budget per crime level (Figure 9), the propor-tion of agencies within each trajectory group that use computers for crime anal-ysis (Figure 10) and crime investigation (Figure 11), and recent detective rates (Figure 12). We selected these variables because past research includes them in agency-level analyses, and at face value, they may explain trends. Our explana-tion is based on the trajectory groups, as we describe how each group relates to the other trajectory groups across the five variables.
Looking at the plots, Groups 2 and 5 from the multitrajectory analysis appear to be the most distinct. Going back to Figure 7, we see that these groups differed greatly in their clearance trajectories across crime types. Group 5, which included six agencies, had a decreasing clearance trajectory for every crime type except homicide, and its trajectories were higher than the other groups over time. The agencies in this group were especially effective at clearing homicides, as they cleared around 90% of homicides over the last three decades. Group 2, on the other hand, had a decreasing homicide clearance trajectory, a low but increasing robbery trajectory, and an increasing but stabi-lizing and then decreasing trajectory for aggravated assault and burglary. In
Figure 10. Proportion of agencies use computers for analysis.
18 Police Quarterly 0(0)
Figure 11. Proportion of agencies use computers for investigation.
addition, compared to the other groups, the 12 agencies in Group 2 had some of the lowest clearance rates over time. From the profiles above, we can see that these agencies appear different from each other in ways other than their clear-ance trajectories. Compared to Group 5, Group 2 had a much higher and increasing rate of sworn officers per city population, more money per reported level of crime, and were less likely to use computers for crime analysis in the 80s and early 90s. In addition, these agencies had more detectives per sworn officers in both 2007 and 2013, though their rate of increase was less than that of Group 5. Understanding why the group of agencies with the most money, officers, and detectives had much lower clearance rates over time compared to the agencies with some of the least amount of resources is the focus of our in-depth case analysis, which is ongoing.
The remaining groups include Groups 1, 3, and 4. The agencies in Group 1 performed the worst over time, having decreasing clearance trajectories across all crime types, which both started and ended at the lowest values. Groups 3 and 4 were fairly similar in their trajectory shapes over time, though Group 4 cleared more crimes across crime types. Looking at their profiles, we see that Group 1 had more sworn officers per population and investigators per sworn officers
19 Scott et al.
Figure 12. Investigators per sworn officers.
compared with Groups 3 and 4. Except for Group 5, Group 4 had the lowest proportion of sworn officers and investigators per sworn officers. In addition, compared with Groups 1 and 3, Group 4 was slower to use computers in its crime investigations. As stated previously, we are not suggesting from our anal-ysis that these factors have any causal relevance to the clearance rates. To understand that better, we are currently conducting a more in-depth case analysis of agencies built from these trajectory groupings (see Lum et al., 2018). The profiles provided here merely suggest that, rather than being caused by random variation, the clearance trajectory groups differ substantively from each other.15 Even though we cannot presently explain group membership, it is useful to examine the conditional associations between the agency-level var-iables and trajectory group memberships to understand the extent of each rela-tionship. For this reason, we next conducted multiple regression analyses predicting trajectory membership.
To examine the conditional association between each agency-level factor and the likelihood of being in a certain trajectory group, we conducted both multinomial and ordinal logistic regression analyses. The outcome in each of these regression models was the likelihood of being in one of the
trajectory groups from our multitrajectory analysis compared with the others. Although classifying an agency as falling into its assigned trajectory group in a postestimation regression ignores uncertainty in the group assignment process, this is not a concern if group assignment is estimated with high certainty. In our multitrajectory analysis, the posterior probability of group membership was 0.99 or higher for each group, giving us confidence to proceed with the regres-sions. Whenever the outcome is assignment to a trajectory, it is impossible to establish temporal order unless the covariate precedes the entire trajectory period. For this reason, we included in the regression models the average across survey periods of each LEMAS variable excluding investigators per sworn officer, for which there were only two data points. Even though the five trajectory groups demonstrated unique patterns across crime types, we conducted an ordinal logistic regression because of the clear pattern of increas-ing clearance rates moving from Group 1 to Group 5. In the multinomial logistic regressions, we examined the conditional association between each covariate and the likelihood of being in one trajectory group compared with another while alternating reference categories.
Results from these regressions, which are available upon request, showed no consistent associations between the agency-level covariates and the likelihood of trajectory assignment. The ordinal logistic regression suggested a negative rela-tionship between the likelihood of being in a higher trajectory group and the average number of officers per population between 1987 and 2013 (p < 0.05) net the average budget per crime level and the average use of computers either for investigative or analytic purposes. However, this relationship did not materialize in the multinomial regression analyses. There was only one statistically signifi-cant finding in the multinomial regression analyses—an increase in the average use of computers for analysis between 1987 and 2007 was associated with an increase in the likelihood of assignment to trajectory Group 3 compared with trajectory Group 2 (p < 0.05) net the other factors. The lack of statistically significant findings in these regression models reinforces the need for more rig-orous research within police departments to understand how more nuanced agency-level features and case characteristics relate to crime clearances. We have completed such research on our high- and low-performing agencies. Those results will appear in a forthcoming article.
Discussion
When examining clearance rate trajectories at the aggregate level for serious crimes, a story of stable clearance rates emerges over the lengthy period of study (1981–2013). This stability despite advances in investigative practices and technologies has perhaps led to a belief that police have little control over clearance rates. However, we hypothesized that this overall trend masks qualitatively distinct variation across agencies. With the exception of Worrall
21 Scott et al.
(2016), past scholars have failed to explain how clearance trajectories are dis-tributed around the average. In our analyses, we found substantial agency-level variation in clearance rate trajectories both across individual crime types and after modeling the four crime types simultaneously. Our findings reinforce Worrall’s (2016) findings, but for more specific crime types and for a much longer period of time. In other words, it appears that some law enforcement agencies are consistently better (or worse) at clearing particular kinds of crime compared with their counterparts. In addition, we identified differences in pat-terns of change across trajectory groups and crime types.
Our analysis goes beyond merely suggesting variability in longitudinal police clearance rates. Our statistical analysis revealed that clearance rates from police agencies in large cities changed in qualitatively distinct ways over the last 30 years. One example of this is the finding that despite an average decreasing homicide clearance rate, a full 40% of police agencies in our sample demon-strated an increasing rate over time. This finding that the average homicide clearance trajectory for comparably large police departments over the years 1981 to 2013 represents a mixture of statistically identifiable groups of agen-cies—60% decreasing and 40% increasing over time—suggests there are ways for departments to improve their clearance rates.
The results for robbery and burglary provide additional support for this idea. Although the average clearance trajectories for robbery and burglary were flat, the results from our GBTMs revealed unique patterns. Regarding robbery, only around 50% of the sample demonstrated a flat trajectory. The remaining agen-cies either improved their robbery clearance rate over time (20%) or worsened in their ability to solve robberies (30%). For burglary, the average flat rate masked two types of agencies—one group that consistently cleared only about a tenth of their burglaries over the last 30 years and one group that cleared almost twice as many burglaries in the early 1980s and declined over time. These differences are more than just variation around the average. Instead, they are qualitative differ-ences that were conceivably influenced by organizational and other changes within the departments over time. Overall, the findings from each GBTM, along with the results from Worrall’s (2016) trajectory analysis, reemphasize the need to study the organizational and case determinants of crime clear-ance patterns.
Another example of the qualitative differences not apparent when looking at average crime clearances comes from our multitrajectory model, which estimat-ed whether there were unique clearance trajectory groups across multiple crime types simultaneously. Findings from this model revealed both an overall pattern of some agencies consistently clearing a greater proportion of cases across crime types as well as unique patterns across crime types. For example, although agencies from Groups 4 and 5 followed similar clearance trends for most crime types, the small number of agencies in Group 5 maintained a relatively stable homicide clearance rate over the last 30 years, whereas the homicide
22 Police Quarterly 0(0)
clearance rate for agencies in Group 4 declined over time. Whether actions taken by the agencies in Group 5 had anything to do with this distinction is an open question and the subject of our ongoing work. For now, the finding suggests that at the least scholars should recognize the substantial heterogeneity within average crime clearance rates.
Other findings that stand out from the multitrajectory model include the differences between agencies in Group 2 and Group 3. Agencies in Group 3 cleared a moderate amount of crimes in the 1980s compared with the other agencies in our sample, but then declined in their performance across crime types until about 2000 when they began to improve. Agencies in Group 2, on the other hand, performed relatively poorly in the beginning of the observation-al period but improved in their ability to solve robberies, assaults, and burglaries throughout the 1980s and 1990s. In the 1990s, these agencies began to decline again for assault and burglary, but they were the only agencies that demonstrat-ed an almost monotonically increasing clearance trajectory for robbery. Again, this research does not answer why the agencies in Group 2 were the only agen-cies that consistently increased their robbery clearance rate, or why the 2000s were a time of improvement for agencies in Group 3 and a time of disappoint-ment for agencies in Group 2. The results do suggest, however, that when het-erogeneity is modeled across police departments, patterns of crime clearances look quite different from the average pattern and appear deserving of more in-depth research.
Importantly, all of our results emerged after using analytic devices that sta-tistically tested whether differences derived from random variation and accounted for error in group assignment. The estimated trajectories also accounted for the complete history of an agency’s clearance performance, rather than simple year-to-year changes. Consequently, trajectory modeling more adequately distinguished agencies based on their longitudinal pattern of case resolution compared with past analytic approaches. Taken together, our results suggest that agency-level variation in crime clearance patterns is more complex than previous work has acknowledged. Future research on clearances should consider these group-based differences when selecting agencies for study and when interpreting results from limited samples of agencies.
To further attest that these group-based differences were not due to random noise in the clearance rate data, we used the results from our multitrajectory model and data from LEMAS to provide descriptive profiles for several substan-tive agency-level variables. Then, we estimated conditional associations between these variables and the likelihood of group assignment. The descriptive results revealed that the trajectory groups did differ somewhat systematically across agency-level variables, suggesting that the clearance trajectory groups reflect sub-stantively distinct agencies outside of clearance rates. However, results from
23 Scott et al.
ordinal and multinomial regression analyses suggested that none of the factors were consistently related to the likelihood of trajectory group assignment.
Since the present analysis was purely descriptive, these regression analyses were not meant to explain group membership, and a rigorous test was not con-ducted to identify the causes of clearance rates. Instead, we simply sought to estimate the relative relationship of each variable to crime clearance trajectories. The lack of significant findings may suggest that researchers need to conduct more nuanced research to explain departmental differences in clearance trajectories. More important than a department’s budget or number of officers may be how the department structures its criminal investigations, the extent of communica-
tion between investigative units and patrol, the relationship between investigative units and district attorneys, and other more difficult-to-measure qualities.
A great deal more research is needed to discern why agencies vary in the ability to clear crime. To date, prior work has most often compared agencies on year-to-year changes in crime clearance rates instead of comparing longitudinal patterns among similarly situated agencies. By using data over a lengthy period and estimating relative trajectory groups, the current analysis offers a more accurate and reliable method of comparing agencies according to crime clear-ance rates. Our ongoing work focuses on identifying the factors that may have produced these group differences in clearance trajectories by selecting agencies from the multitrajectory model for a comparative in-depth analysis, using both qualitative and quantitative approaches.
Although trajectory modeling has limitations, its major strength lies in its ability to reveal differences in the distribution of a longitudinal outcome. If one’s theory leads them to conclude that individuals or organizations have responded very differently to their environment over time, which has produced distinct patterns of change in an outcome, then GBTM provides an excellent way to simplify longitudinal differences and provide a more accurate represen-tation of the distribution of an outcome. In our case, the use of trajectory modeling allowed us to demonstrate that agency clearance rates differed in marked ways from the national average rate over time and across crime type, suggesting that a group-based approach is a more accurate way to model clear-ance rates in future empirical work and discussion (see also Worrall, 2016). Compared with prior work, our analysis also allowed us to account for uncer-tainty in trajectory group membership, giving us more confidence in group assignments. This is an innovative approach to understanding clearance rate trends, but we also emphasize the practical focus for our analysis: Statistically identifying agencies with unique long-term clearance rate trends (or “trajectories”) provides a solid basis for deeper quantitative and qualitative analysis and case study about why agencies have differed over time in the effec-tiveness of their responses to crime.
Note. NA ¼ not applicable; Comp analy ¼ computers for analysis; Comp invest ¼ computers for investigations. aTotal number of observations out of the 86 agencies used in our final analysis. bThe response options for these questions differed slightly in this survey, which appeared to cause a drop in the number of agencies stating they used computers in crime analysis.
25 Scott et al.
Declaration of Conflicting Interests
The authors declared no potential conflicts of interest with respect to the research, authorship, and/or publication of this article.
Funding
The authors disclosed receipt of the following financial support for the research, author-ship, and/or publication of this article: This work was funded by a grant from the Laura and John Arnold Foundation.
Notes
1. Federal Bureau of Investigation’s Crime in the United States, 2016 (https://ucr.fbi. gov/crime-in-the-u.s/2016).
2. See http://www.albany.edu/sourcebook/pdf/t4202011.pdf for a table of national annual clearance rates.
3. In this article, we focus on these four offense types because they are the focus of police investigative efforts. Although investigative resources are also devoted to sexual assaults, this offense category has proven difficult to measure in longitudinal studies.
4. See Lum et al. (2011), Lum and Koper (2017), and also http://cebcp.org/evidence-based-policing/the-matrix/
5. We also conducted a separate trajectory analysis for agencies with 100 or more officers (n=519 for homicide, 729 for robbery, 673 for aggravated assault, and 757 for burglary) but decided to present the large-agency sample due to the reasons just mentioned.
6. Due to the lengthy time period of data needed, the UCR data were obtained from the Inter-university Consortium for Political and Social Research (ICPSR) website (http://www.icpsr.umich.edu/).
7. The 2004 UCR Handbook defines criminal homicide as (a) murder and nonnegligent manslaughter and (b) manslaughter by negligence. We restrict our analysis to the first category but use the term homicide for brevity’s sake.
8. As mentioned earlier, GBTM allows one to statistically test whether subgroups in a population reflect random variation. We expand on this capability by comparing our estimated trajectory groups using several theoretically relevant variables from the LEMAS surveys. This is to provide further evidence that the estimated trajectory groups are picking up meaningful between-agency differences, not to suggest any of these variables causally influence clearance rates.
9. Leading scholars in trajectory modeling suggest that the use of starting values does not appear necessarily in trajectory models that result in a small number of trajectory groups like ours did (Trends in group-based trajectory modeling panel, 2015 ASC meeting in Washington, DC). In addition, we tried to present as simple a model as possible that still represented the major differences in the data rather than trying to identify the exact number of groups that existed in the data. A forthcoming article by Sweeten and Hannula (2015) should provide researchers more information regarding the use of starting values in GBTM.
10. Remarkably, around 65 of the 100 agencies were not missing data on a single crime-
year between 1981 and 2013. 11. Florida agencies failed to report arrests for aggravated assaults throughout the
time period. 12. The outcome is the yearly homicide clearance rates, which can be higher than one if
past homicides were solved that year. One of the authors had success with this practice in the past. Although to our knowledge it is not documented anywhere in the trajectory modeling literature, it was deemed a suitable strategy after speaking with experts.
13. Because the likelihood function in the multitrajectory model is defined by a set of trajectories from each of the four crime types, the estimated groups may not reflect trajectories from any of the single outcome models. To see whether our results differed greatly from the single outcome models, we compared group assignments in the multi-
trajectory model to sum probability-weighted and hard counts from the single out-come models. We found that the agency groupings from the multitrajectory model consistently corresponded to placements in the hard and weighted distributions of summed group numbers across the single outcome models (contact author for results).
14. We believe that case studies provide one of the best alternatives to causal explanation when current secondary data are insufficient to answer research questions and pursue this approach as part of a larger research project. As discussed, identifying distinct trajectory groups is both a valuable first step in case analysis and a scientific contribution.
15. In addition to examining the five LEMAS variables, we conducted a joint trajectory analysis using crime rates over the same period. Although we found some group-based negative associations across crime types, we chose to focus on the policing variables because they are more pertinent to our overall investigation and a recent study analyzed the group-based association between clearance and crime rates in much more depth (Vovak, 2016).
ORCID iD
Thomas L. Scott http://orcid.org/0000-0002-8033-8372
References
Bauer, D. J., & Curran, P. J. (2003). Distributional assumptions of growth mixture models: Implications for overextraction of latent trajectory classes. Psychological Methods, 8(3), 338–363.
Braga, A. A., & Dusseault, D. (2018). Can homicide detectives improve homicide clear-ance rates? Crime and Delinquency, 64(3), 283–315.
Braga, A. A., Flynn, E., Kelling, G. L., & Cole, C. M. (2011). Moving the work of criminal investigators towards crime control. New Perspectives in Policing (pp. 1– 37). Washington, DC: U.S. Department of Justice, National Institute of Justice.
Bushway, S., Sweeten, G., & Nieuwbeerta, P. (2009). Measuring long term individual trajectories of offending using multiple methods. Journal of Quantitative Criminology, 25(3), 259–286.
Bynum, T. S., & Varano, S. P. (2003). The anti-gang initiative in Detroit: An aggressive enforcement approach to gangs. In S. H. Decker (Ed.), Gangs, youth violence and community policing (pp. 214–238). Belmont, CA: Wadsworth.
Carter, D. L., & Carter, J. G. (2016). Effective police homicide investigations evidence from seven cities with high clearance rates. Homicide Studies, 20(2), 150–176.
Cook, P. J. (1979). The clearance rate as a measure of criminal justice system effective-ness. Journal of Public Economics, 11(1), 135–142.
Coupe, R. T. (2016). Evaluating the effects of resources and solvability on burglary detection. Policing and Society, 5, 563–587.
Cronin, J. M., Murphy, G. R., Spahr, L. L., Toliver, J. I., & Weger, R. E. (2007). Promoting effective homicide investigation. Washington, DC: Police Executive Research Forum (PERF).
Davies, H. J. (2007). Understanding variations in murder clearance rates: The influence of the political environment. Homicide Studies, 11(2), 133–150.
Eck, J. E. (1983). Solving crimes: The investigation of burglary and robbery. Washington, DC: Police Executive Research Forum (PERF).
Eck, J. E., & Wartell, J. (1998). Improving the management of rental properties with drug problems: A randomized experiment. Crime Prevention Studies, 9, 161–185.
Eggleston, E., Laub, J. H., & Sampson, R. J. (2004). Methodological sensitivities to latent class analysis of long-term criminal trajectories. Journal of Quantitative Criminology, 20(1), 1–26.
Eterno, J. A., & Silverman E. B. (2010). The NYPD’s Compstat: Compare statistics or compose statistics? International Journal of Police Science & Management, 12(3), 426–449.
Eterno, J. A., & Silverman, E. B. (2012). The crime numbers game: Management by manipulation. Boca Raton, FL: Taylor & Francis Group.
Federal Bureau of Investigation. (2016). Crime in the U.S., 2016. Retrieved from https:// ucr.fbi.gov/crime-in-the-u.s/2016
Fox, B. H., & Farrington, D. P. (2015). An experimental evaluation on the utility of burglary profiles applied in active police investigations. Criminal Justice and Behavior, 42(2), 156–175.
Greenwood, P. W., & Petersilia, J. (1975). The criminal investigation process volume I: Summary and policy implications. Santa Monica, CA: RAND.
Higginson, A., Eggins, E., & Mazerolle, L. (2017). Police techniques for investigating serious violent crime: A systematic review. Trends and Issues in Crime and Criminal Justice, 539, 1–13. Canberra, Australia: Australian Institute of Criminology.
International Association of Chiefs of Police. (2008). Improving 21st Century Policing through Priority Research: The IACP’s National Law Enforcement Research Agenda. Virginia: Author.
Jang, H., Hoover, L. T., & Lawton, B. A. (2008). Effect of broken windows enforcement on clearance rates. Journal of Criminal Justice, 36(6), 529–538.
Jolin, A., Feyerherm, W., Fountain, R., & Friedman, S. (1998). Beyond arrest: The Portland, Oregon domestic violence experiment. Washington, DC: National Institute of Justice, U.S. Department of Justice.
Jones, B. L., & Nagin, D. S. (2007). Advances in group-based trajectory modeling and an SAS procedure for estimating them. Sociological Methods & Research, 35(4), 542–571.
Jones, B. L., Nagin, D. S., & Roeder, K. (2001). A SAS procedure based on mixture models for estimating developmental trajectories. Sociological Methods & Research, 29(3), 374–393.
Keel, T., Jarvis, J., & Muirhead, Y. (2009). An exploratory analysis of factors affecting homicide investigations. Homicide Studies, 13, 50–68.
Koper, C., Taylor, B. G., & Woods, D. (2013). A randomized test of initial and residual deterrence from directed patrols and use of license plate readers at crime hot spots. Journal of Experimental Criminology, 9(2), 213–244.
Levitt, S. D. (1998). Why do increased arrest rates appear to reduce crime: Deterrence, incapacitation, or measurement error? Economic Inquiry, 36(3), 353–372.
Liska, A. E., Chamlin, M. B., & Reed, M. D. (1985). Testing the economic production and conflict models of crime control. Social Forces, 64(1), 119–138.
Lum, C., & Koper, C. S. (2017). Evidence-based policing: Translating research into prac-tice. Oxford, England: Oxford University Press.
Lum, C., Koper, C. S., & Telep, C. (2011). The evidence-based policing matrix. Journal of Experimental Criminology, 7(1), 3–26.
Lum, C., Wellford, C., Scott, T. L., Vovak, H., & Scherer, A. (2018). Identifying effective investigative practices: A National Study Using Trajectory Analysis, Case Studies, and Investigative Data. Final Report to the Laura and John Arnold Foundation. Fairfax, VA: George Mason University.
Martin, S., & Sherman, L. W. (1986). Selective apprehension: A police strategy for repeat offenders. Criminology, 24(1), 155–172.
Mosher, C. J., Miethe, T. D., & Hart, T. C. (2011). The mismeasure of crime. Thousand Oaks, CA: Sage Publications.
Nagin, D. S. (1999). Analyzing developmental trajectories: A semiparametric, group-based approach. Psychological Methods, 4(2), 139–157.
Nagin, D. S. (2005). Group-based modeling of development. Cambridge, MA: Harvard University Press.
Nagin, D. S., Jones, B. L., Passos, V. L., & Tremblay, R. E. (2016). Group-based multi-
trajectory modeling. Statistical Methods in Medical Research, 0(0), 1–9. Nagin, D. S., & Land, K. C. (1993). Age, criminal careers, and population heterogeneity:
Specification and estimation of a nonparametric, mixed Poisson model. Criminology, 31(3), 327–362.
Nagin, D. S., & Odgers, C. L. (2010). Group-based trajectory modeling in clinical research. Annual Review of Clinical Psychology, 6, 109–138.
Nagin, D. S., Solow, R. M., & Lum, C. (2015). Deterrence, criminal opportunities, and police. Criminology, 53(1), 74–100.
Nagin, D. S., & Tremblay, R. E. (2005a). Developmental trajectory groups: Fact or a useful statistical fiction? Criminology, 43(4), 873–904.
Nagin, D. S., & Tremblay, R. E. (2005b). What has been learned from group-based trajectory modeling? Examples from physical aggression and other problem behav-iors. In R. J. Sampson & J. H. Laub (Eds.), Developmental criminology and its dis-contents: Trajectories of crime from childhood to old age (pp. 82–117). Thousand Oaks, CA: Sage Publications.
Nunn, S., Quinet, K., Rowe, K., & Christ, D. (2006). Interdiction day: Covert surveil-lance operations, drugs, and serious crime in an inner-city neighborhood. Police Quarterly, 9(1), 73–99.
Ousey, G. C., & Lee, M. R. (2010). To know the unknown: The decline in homicide clearance rates, 1980-2000. Criminal Justice Review, 35(2), 141–158.
29 Scott et al.
Piquero, A. R. (2008). Taking stock of developmental trajectories of criminal activity over the life course. In A. M. Liberman (Ed.), The long view of crime: A synthesis of longitudinal research (pp. 23–78). New York, NY: Springer.
President’s Commission on Law Enforcement and Administration of Justice. (1967). The challenge of crime in free society. Washington, DC: The Commission.
Puckett, J. L., & Lundman, R. J. (2003). Factors affecting homicide clearances: Multivariate analysis of a more complete conceptual framework. Journal of Research in Crime and Delinquency, 40(2), 171–193.
Raudenbush, S. W. (2005). How do we study “what happens next”? In R. J. Sampson & J. H. Laub (Eds.), Developmental criminology and its discontents: Trajectories of crime from childhood to old age (pp. 131–144). Thousand Oaks, CA: Sage Publications.
Ritter, N. (2008). DNA solves property crimes (but are we ready for that?). National Institute of Justice Journal, 261, 2–12.
Sampson, R. J., & Laub, J. H. (2005). Seductions of method: Rejoinder to Nagin and Tremblay’s developments trajectory groups: Fact or fiction. Criminology, 43(4), 905–913.
Sampson, R. J., Laub, J. H., & Eggleston, E. P. (2004). On the robustness and validity of groups. Journal of Quantitative Criminology, 20(1), 37–42.
Seidman, D., & Couzens, M. (1974). Getting the crime rate down: Political pressure and crime reporting. Law & Society Review, 8(3), 457–494.
Skardhamar, T. (2010). Distinguishing facts and artifacts in group-based modeling. Criminology, 48(1), 295–320.
Source Book of Criminal Justice Statistics. Retrieved from http://www.albany.edu/source book/pdf/t4202011.pdf
Spergel, I. A., Wa, K. M., & Sosa, R. V. (2002). Evaluation of the Mesa Gang Intervention Program (MGIP). Washington, DC: Office of Juvenile Justice and Delinquency Prevention.
Sweeten, G., & Hannula, K. V. (2015, November). Where you start affects where you end up: Using starting values to avoid local solutions in group-based trajectory models. Presented at the 2015 meeting of the American Society of Criminology, Washington, DC.
Travis, J., Western, B., & Redburn, S. (2014). The growth of incarceration in the United States: Exploring causes and consequences. Washington, DC: National Academy Press.
Uniform Crime Reporting Handbook. (2004). Retrieved from https://ucr.fbi.gov Vovak, H. (2016). Examining the relationship between crime rates and clearance rates using
dual trajectory analysis (Unpublished doctoral dissertation). George Mason University, VA.
Warren, J. R., Luo, L., Halpern-Manners, A., Raymo, J. M., & Palloni, A. (2015). Do different methods for modeling age-graded trajectories yield consistent and valid results? American Journal of Sociology, 120(6), 1809–1856.
Wellford, C., & Cronin J. (1999). An analysis of variables affecting the clearance of homicides: A multistate study. Washington, DC: Justice Research and Statistics Association.
Wellford, C., & Cronin, J. (2000). Clearing up homicide clearance rates. National Institute of Justice Journal, 243, 1–7.
Wolfgang, M. E. (1958). Patterns in criminal homicide. Philadelphia: University of Pennsylvania Press.
Worrall, J. L. (2016). Investigative resources and crime clearances: A group-based tra-jectory approach. Criminal Justice Policy Review. Manuscript submitted for publica-tion. doi:10.1177/0887403416650251
Author Biographies
Thomas L. Scott is a PhD candidate in the Department of Criminology and Criminal Justice at the University of Maryland. His dissertation tests multiple criminological theories of the effect of incarceration on reoffending using methods for longitudinal data analysis and data from the Pathways to Desistance study.
Charles Wellford is Professor Emeritus at the University of Maryland. He is the co-PI for this project. His current research is on homicide clearances, effective-ness of gun background checks, and models of hot spots prioritization. He is chair of the PERF advisory board and a member of the IACP research advisory committee.
Cynthia Lum is a professor of Criminology, Law, and Society at George Mason University, where she is the director of its Center for Evidence-Based Crime Policy. Her new book, with Christopher Koper, is Evidence-Based Policing: Translating Research Into Practice (Oxford University Press, 2017).
Heather Vovak is an analyst at HNTB. She completed her PhD in Criminology, Law, and Society at George Mason University in 2016. She received her MA in Political Science from the University of Akron in 2011 and her BS in Political Science and Psychology from Heidelberg University in 2005. Her research inter-ests include evidence-based policing, the relationship between clearance rates and crime rates, police investigations, and research methods.