16
Variables II, Comparisons, and the Epidemiology of Traffic Safety
| Date post: | 25-Dec-2015 |
| Category: |
Documents |
| Upload: | amberlynn-wright |
| View: | 216 times |
| Download: | 2 times |

Variables II, Comparisons, and the Epidemiology of Traffic Safety

William Haddon and the Epidemiology of Traffic Safety
Two ways to decrease the number and severity of injuries from automobile accidents:
1.) active approach
2.) passive approach

Why the passive approach?“inattentional blindness” and the missing gorillaD. Simons’ psychology research (Harvard)

The Debate Within the Passive Approach• David Strayer (Univ. of Utah psychologist) study on cell-phone
usage while driving
• seat belts vs. air bags -- What did the data show?
• What was William Haddon’s “mistake”?
• What is the “blindness of ideology”?e.g., example of Australia’s state of Victoria in early 1970s
• Compulsory laws/requirements can be invaluable/helpfule.g., UR’s field of study requirements?
vaccinations before Kindergarten and College?mandatory salary deductions for retirement (“Social
Security/Medicare”)mandatory blood tests for marriage certificates, college admissions?

Big and Bad: How the SUV Ran Over Automotive SafetyCultural anthropologist G. Clotaire Rapaille’s focus group surveys:
“cortex” vs. “reptilian” levels of consciousness
- Porsche (active safety) vs. TrailBlazer (passive safety)
braking test from 60 m.p.h. to stopped:Porsche (124 feet) TrailBlazer (150 feet)
Porsche Boxster Chevrolet Trailblazer

When Drivers Decided to Treat Accidents as Inevitable rather than Avoidable, “Feeling Safe Become More Important than Actually Being Safe”
35-m.p.h. crash test
Cadillac Escalade vs. Ford Windstar
16% chance of a life-threatening head injury 2%
20% chance of a life-threatening chest injury 4%
35% chance of a leg-injury 1%
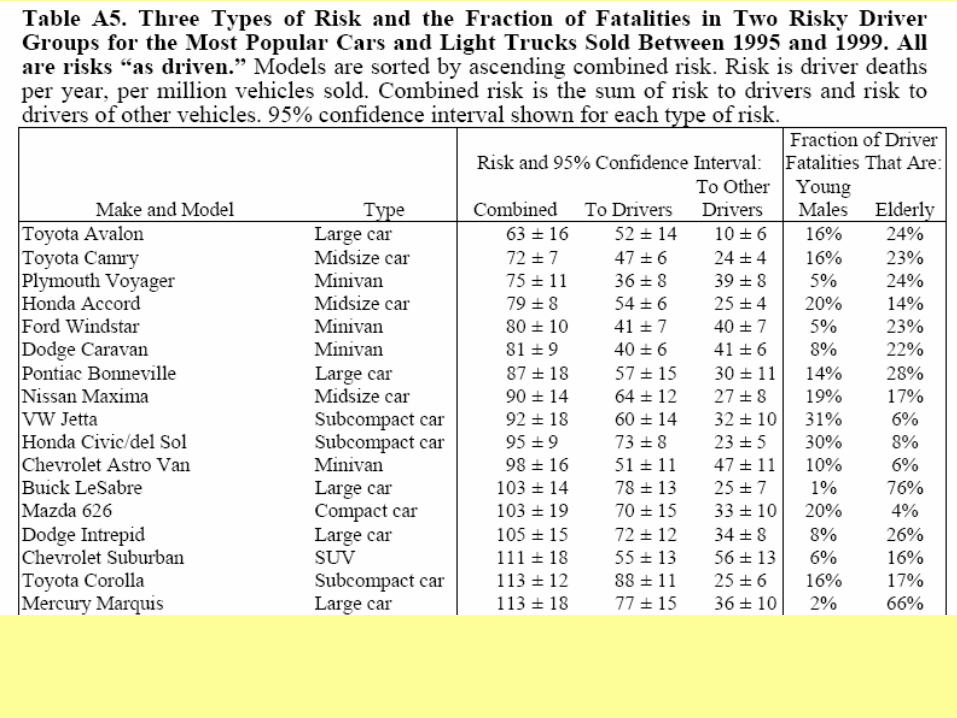
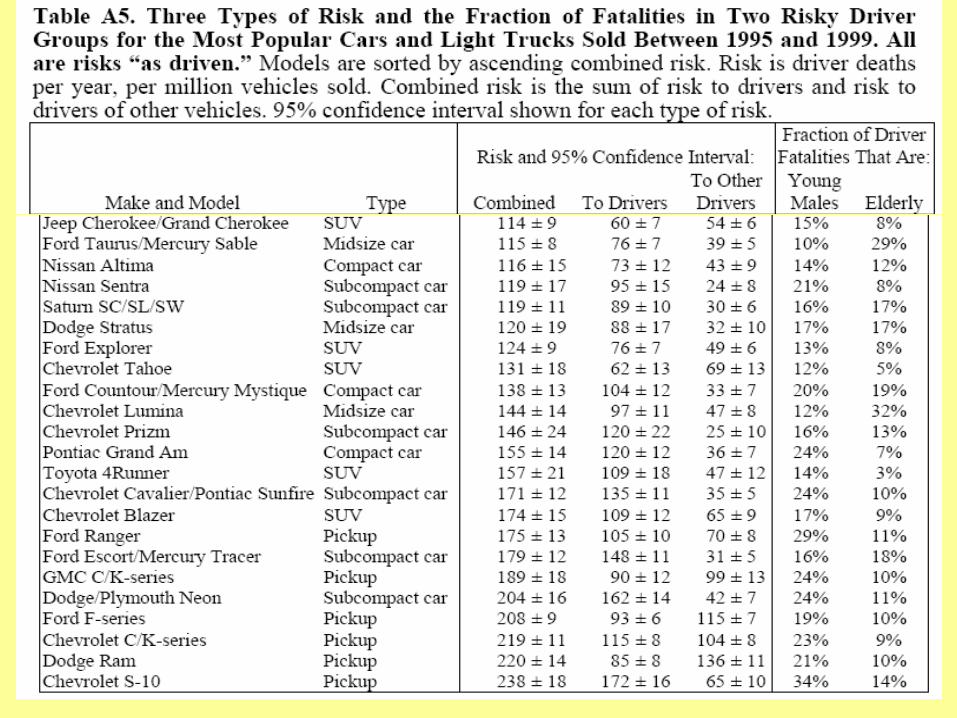


“Learned Helplessness”Question: Why are Jettas and Camrys so much safer than SUVs and trucks?
• We live in an age that is strangely fixated on the idea of helplessness: hurricanes, SARS, terrorism—situations in which we feel powerless to affect our own destiny. In fact the risks posed to life and limb are dwarfed by the factors we can control.
• Our fixation with helplessness (e.g., accidents are inevitable) distorts our perceptions of risk, so we buy S.U.V’s in extraordinary numbers, when they are some of the least safe vehicles on the road (perfectly head on accidents are the minority and rare).
• In the age of the S.U.V., people worry about safety—not risks, however commonplace, involving their own behavior but risks, however rare, involving some unexpected event (e.g., blown Firestone tires accounted for .0005% of the thousands of people killed driving S.U.V.’s).
Current Statistics• Approx. 42,000 people die each year in traffic accidents
- 2003: 1st time in six years that motor vehicle deaths fell
Why?
• Motorcycle deaths rose by 12% last year, and were up 73% since 1997. Why?
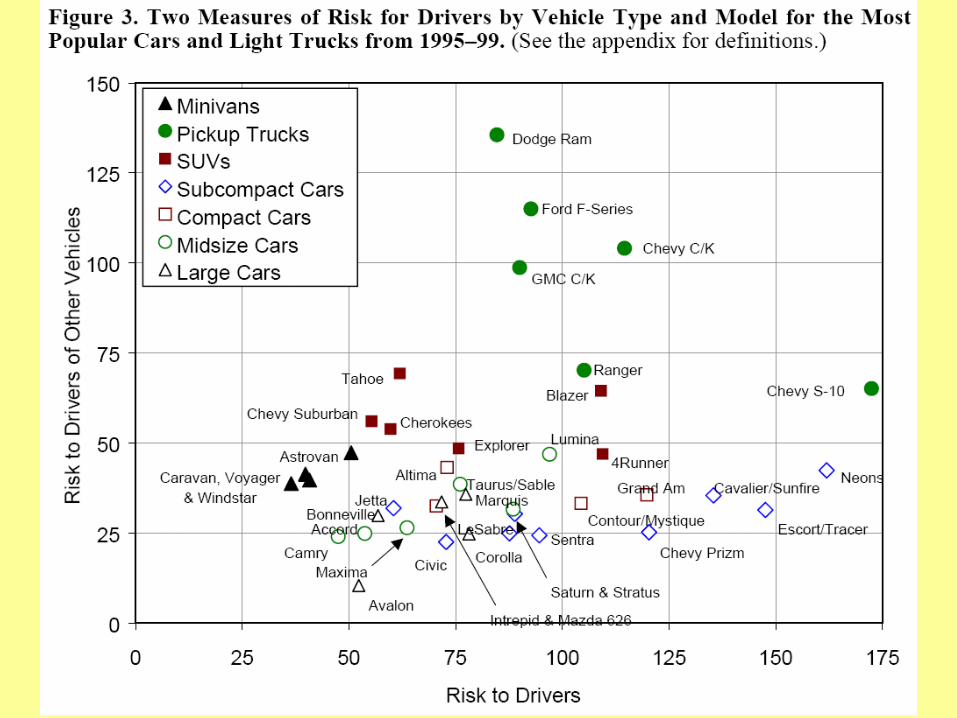
• People driving or riding in an SUV in 2003 were nearly 11% more likely to die in an accident than people in cars (due primarily to rollovers).
Variables are “Operationalized” Concepts• measuring automotive safety:
e.g., (variables = # of cupholders, # of deaths, accidents, injuries)
• measuring people’s “religiosity” (variable = ?)
• measuring degrees of professional achievement (variable = ?)
• measuring student happiness at UofR (variable = ?)
• measuring people’s views of “family values” (variable = ?)
• measuring degree of anti-Semitism (variable = ?)

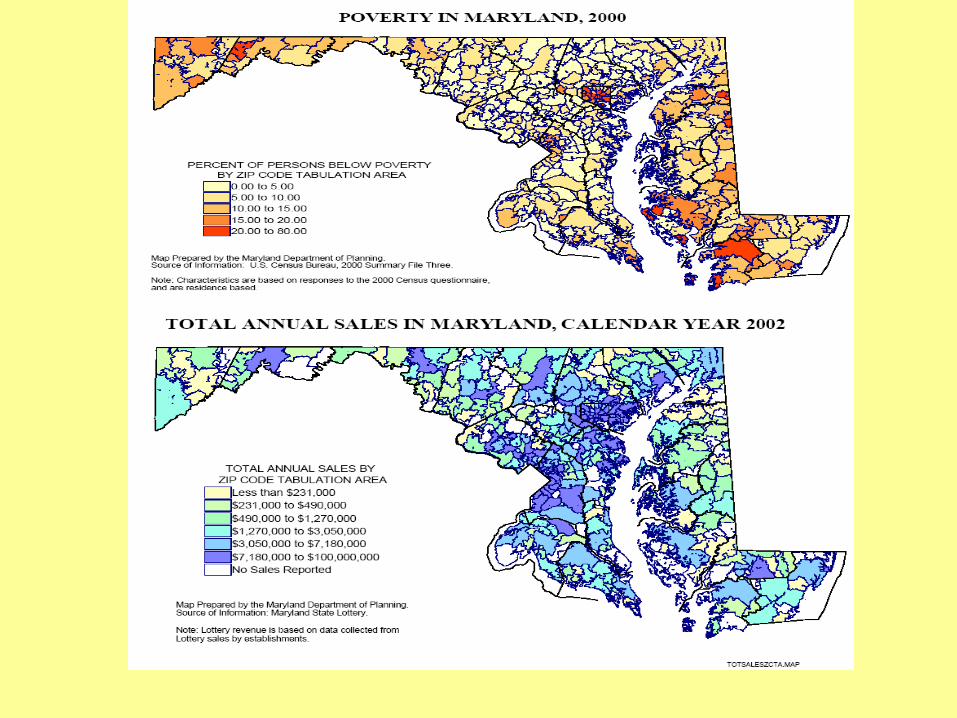
Making Comparisons: Describing Patterns & Graphing RelationshipsZip Code Geographic Area
Per Capita Income
Per Capita Sales
21205 Broadway - Monument Street $10,988 $453.50
21649 Marydel $11,158 $365.30
21867 Upper Fairmont $11,305 $282.40
21223 Carroll - Union Square - Frank $11,586 $575.80
21225 Pumphrey $11,674 $202.50
21202 Greenmount - Inner Harbor $12,100 $491.60
21213 Belair\Edison - Clifton $12,618 $440.50
21217 Druid Hill Park - Bolton Hill $13,008 $413.20
21216 Walbrook - Forest Park $13,403 $288.60
21036 Dayton $41,077 $83.4
20777 Highland $43,048 $41.4
20842 Dickerson $44,394 $15.2
20759 Fulton $45,080 $65.3
21131 Phoenix $45,724 $57.6
21210 Roland Park $46,973 $25.5
20817 Bethesda-West $60,593 $60.7
20854 Potomac $64,104 $24.3
20815 Chevy Chase $65,838 $3.7