Variation of Hydrometeorological Conditions along a Topographic Transect inNorthwestern Mexico during the North American Monsoon
ENRIQUE R. VIVONI, HUGO A. GUTIÉRREZ-JURADO, CARLOS A. ARAGÓN, LUIS A. MÉNDEZ-BARROSO,ALEX J. RINEHART, AND ROBERT L. WYCKOFF
Department of Earth and Environmental Science, New Mexico Institute of Mining and Technology, Socorro, New Mexico
JULIO C. RODRÍGUEZ
Instituto del Medio Ambiente y Desarrollo Sustentable del Estado de Sonora, Hermosillo, Sonora, Mexico
CHRISTOPHER J. WATTS
Departamento de Física, Universidad de Sonora, Hermosillo, Sonora, Mexico
JOHN D. BOLTEN AND VENKATARAMAN LAKSHMI
Department of Geological Sciences, University of South Carolina, Columbia, South Carolina
THOMAS J. JACKSON
USDA/ARS/Hydrology and Remote Sensing Laboratory, Beltsville, Maryland
(Manuscript received 2 December 2005, in final form 6 March 2006)
ABSTRACT
Relatively little is currently known about the spatiotemporal variability of land surface conditions duringthe North American monsoon, in particular for regions of complex topography. As a result, the role playedby land–atmosphere interactions in generating convective rainfall over steep terrain and sustaining mon-soon conditions is still poorly understood. In this study, the variation of hydrometeorological conditionsalong a large-scale topographic transect in northwestern Mexico is described. The transect field experimentconsisted of daily sampling at 30 sites selected to represent variations in elevation and ecosystem distribu-tion. Simultaneous soil and atmospheric variables were measured during a 2-week period in early August2004. Transect observations were supplemented by a network of continuous sampling sites used to analyzethe regional hydrometeorological conditions prior to and during the field experiment. Results reveal thestrong control exerted by topography on the spatial and temporal variability in soil moisture, with distinctlandscape regions experiencing different hydrologic regimes. Reduced variations at the plot and transectscale during a drydown period indicate that homogenization of hydrologic conditions occurred over thelandscape. Furthermore, atmospheric variables are clearly linked to surface conditions, indicating thatheating and moistening of the boundary layer closely follow spatial and temporal changes in hydrologicproperties. Land–atmosphere interactions at the basin scale (�100 km2), obtained via a technique account-ing for topographic variability, further reveal the role played by the land surface in sustaining high atmo-spheric moisture conditions, with implications toward rainfall generation during the North American mon-soon.
1. Introduction
The North American monsoon (NAM) is the pri-mary climate phenomenon controlling summer precipi-
tation in northwestern Mexico and the southwesternUnited States (e.g., Douglas et al. 1993; Adams andComrie 1997). Convective storms during the monsoonperiod can account for a large percentage of the totalannual precipitation in the region (Sheppard et al.2002) and lead to significant impacts on the local cli-mate, ecosystem function, and water resources (Higginset al. 2003). Despite its regional impact, relatively littleis currently known about the potential interactions be-tween the monsoon system and land surface properties
Corresponding author address: Enrique R. Vivoni, Dept. ofEarth and Environmental Science, New Mexico Institute of Min-ing and Technology, MSEC 244, 801 Leroy Place, Socorro, NM87801.E-mail: [email protected]
(e.g., topography, soil moisture, vegetation) that mayplay a role in initiating and sustaining moist convection.The land and atmosphere interaction may be particu-larly important for topographically complex areas inthe monsoon region. For example, Gochis et al. (2004)showed important terrain controls on the distributionof precipitation using rain gauge observations along to-pographic transects in the Sierra Madre Occidental(SMO). In particular, the authors found that at highelevations, summer precipitation was more frequent(�1–2 days), but of lower intensity, as compared toobservations at lower elevations, suggesting that topog-raphy controls the diurnal cycle of convection.
While terrain factors have been observed to influ-ence monsoon rainfall (e.g., Brown and Comrie 2002;Gochis et al. 2004), the dynamic nature of land surfaceproperties, in particular soil moisture and vegetation,have received much less attention. Theoretically, soilwetness and plant cover can influence the surface en-ergy balance through changes to the albedo, tempera-ture, and partitioning into sensible and latent heatfluxes. Eltahir (1998) hypothesized that variations insurface conditions caused by soil moisture and vegeta-tion dynamics can have a direct impact on the moiststatic energy in the boundary layer with subsequenteffects on rainfall generation. Two measurable featuresof the feedback mechanism are that an increase in soilmoisture leads to a decrease in surface temperature andan increase in water vapor in the lower atmosphere. Asoil moisture–vegetation–rainfall feedback mechanismhas been subsequently investigated in the North Ameri-can monsoon system through modeling studies (e.g.,Small 2001; Xu et al. 2004b; Matsui et al. 2005). Nev-ertheless, the observations necessary to understand theinteraction of atmospheric conditions with the land sur-face, in particular over complex terrain in northwesternMexico, have not been collected in a systematic fashion.Furthermore, the linkage between the land surface andthe monsoon system is possibly enhanced by the sea-sonal greening and high transpiration of a subtropicalecosystem arranged along specific elevation bands inthe region (e.g., Salinas-Zavala et al. 2002; Higgins et al.2003). The deciduous subtropical scrubland may havean important control, through its changes in albedo andevaporative fraction, on the recycling of moisture backto the atmosphere, with subsequent impacts on rainfallgeneration.
In this study, we describe the spatial and temporalvariabilities in the hydrometeorological conditions ob-served along a steep, topographic transect in northwest-ern Mexico during the North American monsoon. Ourstudy is based on a consistent set of daily field obser-vations across a local domain (�22 km transect) over a
2-week period in August 2004. More importantly, thefield study was designed to assess the topographic con-trols on soil moisture, soil temperature, and lower-atmospheric conditions, which are poorly known butcritical for understanding the North American mon-soon. The field campaign formed part of an intensiveobservation period carried out under the auspices ofthe Soil Moisture Experiment 2004 (SMEX04) and theNorth American Monsoon Experiment (NAME). Acommon objective of the experiments has been to im-prove the understanding of the monsoon and its rela-tion with the continental landmass and its hydrologicproperties (NAME Science Team 2004; SMEX ScienceTeam 2004). Here, we address the observed interac-tions between atmospheric conditions and the land sur-face properties along an elevation transect selectedacross a range of terrain and vegetation conditions rep-resentative of the complex region. While the field cam-paign was limited in its spatial and temporal extent, webelieve that the atmospheric and hydrologic observa-tions and their interpretation are valuable for improv-ing our understanding of the linkage between monsoonprecipitation and land surface properties.
The study is organized as follows. Section 2 presentsa description of the study site and its characteristics, aswell as the sampling methods employed during the fieldcampaign. In section 3, we present the study results,focusing on the spatial and temporal variability of theatmospheric forcing and hydrologic response at the re-gional and transect scale. This section also explores thetopographic controls on soil moisture distribution andlinkages observed between atmospheric and land sur-face conditions. Of particular importance is an attemptto derive the temporal variability of atmospheric hu-midity and soil moisture averaged over the scale of awatershed. Based on basin-averaged conditions, we as-sess the significance of land–atmosphere interactionsduring the observation period. In section 4, we discussthe study results, provide conclusions, and recommendfruitful avenues for future work.
2. Observations and sampling methods
In the following, we describe the study site, data col-lection, instrumentation, and analysis used to investi-gate the hydrometeorological conditions along the to-pographic transect. The field experiment was designedto assess the influence of land surface properties on thevariability of monsoon precipitation and its hydrologicresponse. Our experimental plan is based on similar soilmoisture field campaigns conducted over large regionsfor validating remote sensing data (e.g., Schmugge et al.1994; Jackson and Hsu 2001; Cosh et al. 2004). We
1 MAY 2007 V I V O N I E T A L . 1793
adapted the sampling strategy to obtain the spatial andtemporal variability of atmospheric and land surfaceconditions over the elevation gradient. The transectstudy was complemented by data collection from a re-gional network of continuous, ground-based sensors,satellite imagery, and aircraft observations of rainfall,soil moisture, and vegetation variability, among others(SMEX Science Team 2004).
a. Study site
The study site is located in northern Sonora, Mexico,within a rural region characterized by complex topog-raphy, ephemeral rivers, and seasonally green vegeta-tion. The mean annual rainfall in the region rangesfrom 400 to 500 mm, with 50%–70% occurring duringthe monsoon (CNA 2002). Figure 1 depicts the locationof the study region, a 75 km � 50 km box, selectedbased upon its topographic variability as represented bya 90-m digital elevation model (DEM) (INEGI 1998).Note the north–south-trending mountain ranges andriver valleys in the domain, which forms part of theSierra Madre Occidental. The topographic distributionis characterized by a high mean elevation and a large
elevation range, which are primarily due to the effectsof channel incision (Coblentz and Riitters 2004). Twomajor ephemeral rivers flow north–south through theregion: Río San Miguel (west) and Río Sonora (east),with the former draining into the latter south of thedomain. A discharge observation point at El Cajón wasused to delineate the Río San Miguel watershed (�3796km2) from the 90-m DEM. Also depicted in Fig. 1b arethe locations of the regional sampling sites, eachequipped with a rain gauge and soil moisture sensor,and the location of transect sites visited during the fieldcampaign (see section 2b).
Figure 2a depicts the ecosystem distribution in thevicinity of a small tributary to the Río San Miguel(�100 km2), which encompasses the majority of thetransect sites (Table 1, labeled 1 to 30 from high to lowelevation). The watershed is composed of an ephemeralstream flowing west from Sierra Aconchi to the majorriver valley, close to the town of Opodepe, in the stateof Sonora. Note the rural road that traverses the wa-tershed and climbs nearly 700 m over a distance of �22km. Along the transect, plant communities vary consid-erably and include desert scrub, mesquite forest, sub-
FIG. 1. Study site. (a) Region location (75 km � 50 km box) in northern Sonora, Mexico,with approximate distance to the capital Hermosillo. (b) Topographic transect locations andwatershed (�100 km2) in the Río San Miguel basin (�3796 km2). Note the location of theregional sampling sites, with rainfall and soil moisture sensors, and the stream dischargeobservation point. The topographic map, derived from a 90-m DEM (INEGI 1998), depictsthe north–south-trending mountain ranges and river valleys of the Río San Miguel (left) andRío Sonora (right).
1794 J O U R N A L O F C L I M A T E VOLUME 20
tropical scrub, and oak savanna (SIUE-IMADES1998). The topographic control on ecosystem distribu-tion is a function of the temperature and rainfall con-ditions along the mountain slopes (e.g., Coblentz andRiitters 2004). For the observed transect elevations(670–1370 m), oak savanna represents the uppermostcommunity (�1200 m). This ecosystem is part of theMadrean evergreen woodland and consists of indi-vidual trees, typically Emory oak (Quercus emoryi), in-terspersed with grasses and cacti (Brown 1994). A largeelevation range (from 800 to 1200 m) along steep slopesis occupied by a deciduous subtropical scrubland,known as Sinaloan thornscrub (Brown 1994). This eco-system primarily consists of thorny trees and shrubs,such as Palo Verde (Cercidume sonorae) and PaloBlanco (Piscidia mollis), which leaf-on and becomegreen during rainy periods. Valleys in this elevationrange are occupied by mesquite (Prosopis juliflora) andother broadleaf evergreen trees. Low elevations (�800m) along the transect are composed of mixtures ofdrought-tolerant, desert trees, shrubs, and cacti, withsubtropical scrubland species.
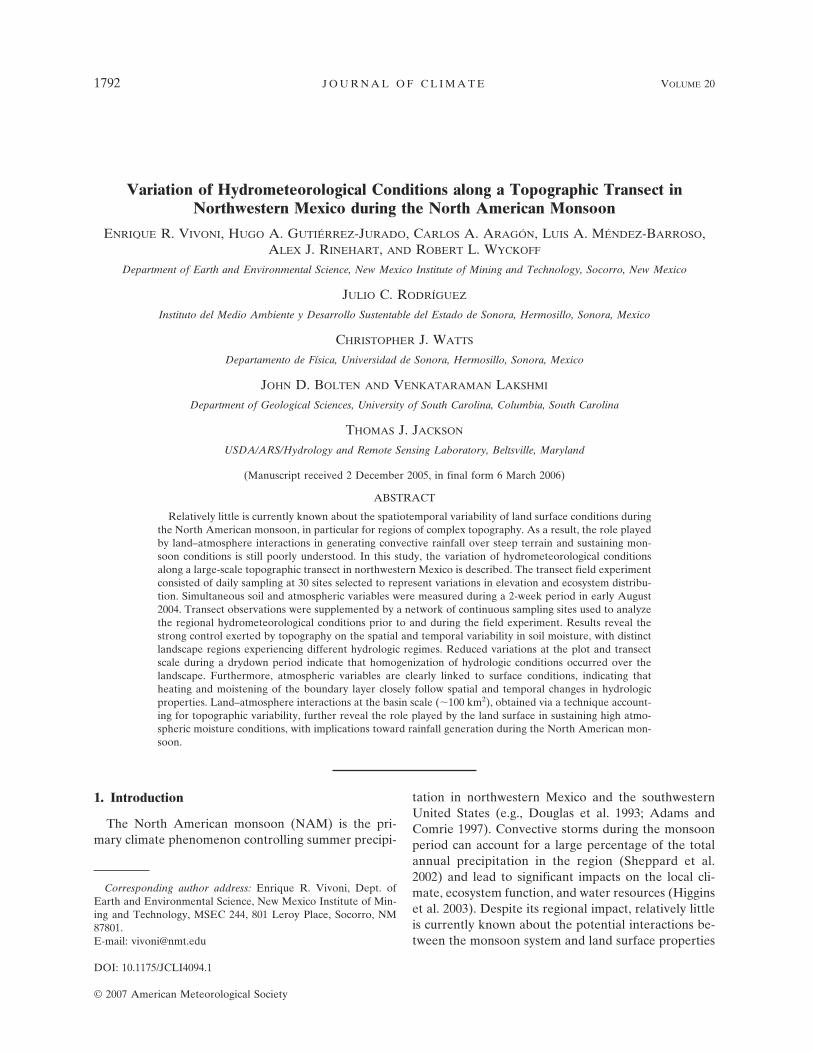
Figure 2b shows the distribution of surface soils inthe vicinity of the transect watershed based on the Foodand Agriculture Organization (FAO) soils classifica-tion. Three major soil types are distinguished alongthe transect: lithosols (I), eutric regosols (Re), and eu-tric fluvisols (Je) (INIFAP 2001). At high elevations(�900 m), soils are classified as lithosols due to theirlimited depth and continuous, underlying bedrock com-posed primarily of Mesozoic granites and Tertiaryrhyolites (SPP 1984). At intermediate elevations (from700 to 900 m), the soils are described as eutric regosols,which have no discernable horizonation and develop
FIG. 2. Vegetation and soil cover characteristics of study transect and tributary to the Río San Miguel, nearOpodepe, Sonora. (a) Spatial distribution of plant communities (SIUE-IMADES 1998). Note that the plant typesalong the transect are (in order from high to low elevation) oak savanna, subtropical scrub, mesquite forest, anddesert scrub. (b) Spatial distribution of major soil classes (INIFAP 2001). Note that the soil types in the transectare (in order from high to low elevation) lithosols, eutric regosols, and eutric fluvisols. The rural road network andephemeral streams (derived from analysis of the 90-m DEM) are also illustrated.
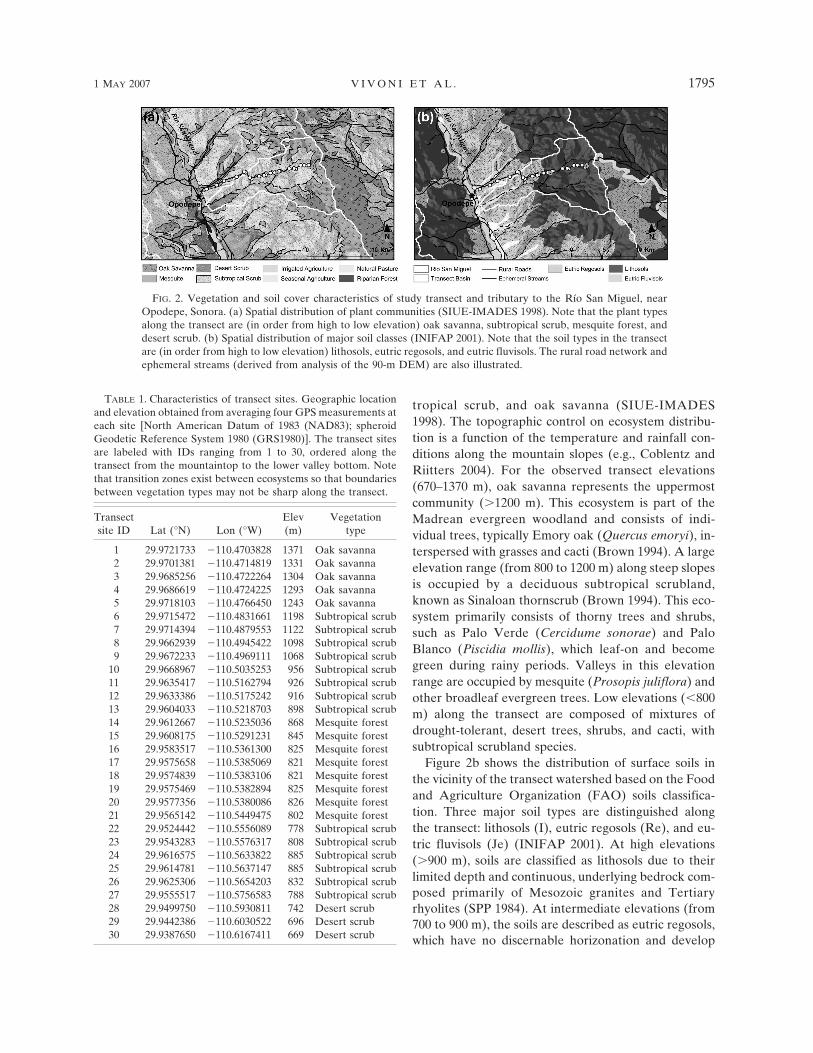
TABLE 1. Characteristics of transect sites. Geographic locationand elevation obtained from averaging four GPS measurements ateach site [North American Datum of 1983 (NAD83); spheroidGeodetic Reference System 1980 (GRS1980)]. The transect sitesare labeled with IDs ranging from 1 to 30, ordered along thetransect from the mountaintop to the lower valley bottom. Notethat transition zones exist between ecosystems so that boundariesbetween vegetation types may not be sharp along the transect.
Transectsite ID Lat (°N) Lon (°W)
Elev(m)
Vegetationtype
1 29.9721733 �110.4703828 1371 Oak savanna2 29.9701381 �110.4714819 1331 Oak savanna3 29.9685256 �110.4722264 1304 Oak savanna4 29.9686619 �110.4724225 1293 Oak savanna5 29.9718103 �110.4766450 1243 Oak savanna6 29.9715472 �110.4831661 1198 Subtropical scrub7 29.9714394 �110.4879553 1122 Subtropical scrub8 29.9662939 �110.4945422 1098 Subtropical scrub9 29.9672233 �110.4969111 1068 Subtropical scrub
over unconsolidated, Cenozoic conglomerates. Regionsalong ephemeral streams in this elevation range consistprimarily of alluvium with large clasts present in thechannels. At lower altitudes (�700 m), the soils consistof eutric fluvisols recently developed on Quaternaryalluvium. Alluvial deposits are intermixed sediment,gravels, and boulders arising from the Sierra Aconchi.The north–south valley of the Río San Miguel containsa transmissive, shallow aquifer, which serves as the re-gional water supply (CNA 2002).
b. Field campaign and instrumentation
The field experiment was conducted during a 2-weekperiod in early August 2004 to ensure that atmosphericconditions were favorable for convective events andtheir hydrologic response (e.g., Douglas et al. 1993; Ad-ams and Comrie 1997). August is an important monthfor the regional hydroclimatology, as ephemeral streamdischarge has been shown to be high and have a lowinterannual variability (Gochis et al. 2006). In addition,this month consists of infrequent, but intense mesoscalestorms whose peak activity occurs during the late eve-
ning and night (e.g., Gochis et al. 2004; Xie et al. 2005;Gebremichael et al. 2007). Sampling at 30 transect sites(Table 1; labeled from site 1 at the high altitude to site30 at the low elevation) was performed daily from 3 to14 August, over local times ranging from 0900 to 1600LT to coincide with satellite and aircraft data acquisi-tion schedules (SMEX Science Team 2004). While sitesampling was not simultaneous, an attempt was madeto make measurements at a similar time each day foreach location. Early morning samples were typicallytaken at high altitudes along the transect, while latermeasurements were made at lower elevations. As a re-sult, the manual field sampling was not designed tocapture diurnal patterns at each transect site. Instead,we utilized a network of continuously recording sensorsfor this purpose (see descriptions below).
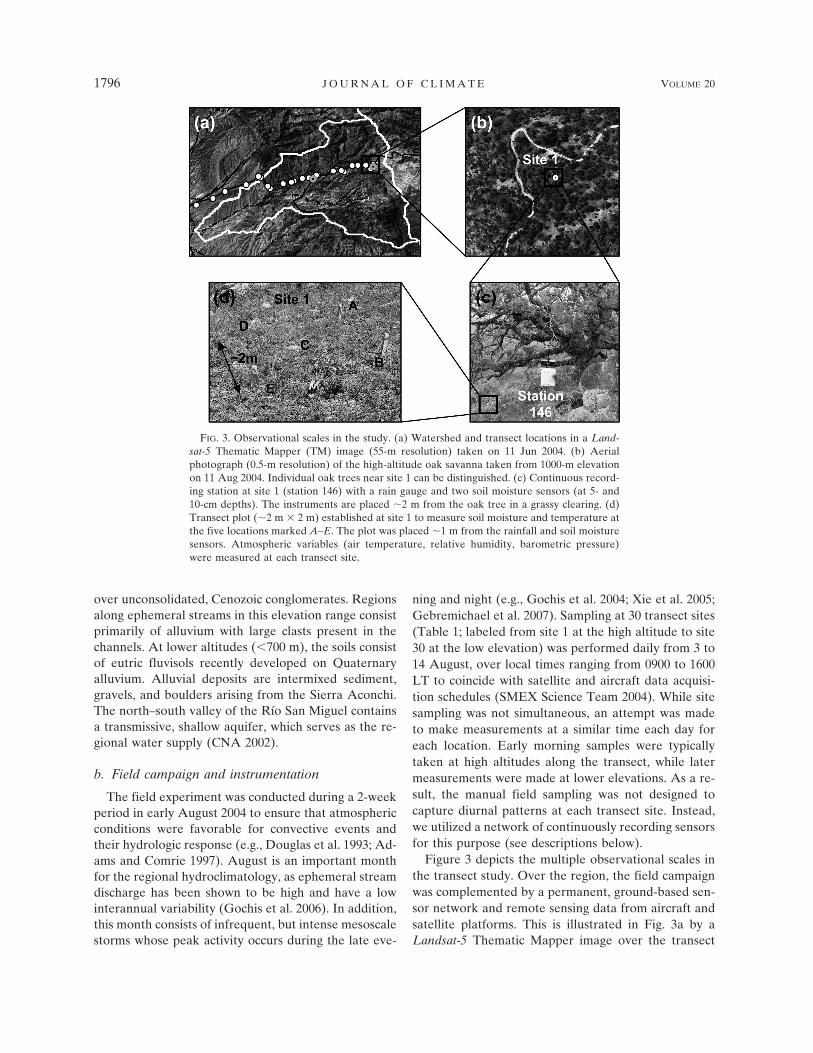
Figure 3 depicts the multiple observational scales inthe transect study. Over the region, the field campaignwas complemented by a permanent, ground-based sen-sor network and remote sensing data from aircraft andsatellite platforms. This is illustrated in Fig. 3a by aLandsat-5 Thematic Mapper image over the transect
FIG. 3. Observational scales in the study. (a) Watershed and transect locations in a Land-sat-5 Thematic Mapper (TM) image (55-m resolution) taken on 11 Jun 2004. (b) Aerialphotograph (0.5-m resolution) of the high-altitude oak savanna taken from 1000-m elevationon 11 Aug 2004. Individual oak trees near site 1 can be distinguished. (c) Continuous record-ing station at site 1 (station 146) with a rain gauge and two soil moisture sensors (at 5- and10-cm depths). The instruments are placed �2 m from the oak tree in a grassy clearing. (d)Transect plot (�2 m � 2 m) established at site 1 to measure soil moisture and temperature atthe five locations marked A–E. The plot was placed �1 m from the rainfall and soil moisturesensors. Atmospheric variables (air temperature, relative humidity, barometric pressure)were measured at each transect site.
1796 J O U R N A L O F C L I M A T E VOLUME 20
basin. Aerial photographs along the rural road allow acloser inspection of the ecosystem communities (Fig.3b). Note that individual oaks are observed near site 1due to the high image resolution (�0.5 m). Site 1 con-tains a permanent sampling site (Fig. 3c), with a con-tinuous rain gauge and two soil moisture sensors, aswell as a transect plot (�2 m � 2 m) setup for dailysampling of hydrometeorological variables (Fig. 3d).Similar plots were established at the other transect sitesin order to sample across a range of elevation and veg-etation conditions (see Fig. 9a for depiction of eleva-tions along the transect).
The following variables were measured in eachtransect site using hand-held instruments: soil moisture,soil temperature, air temperature, relative humidity,barometric pressure, and rainfall accumulation. Volu-metric soil moisture (�� in %) was sampled from 0 to 6cm using an impedance probe (Theta probe). The sen-sor uses a voltage standing wave method to estimate therelative probe impedance (Cosh et al. 2005), which isused to infer the soil moisture content. Five soil mois-ture readings were taken daily in each plot (see theletters A–E in Fig. 3d). At each location, soil tempera-ture (Ts in °C) was measured at three depths (�1, 5,and 10 cm) using a soil thermometer at the five sites.Atmospheric conditions were also determined near theplot at �1 m above the ground. Air temperature (Ta in°C) and relative humidity (RH in %) were measuredusing a dial hygrometer–thermometer, while pressure(P in mm Hg�1) was gauged using a barometer. Dailyrainfall accumulation (Rd in mm) at a subset of thetransect sites was obtained using 10 event rain gauges.The sampling strategy is intended to capture the vari-ability of a soil variable in each plot (via the five mea-surement sites) and over the transect (via the differentlocations), as well as the relation between soil and at-mospheric conditions at each site.
The event rain gauges were used to complement con-tinuous rainfall measurements at two transect locations(near sites 1 and 12). These permanent stations formedpart of a ground-based network established over theregion (Fig. 1b). During the campaign, rainfall wasmeasured at 30-min intervals using a 6-in. tipping-bucket gauge with a resolution of 0.2 mm. The gaugerainfall rate (R in mm h�1) has been quality-controlledat several locations with manual gauges. Volumetricsoil moisture (�� in %) was estimated at 30-min inter-vals using a Hydra sensor. Each permanent site con-tained a moisture sensor at a 5-cm depth (effective sam-pling from 3 to 7 cm), while several locations have ad-ditional sensors at 10- and 15-cm depths. Gravimetricsoil moisture samples (�g in %) taken during the cam-paign (0–3, 3–6 cm) have been used to quality control
the surface volumetric estimates using the soil bulkdensity (�b) for each site.
The field campaign measurements were supple-mented by an extensive characterization of each site forthe following properties: geographic location, terrainattributes, ecosystem type, and soil condition. A globalpositioning system (GPS) sensor, compass, and clinom-eter were used to obtain the location, elevation, aspect,and slope of each transect site. Ecosystem properties,including vegetation species and plant cover, weredocumented via digital photography and identified us-ing field books (Brown 1994; Paredes-Aguilar et al.2000). Field measurements and laboratory analysis ofsoil characteristics were made to determine texture,rock fraction, bulk density, and surface roughness(SMEX Science Team 2004). Ground observationswere used to augment data layers collected over theregion and archived in a geographical information sys-tem (GIS).
c. Measurement intercomparisons
The sampling methods used during the field cam-paign were compared in order to gain confidence in thedataset prior to further interpretations. Figure 4 pre-sents an example of the soil moisture and temperaturederived via different techniques over similar depths atstation 146 (site 1). In Fig. 4a, the soil moisture (�� in%) from the Hydra sensor is compared to the Thetaprobe and gravimetric samples. The techniques indicatea general drying trend at the site, with a brief increasein soil moisture observed due to a rainfall event. Thetaprobe soil moisture estimates follow the Hydra sensorrecord quite well and typically bound the values withinthe observed plot-scale variability. Figure 4b presents acomparison of the soil temperature from the Hydrasensor and the soil thermometer readings. Note thestrong diurnal fluctuations in soil temperature and theexcellent correspondence between the techniques.Only the continuous sensor identified a decrease in soiltemperature after the rainfall event. These comparisonsindicate that the daily sampling strategy appears ad-equate for capturing soil moisture trends, but careshould be taken when interpreting soil temperaturedata that exhibit high diurnal fluctuations.
3. Results
In the following, we utilize the continuous and dailymeasurements to assess the variation of hydrometeoro-logical conditions along the topographic transect. Wefocus the analysis on the spatial and temporal variabili-ties of soil moisture and the potential linkage between
1 MAY 2007 V I V O N I E T A L . 1797
soil and atmospheric conditions. Field data are selectedfor representative sites with nearly complete temporalcoverage in the major ecosystems and during days withextensive spatial coverage. Based on these observa-tions, we estimate the temporal variability of basin-averaged conditions. The averaging technique accountsfor the topographic variability within a 100 km2 basin inthe Río San Miguel. Prior to presenting the transectdata, we describe the regional rainfall and soil moistureconditions over the period of 1 July–31 August 2004 toprovide a larger-scale and longer-term context for ourobservations.
a. Regional hydrometeorological conditions
The North American monsoon has a significant con-trol on the hydrometeorology of the mountainous re-gion in northern Mexico as indicated by rainfall andstreamflow records (e.g., Brito-Castillo et al. 2003;Gochis et al. 2006). For the study area, climate recordsat Opodepe (elevation 640 m) indicate that 53% of theannual precipitation (477 mm) occurs during July andAugust. Figure 5 presents the monthly distribution ofrainfall (mm) and maximum and minimum air tempera-tures (°C) over the period 1975–2000. Note the lowprecipitation and increasing maximum temperaturesduring April–June, prior to the monsoon onset in July.The monsoon season (July–September) experiences alarge increase in rainfall and a small reduction in maxi-mum air temperature, potentially due to cloudiness andchanges in surface conditions (e.g., vegetation, soil tem-
perature, and moisture). The timing of the monsoononset and the higher rainfall amounts for July (133 mm)as compared to August (120 mm) at this station agreewell with the observed gradient in the climatologicalcharacteristics as distance increases away from the coreregion of the monsoon domain (e.g., Xu et al. 2004a;Gutzler 2004).
The spatial variability of monsoon rainfall duringJuly and August 2004 can be obtained from the raingauge network. Figure 6 presents the rainfall amountsat 12 rain gauges in the 75 km � 50 km domain over (a)
FIG. 5. Hydroclimatology of the transect region obtained fromlong-term weather observations at Opodepe, Sonora. Theweather station is located at 29.93°N, �110.63°W and 640 m (el-evation). Mean annual rainfall (bars in mm) and maximum(closed circles) and minimum (open circles) monthly air tempera-tures (°C) over the period 1975–2000.
FIG. 4. Comparison of sampling methods for hydrometeorological variables along a topographic transect forcollocated site 1 and station 146 during 3–14 Aug 2004 (Julian days 216–227). (a) Rainfall rate (mm h�1) andvolumetric soil moisture (%) estimated via three methods: 5-cm depth Hydra sensor (continuous solid line),0–6-cm Theta probe estimates (squares with error bars depicting the mean value 1 std dev for five dailymeasurements), and 0–6-cm gravimetric samples (closed circles). (b) Rainfall rate (in mm h�1) and soil tempera-ture (°C) estimated via two methods: 5-cm depth Hydra sensor (continuous solid line) and 5-cm soil thermometerreadings (squares with error bars depicting the mean value 1 std dev for five daily measurements). Soiltemperature is an additional measurement made by the Hydra sensor to estimate volumetric soil moisture. Notethat the soil moisture estimate from the Hydra sensor has a diurnal fluctuation that may be due to measurementerrors arising from the large fluctuations in soil temperature (e.g., Seyfried and Murdock 2004).
1798 J O U R N A L O F C L I M A T E VOLUME 20
1 July–31 August and (b) 3–14 August. Two gaugingsites (stations 136 and 138) were not used due to miss-ing data affecting the total accumulations. Note the Ju-ly–August totals in Fig. 6a indicate that the spatial dis-tribution is controlled by elevation and relative positionalong a river valley. A decreasing trend is observed atlower elevations and for sites farther south in the do-main. The observed spatial variability (132–258 mm) isconsistent with climatological values at long-term sta-tions in the region (e.g., Brown 1994). Total July–August rainfall amounts in the transect basin (stations132 and 146) are also comparable to the regional ob-servations. In particular, the higher-elevation station(site 1 or station 146: 225 mm) received more rainfall ascompared to the midelevation site (site 12 or station132: 189 mm). Gebremichael et al. (2007) present ad-ditional details on the spatial distribution of rainfallstatistics in the domain and identify four rainfall sub-regions based on spatial coherency (Sierra Aconchi,Cucurpe, Río San Miguel valley, and Río Sonora val-ley).
As shown in Fig. 6b, rainfall accumulation during thefield campaign was significantly reduced as comparedto the July–August totals, in particular over the transectbasin. Note the maximum rainfall amounts occurred atstation 144 in the Río San Miguel (100 mm) as a resultof a major storm that led to flooding in the ephemeralriver. In comparison, transect stations 132 and 146 re-ceived �7 mm during the campaign with no discernabledifference due to elevation. The hydrometeorologicalconditions are further explored in Fig. 7, which presentsthe temporal variability of rainfall (mm h�1) and soilmoisture (%) at two sites, as well as the daily discharge(m3 s�1) at the El Cajón gauge. Station 144 is located inthe northern valley of the Río San Miguel (799 m),
while station 146 is located in the upper transect (1371m). Comparisons of the rainfall records demonstratethe effect of elevation on rainfall amounts, with themountain site receiving frequent, small events, whilethe valley site is dominated by larger, infrequent storms(see Gebremichael et al. 2007 for detailed statisticalanalysis). This is consistent with Gochis et al. (2004)who showed that single convection cells were commonat high elevations, while mesoscale convective com-plexes characterize lower elevations.
Temporal differences in the rainfall characteristicsare reflected in the soil moisture and discharge mea-surements. Note the correspondence between the rain-fall rate at station 144 and the streamflow record, indi-cating that intense precipitation over the river valleyhas a strong linkage to flood generation. In contrast, themountain site is more weakly correlated to discharge,as single-cell storms are less capable of generatingflooding. To corroborate this observation, a compari-son of the runoff ratio (Q/P) reveals a higher value forthe valley site as compared to the mountain station(Fig. 7). Furthermore, the rainfall–runoff relation be-tween upland areas and the lowland river is weaker ashillslope and channel losses are anticipated to be highin the region (Descroix et al. 2002a). This is particularlyevident during the field campaign, as denoted by thevertical dashed lines. In this period, the transect siteexperiences low rainfall amounts and a declining soilmoisture, while the valley site exhibits an overall in-crease in soil moisture due to a major storm on 11August (day 224). It is apparent from the observationsthat the topographic transect experienced high rainfallamounts prior to the field campaign, which were com-parable to regional accumulations, and a general dryingtrend during the sampling period. This drying trend
FIG. 6. Regional distribution of precipitation from ground-based rain gauge network. (a) Rainfall accumulation(mm) from 1 Jul to 31 Aug 2004. (b) Rainfall accumulation (mm) during the field campaign from 3 to 14 Aug 2004.Note that the symbol size depicts the total rainfall amount for each time period, as indicated in the two legends.
1 MAY 2007 V I V O N I E T A L . 1799
appears limited to a broad mountainous area as theriver valley experienced large mesoscale storms duringthe field campaign.
b. Spatial and temporal soil moisture variabilityover topographic transect
The topographic variations of hydrometeorologicalvariables are poorly understood in the NAM region(e.g., Higgins et al. 2003; Gochis et al. 2004), primarilydue to the lack of detailed observations along eleva-tional gradients. The topographic transect fromOpodepe (669 m) to the summit of Sierra Aconchi(1371 m) provides a unique opportunity to understandthe temporal and spatial variabilities in hydrologic re-sponse to monsoon rainfall. In the following, wepresent a subset of the field campaign dataset that cap-tures the variation of rainfall and soil moisture as afunction of time at four sites and as a function of el-evation during three sampling dates. Note that theanalysis is based on measurements of surface soil mois-ture (0–6 cm) using the Theta probe in each transectsite. We present the plot average (as symbols) and stan-dard deviation (as bars) based on five measurements ateach site to assess the variability in a plot and over thetransect.
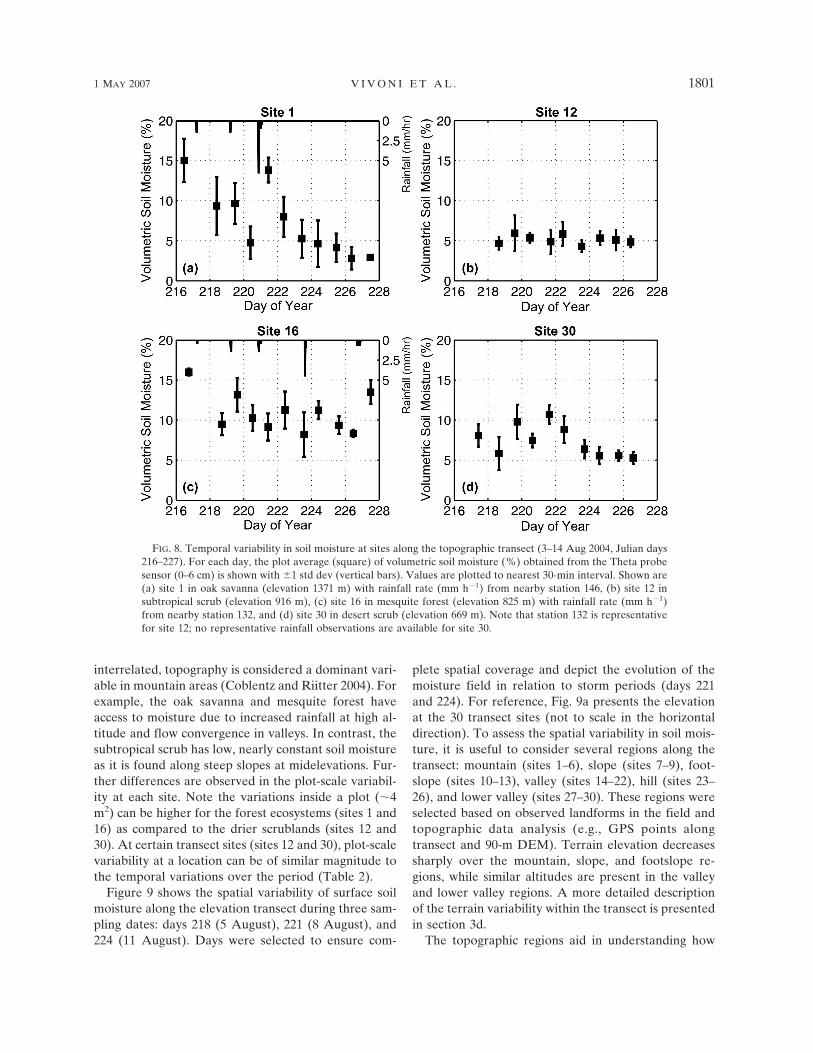
Figure 8 presents the temporal variability of the sur-face soil moisture at four sites along the transect: site 1(oak savanna, 1371 m), site 12 (subtropical scrub, 916m), site 16 (mesquite forest, 825 m), and site 30 (desert
scrub, 669 m). Continuous rainfall records at station 146and 132 are depicted for nearby sites 1 and 16. Station132 is also applicable to site 12; while a rain gauge is notavailable at site 30. Note the correspondence betweenrainfall and soil moisture response, in particular forsites 1 and 16. For example, a small storm of �6 mmh�1 leads to an increase in soil moisture from �5% to14% in site 1 (day 221). Interestingly, the increase insoil moisture is short lived, with values returning toprestorm levels in �2 days. This suggests that surfacemoisture is rapidly depleted by evapotranspiration, soilinfiltration, and downslope lateral fluxes. The soil mois-ture recession follows an exponential decay after astorm event, in particular for the latter periods in sites1 and 30. This agrees well with surface moisture reces-sions (decay constants of �2 days) observed in NewMexico during the NAM (Kurc and Small 2004).
A comparison of the soil moisture amount and itsvariability at the four sites can provide an indication ofthe differences in hydrologic response in each ecosys-tem. Note that the oak savanna (site 1) and mesquiteforest (site 16) have high soil moisture values, but alsolarge temporal variability (�2% to �15%). In contrast,the subtropical and desert scrubs (sites 12 and 30) ex-hibit low soil moisture and reduced day-to-day varia-tions (�5% to �10%). Several factors may control theobserved soil moisture distributions, including rainfall,terrain position, vegetation type, and soil properties(Rodríguez-Iturbe 2000). While these are all strongly
FIG. 7. Regional and topographic transect observations of rainfall, soil moisture, and stream discharge. The dailystream discharge (m3 s�1, bar plots) was measured at the El Cajón gauging site on the Río San Miguel by CNA(2004) over period 13 Jul–23 Aug 2004. Comparison of 30-min rainfall accumulation (in mm h�1) and volumetricsoil moisture (%) estimated from the 5-cm depth soil moisture sensor for (a) station 144, a regional site receivinglarge rainfall amounts (99.57 mm during field campaign), and (b) station 146, collocated with site 1 in thetopographic transect. The dashed vertical lines represent the time period of the field campaign (3–14 Aug 2004).See Fig. 1b for location of stations and stream gauging site. The runoff ratio (Q/P, where Q and P are the dailydischarge and rainfall volumes) was estimated for each site based on the outlet discharge and the rainfall recordat each station. For station 144 (valley site), Q/P 0.023, while for station 146 (mountain site), Q/P 0.017. Thissuggests a stronger relationship between the rainfall accumulation and outlet discharge in the valley region.
1800 J O U R N A L O F C L I M A T E VOLUME 20
interrelated, topography is considered a dominant vari-able in mountain areas (Coblentz and Riitter 2004). Forexample, the oak savanna and mesquite forest haveaccess to moisture due to increased rainfall at high al-titude and flow convergence in valleys. In contrast, thesubtropical scrub has low, nearly constant soil moistureas it is found along steep slopes at midelevations. Fur-ther differences are observed in the plot-scale variabil-ity at each site. Note the variations inside a plot (�4m2) can be higher for the forest ecosystems (sites 1 and16) as compared to the drier scrublands (sites 12 and30). At certain transect sites (sites 12 and 30), plot-scalevariability at a location can be of similar magnitude tothe temporal variations over the period (Table 2).
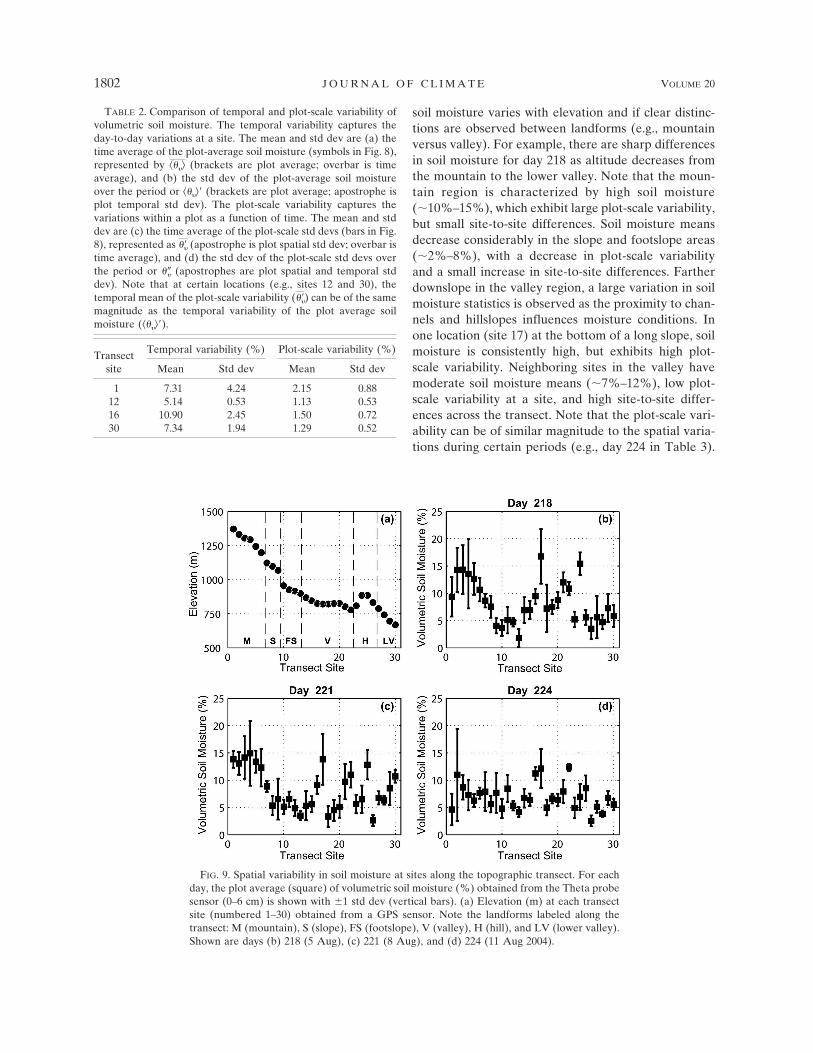
Figure 9 shows the spatial variability of surface soilmoisture along the elevation transect during three sam-pling dates: days 218 (5 August), 221 (8 August), and224 (11 August). Days were selected to ensure com-
plete spatial coverage and depict the evolution of themoisture field in relation to storm periods (days 221and 224). For reference, Fig. 9a presents the elevationat the 30 transect sites (not to scale in the horizontaldirection). To assess the spatial variability in soil mois-ture, it is useful to consider several regions along thetransect: mountain (sites 1–6), slope (sites 7–9), foot-slope (sites 10–13), valley (sites 14–22), hill (sites 23–26), and lower valley (sites 27–30). These regions wereselected based on observed landforms in the field andtopographic data analysis (e.g., GPS points alongtransect and 90-m DEM). Terrain elevation decreasessharply over the mountain, slope, and footslope re-gions, while similar altitudes are present in the valleyand lower valley regions. A more detailed descriptionof the terrain variability within the transect is presentedin section 3d.
The topographic regions aid in understanding how
FIG. 8. Temporal variability in soil moisture at sites along the topographic transect (3–14 Aug 2004, Julian days216–227). For each day, the plot average (square) of volumetric soil moisture (%) obtained from the Theta probesensor (0–6 cm) is shown with 1 std dev (vertical bars). Values are plotted to nearest 30-min interval. Shown are(a) site 1 in oak savanna (elevation 1371 m) with rainfall rate (mm h�1) from nearby station 146, (b) site 12 insubtropical scrub (elevation 916 m), (c) site 16 in mesquite forest (elevation 825 m) with rainfall rate (mm h�1)from nearby station 132, and (d) site 30 in desert scrub (elevation 669 m). Note that station 132 is representativefor site 12; no representative rainfall observations are available for site 30.
1 MAY 2007 V I V O N I E T A L . 1801
soil moisture varies with elevation and if clear distinc-tions are observed between landforms (e.g., mountainversus valley). For example, there are sharp differencesin soil moisture for day 218 as altitude decreases fromthe mountain to the lower valley. Note that the moun-tain region is characterized by high soil moisture(�10%–15%), which exhibit large plot-scale variability,but small site-to-site differences. Soil moisture meansdecrease considerably in the slope and footslope areas(�2%–8%), with a decrease in plot-scale variabilityand a small increase in site-to-site differences. Fartherdownslope in the valley region, a large variation in soilmoisture statistics is observed as the proximity to chan-nels and hillslopes influences moisture conditions. Inone location (site 17) at the bottom of a long slope, soilmoisture is consistently high, but exhibits high plot-scale variability. Neighboring sites in the valley havemoderate soil moisture means (�7%–12%), low plot-scale variability at a site, and high site-to-site differ-ences across the transect. Note that the plot-scale vari-ability can be of similar magnitude to the spatial varia-tions during certain periods (e.g., day 224 in Table 3).
FIG. 9. Spatial variability in soil moisture at sites along the topographic transect. For eachday, the plot average (square) of volumetric soil moisture (%) obtained from the Theta probesensor (0–6 cm) is shown with 1 std dev (vertical bars). (a) Elevation (m) at each transectsite (numbered 1–30) obtained from a GPS sensor. Note the landforms labeled along thetransect: M (mountain), S (slope), FS (footslope), V (valley), H (hill), and LV (lower valley).Shown are days (b) 218 (5 Aug), (c) 221 (8 Aug), and (d) 224 (11 Aug 2004).
TABLE 2. Comparison of temporal and plot-scale variability ofvolumetric soil moisture. The temporal variability captures theday-to-day variations at a site. The mean and std dev are (a) thetime average of the plot-average soil moisture (symbols in Fig. 8),represented by ���� (brackets are plot average; overbar is timeaverage), and (b) the std dev of the plot-average soil moistureover the period or ���� (brackets are plot average; apostrophe isplot temporal std dev). The plot-scale variability captures thevariations within a plot as a function of time. The mean and stddev are (c) the time average of the plot-scale std devs (bars in Fig.8), represented as � � (apostrophe is plot spatial std dev; overbar istime average), and (d) the std dev of the plot-scale std devs overthe period or ��� (apostrophes are plot spatial and temporal stddev). Note that at certain locations (e.g., sites 12 and 30), thetemporal mean of the plot-scale variability (� �) can be of the samemagnitude as the temporal variability of the plot average soilmoisture (���� ).
Although many factors influence soil moisture, it isclear that elevation helps explain much of the observedvariability in the transect.
A comparison of the sampling days illustrates thetemporal evolution of the soil moisture patterns alongthe transect. Two storms of limited extent and durationoccurred prior to day 221 (near the mountain region)and day 224 (near the footslope and valley regions)(Figs. 8a–c). Superimposed on these small events is ageneral surface drying as major storms occurred beforethe campaign (Fig. 7). Note the overall trend towardhomogenous soil moisture across the transect as timeprogresses. The mountain region, having received mi-nor rain amounts on day 221, dries considerably by day224. The slope and footslope areas are wet after bothstorms and retain high moisture by day 224. The valleyregion (site 16) dries between days 219 and 221 andincreases in soil moisture by day 224 in response to thestorm and lateral moisture fluxes. As a result, the spa-tial pattern in soil moisture shows a consistent move-ment away from clearly distinguished regions (day 218),toward similar values across all elevations, approaching�7% on day 224. This indicates that elevation is animportant factor during wet periods resulting from rain-fall, but that its effects are diminished as a landscapeadjusts to the rainfall event (e.g., drying in several re-gions, wetting in other parts). The reduction of terrain-induced soil moisture variations during drying has also
been observed at a smaller scale by Famiglietti et al.(1998).
c. Relations between soil and atmosphericconditions over topographic transect
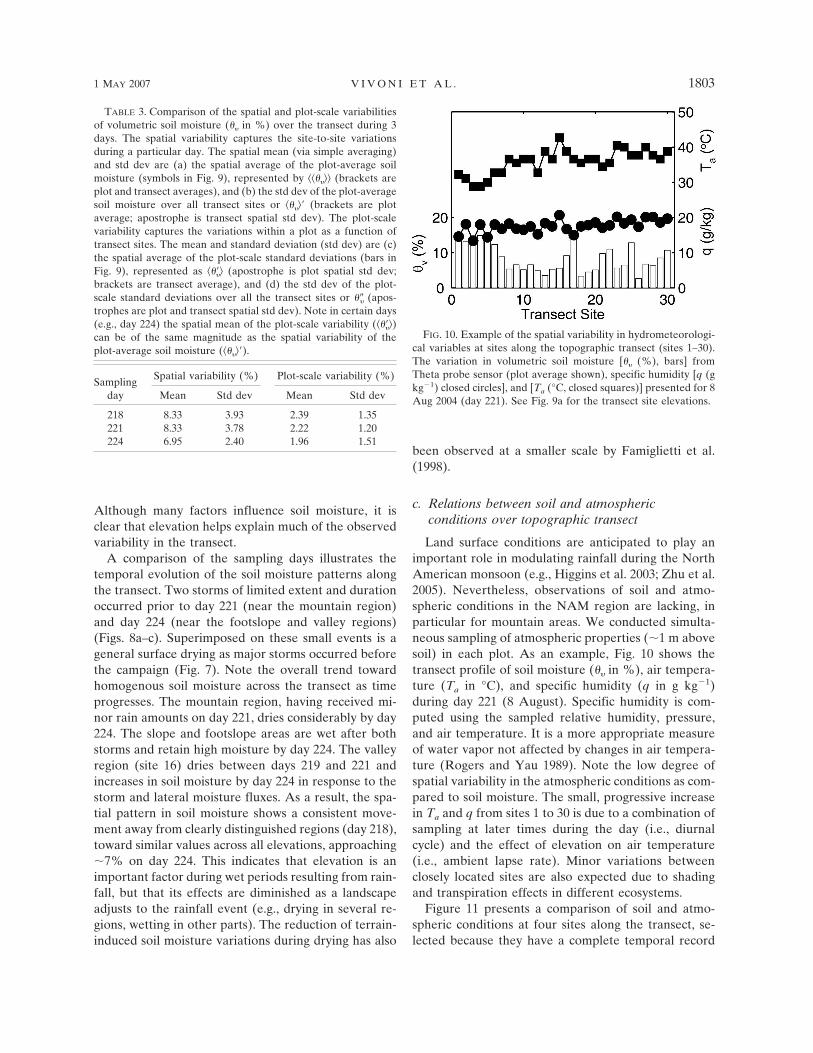
Land surface conditions are anticipated to play animportant role in modulating rainfall during the NorthAmerican monsoon (e.g., Higgins et al. 2003; Zhu et al.2005). Nevertheless, observations of soil and atmo-spheric conditions in the NAM region are lacking, inparticular for mountain areas. We conducted simulta-neous sampling of atmospheric properties (�1 m abovesoil) in each plot. As an example, Fig. 10 shows thetransect profile of soil moisture (�� in %), air tempera-ture (Ta in °C), and specific humidity (q in g kg�1)during day 221 (8 August). Specific humidity is com-puted using the sampled relative humidity, pressure,and air temperature. It is a more appropriate measureof water vapor not affected by changes in air tempera-ture (Rogers and Yau 1989). Note the low degree ofspatial variability in the atmospheric conditions as com-pared to soil moisture. The small, progressive increasein Ta and q from sites 1 to 30 is due to a combination ofsampling at later times during the day (i.e., diurnalcycle) and the effect of elevation on air temperature(i.e., ambient lapse rate). Minor variations betweenclosely located sites are also expected due to shadingand transpiration effects in different ecosystems.
Figure 11 presents a comparison of soil and atmo-spheric conditions at four sites along the transect, se-lected because they have a complete temporal record
TABLE 3. Comparison of the spatial and plot-scale variabilitiesof volumetric soil moisture (�� in %) over the transect during 3days. The spatial variability captures the site-to-site variationsduring a particular day. The spatial mean (via simple averaging)and std dev are (a) the spatial average of the plot-average soilmoisture (symbols in Fig. 9), represented by ������ (brackets areplot and transect averages), and (b) the std dev of the plot-averagesoil moisture over all transect sites or ���� (brackets are plotaverage; apostrophe is transect spatial std dev). The plot-scalevariability captures the variations within a plot as a function oftransect sites. The mean and standard deviation (std dev) are (c)the spatial average of the plot-scale standard deviations (bars inFig. 9), represented as �� �� (apostrophe is plot spatial std dev;brackets are transect average), and (d) the std dev of the plot-scale standard deviations over all the transect sites or ��� (apos-trophes are plot and transect spatial std dev). Note in certain days(e.g., day 224) the spatial mean of the plot-scale variability (�� ��)can be of the same magnitude as the spatial variability of theplot-average soil moisture (���� ).
FIG. 10. Example of the spatial variability in hydrometeorologi-cal variables at sites along the topographic transect (sites 1–30).The variation in volumetric soil moisture [�� (%), bars] fromTheta probe sensor (plot average shown), specific humidity [q (gkg�1) closed circles], and [Ta (°C, closed squares)] presented for 8Aug 2004 (day 221). See Fig. 9a for the transect site elevations.
1 MAY 2007 V I V O N I E T A L . 1803
and are representatives of different elevation bands andvegetation types (see section 3b for site selection). Werelate air conditions (Ta, q) to corresponding soil prop-erties (Ts, ��) (Figs. 11a and 11b) and compare moistureamounts (q, ��) to temperatures (Ta, Ts) in each me-dium (Figs. 11c and 11d). Each point represents a pairof values for a specific day. Points at the same site(same symbol) tend to cluster in the measurementspace. Overall, a strongly linear positive relation is ob-served between Ta and Ts, while a weakly linear posi-tive trend exists between q and �� (Table 4). The in-crease in q with �� is indicative of the soil moisture–rainfall feedback mechanism proposed by Eltahir(1998). The stronger Ta � Ts relation is expected as thelower air in contact with a surface can equilibrate morequickly with respect to temperature than moisture (En-tekhabi 1995). Note that the orographic effects on tem-perature and moisture are embedded within the rela-tions. Furthermore, local controls in particular ecosys-tems can have an important effect on site-specificinteractions. For example, the subtropical scrub cansustain high q despite having low ��, an important eco-system contribution to moisture recycling back to the
atmosphere. The observed land–atmosphere couplingsuggests that surface conditions (Ts and ��) may play animportant role in heating and moistening the lower at-mosphere with implications for rainfall generation dur-ing the monsoon (Eltahir 1998; Small and Kurc 2003).
Analysis of atmospheric (Ta, q) and soil (Ts, ��) con-ditions is helpful in assessing site controls on land–atmosphere relations (Table 4). Note the positive, lin-ear trend between q and Ta and the site clustering in themeasurement space. As q does not change with Ta, thelinear trend results from varying conditions over thetransect during a day. Elevated regions have lower Ta
and q (site 1, sampled early), while lower altitudes havehigher Ta and q (site 30, sampled late). This suggeststhe ambient lapse rate and diurnal cycle lead towarmer, more humid conditions at low elevations laterduring the day. For the soil properties, an overall trendbetween �� and Ts is not apparent, although site rela-tions indicate lower Ts for higher ��, (and vice versa),particularly for sites 16 and 30. A decrease in Ts withincreasing �� is a second component of the soil mois-ture–rainfall feedback mechanism proposed by Eltahir(1998). The relation between Ts and �� is expected to be
FIG. 11. Daily relations between measured soil and atmospheric variables at four transectsites representing different landscape positions and ecosystems (site 1, closed circles; site 12,open circles; site 16, closed triangles; site 30, open squares). Refer to Fig. 8 for the temporalvariation in soil moisture at each site. Shown are (a) air Ta (°C) vs Ts (°C), (b) specific q (gkg�1) vs �� (%), (c) q (g kg�1) vs Ta (°C), and (d) �� (%) vs Ts (°C). Each symbol depicts apair of measurements for a particular day at each site. For each soil variable (��, Ts) the plotaverage is utilized.
1804 J O U R N A L O F C L I M A T E VOLUME 20
strong, and approximately linear, due to the effects ofmoisture on soil thermal inertia (Lakshmi et al. 2003).Nevertheless, site-specific properties can control the Ts
– �� functional form, with site clustering indicating thatlandscape attributes (e.g., soils, elevation, vegetation)can be useful for predicting conditions.
d. Basin-averaged temporal variability ofland–atmosphere interactions
While remote land surface conditions potentially im-pact the monsoon onset (e.g., Gutzler and Preston 1997;Small 2001; Zhu et al. 2005), little is known about therole played by the internal surface properties in theregion on sustaining the monsoon. Matsui et al. (2005)studied a vegetation–rainfall feedback in the NAM re-gion, but point to the lack of a reliable dataset to prop-erly depict land–atmosphere interactions. In this study,we utilize the transect measurements of lower-atmospheric and soil conditions to assess the degree ofland–atmosphere coupling and its temporal variabilityduring the field campaign. To do so appropriately re-quires averaging over a domain of sufficient size whileaccounting for topographic variations. Figure 12 pre-sents a hypsometric technique for obtaining basin-averaged hydrometeorological quantities. Hypsometryrefers to the area–altitude distribution in a basin (e.g.,Strahler 1952; Luo 1998). A small watershed (�100km2) draining to the Río San Miguel is derived from a90-m DEM and divided into five elevation regions, rep-resenting landforms in the basin (mountain, slope, foot-slope/hill, valley, and lower valley). Note that most ofthe transect sites fall within the basin. Transect sitesoutside the basin were assumed to be valid representa-tions of similar elevations in the watershed.
The hypsometric technique is based on using the pro-jected area fraction of each elevation band as a weight-ing factor to compute the basin-averaged hydrometeo-rological quantity. Figure 12b depicts the percentage of
FIG. 12. Hypsometric method for averaging hydrometeorological variables over transect basin. (a) Distributionof elevation (m) in the transect basin (�100 km2) based on the 90-m DEM, along with the location of the transectsites (open circles). The basin is divided into five regions or elevation bands. (b) Percentage of the basin area (%area) and transect sites (% points) located in the five elevation bands: region 1 (lower valley, 643–797 m), region2 (valley, 797–899 m), region 3 (footslope/hill, 899–980 m), region 4 (slope, 980–1098 m), and region 5 (mountain,1098–1621 m). The footslope and hill landforms are grouped together as they share similar elevation ranges. Theupper and lower sites in the transect correspond to 1371 m (site 1) and 669 m (site 30), respectively.
TABLE 4. Linear regression statistics for land–atmosphere rela-tions (sites 1, 12, 16, and 30) and for their combination (e.g., foursites). The slope (S) and intercept (I ) are the parameters of thelinear regression in the units of measurement for each relation[e.g., Ta � Ts has S (°C °C�1) and I (°C)].
total basin area and transect sites found in each eleva-tion region. Note the mountain band (region 5, 1068–1621 m) occupies the largest area fraction (�40%), buthas relatively few sites (�20%) due to the difficulty inreaching high altitudes. In contrast, the valley band (re-gion 2, 797–899 m) is a small basin area percentage(�15%) and has the largest fraction of transect sites(�30%). Although a discrepancy exists between theelevation and transect site distributions, the biases in-troduced are minor as the soil conditions in each regionare sufficiently similar (Fig. 9). Furthermore, the spatialvariability in atmospheric properties is relatively small.
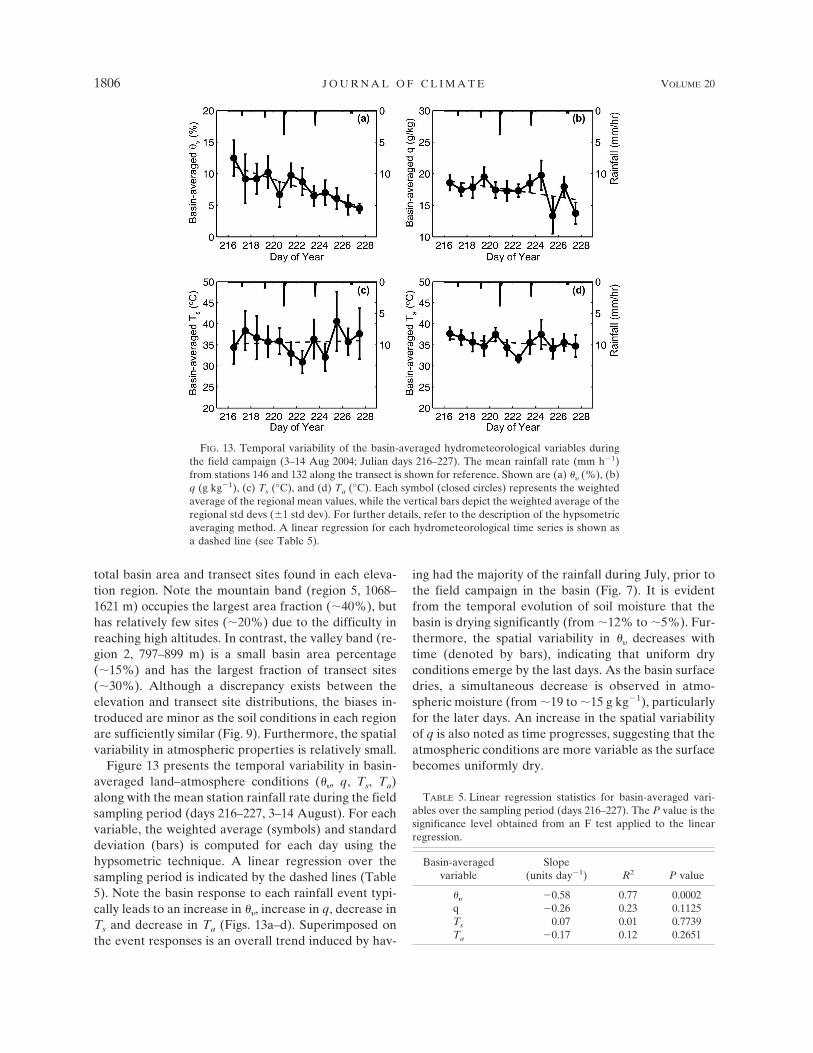
Figure 13 presents the temporal variability in basin-averaged land–atmosphere conditions (��, q, Ts, Ta)along with the mean station rainfall rate during the fieldsampling period (days 216–227, 3–14 August). For eachvariable, the weighted average (symbols) and standarddeviation (bars) is computed for each day using thehypsometric technique. A linear regression over thesampling period is indicated by the dashed lines (Table5). Note the basin response to each rainfall event typi-cally leads to an increase in ��, increase in q, decrease inTs and decrease in Ta (Figs. 13a–d). Superimposed onthe event responses is an overall trend induced by hav-
ing had the majority of the rainfall during July, prior tothe field campaign in the basin (Fig. 7). It is evidentfrom the temporal evolution of soil moisture that thebasin is drying significantly (from �12% to �5%). Fur-thermore, the spatial variability in �� decreases withtime (denoted by bars), indicating that uniform dryconditions emerge by the last days. As the basin surfacedries, a simultaneous decrease is observed in atmo-spheric moisture (from �19 to �15 g kg�1), particularlyfor the later days. An increase in the spatial variabilityof q is also noted as time progresses, suggesting that theatmospheric conditions are more variable as the surfacebecomes uniformly dry.
TABLE 5. Linear regression statistics for basin-averaged vari-ables over the sampling period (days 216–227). The P value is thesignificance level obtained from an F test applied to the linearregression.
FIG. 13. Temporal variability of the basin-averaged hydrometeorological variables duringthe field campaign (3–14 Aug 2004; Julian days 216–227). The mean rainfall rate (mm h�1)from stations 146 and 132 along the transect is shown for reference. Shown are (a) �� (%), (b)q (g kg�1), (c) Ts (°C), and (d) Ta (°C). Each symbol (closed circles) represents the weightedaverage of the regional mean values, while the vertical bars depict the weighted average of theregional std devs (1 std dev). For further details, refer to the description of the hypsometricaveraging method. A linear regression for each hydrometeorological time series is shown asa dashed line (see Table 5).
1806 J O U R N A L O F C L I M A T E VOLUME 20
The basin-averaged observations of soil moisture andspecific humidity suggest that the land surface and at-mosphere are coupled during this drydown period. Asthe mountainous terrain experiences more dramaticdrying due to the lack of rainfall, it is believed thatsurface conditions are driving the reductions in atmo-spheric moisture through decreased evapotranspira-tion. In fact, we noted that vegetation during the latercampaign days began to senesce and transpire at lowerrates. Thus, the recycling of soil moisture back to theatmosphere via land surface processes is an importantmechanism for sustaining high atmospheric moistureconditions (e.g., Bosilovich and Schubert 2002). Notethat the basin-averaged soil and air temperatures (Ts,Ta) do not exhibit significant temporal trends over theperiod (1°C; Figs. 13c and 13d, Table 5). This furtherindicates that the atmospheric drying trend is not re-lated to abrupt changes in temperature conditions, butrather to diminished recycling of rainfall-induced soilmoisture back to the lower atmosphere.
4. Discussion and conclusions
Relatively little is known about the role played by theland surface in sustaining monsoon conditions, primar-ily due to a serious lack of observations in the coremonsoon region. As a result, a clearly identified gap inour current knowledge has been the effects of topog-raphy on precipitation processes, land–atmosphere in-teractions, and hydrologic response (e.g., Higgins et al.2003; Gochis et al. 2004; Vera et al. 2006). Given thesemiarid, mountainous characteristics of the NAM re-gion, monsoon storms are a critical portion of the an-nual water budget and lead to significant responses atthe land surface. Increases in soil moisture, for ex-ample, induce flooding in ephemeral rivers (e.g.,Gochis et al. 2006) and allow the greening of a sub-tropical ecosystem (e.g., Salinas-Zavala et al. 2002).Therefore, an outstanding question concerns the poten-tial for a soil moisture–vegetation–rainfall feedbackmechanism to exist in the mountainous region and playa role in sustaining monsoon convection. As postulatedby Eltahir (1998), increases in soil moisture and veg-etation greening can affect the surface albedo and par-titioning between sensible and latent heat (e.g., evapo-transpiration), with subsequent effects on rainfall gen-eration. Note that topography would significantlyinfluence the existence of this feedback mechanism,through known effects on precipitation, air tempera-ture, soil moisture, runoff, and vegetation distribution(e.g., Brown 1994; Descroix et al. 2002b; Coblentz andRiitters 2004; Gochis et al. 2004, 2006).
The observational data analysis and interpretations
presented in this study help to address critical questionsconcerning land–atmosphere interactions and hydro-logic response during the North American monsoon. Inparticular, the field experiment design was focused onassessing the topographic controls on hydrometeoro-logical conditions through systematic daily sampling ofatmospheric and soil variables over a range of eleva-tions and ecosystem types. We identify the followingcharacteristics of the regional hydrometeorology, soilmoisture distribution, and land–atmosphere interac-tions in the Sierra Madre Occidental of northern So-nora, Mexico.
1) The spatial distribution of monsoon rainfall in thestudy region is controlled by terrain elevation andrelative position along a river valley. Mountain sitesreceive frequent, small events, while valley sites aredominated by larger, more infrequent storms. Astronger correspondence was observed between me-soscale storms along the river valley and the basinflood response, as compared with mountain regionsexperiencing single-cell convection. The topo-graphic transect was characterized by high rainfallamounts prior to the field experiment, which werecomparable to regional amounts, and a general dry-ing trend during the sampling period over most el-evations.
2) The spatial and temporal patterns in soil moisturedistribution indicate that elevation (and landform)helps explain much of the observed variability, inparticular during wet periods. Moisture conditionsafter a rainfall event are quickly dissipated (follow-ing an exponential decay) through evapotranspira-tion, soil infiltration, or downslope lateral fluxes. Asthe land surface dries due to the lack of rainfallforcing, the topographic control diminishes and ho-mogenization of soil moisture is observed across thelandscape. This suggests that capturing the eleva-tional variability of soil moisture is most critical dur-ing moist periods in the monsoon season and canaffect the establishment of a soil moisture–vegeta-tion–rainfall feedback mechanism.
3) Simultaneous atmospheric and soil conditions over arange of transect sites indicate that coupling exists(to varying degrees) between the temperature andmoisture conditions across the land–atmosphere in-terface. Elevation and ecosystem type control thestrength of the relations and lead to site clustering inthe variable space. Land–atmosphere interactionsreflect the ambient lapse rate and diurnal cycle ofatmospheric properties and the elevation-inducedvariations in soil conditions. The observed couplingfollows postulated trends (Eltahir 1998) that suggest
1 MAY 2007 V I V O N I E T A L . 1807
evidence of a soil moisture–vegetation–rainfall feed-back mechanism and illustrate the recycling of soilmoisture (in particular for subtropical scrub) back tothe atmosphere during the monsoon.
4) Basin-averaged observations of soil moisture andspecific humidity were derived for each samplingday by utilizing a hypsometric technique that ac-counts for topographic variability over a regionaldomain (�100 km2). The temporal evolution of soilmoisture clearly indicates that significant drying andhomogenization occurred across the transect duringthe sampling period. A decrease in land surfacemoisture ultimately began to drive reductions in at-mospheric moisture through decreased recyclingback to the atmosphere (evapotranspiration). Thecoupled drydown response at the land–atmosphereinterface suggests that land surface processes in theregion sustain atmospheric moisture conditions dur-ing the monsoon.
Results of this study are based on observations ofatmospheric and soil surface properties obtained duringa short-term field experiment within a topographictransect representing a small domain of the NAM re-gion. Despite the limited temporal extent, the timing ofthe field study was fortuitously appropriate to assessthe potential role of the land surface in influencing at-mospheric conditions during a drydown period. Never-theless, further work is required to conclusively verifythe soil moisture–vegetation–rainfall feedback mecha-nism as a means for sustaining the monsoon. One ap-propriate avenue is to supplement existing instrumentnetworks (e.g., Gochis et al. 2004; Gebremichael et al.2007) with measurements of atmospheric conditionsand to fill in gaps along well-selected topographictransects. Furthermore, remotely sensed observationsof rainfall, water vapor, surface temperature, soil mois-ture, and vegetation may provide a means for assessingland–atmosphere interaction at the regional scale andthe effects of vegetation changes in recycling moistureback to the atmosphere. The subtropical scrub shouldbe targeted as it occupies broad areas of the landscapeand can sustain high specific humidity despite relativelylow soil moisture contents. Capturing ecosystem dy-namics and terrain controls on hydrologic response iscritical for properly representing the role of the landsurface in numerical models of the monsoon.
Acknowledgments. We would like to acknowledgefunding from the NASA Terrestrial Hydrology Pro-gram, the NASA AMSR-E Validation Program, andthe NOAA North American Monsoon Experiment(NAME). We thank David Gochis (NCAR), Pamela
Nagler (USGS), and Jaime Garatuza-Payán (ITSON)for providing useful ancillary datasets for this study. Wealso acknowledge the excellent comments by threeanonymous reviewers.
REFERENCES
Adams, D. K., and A. C. Comrie, 1997: The North Americanmonsoon. Bull. Amer. Meteor. Soc., 78, 2197–2213.
Bosilovich, M. G., and S. D. Schubert, 2002: Water vapor tracersas diagnostics of the regional hydrologic cycle. J. Hydro-meteor., 3, 149–165.
Brito-Castillo, L., A. V. Douglas, A. Leyva-Contreras, and D.Lluch-Belda, 2003: The effect of large-scale circulation onprecipitation and streamflow in the Gulf of California conti-nental watershed. Int. J. Climatol., 23, 751–768.
Brown, D. E., 1994: Biotic Communities: Southwestern UnitedStates and Northwestern Mexico. University of Utah Press,342 pp.
Brown, D. P., and A. C. Comrie, 2002: Spatial modeling of winterprecipitation in Arizona and New Mexico. Climate Res., 22,115–128.
CNA, 2002: Determinación de la disponibilidad de agua en elacuífero Río Sonora, Estado Sonora. Comisión Nacional delAgua, 42 pp.
CNA, 2004: Aforo de Aguas Superficiales Estación El Cajón, RíoSan Miguel. Subgerencia Regional del Noroeste, ComisiónNacional del Agua.
Coblentz, D. D., and K. H. Riitters, 2004: Topographic controlson the regional-scale biodiversity of the south-western USA.J. Biogeogr., 31, 1125–1138.
Cosh, M. H., T. J. Jackson, R. Bindlish, and J. H. Prueger, 2004:Watershed scale temporal and spatial stability of soil mois-ture and its role in validating satellite estimates. Remote Sens.Environ., 92, 427–435.
——, ——, ——, J. S. Famiglietti, and D. Ryu, 2005: Calibrationof an impedance probe for estimation of surface soil watercontent over large regions. J. Hydrol., 311, 49–58.
Descroix, L., J. L. Gonzalez Barrios, J. P. Vandervaere, D. Vira-montes, and A. Bollery, 2002a: An experimental analysis ofhydrodynamic behavior on soils and hillslopes in a subtropi-cal mountainous environment (western Sierra Madre,Mexico). J. Hydrol., 266, 1–14.
——, J.-F. Nouvelot, and M. Vauclin, 2002b: Evaluation of ante-cedent precipitation index to model runoff yield in the west-ern Sierra Madre. J. Hydrol., 263, 114–130.
Douglas, M. W., R. A. Maddox, K. Howard, and S. Reyes, 1993:The Mexican monsoon. J. Climate, 6, 1665–1677.
Eltahir, E. A. B., 1998: A soil moisture rainfall feedback mecha-nism 1. Theory and observations. Water Resour. Res., 34, 765–776.
Entekhabi, D., 1995: Recent advances in land–atmosphere inter-action research. Rev. Geophys., 33 (S1), 995–1004.
Famiglietti, J. S., J. W. Rudnicki, and M. Rodell, 1998: Variabilityin surface moisture content along a hillslope transect: Rattle-snake Hill, Texas. J. Hydrol., 210, 259–281.
Gebremichael, M., E. R. Vivoni, C. J. Watts, and J. C. Rodríguez,2007: Submesoscale spatiotemporal variability of NorthAmerican monsoon rainfall over complex terrain. J. Climate,20, 1751–1773.
Gochis, D. J., A. Jiménez, C. J. Watts, J. Garatuza-Payán, andW. J. Shuttleworth, 2004: Analysis of 2002 and 2003 warm-
1808 J O U R N A L O F C L I M A T E VOLUME 20
season precipitation from the North American Monsoon Ex-periment event rain gauge network. Mon. Wea. Rev., 132,2938–2953.
——, L. Brito-Castillo, and W. J. Shuttleworth, 2006: Hydrocli-matology of the North American monsoon region in north-west Mexico. J. Hydrol., 316, 53–70.
Gutzler, D. G., 2004: An index of interannual precipitation vari-ability in the core of the North American monsoon region. J.Climate, 17, 4473–4480.
——, and J. Preston, 1997: Evidence for a relationship betweenspring snow cover in North American and summer rainfall inNew Mexico. Geophys. Res. Lett., 24, 2207–2210.
Higgins, R. W., and Coauthors, 2003: Progress in pan AmericanCLIVAR research: North American monsoon system. At-mósfera, 16, 29–65.
INEGI, 1998: Modelos Digitales de Elevación 1:250, 000. InstitutoNacional de Estadística, Geografía e Informática.
INIFAP, 2001: Inventario Nacional de Suelos 1:250, 000. InstitutoNacional de Investigaciones Forestales, Agrícolas y Pecuar-ias.
Jackson, T. J., and A. Y. Hsu, 2001: Soil moisture and TRMMMicrowave Imager relationships in the Southern Great Plains1999 (SGP99) experiment. IEEE Trans. Geosci. RemoteSens., 39, 1632–1642.
Kurc, S. A., and E. E. Small, 2004: Dynamics of evapotranspira-tion in semiarid grassland and shrubland ecosystems duringthe summer monsoon season, central New Mexico. WaterResour. Res., 40, W09305, doi:10.1029/2004WR003068.
Lakshmi, V., T. J. Jackson, and D. Zehrfuhs, 2003: Soil moisture–temperature relationships: Results from two field experi-ments. Hydrol. Processes, 17, 3041–3057.
Luo, W., 1998: Hypsometric analysis with a geographic informa-tion system. Comput. Geosci., 24, 815–822.
Matsui, T., V. Lakshmi, and E. E. Small, 2005: The effects ofsatellite-derived vegetation cover variability on simulatedland–atmosphere interactions in the NAMS. J. Climate, 18,21–40.
NAME Project Science Team, 2004: North American MonsoonExperiment (NAME): Science and implementation plan.NOAA/NCEP/CPC, 96 pp. [Available online at http://www.cpc.ncep.noaa.gov/products/precip/monsoon/.]
Paredes-Aguilar, R., T. R. Van Devender, and R. S. Fegler, 2000:Cactáceas de Sonora, Mexico: Su Diversidad, Uso y Conser-vación. Arizona-Sonora Desert Museum Press, 132 pp.
Rodríguez-Iturbe, I., 2000: Ecohydrology: A hydrologic perspec-tive on climate–soil–vegetation dynamics. Water Resour. Res.,36, 3–9.
Rogers, R. R., and M. K. Yau, 1989: A Short Course on CloudPhysics. 3d ed. Butterworth-Heinemann, 304 pp.
Salinas-Zavala, C. A., A. V. Douglas, and H. F. Díaz, 2002: Inter-
annual variability of NDVI in northwest Mexico: Associatedclimatic mechanisms and ecological implications. RemoteSens. Environ., 82, 417–430.
Schmugge, T., T. J. Jackson, W. P. Kustas, R. Roberts, R. Parry,D. C. Goodrich, S. A. Amer, and M. A. Weltz, 1994: Pushbroom microwave radiometer observations of surface soilmoisture in Monsoon ’90. Water Resour. Res., 30, 1321–1328.
Seyfried, M. S., and M. D. Murdock, 2004: Measurement of soilwater content with a 50-MHz soil dielectric sensor. Soil Sci.Soc. Amer. J., 68, 394–403.
Sheppard, P. R., A. C. Comrie, G. D. Packin, K. Angersbach, andM. K. Hughes, 2002: The climate of the US southwest. Cli-mate Res., 21, 219–238.
SIUE-IMADES, 1998: Proyecto de Ordenamiento Ecológico delTerritorio del Estado de Sonora. Instituto del Medio Ambi-ente y Desarrollo Sustentable del Estado de Sonora, 577 pp.
Small, E. E., 2001: The influence of soil moisture anomalies onvariability of the North American monsoon system. Geophys.Res. Lett., 28, 139–142.
——, and S. A. Kurc, 2003: Tight coupling between soil moistureand the surface radiation budget in semiarid environments:Implications for land–atmosphere interactions. Water Resour.Res., 39, 1278, doi:10.1029/2002WR001297.
SMEX Science Team, 2004: Soil Moisture Experiments in 2004:Experiment plan. USDA, 132 pp. [Available online at http://hydrolab.arsusda.gov/smex04/.]
SPP, 1984: Carta Geológica 1:250, 000 H12-5. 1st ed. DirecciónGeneral de Geografía, México, Secretaría de Programación yPresupuesto.
Strahler, A. N., 1952: Hypsometric (area-altitude) analysis of ero-sional topography. Bull. Geol. Soc. Amer., 63, 1117–1142.
Vera, C., and Coauthors, 2006: A unified view of the Americanmonsoon systems. J. Climate, 19, 4977–5000.
Xie, P., Y. Yarosh, M. Chen, R. Joyce, J. E. Janowiak, and P. A.Arkin, 2005: Diurnal cycle of cloud and precipitation associ-ated with the North American monsoon system: Preliminaryresults for 2003 and 2004. Preprints, 16th Conf. on ClimateVariability and Change, San Diego, CA, Amer. Meteor. Soc.,CD-ROM, 4.22.
Xu, J. J., X. Gao, J. Shuttleworth, S. Sorooshian, and E. Small,2004a: Model climatology of the North American monsoononset period during 1980–2001. J. Climate, 17, 3892–3906.
——, W. J. Shuttleworth, X. Gao, S. Sorooshian, and E. E. Small,2004b: Soil moisture–precipitation feedback on the NorthAmerican monsoon system in the MM5-OSU model. Quart.J. Roy. Meteor. Soc., 130, 2873–2890.
Zhu, C., D. P. Lettenmaier, and T. Cavazos, 2005: Role of ante-cedent land surface conditions on North American monsoonrainfall variability. J. Climate, 18, 3104–3121.