Variation of root distribution in relation to depth and lithology Maggie Ruppel (REU) 1 , Siobhan Donnely (RET) 2 , Tom Adams 3 , Dave Eissenstat 3 Wittenberg University 1 , CLC Charter School 2 , Penn State University 3
Transcript
Variation of root distribution in relation to depth and lithology
Maggie Ruppel (REU)1, Siobhan Donnely (RET)2, Tom Adams3, Dave Eissenstat3
Wittenberg University1, CLC Charter School2, Penn State University3
Research Focus
•Tuscarora Forest▫Similar lithology to Shale Hills and Garner
Run
•12 pits total▫4 Clinton Group: Rose Hill Shale▫4 Tuscarora: Sandstone▫4 Juniata: Shale and Siltstone
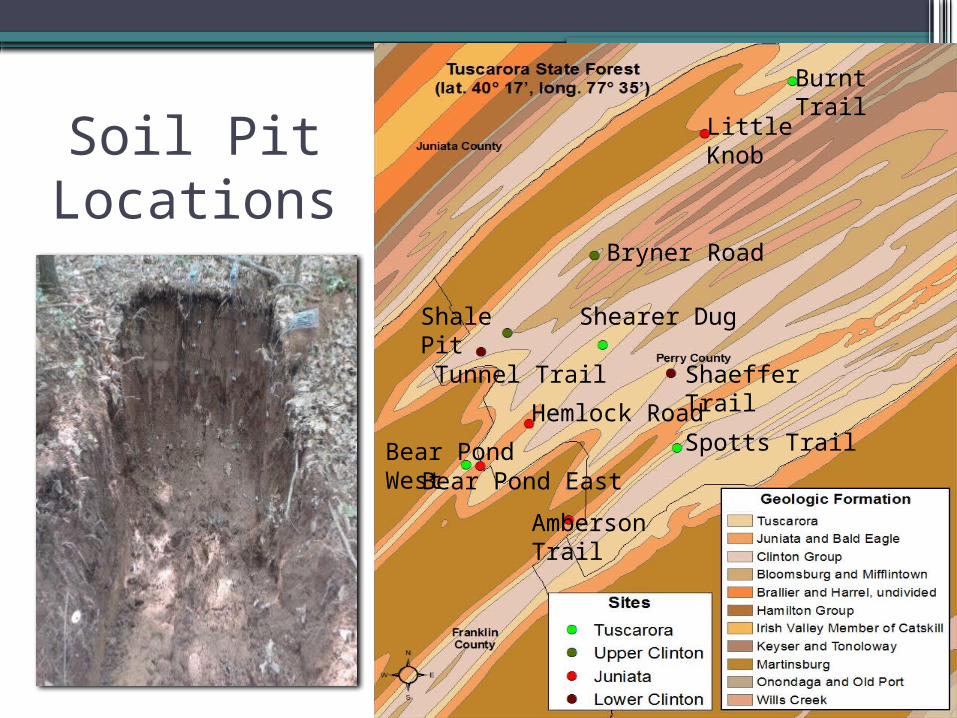
Location
Soil Pit Locations
Little Knob
Bryner Road
Shearer Dug
Shaeffer Trail
Spotts Trail
Shale Pit
Hemlock RoadBear Pond
WestBear Pond East
Amberson Trail
Burnt Trail
Tunnel Trail
Questions Hypotheses
• How will depth affect root density?
• How will lithology affect root density and distribution?
• What factors drive root density and distribution in these lithologies?
• Shale pits will have a higher density of roots in the upper depth increments as compared to sandstone
• Sandstone pits will have a higher density of roots in the lower depth increments as compared to shale
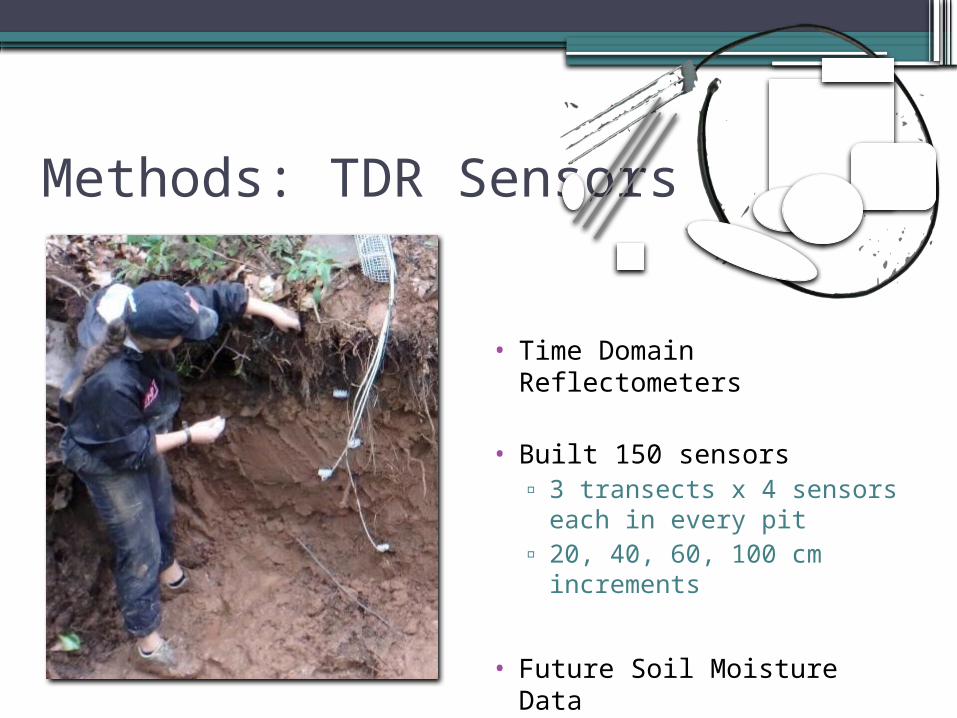
Methods: TDR Sensors
• Time Domain Reflectometers
• Built 150 sensors▫ 3 transects x 4 sensors
each in every pit▫ 20, 40, 60, 100 cm
increments
• Future Soil Moisture Data
Methods: TDR Sensors
20 cm
40 cm
60 cm
100 cm
Methods: Root Sampling
• Collected 25 roots per pit▫ 5 transects x 5 samples
each▫ 10, 20, 40, 60, 100 cm
increments▫ Stored in cooler for
preservation
• Tree DNA identification
• Mycorrhizal fungi DNA identification
Methods: Root Density via Photos
• 30cm x 30cm frame
• Record details
• 5 transects, 0-100 cm
• Macro setting for top 10cm
Methods: Root Density via PhotosCounting Roots Calculating Root Density
• Overlay grid lines
• Subsample 2 grid sections per depth increment
• Count root intersections▫ Imaginary plane
intersecting roots▫ Microsoft Paint to mark
roots on photos
• Root intersections/area
• Average 2 subsamples per depth increment
Methods: Root Density via Photos
Root Intersections cm-2
0 2 4 6 8
De
pth
Incre
me
nt (cm
)
0 2 4 6 8
SHT TL
SP BR0-10
11-20
21-40
41-60
61-80
81-100
0-10
11-20
21-40
41-60
61-80
81-100
>100
>100
Clinton Shale PitsC
linto
nD
ep
th I
ncr
em
en
t (c
m)
De
pth
Incre
me
nt (cm
)
0 1 2 3 4 5
BD
BT
Root Intersections cm-2
0 1 2 3 4 5
SPT
SD
Tuscarora Sandstone Pits
0-10
11-20
21-40
41-60
61-80
81-100
0-10
11-20
21-40
41-60
61-80
81-100
Tusc
aro
raD
ep
th I
ncr
em
en
t (c
m)
Junia
ta
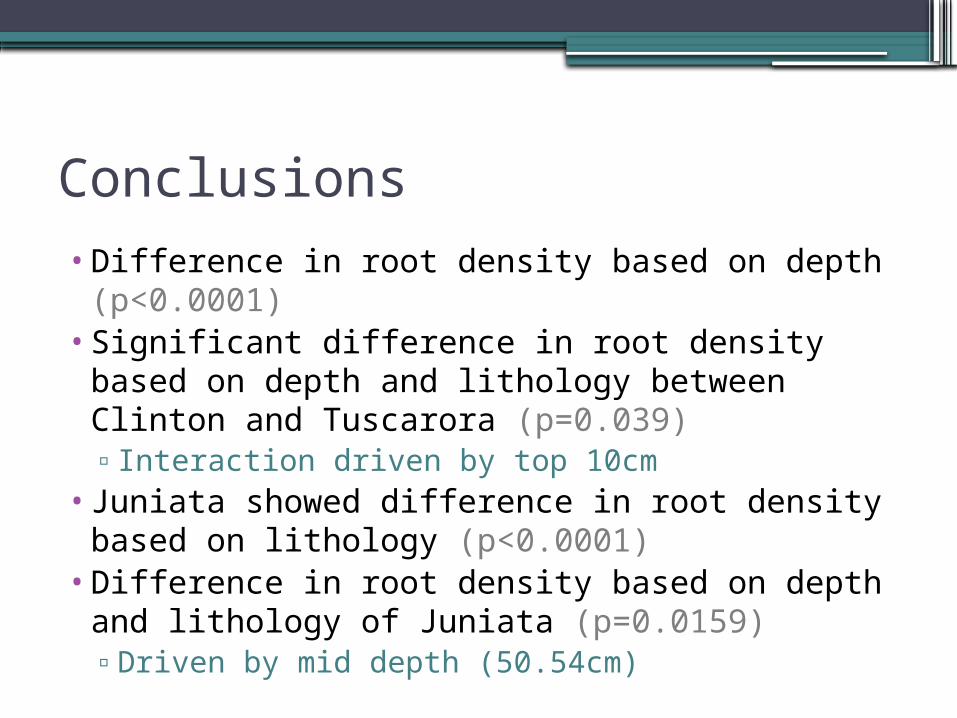
Conclusions• Difference in root density based on depth
(p<0.0001)• Significant difference in root density based on
depth and lithology between Clinton and Tuscarora (p=0.039)▫ Interaction driven by top 10cm
• Juniata showed difference in root density based on lithology (p<0.0001)
• Difference in root density based on depth and lithology of Juniata (p=0.0159)▫Driven by mid depth (50.54cm)
Discussion
•Sandstone has a greater porosity than shale▫ Sandstone does not retain water or
nutrients as well as shale▫Sandstone should
•Spike at 40cm in Tuscarora▫possibly an alluvial fan
•What makes Juniata so different
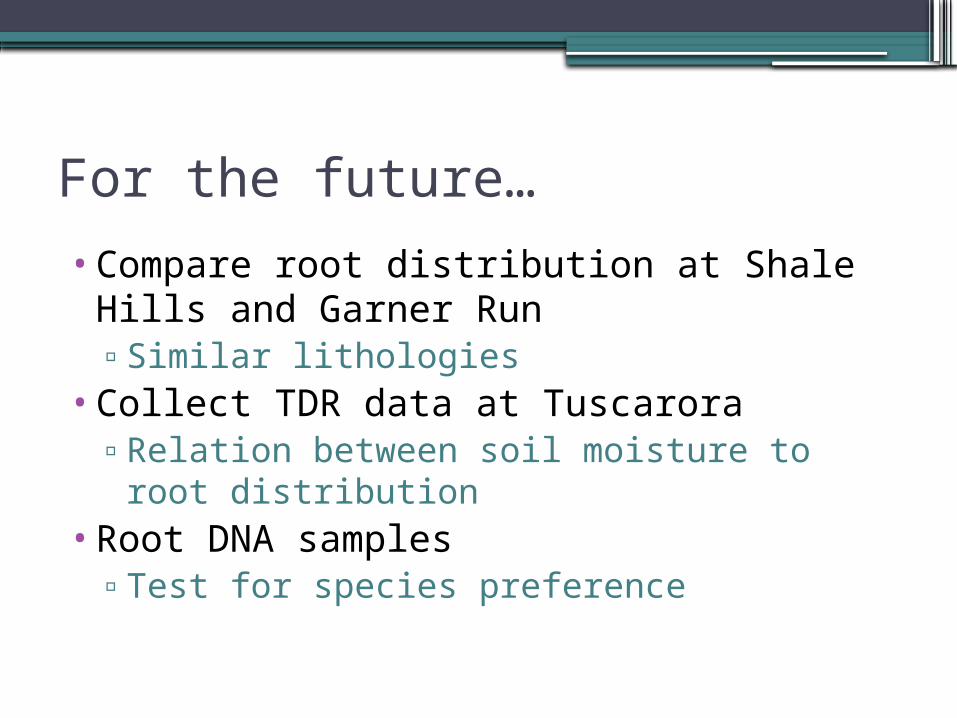
For the future…
•Compare root distribution at Shale Hills and Garner Run▫Similar lithologies
•Collect TDR data at Tuscarora▫Relation between soil moisture to root
distribution•Root DNA samples
▫Test for species preference
Thanks!• Dave Eissenstat• Tom Adams• Jessie Ward• Liza Brazil