2016 National Ambient Air Monitoring Conference Verifying Zero Air Sources in an Ambient Air Gaseous Monitoring Network Yousaf Hameed, MPA Air Quality Monitoring Supervisor Clark County Department of Air Quality (DAQ)
Transcript
2016 National Ambient Air Monitoring Conference
Verifying Zero Air Sources in an Ambient Air Gaseous Monitoring Network
Quality Data: proper instrument operation: Calibration• Good quality zero air is important • Lower level measurements and upscale
regressionClean/reliable zero air is a must • How do we verify zero air sources?
Zero Air Systems
Two Primary Options: Cylinders and Zero Air Generators (ZAG)
Cylinders • Vendor Certification Available (NIST Traceable) • Independent and Alternate Source• Finite Amount• Moisture Issues• Purity Levels
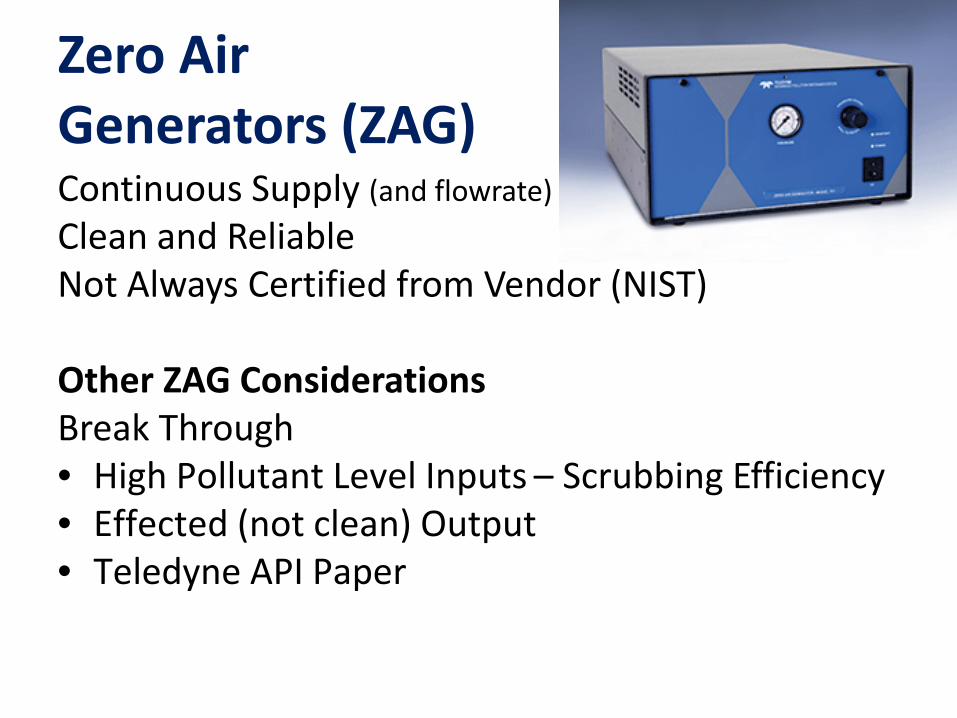
Zero Air Generators (ZAG) Continuous Supply (and flowrate) Clean and Reliable Not Always Certified from Vendor (NIST)
Other ZAG Considerations Break Through• High Pollutant Level Inputs – Scrubbing Efficiency • Effected (not clean) Output• Teledyne API Paper
EPA Efforts
EPA RequirementsRules and guidance are sparse
State and local initiatives
QA Workgroup is developing guidance
Developing a Local Procedure
Technical ChallengesIterative Process Some Issues (along the way): • Measuring below Lower Detectable Limit (LDL)• Response time / stability • Flow rate and pressure • Reliability and repeatability
Procedural Approach
First Iteration
NIST traceable zero air cylinder• Sequenced with a series of scrubbers (for cleaning
and drying) • System was a standard
Procedural Approach (contd.)
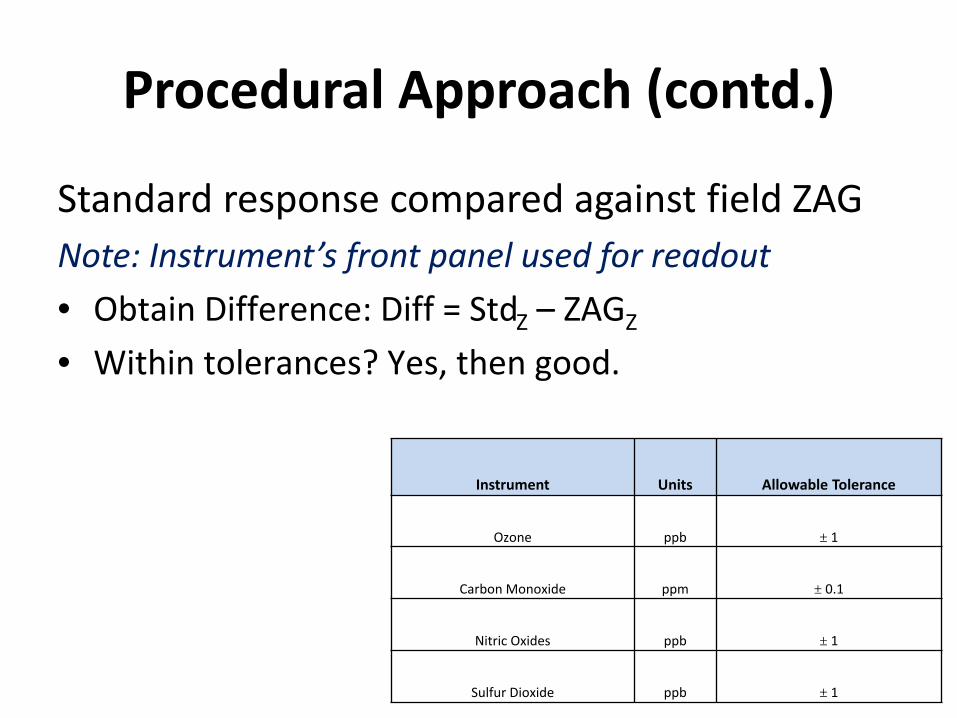
Standard response compared against field ZAGNote: Instrument’s front panel used for readout• Obtain Difference: Diff = StdZ – ZAGZ
• Within tolerances? Yes, then good.
Instrument Units Allowable Tolerance
Ozone ppb ± 1
Carbon Monoxide ppm ± 0.1
Nitric Oxides ppb ± 1
Sulfur Dioxide ppb ± 1
Procedural Approach (updated)
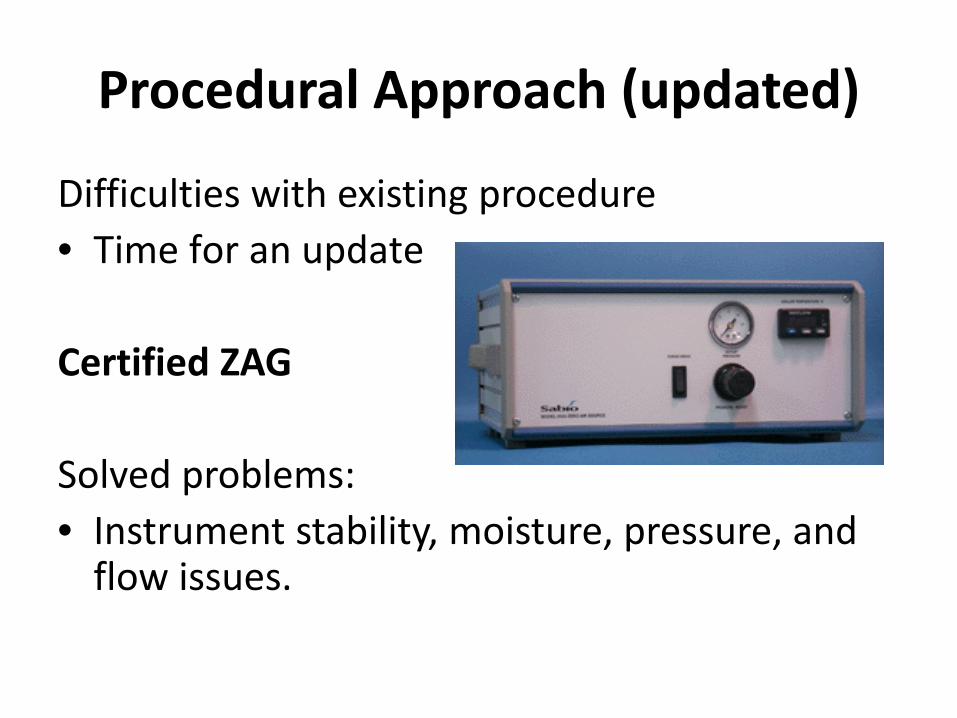
Difficulties with existing procedure• Time for an update
Certified ZAG
Solved problems: • Instrument stability, moisture, pressure, and
flow issues.
Methods (Zero Air Verification)
1. Zero air from standard to measurement instrument 2. Analyzer zero coefficient is adjusted 3. Zero air from field ZAG to measurement instrument.
Test reading is taken 4. If within tolerance, then test passes
• Note: Difference measurement between the standard and field ZAG is not needed
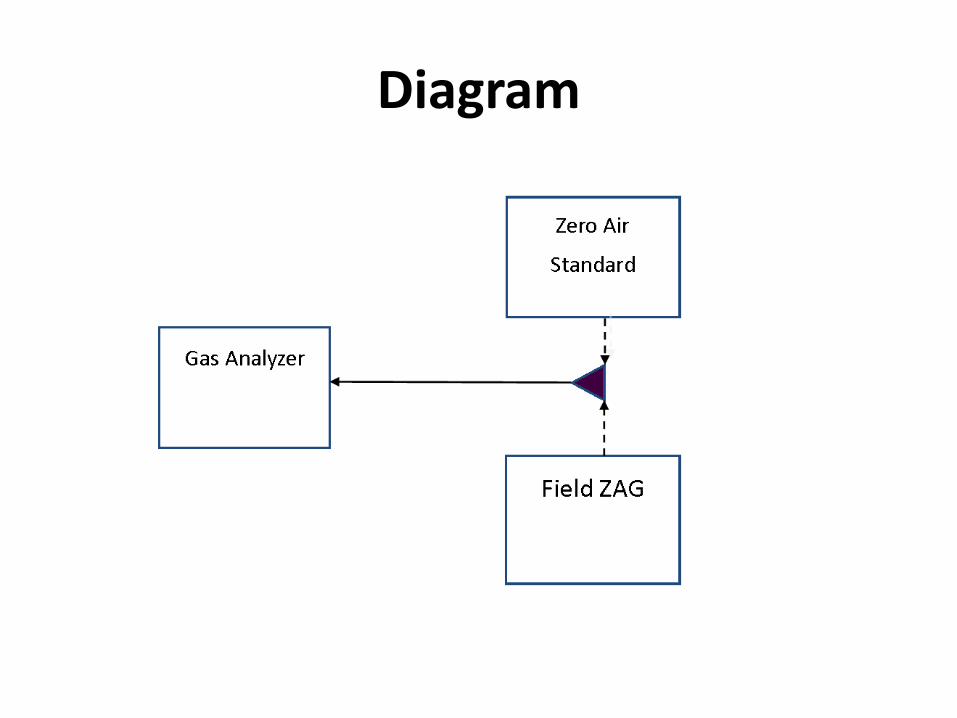
Diagram
Information About Data
• Annual testing of all the field ZAGsoMore often in some cases
• Test for each parameter being measured• 2015 testing – Sampling of data (next slide)
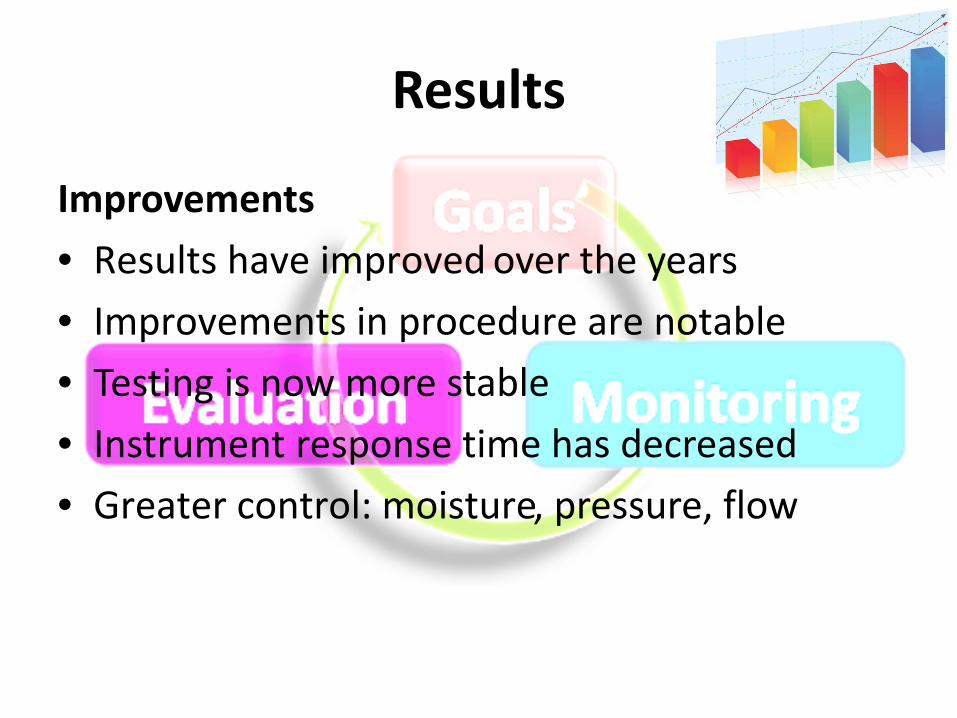
Results
Improvements • Results have improved over the years• Improvements in procedure are notable • Testing is now more stable • Instrument response time has decreased• Greater control: moisture, pressure, flow
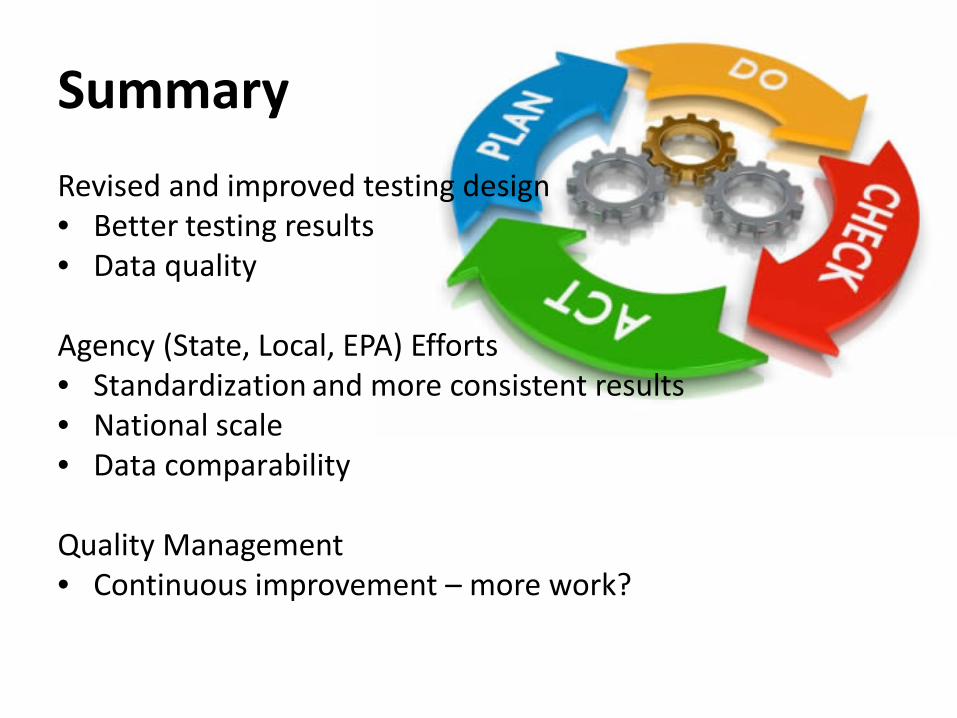
SummaryRevised and improved testing design• Better testing results• Data quality
Agency (State, Local, EPA) Efforts • Standardization and more consistent results • National scale • Data comparability
Quality Management • Continuous improvement – more work?
Acknowledgements
US EPA:Dennis Mikel, Matthew Plate, and Mike Papp
San Diego APCD: David Sodeman, David Roque
Clark County: Stephen Deyo, Kristopher Simonian, Mickey Turner, Piotr Nowinski
ReferencesTeledyne API – Engineering Report (ENG-016): M701H Zero Air Characterization Report (October 29, 2008).
U.S. Government Publishing Office; Electronic Code of Federal Regulations: Title 40, Part 53: Table B-1 to Subpart of Part 53–Performance Limit specifications for Automated Methods. See http://www.ecfr.gov/cgi-bin/text-idx?SID=69e22778299ed5e4eedf739c689b568f&mc=true&node=pt40.6.53&rgn=div5 (accessed May 5, 2016).
United States Environmental Protection Agency; Quality Assurance Handbook for Air Pollution Measurement Systems, Volume II, Ambient Air Quality Monitoring Program. See http://www3.epa.gov/ttnamti1/files/ambient/pm25/qa/QA-Handbook-Vol-II.pdf (accessed May 5, 2016).
Any Questions? Contact: Yousaf Hameed, MPAAir Quality Monitoring SupervisorClark County Department of Air QualityDirect: (702) 455-1664 Email: [email protected]