Vertical and horizontal variation in natural chloroform in two adjacent soil profiles in a coniferous forest
C. N. Albers, T. Laier & O. S. Jacobsen Department of Geochemistry, National Geological Survey of Denmark and Greenland, Denmark
Abstract
Naturally produced chloroform is occasionally detected in soil and groundwater of non-urban areas in concentrations that can exceed the regulatory levels. In this study, we present the distribution of naturally produced chloroform in a temperate coniferous forest from top soil to upper groundwater. Chloroform is most likely produced by the activity of fungi, and the production varies therefore with the domains of certain unidentified fungi. We show that the differences in concentration within 10 metres can approach two orders of magnitude in the top soil. The difference in chloroform concentrations in upper groundwater within the same distance is almost one order of magnitude. The concentration of chloroform in the top soil varies significantly with season, while season affect deeper levels much less. Keywords: chloroform, fungi, groundwater, unsaturated zone, natural organohalogens.
1 Introduction
Halogenated organic compounds in the environment are usually viewed as a result of human activity. Even though this is often true, more than 3800 naturally produced halogenated organic compounds have been identified so far [1]. In non-urban environments, chloroform (CHCl3) is occasionally detected in the groundwater where no obvious anthropogenic source is present [2]. Furthermore, global estimations of chloroform production have shown that less than 10% is of anthropogenic origin whereas marine and terrestrial production must make up more than 85% [3,4].
In Denmark, the concentration of chloroform was not allowed to exceed 1 µg/L in groundwater abstracted for drinking water. However, as a result of recent investigations on natural chloroform [5], this value has now been extended to 10 µg/L, provided a natural source is likely to exist in the recharge area and the waterworks can verify, that the chloroform has a natural origin. Industrial and natural chloroform may be distinguished using stable carbon isotopic analysis with industrial chloroform having a δ13C range from -46 to –63 ‰ and naturally produced chloroform having δ13C from -13 to -27‰ [6]. One laboratory study has shown a net production of chloroform in the organic horizon of a temperate spruce forest soil [7]. This production was most likely the result of microbial activity. Several studies have shown that the soil air of coniferous forests in general have chloroform concentrations significantly elevated to the background atmospheric concentration of ~20 pptv [8]. The concentrations range from 2–10 times atmospheric concentration in a temperate coniferous forest on clayey soil [9] to more than 300 times the atmospheric background in a temperate Douglas fir forest [10]. Based on the limited number of studies, forest soils with a well developed organic top layer seems to be the prerequisite for high chloroform net production and emission compared to grasslands and forests devoid of such organic horizon, as was also concluded by Hoekstra et al. [11]. Various studies indicate that fungi might be responsible for the production of chloroform in forest soils. Haselmann et al. [7] found that both air drying and sterilization of the soil diminished the net production of chloroform, Hoekstra et al. [10] suggested that fungal enzymes like chloroperoxidases could be involved in chloroform production and three fungal strains were shown to produce chloroform when grown on sterilized forest O-horizon [12]. Naturally produced chloroform has been detected in soil air to a depth of 7.5 m below the surface [13]. Furthermore, chloroform was detected in nearby shallow groundwater wells. However, the concentrations of chloroform in groundwater, up to 1.6 µg/L, were much higher than would have been anticipated from the measured soil air concentrations using Henry’s Law. The authors could not explain this paradox. In the present paper we show that concentration of chloroform within an area may be so variable that narrow sampling of both soil gas and groundwater is necessary to be able to establish a relation between chloroform concentrations in gas phase and water phase. This is even the case for areas with the same type of vegetation. We also found that although high natural chloroform concentrations are mostly found in coniferous forests, it is not straightforward to judge the potential chloroform production from vegetation type and general soil parameters alone.
2 Materials and methods
2.1 Location
The study area is a small part of a forest, far from industrial activity, at Tisvilde Hegn, Northern Sjælland, Denmark. The area is close to a monitoring well showing high chloroform content in the shallow groundwater. Regular analyses by the Danish National Groundwater Quality Monitoring Program during the last
17 years have shown chloroform concentrations up to 6 µg/L [14]. The subsurface of the area consists of diluvial sand covered by aeolian sand in the top 0.5 m. The area was forested in the 19th century to prevent further soil erosion. This forestation of a soil very low in nutrients has resulted in a well-developed O-horizon, 5-20 cm thick. The vegetation is mainly old Scots Pine (Pinus sylvestris) and young Common Spruce (Picea abies). Vegetation below the trees of the dense forest is sparse grass and moss.
2.2 Sampling
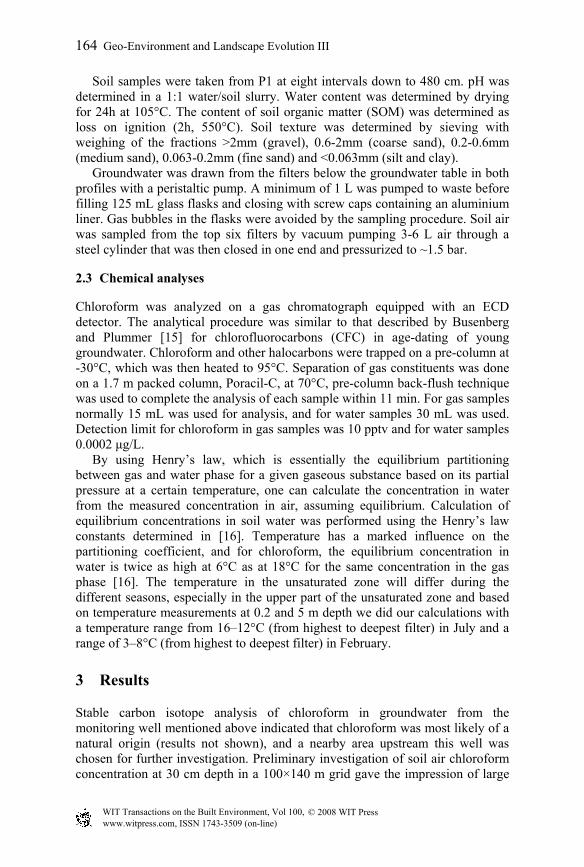
Preliminary investigation revealed high spatial heterogeneity in chloroform concentration and two permanent profiles for monitoring chloroform in soil air and in the top groundwater were established: one profile (P1) was established where chloroform concentration in the top soil air was high, and the other profile (P2) was established 10 metres away, where chloroform concentration in the top soil air was ~100 times lower than in P1. Each profile was established by drilling by hand (diameter ~10 cm) to 6 m depth. Eight 5 cm brass filters were then placed from the bottom and up at specific intervals, with two filters below the groundwater level (~4.5 m below surface) and six filters in the unsaturated zone (Figure 1). Each filter was connected to a 6 mm nylon tube that was later used for sampling. The original sand was refilled and between each filter, a layer of bentonite was placed to avoid shortcut between filters.
6.0m
Gas cylinder
Original soil refill
5.2m
4.4m
3.4m
2.3m
1.0m
0.5m0.3m
Bentonite
~10cm
Vacuumpump
Perist.pump
125mL flask
Groundwater level
Figure 1: Sketch of the installation placed in each of the profiles 1 and 2 and the sampling of soil air from the top six filters and groundwater from the lowest two filters.
Soil samples were taken from P1 at eight intervals down to 480 cm. pH was determined in a 1:1 water/soil slurry. Water content was determined by drying for 24h at 105°C. The content of soil organic matter (SOM) was determined as loss on ignition (2h, 550°C). Soil texture was determined by sieving with weighing of the fractions >2mm (gravel), 0.6-2mm (coarse sand), 0.2-0.6mm (medium sand), 0.063-0.2mm (fine sand) and <0.063mm (silt and clay). Groundwater was drawn from the filters below the groundwater table in both profiles with a peristaltic pump. A minimum of 1 L was pumped to waste before filling 125 mL glass flasks and closing with screw caps containing an aluminium liner. Gas bubbles in the flasks were avoided by the sampling procedure. Soil air was sampled from the top six filters by vacuum pumping 3-6 L air through a steel cylinder that was then closed in one end and pressurized to ~1.5 bar.
2.3 Chemical analyses
Chloroform was analyzed on a gas chromatograph equipped with an ECD detector. The analytical procedure was similar to that described by Busenberg and Plummer [15] for chlorofluorocarbons (CFC) in age-dating of young groundwater. Chloroform and other halocarbons were trapped on a pre-column at -30°C, which was then heated to 95°C. Separation of gas constituents was done on a 1.7 m packed column, Poracil-C, at 70°C, pre-column back-flush technique was used to complete the analysis of each sample within 11 min. For gas samples normally 15 mL was used for analysis, and for water samples 30 mL was used. Detection limit for chloroform in gas samples was 10 pptv and for water samples 0.0002 µg/L. By using Henry’s law, which is essentially the equilibrium partitioning between gas and water phase for a given gaseous substance based on its partial pressure at a certain temperature, one can calculate the concentration in water from the measured concentration in air, assuming equilibrium. Calculation of equilibrium concentrations in soil water was performed using the Henry’s law constants determined in [16]. Temperature has a marked influence on the partitioning coefficient, and for chloroform, the equilibrium concentration in water is twice as high at 6°C as at 18°C for the same concentration in the gas phase [16]. The temperature in the unsaturated zone will differ during the different seasons, especially in the upper part of the unsaturated zone and based on temperature measurements at 0.2 and 5 m depth we did our calculations with a temperature range from 16–12°C (from highest to deepest filter) in July and a range of 3–8°C (from highest to deepest filter) in February.
3 Results
Stable carbon isotope analysis of chloroform in groundwater from the monitoring well mentioned above indicated that chloroform was most likely of a natural origin (results not shown), and a nearby area upstream this well was chosen for further investigation. Preliminary investigation of soil air chloroform concentration at 30 cm depth in a 100×140 m grid gave the impression of large
differences in chloroform concentration at locations close to each other and with no visible differences above ground. Three small areas of 20-40 m2 had particularly high chloroform concentrations and two permanent sampling profiles (Figure 1), 10 m apart, were established within and outside one such area, where chloroform concentrations in soil air differed significantly; ~27000 pptv at P1 and ~250 pptv at P2.
3.1 Soil data
The subsurface lithology of the two locations P1 and P2 appeared to be similar from visual inspection of samples collected during fieldwork. Samples from P1 were chosen for further examination of the lithology of the unsaturated zone and uppermost aquifer (Table 1). The top 10 cm of the profile was mainly organic (O-horizon) with three visible organic layers: At the top was a ~3 cm thick litter layer (L-layer) consisting of slightly degraded plant material. Below the L-layer, a fermentation layer (F-layer) of ~4 cm thickness was recognizable. This layer consisted of partly degraded needles and branches with visible fungal hyphae. Below the F-layer a humic layer (H-layer) of ~3 cm thickness was clearly visible. In this layer, the original plant structure was hardly recognizable. Below the O-horizon, greyish sand appeared, indicating a partial washout of iron hydroxides and organic material. However, no Bh horizon was found below. No dark A-horizon existed and yellowish fine to medium sand dominated throughout the profile (Table 1). The clay and silt content (<63µm) was below 10% at all depths but showed some variation being low especially in the old aeolian sand just below the organic layer and in the very homogeneous sandy layer from 2-4 m depth.
Table 1: Soil data from P1. pH was determined in a 1:1 water/soil slurry. SOM was determined as loss on ignition at 550°C. The textural data were determined by sieving.
The profile showed a gradual increase in soil pH with depth from ~4 at the top to almost 8 at 4.5 m depth. Analysis of groundwater showed a pH-value of around 7.8. Soil sample appearance indicated that aerobic conditions prevailed all through the unsaturated zone and uppermost aquifer. Groundwater from filters below the water table contained ~10 mg/L O2.
The samples taken from the two profiles confirmed the initial findings of a very large difference in chloroform concentrations in the top soil of P1 (~100000 pptv) and P2 (~2500 pptv), Figure 2(a). In July, the concentration profiles approach one another with depth (Figure 2(a)), but a difference of approximately one order of magnitude is still seen just above the groundwater at 4.4 m depth.
(a)
July
-7-6-5-4-3-2-10
0 40000 80000 120000CHCl3 (pptv)
Dep
th (m
)
P1P2GW table
(b)
February
-7-6-5-4-3-2-10
0 40000 80000 120000CHCl3 (pptv)
Dep
th (m
)
P1P2GW table
Figure 2: Chloroform in soil air at the two profiles during (a) summer and (b) winter.
Chloroform in the soil air was determined in both summer and winter time and showed large differences between these two seasons as expected for a biologically derived process (Figure 2). This difference was especially clear in the top three filters (0.3–1 m depth) with a ~4 times decrease from July to February in both P1 and P2. In the lower two filters for air sampling (3.4 and 4.4 m), the chloroform concentration was approximately the same in July and February. During winter, rising groundwater made sampling of air from the lowest filter in P2 impossible.
3.3 Chloroform in groundwater
Groundwater was sampled from the two filters below the groundwater table. Dates for sampling of soil air and groundwater were identical. The change in
chloroform concentration in groundwater from July to February was small for all four filters, Figure 3. Furthermore, chloroform concentrations were almost identical (~0.3 µg/L) 1.5 m below the groundwater table at both profiles. However, 0.7 m below the groundwater table the chloroform concentrations differed by almost one order of magnitude. Thus, the difference in chloroform concentration between P1 and P2 just above and below the groundwater table appears to be of the same order of magnitude, but the difference has disappeared moving an additional 80 cm down.
(a)
(b)
Figure 3: Chloroform in groundwater (measured) and in unsaturated soil water (calculated from Henry’s law assuming equilibrium between air and water) during (a) summer and (b) winter.
Even though the exact concentration in the soil water is hard to calculate we wanted to get an impression of whether there was any connection between the concentrations we measured in the unsaturated zone with what we measured in the groundwater. We therefore calculated the corresponding concentration of chloroform in the soil water from the measured concentrations in the soil air (Figure 3) as described in section 2.3. The calculated soil water concentrations in P1 in July range from almost 6 µg/L in 0.5-1 m depth to ~1.6 µg/L just above the groundwater table. This fits well with the measured concentration of 2.0 µg/L in the groundwater at 5.20 m depth. In February, the calculated concentrations were ~1.9 µg/L for the lowest air filter, and this still fits well with the measured chloroform concentration at 5.20 m depth of 2.3 µg/L. In the upper part of P2,
the calculated concentration of chloroform in the soil water varies from ~0.2 µg/L in July to 0.06 µg/L in February. In the deepest part of the unsaturated zone, the calculated concentration is ~0.16 µg/L in July. Unfortunately there was no sample from P2 at 4.4 m depth in February due to a rise in groundwater level, but based on the concentration at 3.4 m depth, a somewhat similar value of ~0.2 µg/L could be expected in the top groundwater at this time of sampling. As seen in Figure 3, the concentration in the top groundwater in P2 was ~0.3 µg/L in both July and February, which is 50-90% higher than what could be expected from the concentrations in the soil air in February and July respectively.
4 Discussion
The large difference in chloroform concentration in the soil air of almost two orders of magnitude between two locations only 10 m apart and with no visible differences above or below ground is considerable. Hoekstra et al. [10] found spatial variation in the concentration of chloroform in soil air within a 60×180 m grid but with a more moderate variation of 920-7400 pptv. A large horizontal variation in net chloroform production fits well with the hypothesis that chloroform is formed by the activity of domain-living organisms like many fungal species. Considering the decrease in chloroform concentration in P2 from July to February (from ~2500 pptv to ~600 pptv), there is no doubt however, that there is also a small production of chloroform at this location, but the increase down the profile is probably caused by sideways diffusion from places of larger production, such as P1. A clear increase in chloroform concentration is seen from 0.30 to 0.50 m depth at both P1 and P2, Figure 2a. Laturnus et al. [13] found a similar increase in chloroform concentration in soil air until ~0.75 m, followed by a slow decrease towards the groundwater table. Hoekstra et al. [10] also found an increase in chloroform in soil air down to ~0.5 m. The reason for this increase is not immediately intelligible if the production of chloroform takes place in the O-horizon where the most fungal activity exists. Assuming that the production of chloroform occurs either in the fungi or by exo-enzymes excreted into to the soil water, chloroform will be dissolved in the soil water after formation. One explanation of the increasing concentration during the first 0.5-1 m could then simply be an indicator of the time it takes for equilibrium between the water and gas phase to be established. Another explanation could be that part of the chloroform is formed from precursor molecules at deeper soil layers. The unspecific chloroperoxidase-mediated reaction suggested for the formation of chloroform also leads to the formation of potential chloroform precursors like trichloroacetic acid [10], which might later be converted to chloroform either abiotically or by microbial degradation. Hoekstra et al. [10] could not find any formation of chloroform from 37Cl below 20 cm depth despite the increase in chloroform concentration down to ~0.5 m, and this fits well with the hypothesis, that some of the chloroform is formed below the domains of the fungi, but with high dependence of the fungi above. This question needs further studies to be fully explained.
One interesting feature of Figure 2 is that the large differences in chloroform concentrations in the top soil of the two profiles is still of approximately one order of magnitude at 4 m depth. This is somewhat surprising considering the small distance between the two profiles. That diffusion does not eliminate the differences between the two profiles could indicate that the movement of chloroform in the unsaturated zone is mainly due to movement in the soil water. This hypothesis is quite logic in the sense that according to Henry’s law, the concentration of chloroform is ~13 times higher in the soil water than in the soil air at 10°C [16], but it is in some conflict with the previously suggested hypotheses that chloroform enters the groundwater mainly through diffusion [13]. We calculated the soil water chloroform concentrations from the measurements in the soil air, in an attempt to see a connection between chloroform concentration in the unsaturated and in the saturated zone below. The calculated soil water concentrations can probably be viewed as minimum concentrations, since chloroform is formed in water, and if equilibrium is not established, it can then be assumed, that it will be in favour of a larger soil water concentration than expected. A larger concentration in the soil water could still fit quite well with the measured chloroform concentrations in the top groundwater of P1, since some dilution might be expected even here. Also in P2, where chloroform concentration in the groundwater is at least 50% higher in the groundwater, than what was expected from the soil air measurements, the water filtrating through this soil profile must be either mixed with water of higher chloroform content when reaching the aquifer or equilibrium has not been fully established between water and air. In conclusion, we have shown that naturally produced chloroform can enter the groundwater. Concentrations in an aquifer will however be extremely hard to predict, especially from single soil air measurement but also from single measurements of the shallow groundwater of a test well.
References
[1] Gribble, G.W., The diversity of naturally produced organohalogens, Chemosphere, 52, pp. 289–297, 2003.
[3] Laturnus, F., Haselmann, K.F., Borch, T., Grøn, C., Terrestrial natural sources of trichloromethane (chloroform, CHCl3) – an overview, Biogeochemistry, 60, pp. 121–139, 2002.
[4] McCulloch A., Chloroform in the environment: occurrence, sources, sinks and effects, Chemosphere, 50, pp. 1291–1308, 2003;
[5] Report from the Danish Ministry of The Environment, (English summary) http://www.blst.dk/Udgivelser/Udgivelser2007/978-87-92256-27-0.htm,
[6] Laier, T., Jacobsen, O.S., Thomsen, O., Grøn, C., Hunkeler, D., Laturnus, F. Chloroform production in spruce forest soils - A potential problem for
groundwater use in drinking water supply in Denmark. SRef-ID: 1607–7962/gra/EGU05-A-05884, European Geoscience Union 2nd General Assembly, Vienna 24-29 April, 2005.
[7] Haselmann, K.F., Laturnus, F., Svensmark, B., Grøn, C., Formation of chloroform in spruce forest soil – results from laboratory incubation studies, Chemosphere, 41, pp. 1769–1774, 2000.
[8] Harper, D.B., Halogenated methanes – biological sources and physiological role. Mechanisms of biohalogenation and dehalogenation, eds. D. B. Janssen, K. Soda, R.Wever, Koninklijke Nederlandse Akademie van Wetenschappen Verhandelingen, Afd. Natuurkunde, Tweede Reeks, deel 98, Amsterdam, pp. 15–31, 1997.
[9] Haselmann, K.F., Laturnus, F., Grøn, C., Formation of chloroform in soil. A year-round study at a Danish spruce forest site, Water, Air and Soil Pollution, 139, pp. 35–41, 2002.
[10] Hoekstra, E.J., De Leer, E.W.B., Brinkman, U.A.T., Natural formation of chloroform and brominated trihalomethanes in soil, Environ. Sci. Technol., 32, pp. 3724–3729, 1998a.
[11] Hoekstra, E.J., Duyzer, J.H., De Leer, E.W.B., Brinkman, A.T., Chloroform – concentration gradients in soil air and atmospheric air, and emission fluxes from soil, Atmospheric Environment, 35, pp. 61–70, 2001.
[12] Hoekstra, E.J., Verhagen, F.J.M., Field, J.A., De Leer, E.W.B., Brinkman, U.A.T., Natural production of chloroform by fungi, Phytochemistry, 49, pp. 91–97, 1998b.
[13] Laturnus, F., Lauritsen, F.R., Grøn, C., Chloroform in a pristine aquifer system: Toward an evidence of biogenic origin, Water Resources Research, 36, pp. 2999–3009, 2000.
[14] Danish National Groundwater Quality Monitoring Program, the Jupiter data base, www.geus.dk/jupiter/index-DK.htm, (in Danish).
[15] Busenberg, E. & Plummer, L.N., Use of chlorofluorocarbons (CCl3F and CCl2F2) as hydrologic tracers and age-dating tools: The alluvium and terrace system of central Oklahoma, Water Resour. Res., 28, pp. 2257–2283, 1992.
[16] Görgényi, M., Dewulf, J., Van Langenhove, H., Temperature dependence of Henry’s law constant in an extended temperature range, Chemosphere, 48, pp. 757–762, 2002.