extdocr.docx Working Paper Draft 11 VI. Environmental Scan A. Scan of Conditions External to the College The College in Context to its Environment The official Barstow Community College District boundaries cover some 9,157 square miles of semiarid land located east of the Mojave National Preserve that occupies vast desert areas between the Nevada border and the City of Barstow. The College is in the City of Barstow, along the Interstate 15, approximately 150 miles from both Los Angeles and Las Vegas, Nevada. The western border of the official District area is the Kern County line. The Inyo County line in the north is the end of the District area and the southern border is roughly defined by the San Bernardino Mountains. Almost seventy percent of the official District service area population resides in the Barstow. When the population at Fort Irwin is added the combined total is 87% of all residents in the service area. The District serves the cities of Barstow, Lenwood, Newberry Springs, Baggett, Yermo, Hinkley, Ludlow and Baker. The College also provides on-site programs to military personnel at the U.S. Army National Training Center, Fort Irwin. Over the years the College has built up a large following of students through its online instructional program. Distances from the campus location to neighboring community colleges are found in Appendix A. Economy and Employment The California economy is expected to continue its expansion and growth. State revenue is greater than projections in 2014 or 2015. The Legislative Analyst’s Office estimated that the State would likely receive another $3.6 billion more revenue in 2015-16 than the Governor had predicted. 1 For K-14 public education the adverse economic circumstances of the Great Recession seem to have come to a conclusion. Although the State economy appears to be on the mend and unemployment levels continue to diminish, a recent report from the Public Policy Institute of California (PPIC) observed that if recent trends in higher education and the economy were to continue, by 2025 the State is likely to face a greater shortage of workers who have some college education but less than a bachelor’s degree. Their projections, and those of the Centers of Excellence, are that the shortfall of workers with some college education may be as high as 1.4 million to replace workers who will retire. The expected growth of the state economy is projected to create one million new middle-skill jobs by 2025. Together, these needs are even larger than the projected one-million-worker shortage of college 1 Jim Miller. “Legislative Analyst Predicts California Revenue Will Exceed Revised Budget Estimate by $3 Billion,” Sacramento Bee. May 18, 2015
Transcript
extdocr.docx
Working Paper Draft 11
VI. Environmental Scan
A. Scan of Conditions External to the College The College in Context to its Environment The official Barstow Community College District boundaries cover some 9,157 square miles of semiarid land located east of the Mojave National Preserve that occupies vast desert areas between the Nevada border and the City of Barstow. The College is in the City of Barstow, along the Interstate 15, approximately 150 miles from both Los Angeles and Las Vegas, Nevada. The western border of the official District area is the Kern County line. The Inyo County line in the north is the end of the District area and the southern border is roughly defined by the San Bernardino Mountains. Almost seventy percent of the official District service area population resides in the Barstow. When the population at Fort Irwin is added the combined total is 87% of all residents in the service area. The District serves the cities of Barstow, Lenwood, Newberry Springs, Baggett, Yermo, Hinkley, Ludlow and Baker. The College also provides on-site programs to military personnel at the U.S. Army National Training Center, Fort Irwin. Over the years the College has built up a large following of students through its online instructional program. Distances from the campus location to neighboring community colleges are found in Appendix A. Economy and Employment The California economy is expected to continue its expansion and growth. State revenue is greater than projections in 2014 or 2015. The Legislative Analyst’s Office estimated that the State would likely receive another $3.6 billion more revenue in 2015-16 than the Governor had predicted.1 For K-14 public education the adverse economic circumstances of the Great Recession seem to have come to a conclusion. Although the State economy appears to be on the mend and unemployment levels continue to diminish, a recent report from the Public Policy Institute of California (PPIC) observed that if recent trends in higher education and the economy were to continue, by 2025 the State is likely to face a greater shortage of workers who have some college education but less than a bachelor’s degree. Their projections, and those of the Centers of Excellence, are that the shortfall of workers with some college education may be as high as 1.4 million to replace workers who will retire. The expected growth of the state economy is projected to create one million new middle-skill jobs by 2025. Together, these needs are even larger than the projected one-million-worker shortage of college
1 Jim Miller. “Legislative Analyst Predicts California Revenue Will Exceed Revised Budget Estimate by $3 Billion,” Sacramento Bee. May 18, 2015
extdocr.docx
Working Paper Draft 12
graduates with a bachelor’s degree.2 The analysis affirms that training beyond high school has become increasingly valuable in the labor market. The State’s economic upturn has been slow to reach the high desert areas of San Bernardino County where the key industrial clusters of manufacturing, construction, retain trade, and professional and management were particularly hit hard in the downturn. The subprime mortgage crisis and related wave of foreclosures and collapsing home prices only added to the misery. At its worst, residents living in Barstow witnessed over 285 foreclosures in 2008. But, the future is looking a little brighter for San Bernardino and Riverside Counties. Between 2012 and 2022 the California Employment Development Department (EDD) projects an annual average 1.9% increase in jobs in. The greatest growth is concentrated in five industrial sectors: (1) educational services (private), health care, and social assistance; (2) professional and business services; (3) leisure and hospitality; (4) trade, transportation, utilities; and (5) construction. The following table documents the projections in Los Angeles County for employment opportunities by industry category. Table __: San Bernardino-Riverside County Projected Job Openings by Industry
Source: California Employment Development Department, Labor Market Information; analysis by Cambridge West Partnership, LLC
2 Sarah Bohn, “California’s Need for Skilled Workers,” Public Policy Institute of California, September 2014 and “California’s Future-Higher Education.” February 2015. Centers of Excellence. Focus on 2025: A 10-year Middle-Skill Occupational Outlook for California. Retrieved 4/17/16 from http://doingwhatmatters.cccco.edu
extdocr.docx
Working Paper Draft 13
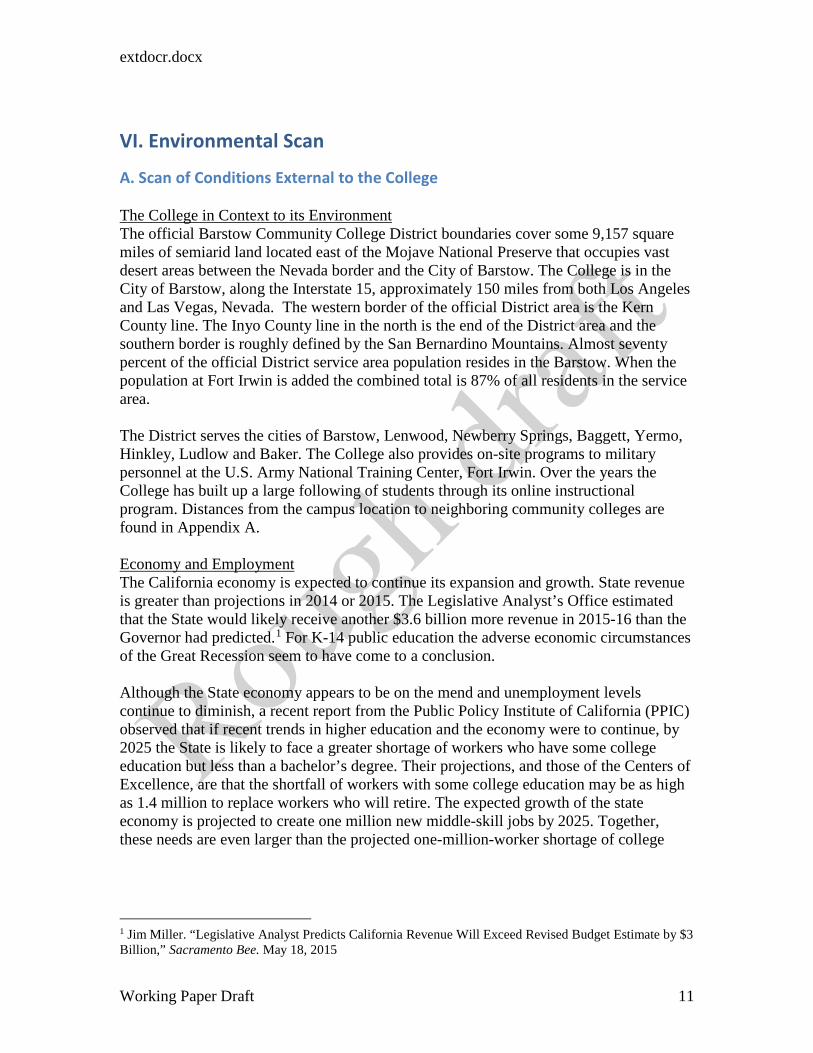
A listing of major employers in the Barstow area is found in Appendix B. The workforce, by industry, in the College effective service area is described in the following two tables. The tables account for 161,949 working adults in the workforce who are age 16 or older. Table __: Barstow College Effective Service Area 2015 Employment by Industry
Source: Environmental Systems Research Institute, Market Profile, 2015; analysis by Cambridge West Partnership, LLC
extdocr.docx
Working Paper Draft 14
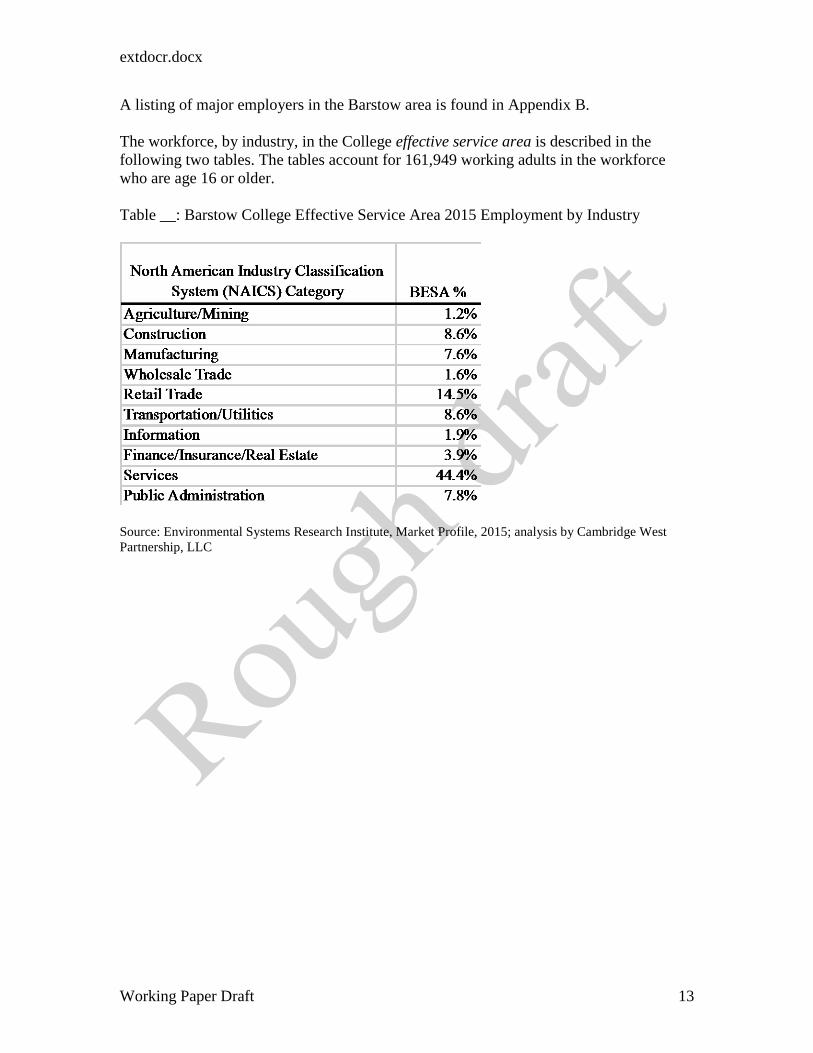
Table __: Barstow College Effective Service Area 2015 Employment by Occupational Group
Source: Environmental Systems Research Institute, Market Profile, 2015; analysis by Cambridge West Partnership, LLC
extdocr.docx
Working Paper Draft 15
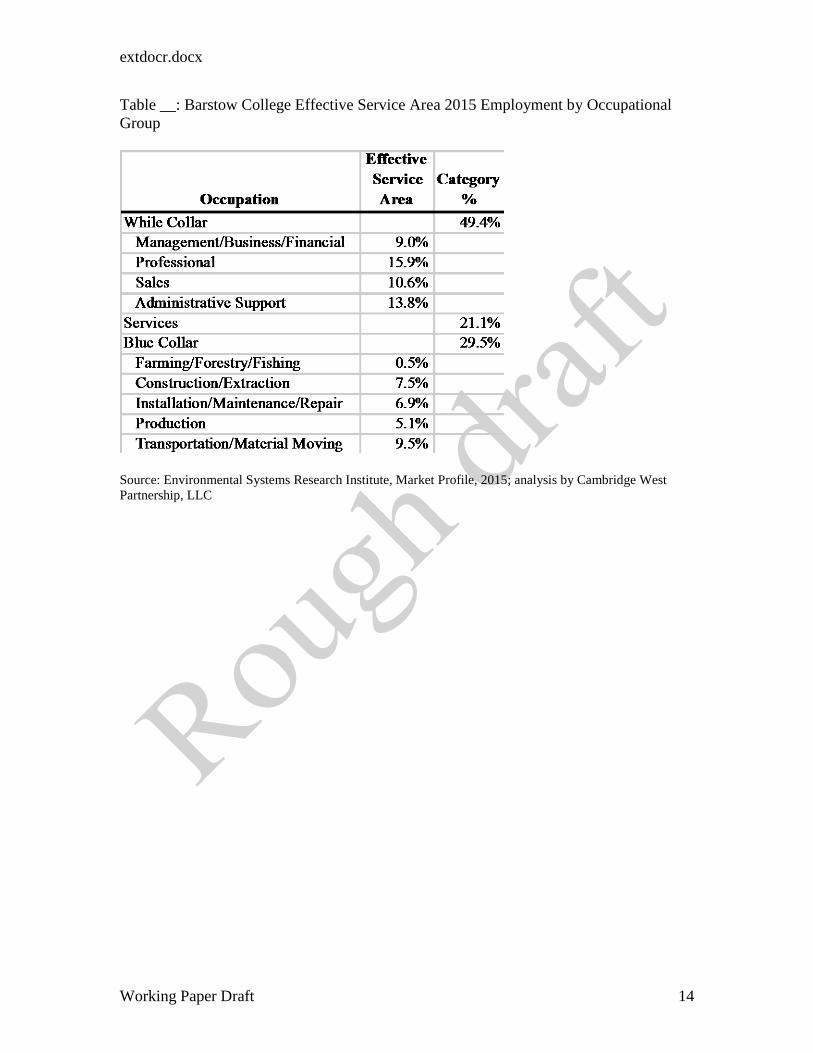
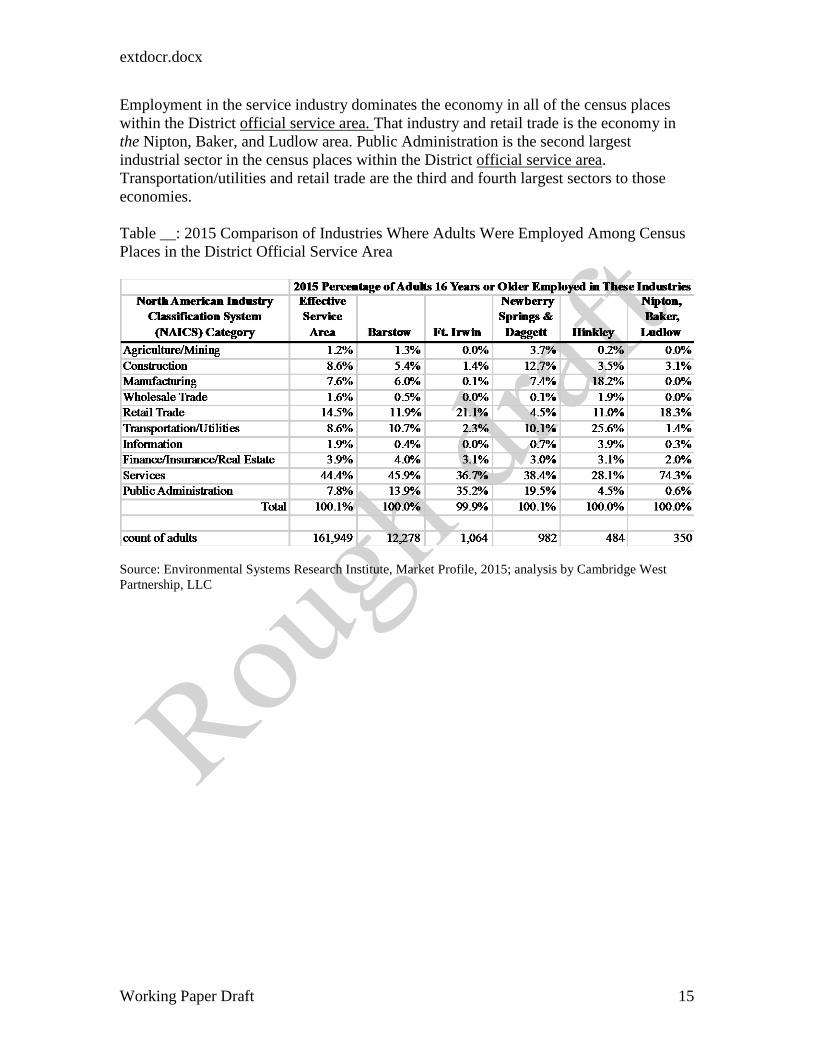
Employment in the service industry dominates the economy in all of the census places within the District official service area. That industry and retail trade is the economy in the Nipton, Baker, and Ludlow area. Public Administration is the second largest industrial sector in the census places within the District official service area. Transportation/utilities and retail trade are the third and fourth largest sectors to those economies. Table __: 2015 Comparison of Industries Where Adults Were Employed Among Census Places in the District Official Service Area
Source: Environmental Systems Research Institute, Market Profile, 2015; analysis by Cambridge West Partnership, LLC
extdocr.docx
Working Paper Draft 16
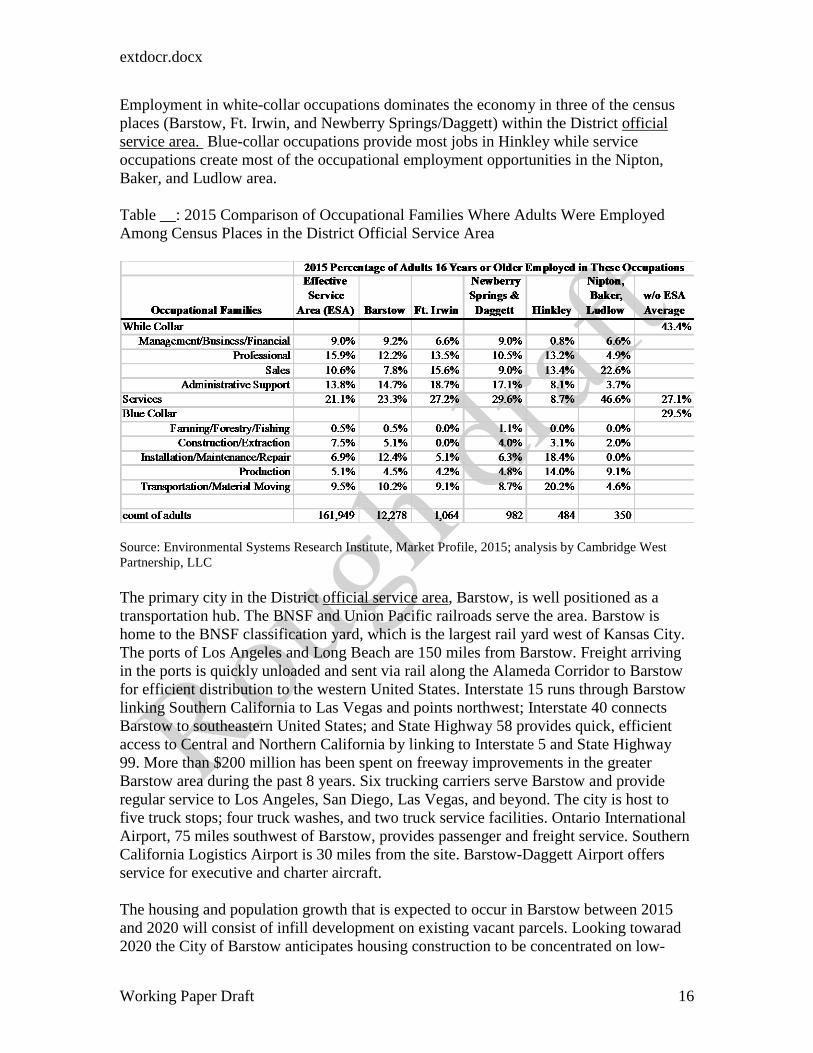
Employment in white-collar occupations dominates the economy in three of the census places (Barstow, Ft. Irwin, and Newberry Springs/Daggett) within the District official service area. Blue-collar occupations provide most jobs in Hinkley while service occupations create most of the occupational employment opportunities in the Nipton, Baker, and Ludlow area. Table __: 2015 Comparison of Occupational Families Where Adults Were Employed Among Census Places in the District Official Service Area
Source: Environmental Systems Research Institute, Market Profile, 2015; analysis by Cambridge West Partnership, LLC The primary city in the District official service area, Barstow, is well positioned as a transportation hub. The BNSF and Union Pacific railroads serve the area. Barstow is home to the BNSF classification yard, which is the largest rail yard west of Kansas City. The ports of Los Angeles and Long Beach are 150 miles from Barstow. Freight arriving in the ports is quickly unloaded and sent via rail along the Alameda Corridor to Barstow for efficient distribution to the western United States. Interstate 15 runs through Barstow linking Southern California to Las Vegas and points northwest; Interstate 40 connects Barstow to southeastern United States; and State Highway 58 provides quick, efficient access to Central and Northern California by linking to Interstate 5 and State Highway 99. More than $200 million has been spent on freeway improvements in the greater Barstow area during the past 8 years. Six trucking carriers serve Barstow and provide regular service to Los Angeles, San Diego, Las Vegas, and beyond. The city is host to five truck stops; four truck washes, and two truck service facilities. Ontario International Airport, 75 miles southwest of Barstow, provides passenger and freight service. Southern California Logistics Airport is 30 miles from the site. Barstow-Daggett Airport offers service for executive and charter aircraft. The housing and population growth that is expected to occur in Barstow between 2015 and 2020 will consist of infill development on existing vacant parcels. Looking towarad 2020 the City of Barstow anticipates housing construction to be concentrated on low-
extdocr.docx
Working Paper Draft 17
income housing stock and homes for active seniors. An area straddling Barstow Road between Rimrock Road and I-15 (just north of the College location) has been identified as potentially accommodating 550 single-family homes, if the parcels were subdivided to their maximum allowable density. South of Rimrock Road there is a second area that might accommodate an additional 500 single-family homes. Most of these potential new housing starts are expected to be for senior citizens. With regard to commercial land uses there are several existing vacant parcels in the vicinity of I-15 at L Street and Lenwood Road that are most likely to be developed in the near future. An Indian operated casino and hotel are proposed for an area southwest of the City. Just west of that site a 314 acre parcel owned by the Lansing Companies was proposed for a diverse use project including a golf course and up to 1,500 homes designed for active seniors. Just west of the College, there is a large vacant parcel starting at the southeast corner of H Street and Rimrock Road that has been designated for single-family residential development that might accommodate 400 homes.3 Any industrial development is expected to occur in the southwest portion of the City were one large area of 1,200 acres and two smaller areas of 45 and 32 acres respectively have been earmarked for an industrial park.4 The City of Barstow has graded the land, connected to utilities and infrastructure and is actively seeking firms to develop on the land. As of spring 2016 most of the inquiries have been from logistics firms and capital-intensive manufacturers that do not employ large numbers of workers.5 The I-5 corridor and the growth of desert communities to the south of the City are one consideration that will pull future development in a southwesterly direction. Development of any land to the north is limited due to the biological sensitivity of that land while the Marine Base and the absence of infrastructure curtail development to the east.
3 City of Barstow, General Plan 2015-2020, parts 1 and 2. 4 City of Barstow. General Plan 2015-2020, part 1. 5 Gaither Lowenstein, Economic Development Department, City of Barstow. Email Correspondence. April 22, 2016.
extdocr.docx
Working Paper Draft 18
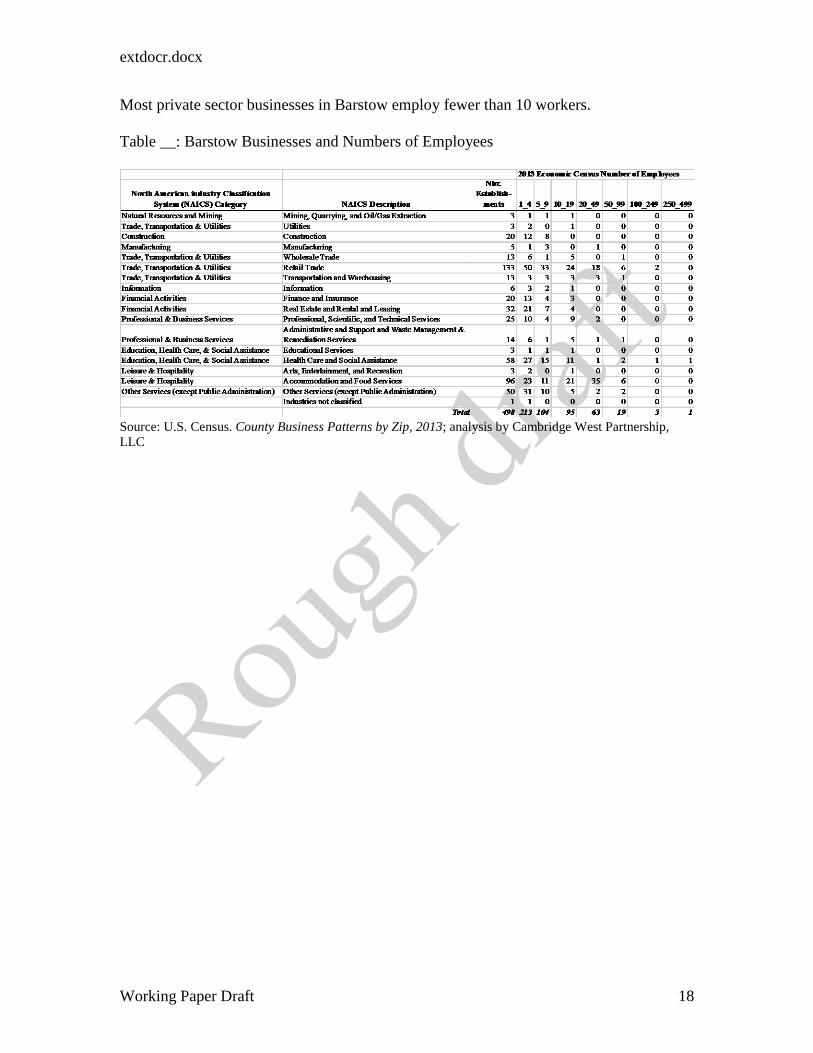
Most private sector businesses in Barstow employ fewer than 10 workers. Table __: Barstow Businesses and Numbers of Employees
Source: U.S. Census. County Business Patterns by Zip, 2013; analysis by Cambridge West Partnership, LLC
extdocr.docx
Working Paper Draft 19
As a result of the Great Recession of 2008 the numbers of businesses establishments in Barstow has declined. Table __: Barstow Business Establishments 2004 vs. 2013
Source: U.S. Census. County Business Patterns by Zip, 2004 and 2013; analysis by Cambridge West Partnership, LLC However, based upon the Regional Transportation Plan developed by the Southern Association of Governments (SCAG) and the Regional Housing Need Allocation, the City of Barstow projects continued modest employment growth, perhaps 3.8% annually through 2040. That compares to an overall population growth projection of 12,000 people between 2012 and 2040.6 Much of 13 million acres in San Bernardino County are outside the control of the County Supervisors. Approximately 6 million acres are owned and controlled by the Federal Bureau of Land Management; another 1.9 million acres are owned and controlled by the
6 Southern California Association of Governments. 2016-2040 Regional Transportation Plan (2012),Regional Housing Need Allocation Plan 2014-2021, and Current Demographics and Growth Forecast 2016-2040.
extdocr.docx
Working Paper Draft 20
U.S. Department of Defense. Unfortunately, a good deal of this land is fragmented and scattered throughout the County. Roughly 4% of the land in the County lies within 24 incorporated cities. As a result, much of the County is not developed and population density is very low. One of the striking features of the economic dynamics in the region is the number of workers who commute from Barstow into other parts of San Bernardino County, Riverside County locations, Los Angeles County and beyond. In the case of Barstow, approximately 32% of the residents work in the city while 68% commute to other places. The following table illustrates the top ten commuting destinations for Barstow residents. Table __: Top Ten Commuting Destinations from Barstow, 2015
Source: U.S. Census Bureau, 2014, Longitudinal-Employer Household Dynamics Program, LODES Data, 2011 as cited in the Southern California Association of Governments. 2015 Local Profiles Reports- City of Barstow. May 2015. Implications for the College
1. Future job opportunities, economic growth in construction, and health care/social assistance industries, plus a much improved real estate market with affordable housing characterize the future of the region. The College can contribute to the economy of the region by preparing students for transfer to four-year institutions and by equipping with the job skills in demand those students who want to “transfer to the workplace” upon completing a certificate or Associate Degree.
2. Reasonable employment opportunities in several industry categories (trade, transportation, utilities; professional and business services; health care and social assistance; leisure and hospitality; and construction) are projected to continue into the future but they may not be in Barstow per se. Although entry-level preparation for many jobs in some of these industries commonly does not require education
extdocr.docx
Working Paper Draft 21
beyond high school, there may openings for which the College needs to prepare individuals with career and technical certificates and Associate Degrees.
3. The distinctive mix in the San Bernardino-Riverside County region of advanced manufacturing employers and research and development employers places a premium on Science, Technology, Engineering, Mathematics, and Medicine (STEMM) fields of study. The College has well-established programs of study in these disciplines but will be called upon to increase the numbers of graduates.
4. Future housing development envisioned by the City is being discussed in terms of accommodations for senior citizens. That may bring a new audience for the College to woo.
Higher Education Policy Several key policy decisions will influence the California Community College system in the coming years. These public policies both provide opportunities for the colleges but in some cases impose constraints. The Completion Agenda In July 2009, President Obama articulated that the American Graduation Initiative (AGI) has a goal of increasing the percentage of U.S. residents who earn high-quality degrees and credentials from the present rate of 39 percent to a rate of 60 percent by the year 2025. The goal is to make the U.S. competitive in the global marketplace. In the private sector, employers have been increasingly screening applicants for employment by requiring college degrees for positions that previously did not require a degree.7 After President Obama has pushed to increase college graduation rates across the nation, Complete College America, a non-profit organization, was formed to advance this mission. It has enlisted support from leaders in 34 states to ensure greater numbers of students acquire degrees. The President’s challenge to the nation has not been ignored in California. The Community College League of California (CCLC) launched an “alternative futures” project, 2020 Vision for Student Success, to respond to the national graduation goal by identifying policy and practice changes that could be implemented to increase student achievement. To contribute its part toward achieving the national graduation goal, California needs to produce a total of 1,065,000 degrees or certificates per year to 2025. That translates to producing an additional 23,000 degrees and certificates per year, a 5.2% annual increase.8 The California Public Policy Institute has repeatedly informed state policy makers that the State faces a skills gap.9
7 Doug Lederman. “Credential Creep Confirmed” Inside Higher Education. September 9, 2014; Karin Fischer. “A College Degree Sorts Job Applicants, but Employers Wish It Meant More,” Chronicle of Higher Education. March 8, 2013 p. 26-29 8 2020 Vision: A Report of the Commission on the Future, (Sacramento, CA: Community College League of California, 2010) 9 Public Policy Institute of California. California’s Future: Higher Education. January 2016 and Higher Education in California. April 2016.
extdocr.docx
Working Paper Draft 22
In August, 2014, the Board of Governors for the California community college system joined in the completion effort by announcing a goal to increase the numbers of students earning certificates, degrees, or transferring to four-year institutions by nearly a quarter of a million over the next ten years. For academic year 2013-14 the system awarded 190,314 certificates and degrees, a 40 percent increase from 2009-10 and an all-time high for the system. The Gates, Ford, Lumina, and Kellogg Foundations as well as the Carnegie Corporation of New York fund their collective work and the efforts of others to promote more college graduates. Collectively, there are more than two-dozen major entities that have sponsored initiatives to promote college completion.10 Federal Policy and Funding Initiatives The Congress passed the Higher Education Opportunities Act in 2008. Subsequently, a series of new federal regulations have been issued to improve program integrity where Title IV financial aid funds are involved. Regional accrediting bodies are now expected to provide closer scrutiny of member institutions on a range of new topics. The Higher Education Act has been due for renewal and no one can predict its future direction. The Obama administration and the U.S. Department of Education have announced a new emphasis for their involvement with career and technical education through a transformation of the Carl D. Perkins Career and Technical Education Act of 2006 as it comes due for renewal. Although the Act has not yet been renewed, the desired new directions will promote greater alignment between CTE programs and labor market needs as well as collaboration with K-12 and employers. Differences in the current provisions of the Perkins Act and the proposed changes were announced as long ago as April 2012.11 In July 2014 the Congress enacted the Workforce Innovation and Opportunity Act (WIOA) by a wide bipartisan majority as the first legislative reform in the past 15 years of the public workforce system. This legislation took effect on July 1, 2015 with regulatory rules written by the Departments of Labor (DOL), Education (DOE), and Health and Human Services (HHS). In general, the legislation eliminates 15 existing federal training programs and focuses on streamlining programs, reporting, and administration. WIOA keeps the basic structure of the prior legislation, with components covering occupational training, adult basic education, literacy and English language acquisition, vocational rehabilitation, and the national system of public employment offices and services. Key features and opportunities of the WIOA legislation include requirements for more unified planning between state and local authorities to address regional labor markets, a common set of performance measures, and promotion of best practices including contextualized adult basic education, ESL, and attainment of industry-recognized certificates.
10 Alene Russell. “A Guide to Major U.S. College Completion Initiatives,” American Association of State Colleges and Universities, October 2011. 11 U.S. Department of Education, Office of Vocational and Adult Education. Investing in America’s Future: A Blueprint for Transforming Career and Technical Education. April 2012.
extdocr.docx
Working Paper Draft 23
The White House convened a series of higher education summits in order to promote change in higher education policy and practice. Attention was given to greater access, particularly for low-income students, the completion agenda, college outcome performance measures, constraints to the ever-rising costs of high education, and other topics of interest to the federal government. To encourage more participation in postsecondary education the President used his 2015 state of the union address to offer a proposal, along the lines of the current policy in Tennessee, that the federal government help each state to make attendance at a community college free of tuition. By mid-spring 2016 there had been launched 27 new free community college programs.12 While it has been announced that some new federal resources will be allocated for use by community colleges, the Congress is currently also struggling to restrain spending and to reduce debt levels. The long-term impact remains to be seen, but federal aid now has a lifetime limit and is also limited to a maximum number of credit hours represented by 150% of the credits required for the program of study the student is pursuing. For a community college associate degree 150% would equate to 90-semester credit hours. Veterans on the G.I. Education Bill may be more limited in the credit hours funded by that program. In the FY2016 budget the President proposed that the maximum award under the Pell Grant program would increase and new rules would require students to make progress in their programs by passing an increasing percentage of their total course load. In a December 2015 budget deal the Congress unexpectedly agreed to increase the Pell grant maximums and provide additional funds to college access programs for needy students (TRIO and GEAR UP). President Obama has signed an executive order to align the monthly repayment rate of federal loans to the level of future wages earned by the student. That may ease the burden of debt for students and make the act of borrowing for a college education more feasible for prospective students. The President has also declared a policy to not enforce deportation on children of illegal immigrants meeting certain conditions and to provide work permits for those children. Regional Accreditation Initiatives In part, stimulated by prior federal government actions, all regional accrediting bodies are insisting that greater attention be given to student learning outcomes. These new areas are in addition to the traditional goals of accreditation that are:
1. Providing assurance to the public that the education provided by the institution meets acceptable levels of quality
2. Promoting continuous institutional improvement 3. Maintaining the high quality of higher education institutions in the region
Implementation of the new ACCJC 2014 accreditation standards has introduced a number of changes, including the requirement to create a quality focus essay to guide future
12 White House Press Release. White House Launches $100 Million Competition to Expand Tuition-Free Community College Programs that Connect Americans to In-Demand Jobs. April 25, 2016.
extdocr.docx
Working Paper Draft 24
improvement efforts. 13 The changes also echoed some of the national discussions about educational quality and accreditation. California Community College Initiatives for Student Success The following State initiatives are intended to increase student success rates:
• The Board of Governors’ basic skills initiative seeks to enable more students to overcome their academic deficiencies.
• Additional legislation, SB1440 Student Transfer Achievement Reform or STAR Act in 2010, simplified the process of transferring from a community college to a school in the California State University (CSU) system. This program provides a pathway for students to follow so that they can be admitted to a CSU with junior status. It has been complemented by SB440 in 2013, which further incentivizes transfer students to complete an associate degree.14
Perhaps the most potentially far-reaching set of recommendations for change in policy and practice were included in the report from the California Community College Chancellor’s Office Student Success Task Force. The group proposed eight areas of focus with 22 recommendations. The Legislature passed the Student Success Act (SB 1456) in August 2012 and the governor signed it shortly thereafter. The measure did the following:
• Commissioned the development of a uniform placement exam for students; • Directed colleges to provide students with orientation, assessment, placement and
counseling services; • Required students to identify an educational goal (such as degree or certificate for
transfer to a four-year university) and complete an educational plan; • Required colleges that receive student support service funds to complete and post
a student success scorecard showing how well the campus is doing in improving completion rates, especially by race, ethnicity, gender, and income;
• Established minimum academic progress standards for students to receive Board of Governors fee waivers, but also developed an appeal process.
The Task Force recommendations came in the wake of a severe shortfall in resources for California’s public higher education institutions. Therefore, implementation of these ideas was delayed. Funds allocated for 2015-16 enabled the Chancellor’s Office to provide support to colleges that develop a student success and support plan (formerly matriculation) built around some of the recommendations arising from the Student Success Task Force. The provision of effective core services (orientation, assessment and placement, counseling, academic advising, and early intervention or follow-up for at-risk students) has been found to improve students’ ability promptly to define their educational and career goals, complete more of their courses, persist to the next term and achieve their educational
13 Accrediting Commission for Community and Junior Colleges. Preparing for A Comprehensive Visit. Workshop materials presented on October 15, 2014. 14 Campaign for College Opportunity. Keeping the Promise: Going the Distance on Transfer Reform. March 2016.
extdocr.docx
Working Paper Draft 25
objectives in a timely manner.15 As new priority enrollment rules were made effective in fall 2014, one of the incentives for students to complete the core services was the potential loss of priority enrollment or withholding of an enrollment opportunity. One Student Success Task Force recommendation was the development of a robust common assessment instrument. The assessment services will also include data collection and course placement guidance, but the placement cut scores will remain a local decision. Working groups of faculty from the disciplines of English, Math and ESL have been involved in drafting competencies that address the full range of prerequisite skills found in the curriculum. The common assessment initiative has a “go live” target of the 2016-17 academic year, pending a successful pilot experience. The effort to exploit technology to support student success blossomed into the Educational Planning Initiative that was launched to help colleges meet the requirements for student success and support program funding by providing an individual comprehensive educational plan for all students. The initiative is also intended to enhance the counseling experience by inducing students to take more responsibility for their educational program plans and to have counseling expertise used only to verify the planning. A degree audit system to provide transcript, articulation and curriculum inventory elements is to be provided to help both students and counselors. As a by-product, it is hoped that the numbers of unnecessary units accumulated by students will be reduced. A single sign-on portal is intended to be the student’s point of access to this system that is described as a service-oriented experience in which some existing services will be complemented by new services yet to be produced. The project has a “go live” target of the 2016-17 academic year, pending a successful pilot experience. The legislation implementing some of the recommendations of the Student Success Task Force, SB 1456, requires the coordination of student equity plans and student success and support programs. Student equity identifies groups of students needing more help and focuses on services and instruction for new and continuing students through to completion whereas student success and support programs focus on services for entering students and identifies individual students who need more help. Interest in student equity is not new as the Board of Governors adopted a student equity policy in 1992, but financial support for planning and interventions has not always been available or adequate. In 2014 the Legislature appropriated $70 million for student equity purposes, added foster youth, veterans, and low-income students as target populations, and required specific goals and activities to address disparities and coordination of them with other categorical programs. The traditional populations or variables researched for student equity planning are: age, disability status, gender and ethnicity. Unlike the student success and support program funding, dollars for student equity interventions do not require a match of funds or in-kind effort from the colleges. Funding for both efforts was increased for 2015-16 after the May 2015 budget revision. An additional increase is proposed for 2016-17. 15 Eva Schiorring and Rogeair Purnell. Literature Review Brief: What We Know About Student Support 2nd Ed. Research and Planning Group of the California Community Colleges. Fall 2012.
extdocr.docx
Working Paper Draft 26
The governor’s interest in online education garnered an appropriation of $56.9 million over 55 months to launch the Online Education Initiative for the community colleges. The initiative is intended to increase access to more online courses created by community college faculty members and to provide students well-designed resources that will improve their chances of a successful learning experience. Part of the work in this initiative is to improve student readiness to engage in the learning experience through online instruction and to provide tutoring support for those students. Those two components have had a successful pilot project “go live” in spring 2015. A common course management system launched among the pilot colleges in fall 2015. Within the initiative are efforts to assist faculty in several professional development ways- creating of online course content, teaching strategies for the online environment, course design standards, and course review training. Adult Education Initiative The governor’s initial proposal for the adult education programs to be absorbed into the community colleges met with stiff opposition in the Legislature. A compromise was fashioned to improve and expand the provision of adult education through regional consortia that would eliminate redundancy and craft pathways into higher education for interested students. Instruction in parenting, home economics and classes for older adults were explicitly excluded from this funding. The 2015 AB104 legislation provided a block grant of funds to support action plans to close gaps for adult learners in four areas: (1) elementary and secondary basic skills; (2) ESL and citizenship for immigrant populations; (3) adults with disabilities; and (4) short-term career and technical education. Career and Technical Education Initiatives In 2012 the Legislature passed SB 1402 which the Governor signed to signal intent to recast and rewrite the economic and workforce education division programs and services. The new direction requires industry sector strategies that align collaboratively with labor markets on a regional basis. The Chancellor’s Office translated these policy directions into a four-part initiative called Doing What Matters (DWM) for Jobs and the Economy. Governor Brown has been generous in funding this work and his 2016-17 budget proposals offered $200 million more to expand access to career and technical education as well as to implement new regional accountability structures.
extdocr.docx
Working Paper Draft 27
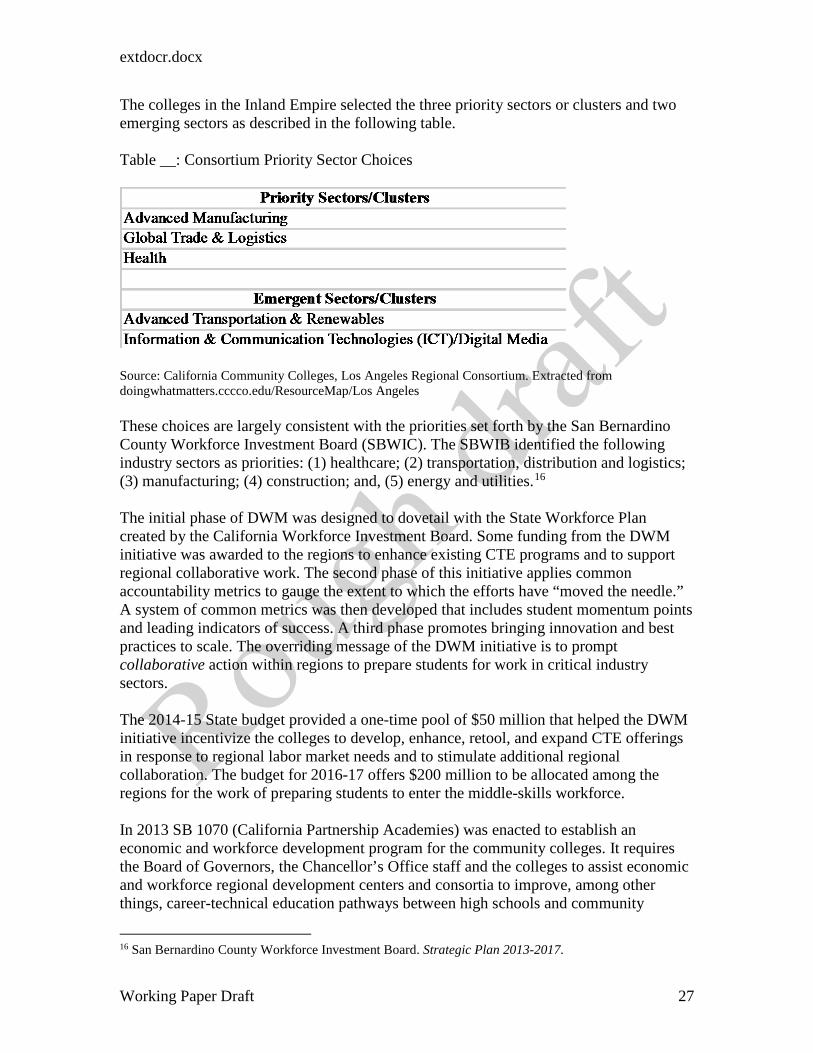
The colleges in the Inland Empire selected the three priority sectors or clusters and two emerging sectors as described in the following table. Table __: Consortium Priority Sector Choices
Source: California Community Colleges, Los Angeles Regional Consortium. Extracted from doingwhatmatters.cccco.edu/ResourceMap/Los Angeles These choices are largely consistent with the priorities set forth by the San Bernardino County Workforce Investment Board (SBWIC). The SBWIB identified the following industry sectors as priorities: (1) healthcare; (2) transportation, distribution and logistics; (3) manufacturing; (4) construction; and, (5) energy and utilities.16 The initial phase of DWM was designed to dovetail with the State Workforce Plan created by the California Workforce Investment Board. Some funding from the DWM initiative was awarded to the regions to enhance existing CTE programs and to support regional collaborative work. The second phase of this initiative applies common accountability metrics to gauge the extent to which the efforts have “moved the needle.” A system of common metrics was then developed that includes student momentum points and leading indicators of success. A third phase promotes bringing innovation and best practices to scale. The overriding message of the DWM initiative is to prompt collaborative action within regions to prepare students for work in critical industry sectors. The 2014-15 State budget provided a one-time pool of $50 million that helped the DWM initiative incentivize the colleges to develop, enhance, retool, and expand CTE offerings in response to regional labor market needs and to stimulate additional regional collaboration. The budget for 2016-17 offers $200 million to be allocated among the regions for the work of preparing students to enter the middle-skills workforce. In 2013 SB 1070 (California Partnership Academies) was enacted to establish an economic and workforce development program for the community colleges. It requires the Board of Governors, the Chancellor’s Office staff and the colleges to assist economic and workforce regional development centers and consortia to improve, among other things, career-technical education pathways between high schools and community
16 San Bernardino County Workforce Investment Board. Strategic Plan 2013-2017.
extdocr.docx
Working Paper Draft 28
colleges. Contracts and competitive grants funded by the program through 2015 were jointly administered to improve linkages and CTE pathways between high schools and community colleges. Additional efforts to promote career pathways from high schools to the community colleges were enshrined in the 2014-15 budget as it passed the California Career Pathways Trust Act. Some $250 million was provided in the form of one-time competitive grants. These funds were made available to school districts, county superintendents of schools, directly funded charter schools, regional occupational centers or programs operated by a joint powers authority, and community college districts. The Legislature allocated a second round of funding for the Trust with applications for competitive grants to be implemented in academic years 2015-16 and 2016-17. The most recent legislation to promote collaboration, AB 288, signed into law on October 8, 2015, authorizes the governance board of a community college district to enter into a College and Career Access Pathways (CCAP) partnership with the governing board of a school district to offer or expand dual enrollment opportunities for students who may not already be college bound or are from underrepresented groups in higher education. The goal is to develop a seamless pathway from high school to community college for career-technical education or preparation for transfer, improving high school graduation rates, or helping high school students achieve college and career readiness. In November 2015 the Board of Governors culminated a yearlong effort to revisit the ways in which career and technical education was delivered as a means to prepare students for middle skills jobs. The Task Force they commissioned provided 25 recommendations in seven broad areas. Full details are available at http://bit.ly/1lpCGOM. The recommendations are expected to shape policies from the Board of Governors over the next few years. Dual Enrollment The most recent legislation to promote collaboration, AB 288, signed into law on October 8, 2015 to take effect in January 2016, authorizes the governing board of a community college district to enter into a College and Career Access Pathways (CCAP) partnership with the governing board of a school district. The partnerships are to offer or expand dual enrollment opportunities for students who may not already be college bound or are from groups underrepresented in higher education. The goal is to develop a seamless pathway from high school to community college for career-technical education or preparation for transfer, improving high school graduation rates, or helping high school students achieve college and career readiness. The following are the highlights of the legislation:
• Community colleges can assign priority enrollment and registration to high school students in a CCAP with no fees to pay;
• Courses during the regular high school day can be restricted to high school students and do not have to meet the normal open enrollment standard;
• Courses with no open seats on campus cannot be offered at high schools through the CCAP;
• Basic skills math and English can be offered through CCAP but only for students who are not at grade level in that subject; and
• Community colleges can claim FTES if the high school student is qualified for full high school apportionment without using hours of the college course.
Many of the initiatives discussed above have benefited from generous funding associated with the continued recovery of the California economy. Apportionment base funding has been restored, categorical funding has been advanced, and one-time funds have been provided. That funding trend continued into the May 2016 revision of the Governor’s 2016-17 Budget. However, it is believed that the California economy is nearing the point when a normal economic expansion period should end and resources provided should be used to position each college for the future.17 New Growth Funding Formula Apart from targeted funds described above, the SB 860 legislation from 2014 will impact the allocation of apportionment funds for growth to the districts by using a new formula starting in 2015-16. The legislation directed that growth would be based on each community’s need for access to their community college as determined by local demographics. Need within each district’s official boundaries is to be determined by two primary factors: number of people within each district who are without a college degree, and the number of individuals who are disadvantaged as evidenced by unemployment and measures of poverty.18 The AVCCD is projected to have a constrained apportionment growth rate of 2.76% Implications for the Colleges:
1. A broad array of governmental and private organizations is promoting the urgency for postsecondary institutions to produce more graduates. It has been estimated that the State economy will be short in excess of two million graduates with a bachelor’s degree or postsecondary education short of the bachelor’s degree by 2025. As a public agency the College should embrace that public agenda with vigor.
2. As the federal government seeks to achieve a more balanced budget there is still financial support for students and incentives for institutions to increase student success and prepare more students to compete in a global economy. However, these incentives come with performance expectations. The College may have opportunities to enhance resources and it should act upon those opportunities.
3. After many years of debate, several federal workforce-training programs have been consolidated and a new direction emphasizing regional efforts and agency collaboration has emerged in the Workforce Innovation and Opportunity Act (WIOA) legislation. As of fall 2016 the Carl Perkins legislation has not yet been reauthorized nor has the Higher Education Act
17 Mario Rodriguez, Acting Vice Chancellor for Finance. 2016-17 May Revise Letter to the System. 18 Day Toy, Vice Chancellor for Finance. “Growth Funding Allocation Formula,” Consultation Digest. November 20, 2014. “California Community Colleges Growth Funding Allocation Model” power point presentation to the Association of Chief Business Officers Conference. October 27, 2014.
extdocr.docx
Working Paper Draft 30
been reauthorized. The College should monitor trends in federal to be in a position to take advantage of any new direction.
4. The regional accrediting commission, ACCJC, is following federal direction with requirements it has imposed on member institutions. Recent state legislation intended to induce intentionality into institutional planning and to hold public colleges accountable for performance on state priorities are in a similar spirit to the accreditation expectations. Attention should be given to tracking student achievement and learning performance and acting upon areas were performance does not meet ACCJC expectations.
5. Starting three years ago State legislation (SB 1440) created a remarkable framework to facilitate transfer to a campus within the California State University (CSU). Community college and CSU faculty throughout the state have risen to the occasion to forge transfer model curriculums (TMCs). Antelope Valley College achieved its expected target, but there may be more that could be done to facilitate transfer.
6. Particular state attention has been given to re-crafting matriculation and other student services along the lines of recommendations from the Student Success Task Force. Although matching funds are required, attention must be given to student success concerns. Participating institutions will be required to use a common placement assessment instrument when it is developed if funds are accepted. The College has a series of opportunities to improve services and student success by participating in these new state programs.
7. A serious revisiting of online instruction as a delivery mode is being funded in the State. While the College has been building an array of online classes, the online education initiative is a promising opportunity in which the College should consider participating.
8. Adult education has long been neglected as a public service in the state. The AB86/Adult Education Block Grant AB104 legislation provides fresh funding to promote regional cooperation and elimination of redundancy with incentives to focus the instruction on preparing vulnerable citizens for more effective participation in the workforce. This legislation, combined with the promise to raise the funding level for selective noncredit curriculum to equal the level of credit instruction starting in FY 2015-16, presents a unique opportunity to make a very substantial difference in the service area. The College should grasp the opportunity to implement the planning work done by the regional consortium.
9. Several opportunities are unfolding for career and technical education both within and outside of the Doing What Matters for Jobs and the Economy initiative from the Chancellor’s Office. Several dedicated funding sources are promoting inter-segmental cooperation and regional approaches to this type of instruction. The College should position itself to fully engage the various opportunities in this curriculum.
extdocr.docx
Working Paper Draft 31
Population Served: BCCD Effective Service Area Within San Bernardino County, the official boundaries of the BCCD include the zip code areas described in this graphic. Chart__: Official BCCD District Boundaries
Source: Environmental Systems Research Institute; analysis by Cambridge West Partnership, LLC Geographically, the District covers 9,157 square miles. In 2000 the area population numbered 52,638 people. By 2010 the population had only increased to 53,529. The official District service area population is projected to become approximately 54,700 by 2019. Although the official District service area includes 10 zip codes, the College has been attracting student enrollments from a wider area. Effective Service Area Based upon an analysis of residential zip codes reported by enrolled students over the last five fall terms (2010 to 2014), the effective service area for Barstow College encompasses 17 cities Individuals from the 20 zip codes represented in these cities
extdocr.docx
Working Paper Draft 32
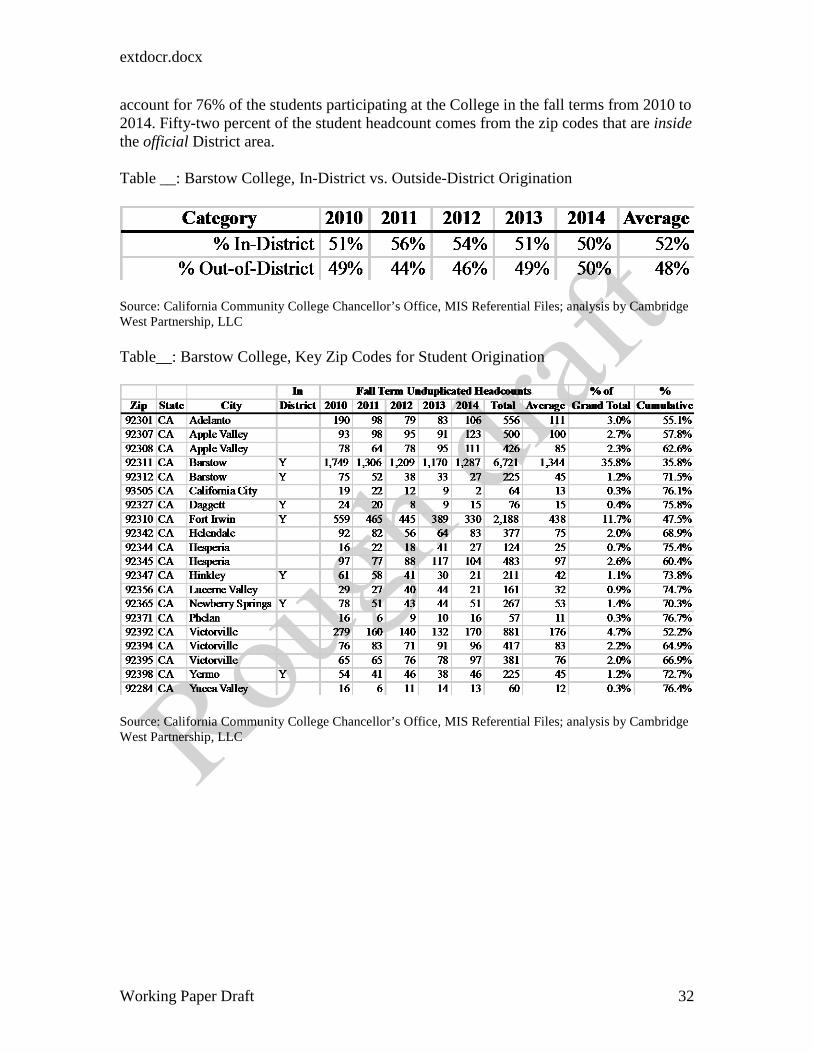
account for 76% of the students participating at the College in the fall terms from 2010 to 2014. Fifty-two percent of the student headcount comes from the zip codes that are inside the official District area. Table __: Barstow College, In-District vs. Outside-District Origination
Source: California Community College Chancellor’s Office, MIS Referential Files; analysis by Cambridge West Partnership, LLC Table__: Barstow College, Key Zip Codes for Student Origination
Source: California Community College Chancellor’s Office, MIS Referential Files; analysis by Cambridge West Partnership, LLC
extdocr.docx
Working Paper Draft 33
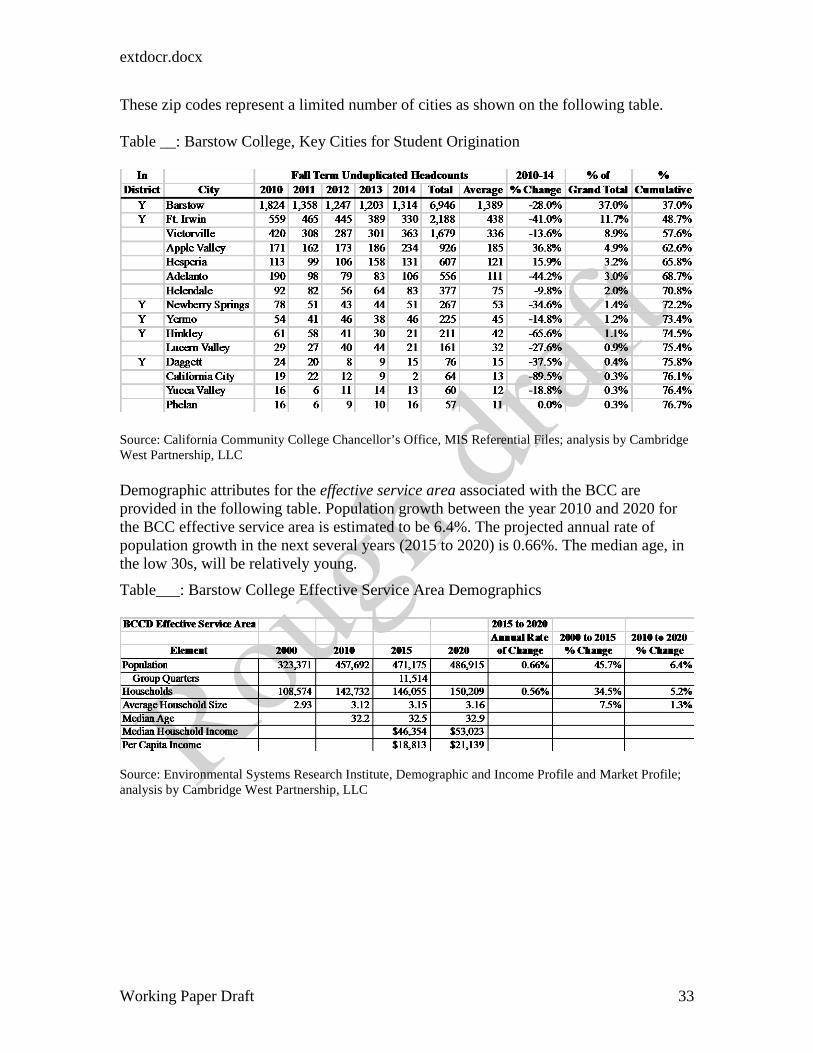
These zip codes represent a limited number of cities as shown on the following table. Table __: Barstow College, Key Cities for Student Origination
Source: California Community College Chancellor’s Office, MIS Referential Files; analysis by Cambridge West Partnership, LLC Demographic attributes for the effective service area associated with the BCC are provided in the following table. Population growth between the year 2010 and 2020 for the BCC effective service area is estimated to be 6.4%. The projected annual rate of population growth in the next several years (2015 to 2020) is 0.66%. The median age, in the low 30s, will be relatively young.
Table___: Barstow College Effective Service Area Demographics
Source: Environmental Systems Research Institute, Demographic and Income Profile and Market Profile; analysis by Cambridge West Partnership, LLC
extdocr.docx
Working Paper Draft 34
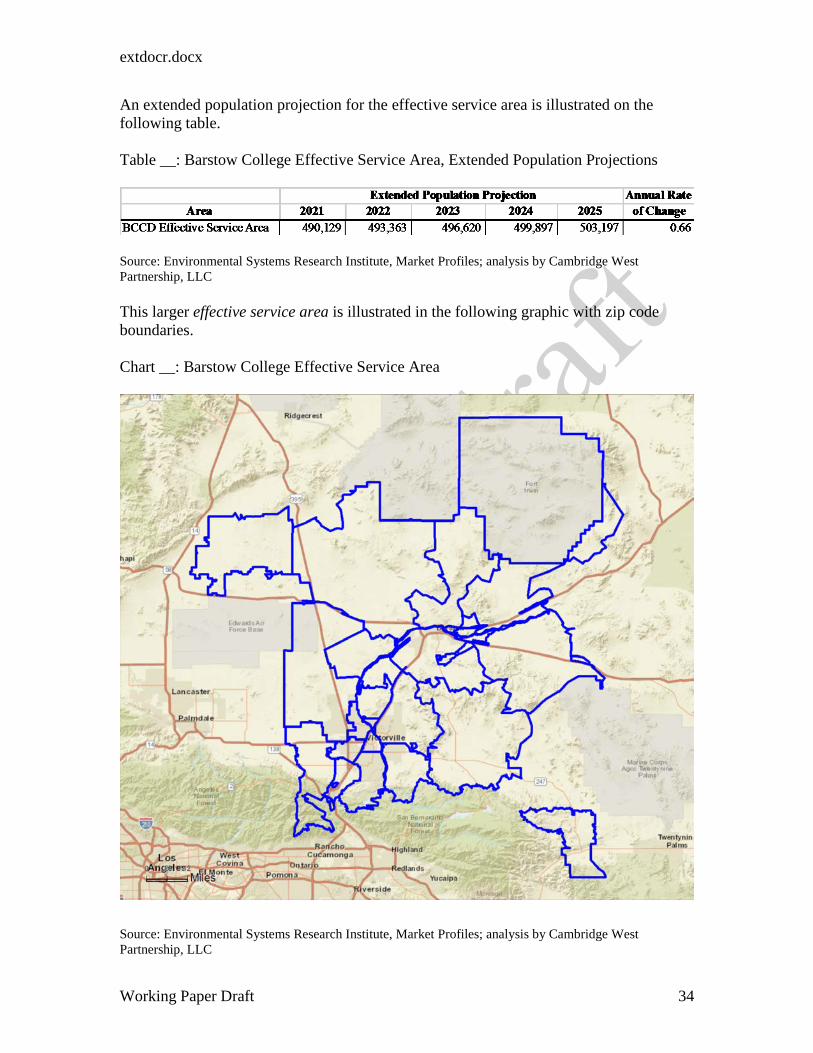
An extended population projection for the effective service area is illustrated on the following table. Table __: Barstow College Effective Service Area, Extended Population Projections
Source: Environmental Systems Research Institute, Market Profiles; analysis by Cambridge West Partnership, LLC This larger effective service area is illustrated in the following graphic with zip code boundaries. Chart __: Barstow College Effective Service Area
Source: Environmental Systems Research Institute, Market Profiles; analysis by Cambridge West Partnership, LLC
extdocr.docx
Working Paper Draft 35
Individual locations within the District official service area have different rates of growth with Barstow growing most rapidly and the Newberry Springs-Daggett area projected to lose some population. Table __: Census Place Populations in the District Official Service Area
Source: Environmental Systems Research Institute, Market Profiles; analysis by Cambridge West Partnership, LLC An extended population projection for the District official service area census places is illustrated on the following table. Table __: Barstow College District Official Service Area Census Places, Extended Population Projections
Within the BCC effective service area 50% of the residents have either less than a high school diploma or only a high school diploma. Another 29% completed some college but did not complete an Associate Degree. These residents are prime candidates for the instruction offered by the College.
extdocr.docx
Working Paper Draft 36
Chart __: Effective Service Area, Educational Attainment in 2015 for Adults Age 25 or Older
Source: Environmental Systems Research Institute, Market Profile; analysis by Cambridge West Partnership, LLC The census place locations within the District official service area have different adult educational attainment distributions with the Nipton, Baker and Ludlow area having the largest portion of adults with less than high school completion attainment. The population at Fort Irwin reported the smallest portion of their adult population as having less than high school completion. Table __: District Official Service Area Census Place Adult Educational Attainment Levels, 2015
Source: Environmental Systems Research Institute, Market Profile; analysis by Cambridge West Partnership, LLC
extdocr.docx
Working Paper Draft 37
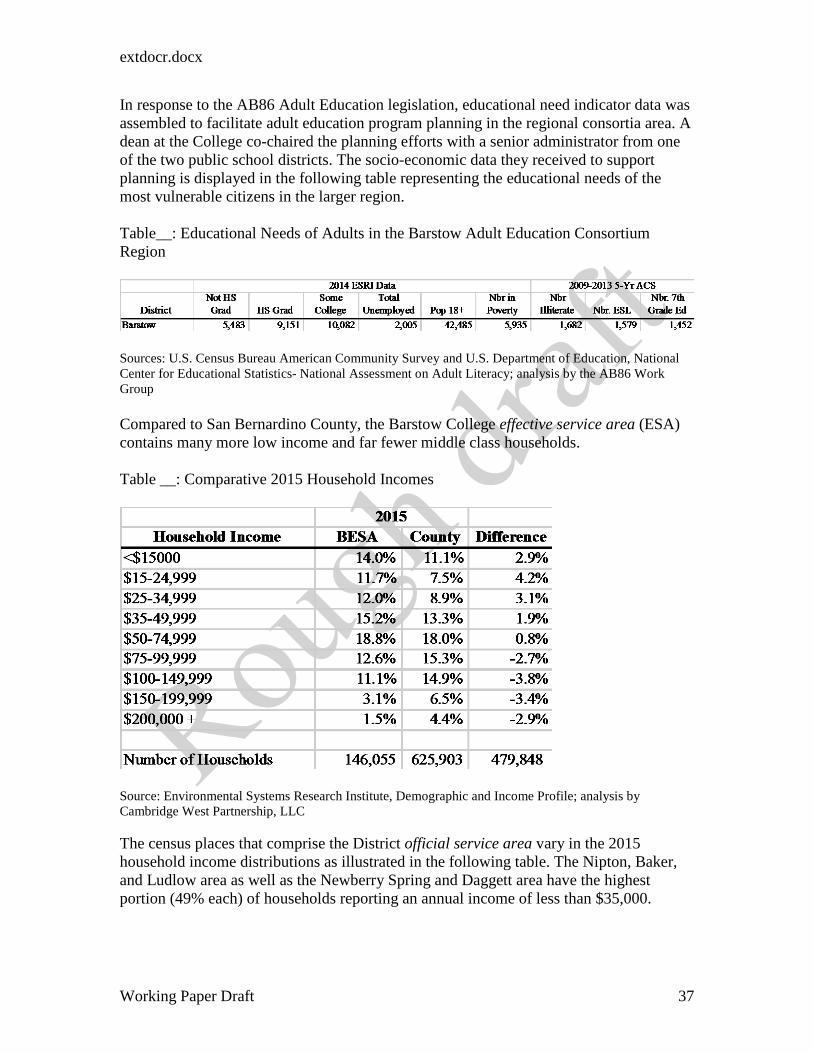
In response to the AB86 Adult Education legislation, educational need indicator data was assembled to facilitate adult education program planning in the regional consortia area. A dean at the College co-chaired the planning efforts with a senior administrator from one of the two public school districts. The socio-economic data they received to support planning is displayed in the following table representing the educational needs of the most vulnerable citizens in the larger region. Table__: Educational Needs of Adults in the Barstow Adult Education Consortium Region
Sources: U.S. Census Bureau American Community Survey and U.S. Department of Education, National Center for Educational Statistics- National Assessment on Adult Literacy; analysis by the AB86 Work Group Compared to San Bernardino County, the Barstow College effective service area (ESA) contains many more low income and far fewer middle class households. Table __: Comparative 2015 Household Incomes
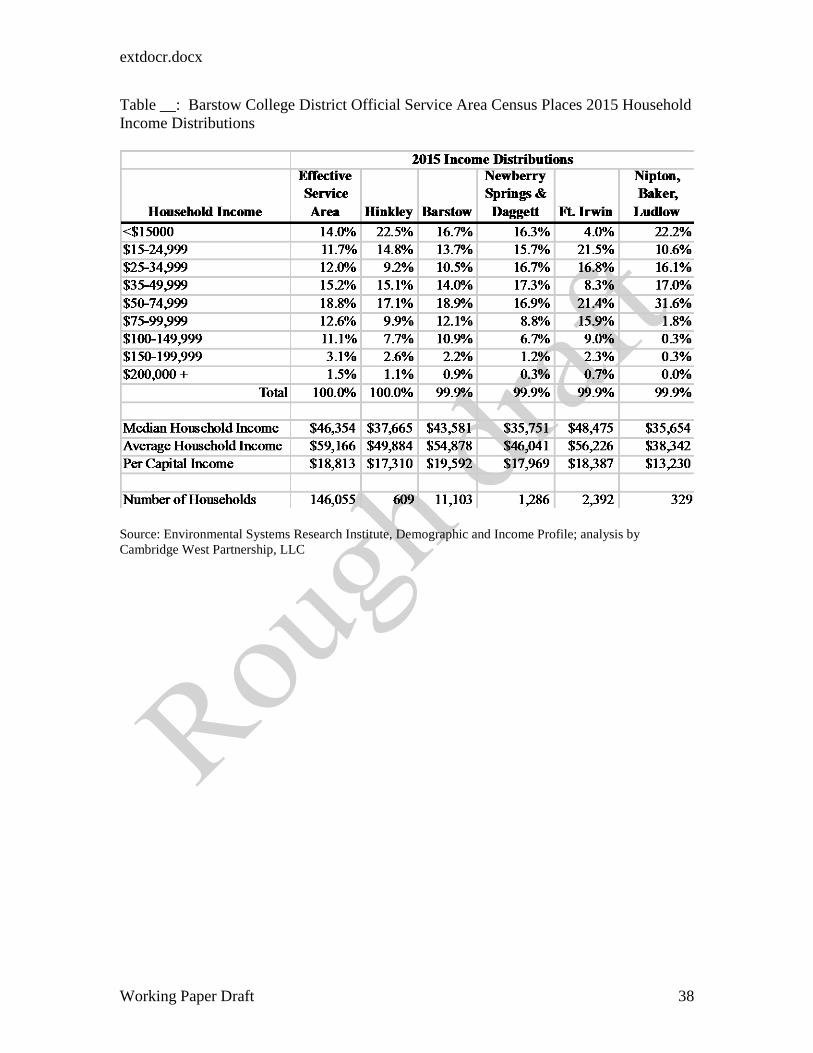
Source: Environmental Systems Research Institute, Demographic and Income Profile; analysis by Cambridge West Partnership, LLC The census places that comprise the District official service area vary in the 2015 household income distributions as illustrated in the following table. The Nipton, Baker, and Ludlow area as well as the Newberry Spring and Daggett area have the highest portion (49% each) of households reporting an annual income of less than $35,000.
extdocr.docx
Working Paper Draft 38
Table __: Barstow College District Official Service Area Census Places 2015 Household Income Distributions
Source: Environmental Systems Research Institute, Demographic and Income Profile; analysis by Cambridge West Partnership, LLC
extdocr.docx
Working Paper Draft 39
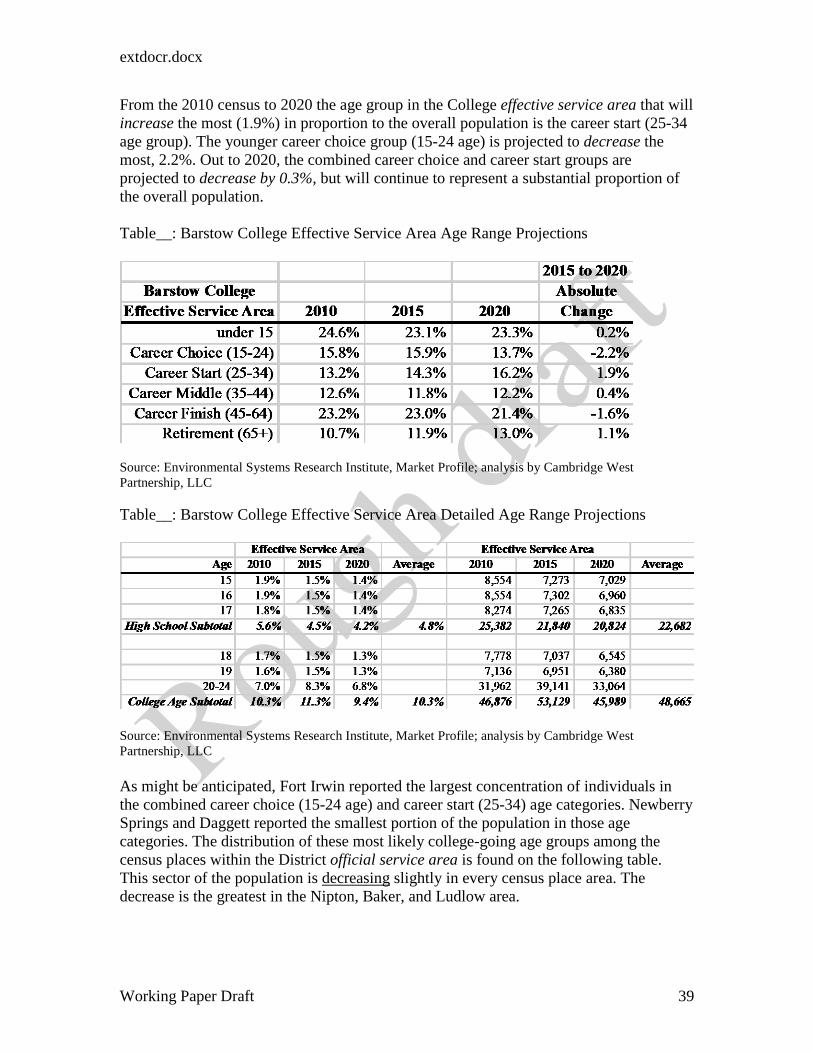
From the 2010 census to 2020 the age group in the College effective service area that will increase the most (1.9%) in proportion to the overall population is the career start (25-34 age group). The younger career choice group (15-24 age) is projected to decrease the most, 2.2%. Out to 2020, the combined career choice and career start groups are projected to decrease by 0.3%, but will continue to represent a substantial proportion of the overall population. Table__: Barstow College Effective Service Area Age Range Projections
Source: Environmental Systems Research Institute, Market Profile; analysis by Cambridge West Partnership, LLC Table__: Barstow College Effective Service Area Detailed Age Range Projections
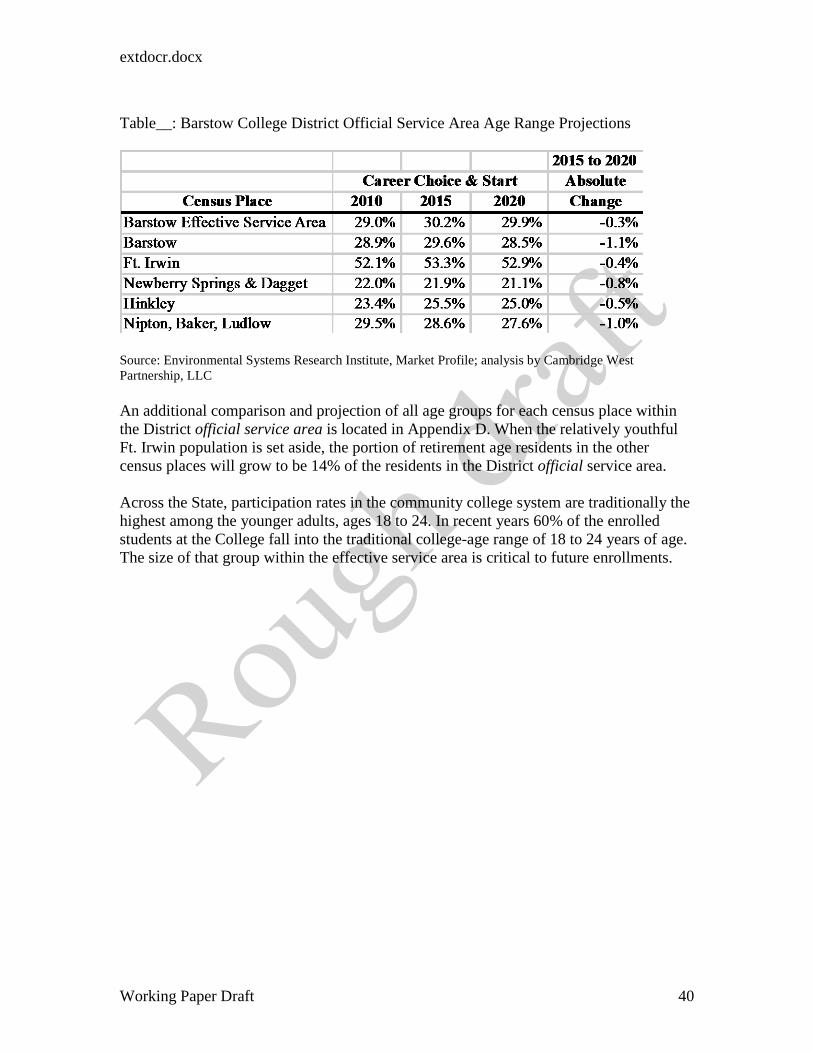
Source: Environmental Systems Research Institute, Market Profile; analysis by Cambridge West Partnership, LLC As might be anticipated, Fort Irwin reported the largest concentration of individuals in the combined career choice (15-24 age) and career start (25-34) age categories. Newberry Springs and Daggett reported the smallest portion of the population in those age categories. The distribution of these most likely college-going age groups among the census places within the District official service area is found on the following table. This sector of the population is decreasing slightly in every census place area. The decrease is the greatest in the Nipton, Baker, and Ludlow area.
extdocr.docx
Working Paper Draft 40
Table__: Barstow College District Official Service Area Age Range Projections
Source: Environmental Systems Research Institute, Market Profile; analysis by Cambridge West Partnership, LLC An additional comparison and projection of all age groups for each census place within the District official service area is located in Appendix D. When the relatively youthful Ft. Irwin population is set aside, the portion of retirement age residents in the other census places will grow to be 14% of the residents in the District official service area. Across the State, participation rates in the community college system are traditionally the highest among the younger adults, ages 18 to 24. In recent years 60% of the enrolled students at the College fall into the traditional college-age range of 18 to 24 years of age. The size of that group within the effective service area is critical to future enrollments.
extdocr.docx
Working Paper Draft 41
Over a long period of time, 1996 to 2010, the College annually enrolled 50 or more students from one high school that was the primary source of students and 20 to 49 students from two additional high schools. From 2010-11 to 2014-15 the annual and average yield rates are shown in the following table. The yield is calculated from the count of graduates (denominator) divided into the count of students who enroll at BCC the following year (numerator). Table __: Selected Feeder High Schools to Barstow Community College
Sources: BCC Office of Institutional Effectiveness. Fact Book 2013 -2014. California Community College Chancellor’s Office, MIS Referential Files. California Postsecondary Education Commission. Freshman Pathways. Retrieved from www.cpec.ca.gov on November 23, 2015; analysis by Cambridge West Partnership, LLC The largest racial group in the BCC effective service areas has been White. But, the portion of the self-reported White group is expected to shrink 1.9% by 2020 while the portion of the self-reported Some Other group is anticipated to increase 1.6% by 2020. Hispanic ethnic residents currently constitute 39.9% of the population. The Hispanic ethnic group is estimated to continue increasing by 4.1% between 2015 and 2020 to become 48% by 2020. Chart __: Barstow College Effective Service Area, Racial and Ethnic Composition
Source Environmental Systems Research Institute, Market Profile; analysis by Cambridge West Partnership, LLC
An additional comparison and projection of all racial and ethnic groups for each census place within the District official service area is located in Appendix D. Across the State, participation in the community college system varies among ethnic and racial groups. However, young people of Hispanic heritage have been historically underrepresented in higher education Implications for the College:
1. The population in the effective service area is projected to continue growing with a 6.4% change between 2010 and 2020 or a 0.66% annual change rate between 2015 and 2020, but to 2025 the population is projected to become approximately 503,000. The largest census place within the District official service area, Barstow, is projected to grow 3.1% between 2010 and 2020 or a 0.72% annual change rate between 2015 and 2020. The College should consider concentrating its outreach and recruiting in Barstow.
2. Data assembled for the adult education consortium activities indicate that within the official District service area there are a number of families living at or below the poverty level and a significant segment are English language learners. These data present profound implications and opportunities for the College.
3. From 2010 to 2012, fall term student distinct headcounts have declined but, since 2012, enrollments have been increasing. To some extent, the decline in enrollments is related to the significant shortfall in state resources that accompanied the Great Recession. The College is somewhat unique in that a significant portion of the enrollments are distance education classes as opposed to the classes on the campus. That has implications for additional campus facility capacity.
4. Throughout the effective service area, the portion of adult residents age 25 or older that have no high school diploma is 19%. In the largest census place within the District official service area, Barstow, 18% of the adults have no high school diploma. There are ample residents who could benefit by attending the institution and completing a certificate or degree.
5. Over the next five years the portion of teenagers and very young adults in the effective service area who are making career choices will continue to represent a substantial segment of the population. A limited number of public high schools have been the primary providers of students to the College. These data underscore the importance of outreach efforts the College might wish to continue in order to sustain enrollment volumes.
6. In the official District service area 14% of the households reported an income that is below $15,000, another 12% reported income between $15,000 and $24,999. The large portion of low income of households and households where English is spoken less than very well in the College’s official service area provide an opportunity for the College to be a “merchant of hope” by recruiting students whose lives will be transformed by their success at the institution.
7. The portion of District residents who self-reported as Hispanic was 43.9% in 2015 but will grow to 48% by 2020. In the largest city within the District official
extdocr.docx
Working Paper Draft 43
service area, Barstow, the Hispanic group was 46.2% of the population in 2015 and will grow to 50.5% by 2020. Traditionally, that group has had a lower participation rate in higher education. These trends present a particular recruiting challenge to the College.