171
ALTERNATIVES FOR POWER GENERATION IN THE GREATER MEKONG SUB-REGION Volume 6: Socialist Republic of Viet Nam Power Sector Scenarios Final 31 March 2016
| Date post: | 29-Jan-2017 |
| Category: |
Documents |
| Upload: | duongtuong |
| View: | 225 times |
| Download: | 2 times |
ALTERNATIVES FOR POWER GENERATION IN THE GREATER MEKONG SUB-REGION
Volume6:
SocialistRepublicofVietNamPowerSectorScenarios
Final
31 March 2016
FINAL
IntelligentEnergySystems IESREF:5973 ii
DisclaimerThis report has been prepared by Intelligent Energy Systems Pty Ltd (IES) andMekongEconomics (MKE) in relation toprovisionofservices toWorldWideFundforNature(WWF).Thisreportissuppliedingoodfaithandreflectstheknowledge,expertiseandexperienceof IESandMKE. Inconducting theresearchandanalysisforthisreportIESandMKEhaveendeavouredtousewhatitconsidersisthebestinformation available at the date of publication. IES and MKE make norepresentationsorwarrantiesastotheaccuracyoftheassumptionsorestimatesonwhichtheforecastsandcalculationsarebased.
IESandMKEmakenorepresentationorwarrantythatanycalculation,projection,assumption or estimate contained in this report should or will be achieved. Thereliance that the Recipient places upon the calculations and projections in thisreportisamatterfortheRecipient’sowncommercialjudgementandIESacceptsnoresponsibilitywhatsoeverforanylossoccasionedbyanypersonactingorrefrainingfromactionasaresultofrelianceonthisreport.
FINAL
IntelligentEnergySystems IESREF:5973 iii
AcronymsAD AnaerobicDigestion
ADB AsianDevelopmentBank
AGL AboveGroundLevel
ASEAN AssociationofSoutheastAsianNations
ASES AdvancedSustainableEnergySector
BAU BusinessAsUsual
BCM/Bcm BillionCubicMetres
BNEF BloombergNewEnergyFinance
BOT Build-Own-Transfer
BP BritishPetroleum
BST BulkSupplyTariff
BTU/Btu BritishThermalUnit
CAA CommercialArrangementArea
CAGR CompoundAnnualGrowthRate
CAPEX CapitalExpenditure
CCGT CombinedCycleGasTurbine
CCS CarbonCaptureandStorage
CENER NationalRenewableEnergyCentre
CHP CombinedHeatandPower
CIEMOT CentrodeInvestigacionesEnergeticasMedioambientalesyTecnológicas
COD CommercialOperationsDate
CSP ConcentratedSolarPower
DNI DirectNormalIrradiation
DR DemandResponse
DSM DemandSideManagement
DTU TechnicalUniversityofDenmark
EE EnergyEfficiency
FINAL
IntelligentEnergySystems IESREF:5973 iv
EIA EnergyInformationAdministration
EPTC ElectricPowerTradingCompany
ERAV ElectricityRegulatoryAuthorityofVietNam
EVN ElectricityofVietNam
FOB FreeonBoard
FOM FixedOperatingandMaintenance
GDE GeneralDirectorateforEnergy
GDP GrossDomesticProduct
GHI GlobalHorizontalIrradiance
GMS GreaterMekongSubregion
GT GasTurbine
HV HighVoltage
ICT InformationandCommunicationTechnology
IDAE InstitutoparalaDiversificaciónyAhorrodelaEnergía
IEA InternationalEnergyAgency
IES IntelligentEnergySystemsPtyLtd
IPP IndependentPowerProducer
IRENA InternationalRenewableEnergyAgency
LCOE OverallLevelisedCostofElectricity
LNG LiquefiedNaturalGas
LPG LiquefiedPetroleumGas
MKE MekongEconomics
MMCM MillionCubicMetres
MOIT MinistryofIndustryandTrade
MOU MemorandumofUnderstanding
MTPA MillionTonnesPerAnnum
MV MediumVoltage
NASA NationalAeronauticsandSpaceAdministration(theUnitedStates)
NLDC NationalLoadDispatchCentre
FINAL
IntelligentEnergySystems IESREF:5973 v
NPT NationalPowerTransmissionCorporation
NPV NetPresentValue
NREL NationalRenewableEnergyLaboratory(theUnitedStates)
OECD OrganisationforEconomicCo-operationandDevelopment
OPEC OrganisationofthePetroleumExportingCountries
OPEX OperationalExpenditure
PC PowerCorporation
PDP PowerDevelopmentPlan
PDR People’sDemocraticRepublic(ofLaos)
PPA PowerPurchaseAgreements
PRC People’sRepublicofChina
PV Photovoltaic
PVGas GasTradingCorporationunderPVN
PVPower PowerCorporationunderPVN
PVN PetroVietnam-VietNamNationalOilandGasGroup
RE RenewableEnergy
REVN RenewableEnergyofVietNamJointStockCompany
ROR RunofRiver
RPR ReservestoProductionRatio
SB SingleBuyer
SCADA/EMS SupervisoryControlandDataAcquisition/EnergyManagementSystem
SES SustainableEnergySector
SMO SystemandMarketOperator
ST SteamTurbine
SWERA SolarandWindEnergyResourceAssessment
SWH SolarWaterHeating
TCF/Tcf TrillionCubicFeet
TKV VietNamNationalCoalandMineralIndustryGroup
TNO TransmissionNetworkOperator
FINAL
IntelligentEnergySystems IESREF:5973 vi
TOE TonneofOilEquivalent
UN UnitedNations
US UnitedStates
USAID UnitedStatesAgencyforInternationalDevelopment
USD UnitedStatesDollar
VCGM VietNamCompetitiveGenerationMarket
VINACOMIN VietNamNationalCoalandMineralIndustryGroup
VOM VariableOperatingandMaintenance
VWEM VietNamWholesaleElectricityMarket
WBG WorldBankGroup
WEO WorldEnergyOutlook
WWF WorldWideFundforNature
WWF-GMPO
WWF–GreaterMekongProgrammeOffice
FINAL
IntelligentEnergySystems IESREF:5973 vii
TableofContents1 Introduction 9
1.1 ReportStructure 92 Background:VietNam’sElectricitySector 11
2.1 IndustryStructure 112.2 PowerSystem 132.3 InstalledCapacityandReserveMargin 142.4 ElectricityDemand 172.5 GenerationSupply 192.6 ImportsandExports 21
3 DevelopmentOptionsforVietNam’sElectricitySector 223.1 Overview 223.2 DomesticandImportedCoalResources 253.3 NaturalGasResources 273.5 HydroPower 323.10OceanEnergy 513.11RenewableEnergyPotentialandDiversity 51
4 VietNamDevelopmentScenarios 534.1 Scenarios 534.2 TechnologyCostAssumptions 564.3 FuelPricingOutlook 594.4 VietNamRealGDPGrowthOutlook 604.5 PopulationGrowth 614.6 CommittedGenerationProjectsinBAU,SESandASESScenarios 614.7 RegionalTransmissionSystemIntegration 644.8 ImportsandExports 654.9 Technical-EconomicPowerSystemModelling 66
5 BusinessasUsualScenario 685.1 BusinessasUsualScenario 685.2 ProjectedDemandGrowth 695.3 InstalledCapacityDevelopment 715.4 ProjectedGenerationMix 745.5 GridtoGridPowerFlows 775.6 GenerationFleetStructure 775.7 ReserveMarginandGenerationTrends 805.8 ElectrificationandOff-Grid 82
6 SustainableEnergySectorScenario 836.1 SustainableEnergySectorScenario 836.2 ProjectedDemandGrowth 836.3 InstalledCapacityDevelopment 856.4 ProjectedGenerationMix 886.5 GridtoGridPowerFlows 916.6 GenerationFleetStructure 916.7 ReserveMarginandGenerationTrends 936.8 ElectrificationandOff-Grid 96

FINAL
IntelligentEnergySystems IESREF:5973 viii
7 AdvancedSustainableEnergySectorScenario 977.1 AdvancedSustainableEnergySectorScenario 977.2 ProjectedDemandGrowth 977.3 InstalledCapacityDevelopment 997.4 ProjectedGenerationMix 1027.5 GridtoGridPowerFlows 1057.6 GenerationFleetStructure 1057.7 ReserveMarginandGenerationTrends 1087.8 ElectrificationandOff-Grid 110
8 AnalysisofScenarios 1118.1 EnergyandPeakDemand 1118.2 Energyintensity 1138.3 GenerationMixComparison 1148.4 CarbonEmissions 1168.5 HydroPowerDevelopments 1178.6 AnalysisofBioenergy 1198.7 SecurityofSupplyIndicators 1208.8 InterregionalPowerFlows 123
9 EconomicImplications 1249.1 OverallLevelisedCostofElectricity(LCOE) 1249.2 LCOEComposition 1259.3 CumulativeCapitalInvestment 1279.4 OperatingCosts,AmortisedCapitalCostsandEnergyEfficiencyCosts 1319.5 FuelPriceSensitivity 1369.6 ImpactofaCarbonPrice 1379.7 RenewableTechnologyCostSensitivity 1389.8 JobsCreation 139
10 Conclusions 14210.1ComparisonofScenarios 14410.2EconomicImplications 14510.3IdentifiedBarriersfortheSESandASES 14610.4Recommendations 149
AppendixA TechnologyCosts 152AppendixB FuelPrices 156AppendixC MethodologyforJobsCreation 157AppendixD VietNamWindResourceMaps 159
D.1 WindSpeedMaps 159D.2 WindPowerDensityMaps 163
AppendixE VietNamSolarResourceMaps 166E.1 GlobalHorizontalIrradianceandDirectNormalIrradiance 166E.2 ConcentratingSolarPower(CSP)Potential 169
FINAL
IntelligentEnergySystems IESREF:5973 9
1 IntroductionIntelligent Energy Systems Pty Ltd (“IES”) and Mekong Economics (“MKE”) wereretained by WWF – Greater Mekong Programme Office (“WWF-GMPO”) toundertakeaprojectcalled“Produceacomprehensivereportoutliningalternativesfor power generation in the Greater Mekong Sub-region”. This was to developscenarios for the countries of the GreaterMekong Sub-region (GMS) that are asconsistentaspossiblewiththeWWF’sGlobalEnergyVisiontothePowerSectorsofall GreaterMekong Subregion countries. The objectives ofWWF’s vision are: (i)contributetoreductionofglobalgreenhouseemissions(cutby>80%of1990levelsby2050);(ii)reducedependencyonunsustainablehydroandnuclear;(iii)enhanceenergyaccess; (iv) takeadvantageofnewtechnologiesandsolutions; (v)enhancepower sector planning frameworks for the region:multi-stakeholder participatoryprocess;and(vi)developenhancementsforenergypolicyframeworks.
Thepurposeofthisreportistoprovidedetailedcountry-leveldescriptionsofthreescenariosforthepowersectoroftheSocialistRepublicofVietNam(VietNam):
• BusinessasUsual (BAU)powergenerationdevelopmentpathwhich isbasedoncurrentpowerplanningpractices,currentpolicyobjectives;
• Sustainable Energy Sector (SES) scenario, where measures are taken tomaximally deploy renewable energy 1 and energy efficiency measures toachieveanear-100%renewableenergypowersector;and
• Advanced Sustainable Energy Sector (ASES) scenario,which assumes amorerapid advancement and deployment of new and renewable technologies ascomparedtotheSES.
The scenarios were based on public data, independent assessments of resourcepotentials, information obtained from published reports and power systemmodellingoftheGMSregionfortheperiod2015to2050.
1.1 ReportStructure
Thisreporthasbeenorganisedinthefollowingway:
• Section2setsoutrecentoutcomesforVietNam’selectricityindustry;• Section3summarisesthemaindevelopmentoptionscoveringbothrenewable
energyandfossilfuels;• Section4providesabriefsummaryofthescenariosthatweremodelledanda
summaryoftheassumptionsincommon;• Section5setsoutthekeyresultsforthebusinessasusualscenario;
1Proposed but not committed fossil fuel based projects are not developed. Committed and existing fossil fuelbasedprojectsareretiredattheendoftheir lifetimeandnotreplacedwithotherfossil fuelprojects. A leastcostcombinationofrenewableenergygenerationisdevelopedtomeetdemand.
FINAL
IntelligentEnergySystems IESREF:5973 10
• Section6setsoutthekeyresultsforthesustainableenergysectorscenario;• Section7 sets out the key results for an advanced sustainable energy sector
scenario;• Section 8 provides comparative analysis of the three scenarios basedon the
computationofanumberofsimplemetricsthatfacilitatecomparison;• Section9providesanalysisoftheeconomicimplicationsofthescenarios;and• Section10providesthemainconclusionsfromthemodelling.
Thefollowingappendicesprovidesomeadditionalinformationforthescenarios:
• AppendixAcontainsthetechnologycostassumptionsthatwereused;• AppendixBprovidesthefuelpriceprojectionsthatwereused;• AppendixC setsout informationused toestimate jobscreationpotential for
eachscenario.• AppendixDsetsoutanumberofwindresourcemaps;and• AppendixEsetsoutseveralsolarresourcemaps.
Note thatunlessotherwisenoted,all currency in the report isReal2014UnitedStates Dollars (USD). All projections presented in this report commence in theyear2015.
FINAL
IntelligentEnergySystems IESREF:5973 11
2 Background:VietNam’sElectricitySector
2.1 IndustryStructure
Viet Nam’s electricity industry has been undergoing restructuring since 2005 andthisisaprocessthatisongoing.
Restructuring Viet Nam’s electricity sector startedwith the establishment of VietNamElectricity(EVN)asaholdingcompanyin2006. EVNanditssubsidiaries(thePCs)havesinceplayedadominantrole intheelectricity industry. EVN’sactivitiescovermost aspects in Viet Nam’s electricity sector: generation, transmission, theroleof thesinglewholesalebuyer,distribution,andsellingbeingmanagedbyfivePCs.Asof2013,EVNheldmajorityownershipofapproximately61%oftheinstalledgeneratingcapacitydirectlyandthroughitssubsidiaries2.
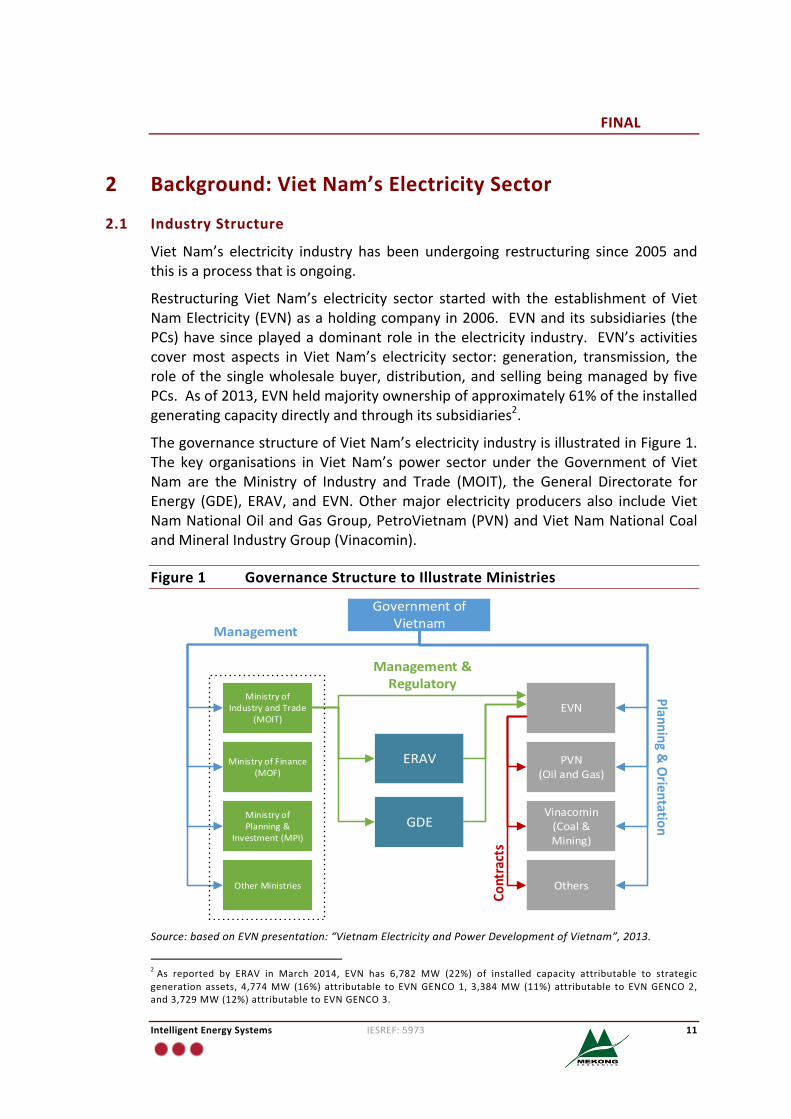
ThegovernancestructureofVietNam’selectricityindustryisillustratedinFigure1.The key organisations in VietNam’s power sector under theGovernment of VietNam are theMinistry of Industry and Trade (MOIT), the General Directorate forEnergy (GDE), ERAV, and EVN.Othermajor electricity producers also includeVietNamNationalOilandGasGroup,PetroVietnam(PVN)andVietNamNationalCoalandMineralIndustryGroup(Vinacomin).
Figure1 GovernanceStructuretoIllustrateMinistries
GovernmentofVietnam
MinistryofIndustryandTrade
(MOIT)
MinistryofFinance(MOF)
MinistryofPlanning&
Investment(MPI)
OtherMinistries
ERAV
GDE
EVN
PVN(OilandGas)
Vinacomin(Coal&Mining)
Others
Management
Planning&Orientation
Management&Regulatory
Contracts
Source:basedonEVNpresentation:“VietnamElectricityandPowerDevelopmentofVietnam”,2013.
2As reported by ERAV in March 2014, EVN has 6,782 MW (22%) of installed capacity attributable to strategicgeneration assets, 4,774MW (16%) attributable to EVNGENCO1, 3,384MW (11%) attributable to EVNGENCO2,and3,729MW(12%)attributabletoEVNGENCO3.
FINAL
IntelligentEnergySystems IESREF:5973 12
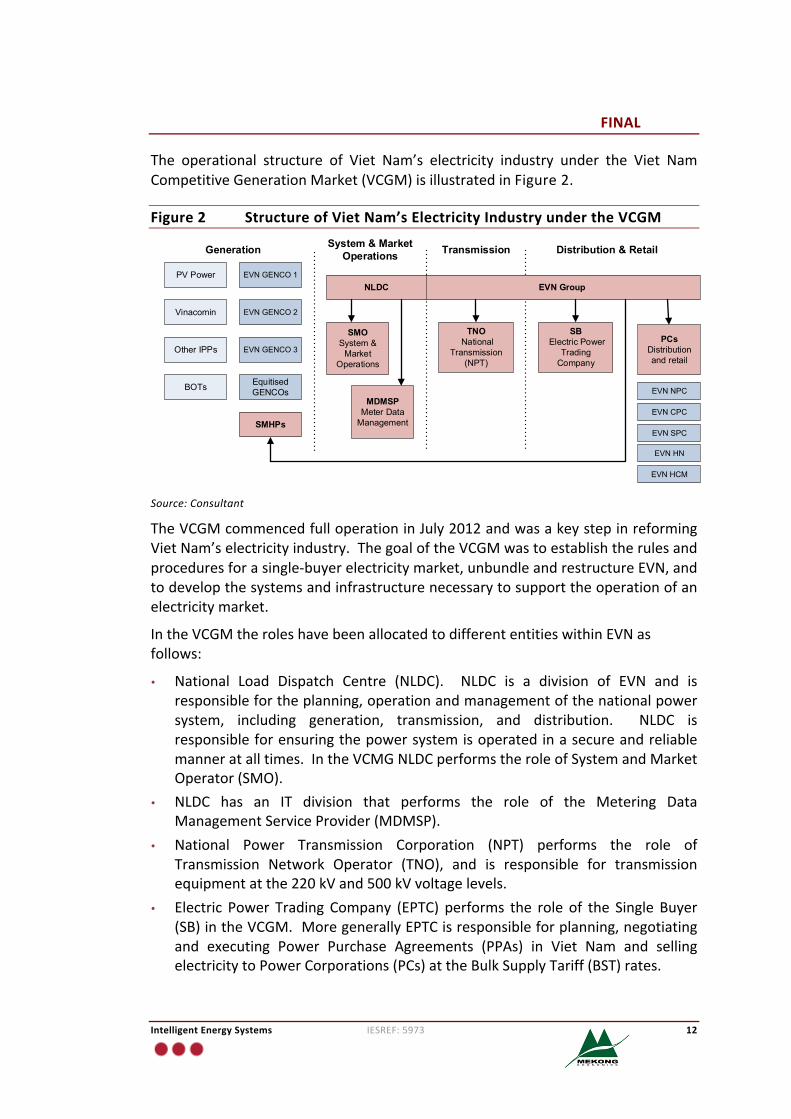
The operational structure of Viet Nam’s electricity industry under the Viet NamCompetitiveGenerationMarket(VCGM)isillustratedinFigure2.
Figure2 StructureofVietNam’sElectricityIndustryundertheVCGM
Source:Consultant
TheVCGMcommencedfulloperationinJuly2012andwasakeystepinreformingVietNam’selectricityindustry.ThegoaloftheVCGMwastoestablishtherulesandproceduresforasingle-buyerelectricitymarket,unbundleandrestructureEVN,andtodevelopthesystemsandinfrastructurenecessarytosupporttheoperationofanelectricitymarket.
IntheVCGMtheroleshavebeenallocatedtodifferententitieswithinEVNasfollows:
• National Load Dispatch Centre (NLDC). NLDC is a division of EVN and isresponsiblefortheplanning,operationandmanagementofthenationalpowersystem, including generation, transmission, and distribution. NLDC isresponsibleforensuringthepowersystemisoperatedinasecureandreliablemanneratalltimes.IntheVCMGNLDCperformstheroleofSystemandMarketOperator(SMO).
• NLDC has an IT division that performs the role of the Metering DataManagementServiceProvider(MDMSP).
• National Power Transmission Corporation (NPT) performs the role ofTransmission Network Operator (TNO), and is responsible for transmissionequipmentatthe220kVand500kVvoltagelevels.
• Electric Power Trading Company (EPTC) performs the role of the Single Buyer(SB)intheVCGM.MoregenerallyEPTCisresponsibleforplanning,negotiatingand executing Power Purchase Agreements (PPAs) in Viet Nam and sellingelectricitytoPowerCorporations(PCs)attheBulkSupplyTariff(BST)rates.
BOTs
PV Power
Vinacomin
Other IPPs
Equitised GENCOs
SMHPs
EVN GENCO 1
EVN GENCO 2
EVN GENCO 3
Generation System & Market Operations Distribution & Retail
TNO National
Transmission (NPT)
SB Electric Power
Trading Company
PCsDistribution and retail
MDMSPMeter Data
Management
EVN Group
Transmission
SMOSystem &
Market Operations
NLDC
EVN NPC
EVN CPC
EVN SPC
EVN HN
EVN HCM
FINAL
IntelligentEnergySystems IESREF:5973 13
• ThefivePCsaredistributionandretailcompanies. TheypurchasepowerfromEPTC at the BST and sell electricity to their customers at regulated uniformtariffs.
ThereareplanstotransitiontheVCGMtowardstheVietNamWholesaleElectricityMarket (VWEM) by 2019, which would involve having PC’s being responsible formanaging theirownpowerpurchases, rather than theSBand takingmeasures tomaximisethedirectparticipationofallgeneratorsinthewholesalemarket.
2.2 PowerSystem
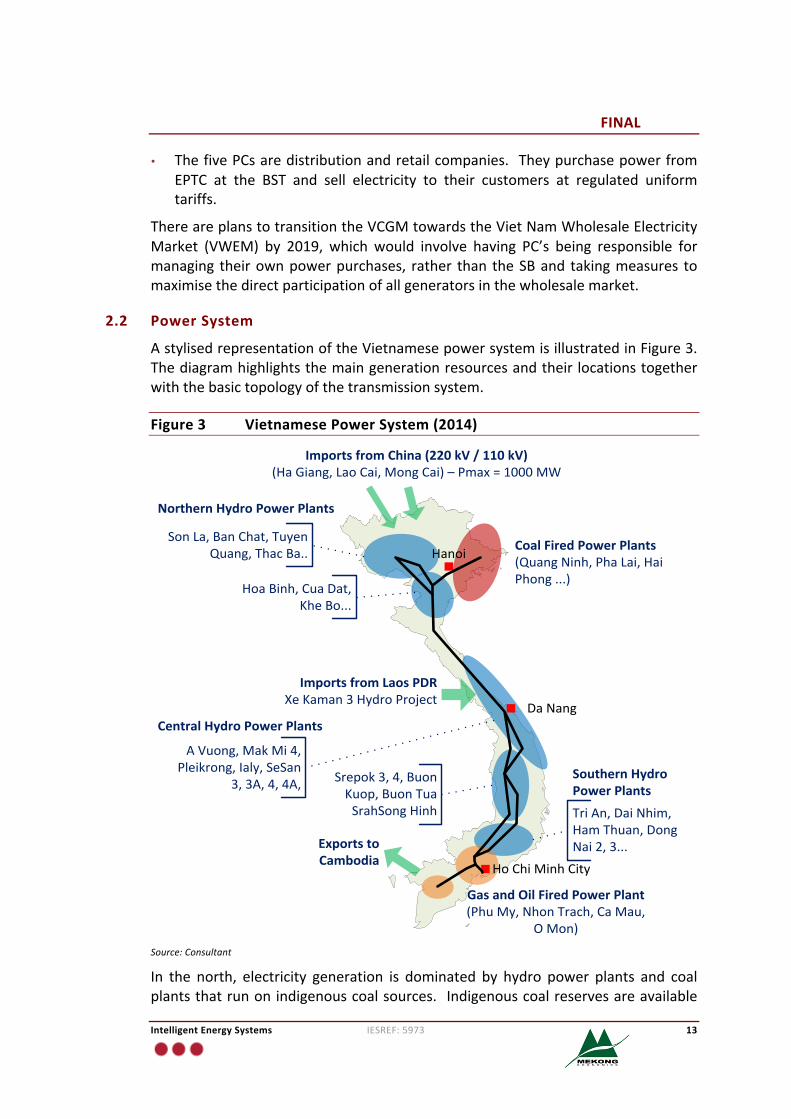
AstylisedrepresentationoftheVietnamesepowersystemisillustratedinFigure3.Thediagramhighlightsthemaingenerationresourcesandtheirlocationstogetherwiththebasictopologyofthetransmissionsystem.
Figure3 VietnamesePowerSystem(2014)
Hanoi
DaNang
HoChiMinhCity
CoalFiredPowerPlants(QuangNinh,PhaLai,HaiPhong...)
NorthernHydroPowerPlants
ImportsfromChina(220kV/110kV)(HaGiang,LaoCai,MongCai)–Pmax=1000MW
GasandOilFiredPowerPlant(PhuMy,NhonTrach,CaMau,
OMon)
ImportsfromLaosPDRXeKaman3HydroProject
ExportstoCambodia
SonLa,BanChat,TuyenQuang,ThacBa..
HoaBinh,CuaDat,KheBo...
CentralHydroPowerPlants
AVuong,MakMi4,Pleikrong,Ialy,SeSan
3,3A,4,4A,
TriAn,DaiNhim,HamThuan,DongNai2,3...
SouthernHydroPowerPlants
Srepok3,4,BuonKuop,BuonTuaSrahSongHinh
Source:Consultant
In the north, electricity generation is dominated by hydro power plants and coalplantsthatrunonindigenouscoalsources. Indigenouscoalreservesareavailable
FINAL
IntelligentEnergySystems IESREF:5973 14
mainly inthenortheastregion(QuangNinhProvince)andarebeingexploitedforpowergeneration.Likewisethereservoirsforthehydrosgenerallylieinriverbasinsin the northwest, particularly in the red river system. Apart from electricitygeneration the large reservoirs within the Red river system are used for floodmitigationintheRedriverdelta. Inthenorth,therearealsopower importsfromPeople’s Republic of China (PRC), although thenational systemsofVietNamandPRCareelectricallyisolated.
Thecentral regionofVietNam isalmostentirelydominatedbyhydrogeneration.The central region is considered to consist of two main subregions: the eastcoastlandandthesouth-westhighlands.Thecoastalsubregionisanarrowstripoflandwhich consists of a numberof separatebasins. There is considerablehydropotentialdue to thegradientof the rivers inmountainousareas thatareclose tothecoastline.Thesouth-westhighlandshaveanumberofMekongtributariesthatflowtowardsthewesternborderofthecountry.
Thesouthern region isdominatedbyhydro,CombinedCycleGasTurbines (CCGT)andSteamTurbines(ST).TheCCGTsincludingPhuMyComplex,NhonTrach,BaRiaandCaMauandrunonnaturalgasthatistransportedfromanumberofoffshorefields.ThemainriversystemsinthesouthregionincludetheDongNaiRiverBasinwith significant potential for hydro power generation and to the west of it, thedownstream Mekong Delta (only 5% of the entire Mekong basin). This poseschallengesforfloodmitigationinthedelta.
Itisnotedthat,underthegovernment’sstrategytodiversifydifferenttechnologiesacross the regions, coalpowerplantshavebeenplannedandconstructed for thecentralandsouthernregions,withseveralgeneratorsalreadycommissioned,withrecentlytheVinhTancoalthermalcomplexinBinhThuanprovince(South),DuyenHaicoalthermalcomplex inTraVinhprovince(South)andVungAngcoalthermalgeneration complex in Ha Tinh province (Centre). In addition, the first nuclearpowerplantsmaybeconstructedinNinhThuanprovince(Centre).
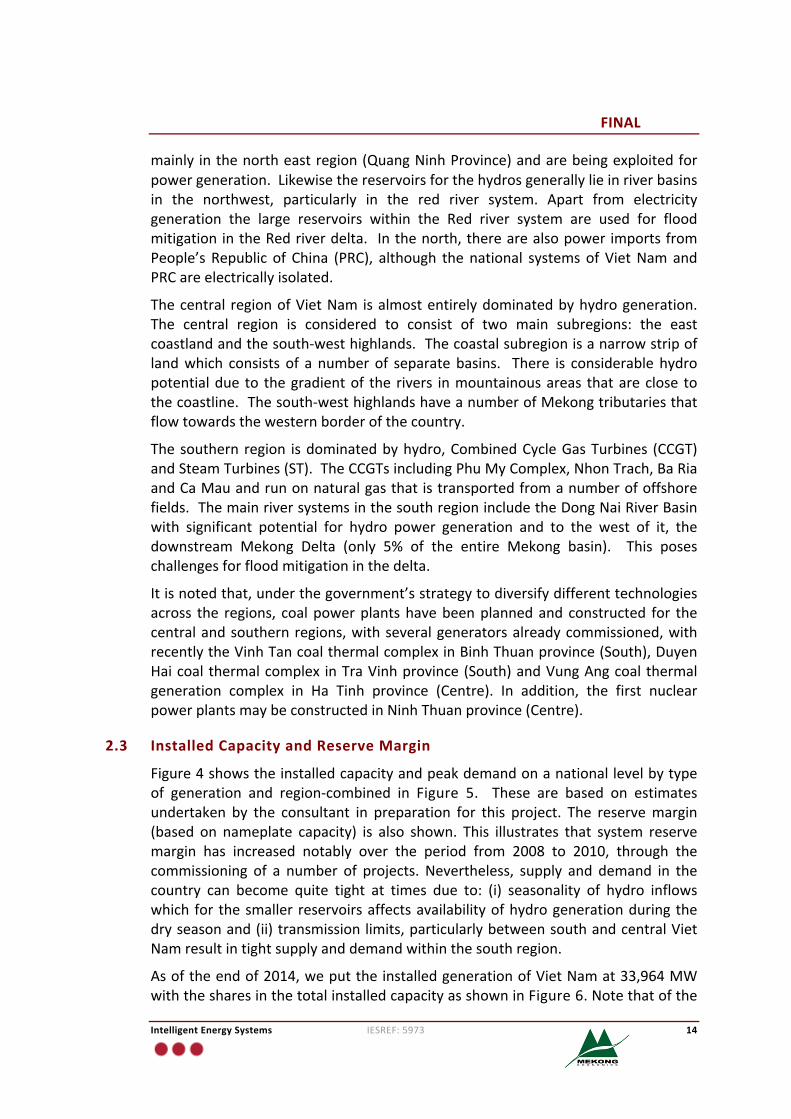
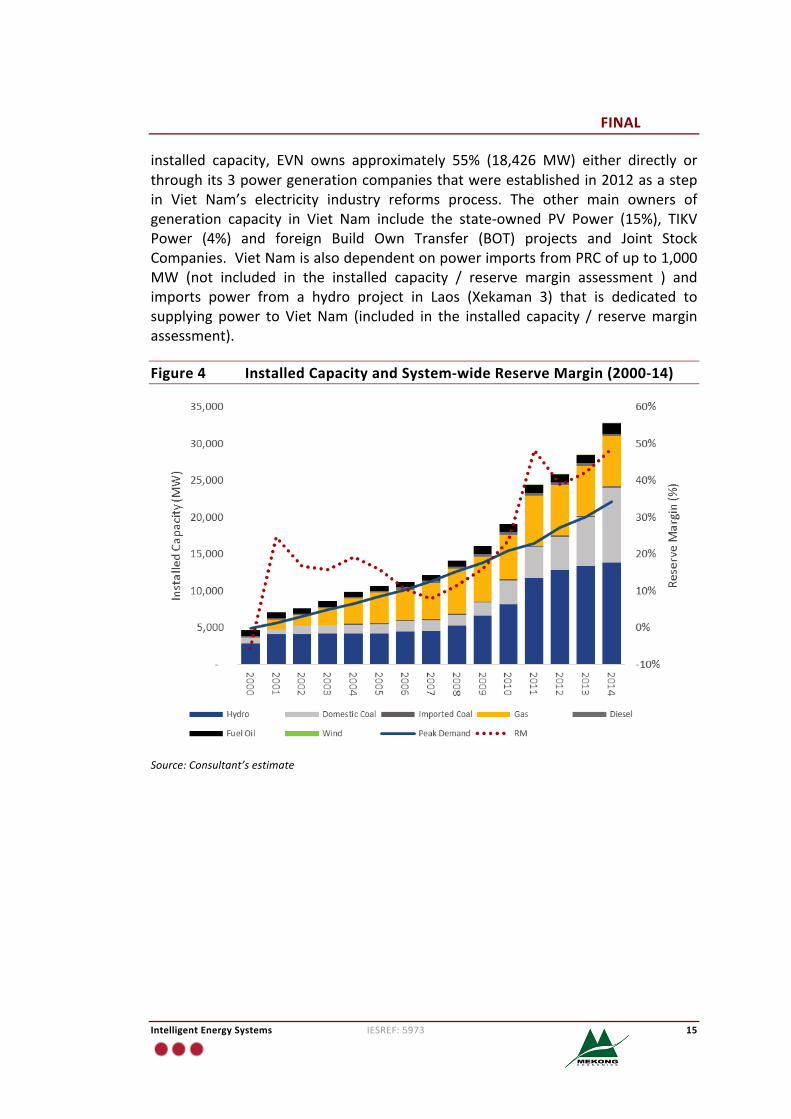
2.3 InstalledCapacityandReserveMargin
Figure4showstheinstalledcapacityandpeakdemandonanationallevelbytypeof generation and region-combined in Figure 5. These are based on estimatesundertaken by the consultant in preparation for this project. The reservemargin(based on nameplate capacity) is also shown. This illustrates that system reservemargin has increased notably over the period from 2008 to 2010, through thecommissioning of a number of projects. Nevertheless, supply and demand in thecountry can become quite tight at times due to: (i) seasonality of hydro inflowswhich for thesmaller reservoirsaffectsavailabilityofhydrogenerationduringthedryseasonand(ii)transmissionlimits,particularlybetweensouthandcentralVietNamresultintightsupplyanddemandwithinthesouthregion.
Asoftheendof2014,weputtheinstalledgenerationofVietNamat33,964MWwiththesharesinthetotalinstalledcapacityasshowninFigure6.Notethatofthe
FINAL
IntelligentEnergySystems IESREF:5973 15
installed capacity, EVN owns approximately 55% (18,426 MW) either directly orthroughits3powergenerationcompaniesthatwereestablishedin2012asastepin Viet Nam’s electricity industry reforms process. The other main owners ofgeneration capacity in Viet Nam include the state-owned PV Power (15%), TIKVPower (4%) and foreign Build Own Transfer (BOT) projects and Joint StockCompanies.VietNamisalsodependentonpowerimportsfromPRCofupto1,000MW (not included in the installed capacity / reserve margin assessment ) andimports power from a hydro project in Laos (Xekaman 3) that is dedicated tosupplying power to VietNam (included in the installed capacity / reservemarginassessment).
Figure4 InstalledCapacityandSystem-wideReserveMargin(2000-14)
Source:Consultant’sestimate
FINAL
IntelligentEnergySystems IESREF:5973 16
Figure5 InstalledCapacity(byRegion)andSystem-wideReserveMargin
Source:Consultant’sestimate
Figure6 CapacityBreakdownbyType(2014)
Source:Consultant’sestimate
FINAL
IntelligentEnergySystems IESREF:5973 17
2.4 ElectricityDemand
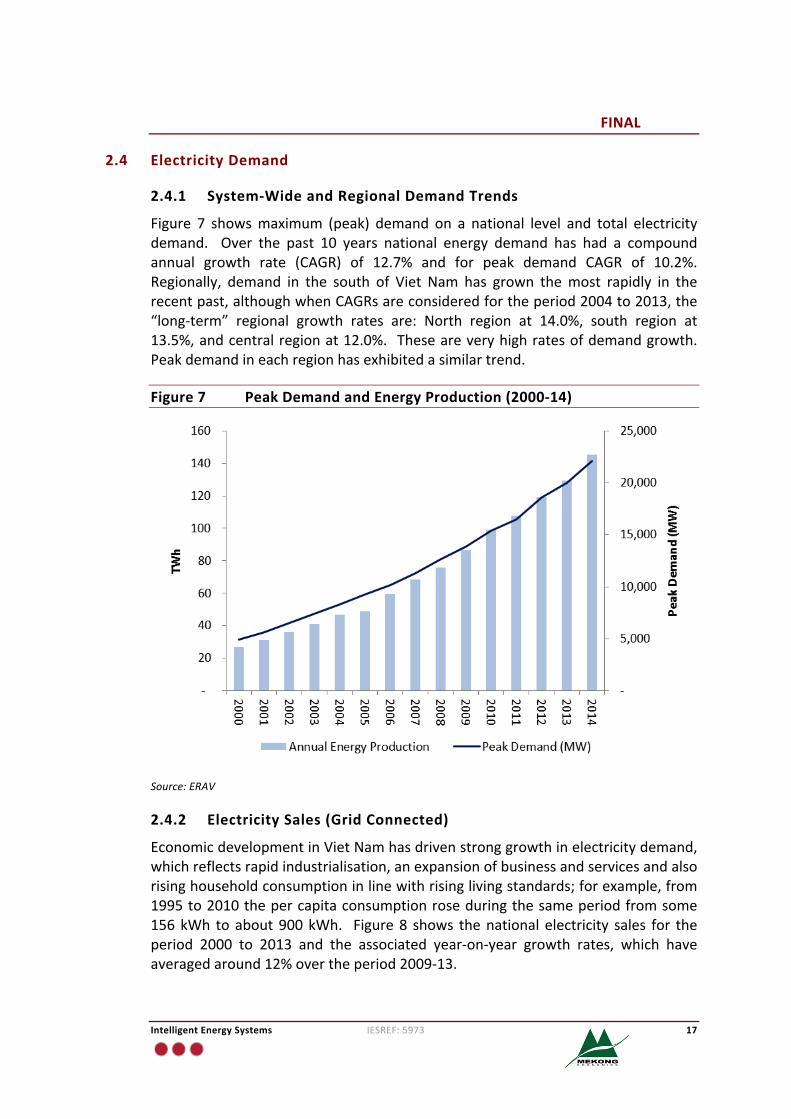
2.4.1 System-WideandRegionalDemandTrends
Figure 7 showsmaximum (peak) demand on a national level and total electricitydemand. Over the past 10 years national energy demand has had a compoundannual growth rate (CAGR) of 12.7% and for peak demand CAGR of 10.2%.Regionally, demand in the south of Viet Nam has grown themost rapidly in therecentpast,althoughwhenCAGRsareconsideredfortheperiod2004to2013,the“long-term” regional growth rates are: North region at 14.0%, south region at13.5%,andcentralregionat12.0%. Theseareveryhighratesofdemandgrowth.Peakdemandineachregionhasexhibitedasimilartrend.
Figure7 PeakDemandandEnergyProduction(2000-14)
Source:ERAV
2.4.2 ElectricitySales(GridConnected)
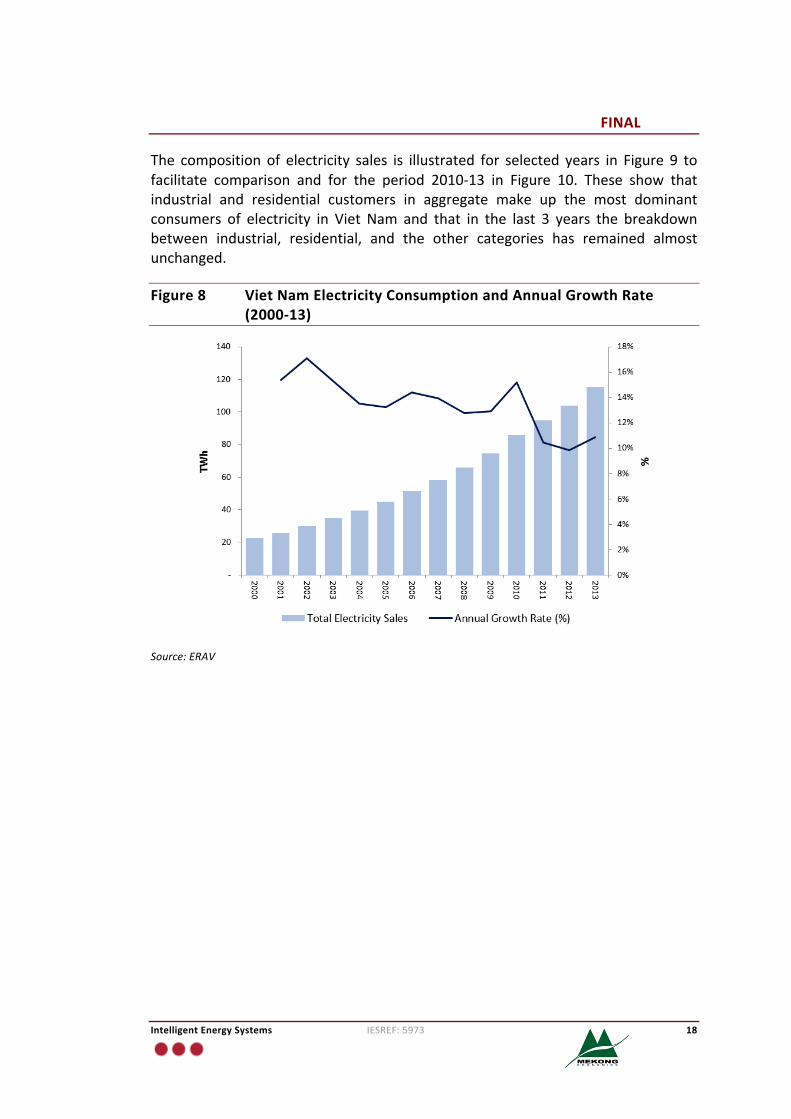
EconomicdevelopmentinVietNamhasdrivenstronggrowthinelectricitydemand,whichreflectsrapidindustrialisation,anexpansionofbusinessandservicesandalsorisinghouseholdconsumptioninlinewithrisinglivingstandards;forexample,from1995to2010thepercapitaconsumptionroseduringthesameperiodfromsome156kWh toabout900kWh. Figure8 shows thenational electricity sales for theperiod 2000 to 2013 and the associated year-on-year growth rates, which haveaveragedaround12%overtheperiod2009-13.
FINAL
IntelligentEnergySystems IESREF:5973 18
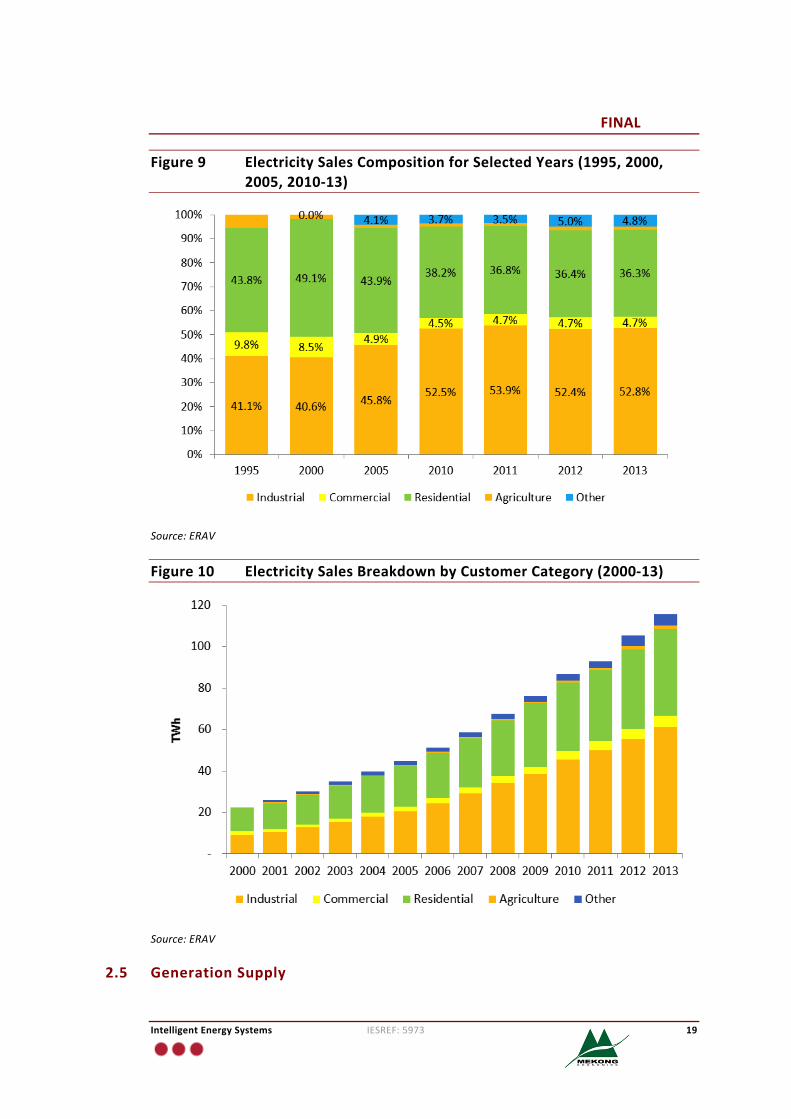
The composition of electricity sales is illustrated for selected years in Figure 9 tofacilitate comparison and for the period 2010-13 in Figure 10. These show thatindustrial and residential customers in aggregate make up the most dominantconsumers of electricity in Viet Nam and that in the last 3 years the breakdownbetween industrial, residential, and the other categories has remained almostunchanged.
Figure8 VietNamElectricityConsumptionandAnnualGrowthRate(2000-13)
Source:ERAV
FINAL
IntelligentEnergySystems IESREF:5973 19
Figure9 ElectricitySalesCompositionforSelectedYears(1995,2000,2005,2010-13)
Source:ERAV
Figure10 ElectricitySalesBreakdownbyCustomerCategory(2000-13)
Source:ERAV
2.5 GenerationSupply
FINAL
IntelligentEnergySystems IESREF:5973 20
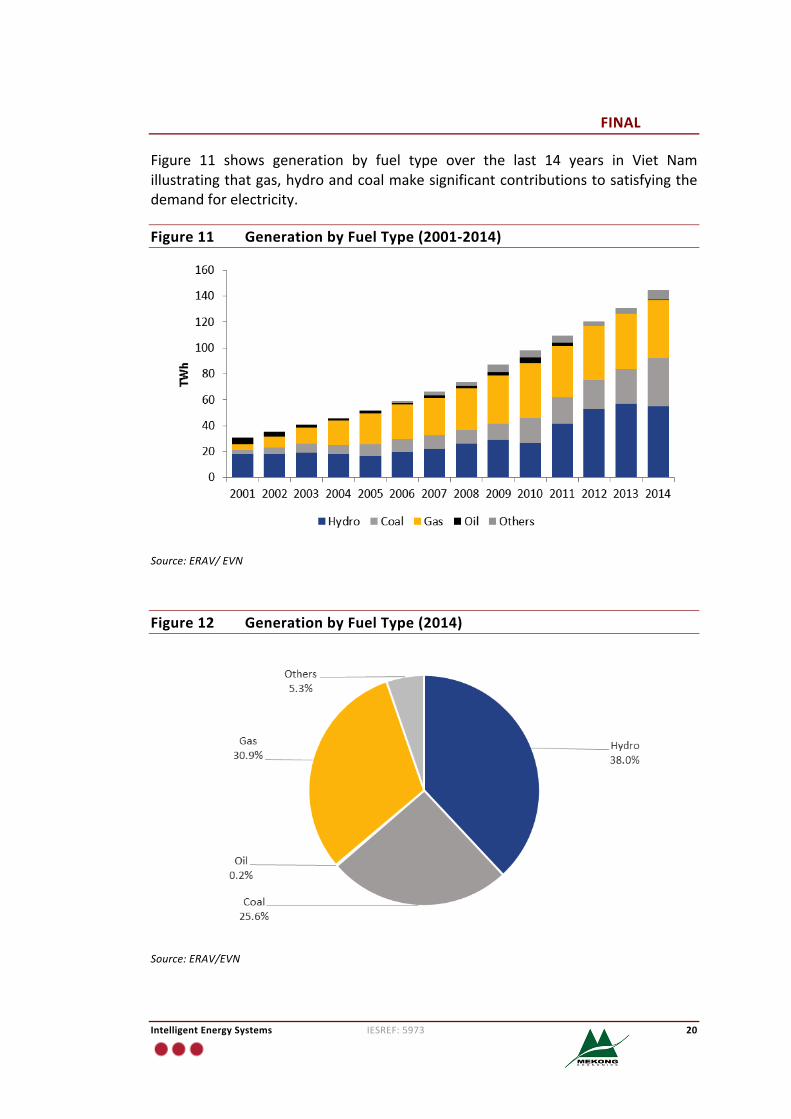
Figure 11 shows generation by fuel type over the last 14 years in Viet Namillustratingthatgas,hydroandcoalmakesignificantcontributionstosatisfyingthedemandforelectricity.
Figure11 GenerationbyFuelType(2001-2014)
Source:ERAV/EVN
Figure12 GenerationbyFuelType(2014)
Source:ERAV/EVN
FINAL
IntelligentEnergySystems IESREF:5973 21
2.6 ImportsandExports
Anumber of small load centres in VietNam’s north are effectively suppliedwithpower imports fromPRC. VietNamalso receives power imports froma recentlycommissionedhydroprojectinLaos(Xekaman3)andVietNam’sgridisconnectedtoCambodiatoprovideexportstothecountry.Asummaryofthecurrentsituationasof2013is:
• Importsofaround3.61TWh3onaveragefromPRCintheNorth;
• Imports fromXeKaman3hydroproject fromLaosPDR in the central region:and
• Exportsofaround1.22TWhonaveragetoCambodia,intheSouth.
2.6.1 ImportsfromPRC
Power imports fromPRC commenced in 2004 via two110KV lines and later two220kV lines. The combinedmaximumcapacityof these interconnections is1,000MW. The annual imported amount is around 3.6 TWh on average but has beengenerally declining from 5.6 TWh in 2010 to 1.8 TWh in 2015 (estimated). Theexisting purchase agreements (for ten year duration) are expected to end after2015. Note that the Chinese grid and Vietnamese grids are not electricallyconnected; loads in the north are switched from being connected to theVietnamesenationalsystemtotheChinesegrid.
AtpresentthefollowingtransmissionlinesimportpowerfromPRCtoVietNam:
• 220kVtransmissionlinefromHaGiang;
• 220kVtransmissionlinefromLaoCai;
• 110kVtransmissionlinefromHaGiang;and
• 110kVtransmissionlinefromMongCai.
2.6.2 ImportsfromLaoPDR
Xe Kaman 3 Hydropower project is located in Laos PDR and is dedicated toexporting power to Viet Nam’s transmission system. The 250 MW project wasmostly financedbytheGovernmentofVietNam. Theprojectstartedcommercialoperation in 2013. It has a power purchase agreement in placewith EVN and isoperatedbyNLDCaccordingtofixedgenerationschedules.
2.6.3 ExportstoCambodia
VietNamexportspowertoCambodiaviaa220kVChauDo–Takeotransmissionline.In2013,VietNamexportedsome1.34TWhtothecountry.
3Reportedtobe2.46TWhin2014.
FINAL
IntelligentEnergySystems IESREF:5973 22
3 DevelopmentOptionsforVietNam’sElectricitySector
3.1 Overview
As with a number of other countries in the region Viet Nam's economy hasexperiencedsignificantgrowthwhichhasbeenaccompaniedbyveryhighratesofelectricitydemandgrowth.Evenwithaslightsofteningintheeconomicoutlookforthe country in the last year, basic analysis shows that electricity demand growthratesinthecountrywillberelativelyhighintotheneartermfuture.Thisismoresothe case given long-term strategic plans by the Government to focus ontransitioning the economy towards onewhere the industrial sector plays a largerrolethanatpresent.Accompanyingeconomicgrowthhasbeenanincreaseinthelivingstandards,whichhastranslatedintoincreasinglevelsofhouseholdelectricityconsumption, particularly in urban areas. These trends have put pressure on theexisting infrastructure including distribution networks, transmission networks andgeneration facilities to ensure a stable and reliable flow of electrical energy isprovidedtoendusers.
Viet Nam is endowed with a diverse set of primary energy resources, includingdomesticcoal,offshorenaturalgasreserves,biomass,biogas,solar,largeandsmall-scale hydro, onshore and offshore wind, geothermal, and marine-basedtechnologiessuchastidalandwave.Whileeachoftheseresourceshasitsownsetof challenges, they provide the basis for developing a range of possibledevelopmentpaths for the country's electricity industry. A summaryof themainresourcedevelopmentoptionsavailabletoVietNamisasfollows:
• Domesticcoal.Therearereservesofligniteandsub-bituminousgradesofcoalwith reserves located mainly around the red river basin around Quang Ninhprovinceinthenortheastofthecountry.Themajorityofthecoal-firedpowerstationsinVietNamexploitthesereserves. Estimatesofreservesizessuggestthatfurtherexploitationispossible,althoughapartfromtheexternalitiessuchasgreenhousegasemissionsand localpollution,thenortheast locationofthereserves is not ideally located given the structure of Viet Nam's transmissionsystem,thefactthatmanycoalplant inthisareaarealready inplaceandthegradeofcoalbeinginthelowerendoftherangeofwhatistypicallypreferredfor coal based generation. Domestic transportation networks (via sea or rail)for domestic coal havebeen contemplated, butwith domestic coal prices fortheelectricitysectorbeing regulated tocome into linewith internationalcoalprices,theeconomicsofsuchinfrastructureinvestmentsagainstinvestmentinfacilitiestoimporthigherqualitycoalatlocationsalongthecoastline,makethisunlikely.
• Imported coal. Viet Nam has a coastline that spans some 3260 km whichprovidesanumberofsitesthatwouldallowforthedevelopmentofcoalimportandstorage facilities to supportcoalprojectsat locations thatareconvenient
FINAL
IntelligentEnergySystems IESREF:5973 23
given the transmission network structure and location of load centres. Anumber of such facilities are already under development and there are plansunder the last power plan to continue to expand and grow these facilities insupportof coal importprojects thatwould likely sourcehighgrade coal fromcoalsuppliersinIndonesiaand/orAustralia.
• Offshore natural gas reserves. VietNam is estimated tohave some617Bcm(21.8 Tcf) of proved reserves, or around 52% of the total proved natural gasreserves of the GMS. Gas reserves have been found in five of the sevenoffshorebasins4: SongHong,PhuKhanh,NamConSon,Cuu LongandMalay-ThoChu.TheNamConSonandCuuLongbasinsareexploitedtosupplygastothe PhuMy complex, Ba Ria, andNhon Trach. Off the south coast, the PM3fieldintheMalay-ThoChubasinisalsoinproductionandsuppliesgastotheCaMaucomplex. FurtherdevelopmentsofVietNam’soffshoregas reserveshasbeencontemplated,withthemostprospectivebeing:
− Furtherdevelopmentofthesouth-westregion.OffshoreBlocksB,52/97,48/95, could support significant natural gas power generation projects inthesouthofVietNam,andinparticular,topupgastotheCaMaucomplexand allow further development of the OMon complex. PetroVietnam iscurrently working with recent joint venture partners Murphy Oil andExxonMobiltodevelopthesefields;and
− North-eastregion.Offshoreoilandgasfieldshavebeenidentifiedoffthenortheastcoastlinewithextensivesurveyingandexplorationstillongoing.Astheinvestmentintheinfrastructuretosupportdevelopmentofthisfieldissignificant,thisisconsideredtobealonger-termoptionfordevelopment.
• LNG.ThemostrecentGasDevelopmentPlanandPowerDevelopmentPlan7(PDP7) to have been approved by the government include plans for an LNGregasificationterminalsitedinthecentralprovinceofBinhThuan(nearHoChiMinhCity)withacapacityof3MTPA.However,thedevelopmentoftheLNGterminalhasbeendelayedanditappearsunlikelythatanLNGimportterminalwouldbeinoperationbefore2020.
• NuclearPower.Aspartofalong-termenergysecuritystrategyVietNamhasbeenenhancingtheirnuclearpowerknowledgeandcapability. VietNamhasinplaceagreementswithRussiaandJapantobuildnuclearpowerprojectsof2400MWand2000MWrespectively5;bothplannedtobeconstructedintheNinh Thuan province. Nuclear power features in Viet Nam’s powerdevelopmentplans,althoughthedatesoffirstgenerationfromnuclearpowerremainsuncertainwithtighteningsafetyrequirementsandunforeseendelaysoccurringinadvancingthedeploymentofthistechnologyinVietNam.
4 “BCC Contract Signed for Billion Gas Pipeline Project,” PetroVietnam, March 11, 2010,http://english.pvn.vn/?portal=news&page=detail&category_id=11&id=3278.5WorldNuclearAssociation,www.world-nuclear.org/info/Country-Profiles/Countries-T-Z/Vietnam,October2015.
FINAL
IntelligentEnergySystems IESREF:5973 24
• LargeHydro.Around38%ofVietNam’selectricityiscurrentlygeneratedbyarangeoflargereservoirsandinsomecasescascadedhydropowerstationsthatare locatedthroughoutthecountry.Thelargestreservoirs,HoaBinhandSonLa,arelocatedinthenorthwestofthecountry,althoughtherearesignificantstorageslocatedinthecentralandsouthregionsaswell. VietNamisabletogainthebenefitsofdiversity inhydrologicalconditionsacrossmanyseparateriversystemswithnotablediversityininflowsacrossnorth,centralandsouthregions.However,VietNamhas largelyexploitedallof the large scalehydroconsideredtobeeconomicallyfeasible;furtherdevelopmentbeyondwhathasbeenexploitedtodateandwhatisunderconstructionnowisnotconsideredanoption.
• Small, mini, and micro hydro. Viet Nam has untapped small scale hydropotential. In recent years, there has been a lot of small hydropowerdevelopmentinVietNamwiththenumberofprojectsgoingfromabout141in2006(167MW)toabout156(622MW)by2009,andsome226projects(1635MW) by 2014. Some 1943MW of capacity is now under construction, andsome236projects (with total capacityof2019MW)under study. However,concerns have been raised on small hydro projects in the country based onconsiderations of the low levels of efficiency achieved from some projectsrelativetotheenvironmentalexternalities.
• Pumped storage hydro. Viet Nam does not presently have any pumpedstorage hydro plant in operation. However, feasibility studies have beencarriedoutandshowthatpumpedstoragepowerplantsmaybefeasiblewiththe south and central regions offering the most favourable geographicalconditions.
• Onshore and offshore wind. Viet Nam is considered to have moderate togood onshore wind energy potential, with the best locations in Viet NamrecordingreasonablewindspeedsthroughouttheyearexceptforthemonthsofApril,MayandSeptember.Mostoftheonshorewindpotentialisalongthecountry’ssouthcentralandcentralcoastalareas,andanumberoflocationsinthe mountainous areas in the central region. The greatest onshore windpotential that has been measured is in Binh Thuan province. A limitedamountofdataisreportedinrelationtooffshorewindpotentialinVietNam,however,itappearsthatVietNamhaspotentialforoffshorewindwithalittleunder half the sites having been tested being rated as ”good” or better foroffshore.
• Solar Energy. Viet Nam is considered to have very high potential for thedevelopment of solar energy resources. A number of studies have beenconductedtoassessthepotential,themostrecentanddetailedofwhichwasastudyentitled:“MapsofSolarResourceandPotentialinVietnam”,publishedinJanuary2015.ThiswasundertakenbytheMOITandaSpanishConsortiumconsisting of Centro de Investigaciones Energeticas Medioambientales yTecnológicas (CIEMOT), National Renewable Energy Centre (CENER) and
FINAL
IntelligentEnergySystems IESREF:5973 25
Instituto para la Diversificación y Ahorro de la Energía (IDAE). This broadlyshowsthatbasedonGHIandDNImeasurementsthereissubstantialpotentialfor solar photovoltaic deployment throughout the country, with the greatestpotential identifiedinthesoutheast,centralhighlands,MekongRiverDelta,allcoastalareasandthenortheast. ThestudyalsoconcludesthatbasedonDNImeasurements, there is substantial potential for concentrated solar power(CSP) based technologies, with the greatest potential in the central regions,highlandsandsoutheastofVietNam.
• Geothermal. Presently there are no geothermal power plants in Viet Nam.However,basedonsurveysandstudiescarriedoutoverthelastfewdecadesongeothermal energy resources, the country is recognised to have a limitedamountof geothermalpotentialwith some300MW to400MWhavingbeenidentifiedtodate.
• Bio Generation (Biomass and biogas). As an agricultural country, VietNamhas significant potential for power generation from biomass and biogassources.Typical forms includewoodenergy,cropwasteandresidues,animalwaste,urbanwasteandotherorganicwaste.SustainableexploitationcapacityofbiomassforenergyproductioninVietNamisestimatedatabout150milliontonsper year6,withoverall powergenerationpotential of around11-15GWfrombiomassand4-5GWfrombiogas.
• PowerImports.VietNamhasbeenactiveinpursuingopportunitiesforpowerimport from neighbouring countries. Since 2004 the country has importedpowerfromPRCandatdifferenttimestherehasbeendiscussionofincreasingpower imports fromPRC,althoughmore recently thisoptionseemsunlikely.VietNamhasbeeninvolvedinthejointdevelopmentofhydroprojectsinLaoPDRwhicharededicatedunder25yearPPAstosupplyingtheiroutputtoVietNam.TherehasbeendiscussionofsimilarprojectsinCambodiawithMOUsinplace for a number of hydro projects, although these are longer-termprospectsandarenotconsideredtobecommitted.
3.2 DomesticandImportedCoalResources
3.2.1 DomesticCoal
VietNamisacountrywithacomparativeadvantageinthecoalsectorwhichcomesfromthecountry’srelativelyabundantcoalreserves.ByJanuary2011,theresultsofinvestigationsindicatedthatVietNamhascoalreservesofaround48.7billiontons,ofwhich,some39.35billiontons,liebeneaththeRedRiverbasininanareaofsize2000 km2. The Northeast of Viet Nam possesses the second largest coal depositwithreservesestimatedtobearound8.83billiontons.TheNortheastisthelargestminingarea inthecountrybecause it iscurrentlynotfeasibletoexploitcoalfrom
6 http://ievn.com.vn/tin-tuc/Tong-quan-ve-hien-trang-va-xu-huong-cua-thi-truong-nang-luong-tai-tao-cua-Viet-Nam-5-999.aspx
FINAL
IntelligentEnergySystems IESREF:5973 26
the Red River basin, as deposits lie some 150-2,500 meters undergroundnecessitating large investmentandmodernminingtechnologies thatarecurrentlynot available in Viet Nam. In addition, the Red River deposit has complicatedhydrogeologicalfeaturesandislocatedinapopulousarea.AssuchcoalproductionismainlycarriedoutintheNortheastofthecountry.
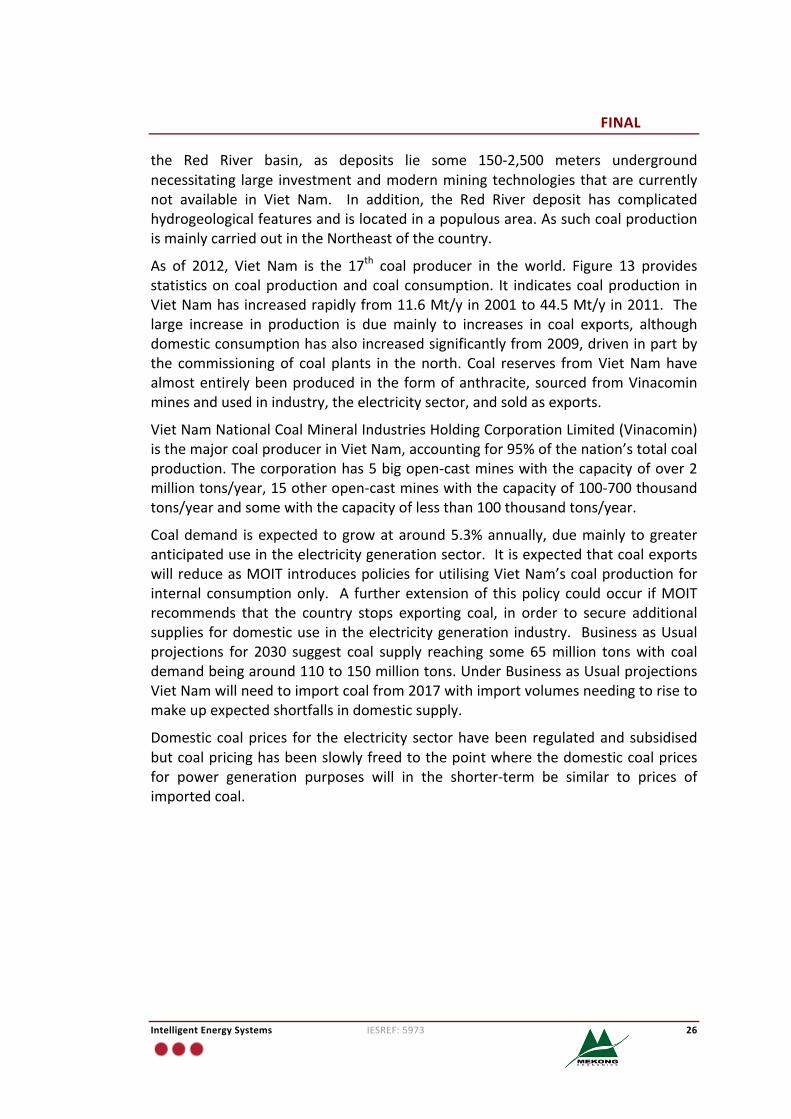
As of 2012, Viet Nam is the 17th coal producer in the world. Figure 13 providesstatisticsoncoalproductionandcoalconsumption. It indicatescoalproduction inVietNamhasincreasedrapidlyfrom11.6Mt/yin2001to44.5Mt/yin2011.Thelarge increase in production is duemainly to increases in coal exports, althoughdomesticconsumptionhasalsoincreasedsignificantlyfrom2009,driveninpartbythe commissioningof coal plants in thenorth. Coal reserves fromVietNamhavealmostentirelybeenproduced inthe formofanthracite,sourcedfromVinacominminesandusedinindustry,theelectricitysector,andsoldasexports.
VietNamNationalCoalMineralIndustriesHoldingCorporationLimited(Vinacomin)isthemajorcoalproducerinVietNam,accountingfor95%ofthenation’stotalcoalproduction.Thecorporationhas5bigopen-castmineswiththecapacityofover2milliontons/year,15otheropen-castmineswiththecapacityof100-700thousandtons/yearandsomewiththecapacityoflessthan100thousandtons/year.
Coaldemand isexpected togrowataround5.3%annually,duemainly togreateranticipateduseintheelectricitygenerationsector.ItisexpectedthatcoalexportswillreduceasMOITintroducespoliciesforutilisingVietNam’scoalproductionforinternal consumptiononly. A furtherextensionof thispolicycouldoccur ifMOITrecommends that the country stops exporting coal, in order to secure additionalsupplies fordomesticuse intheelectricitygeneration industry. BusinessasUsualprojections for 2030 suggest coal supply reaching some 65million tonswith coaldemandbeingaround110to150milliontons.UnderBusinessasUsualprojectionsVietNamwillneedtoimportcoalfrom2017withimportvolumesneedingtorisetomakeupexpectedshortfallsindomesticsupply.
Domesticcoalprices for theelectricitysectorhavebeenregulatedandsubsidisedbutcoalpricinghasbeenslowlyfreedtothepointwherethedomesticcoalpricesfor power generation purposes will in the shorter-term be similar to prices ofimportedcoal.
FINAL
IntelligentEnergySystems IESREF:5973 27
Figure13 VietNamCoalProductionandConsumption(1999-2013)
Source:BPStatistics2014
3.2.2 ImportedCoal
VietNamhasacoastlinethatspanssome3,260kmwhichprovidesanumberofoptionsforthedevelopmentoffacilitiestosupportcoal import. Alargenumberof imported coalpowerprojects areplanned to commenceoperation in thenearfuture.TheseincludeDuyenHai3(1,200MW,tobeoperatedin2016-17),DuyenHai 3 Extension (600 MW, 2017), Vinh Tan 4 (1,200 MW, 2017-18), Long Phu 1(1,200MW,2017-18),SongHau1(1,200MW,2018-19)andQuangTrạch1(1,200MW,2020).Indonesia and Australia are the two most feasible countries for Viet Nam toimport coal due to their close proximity, coal quality, level of coal reserves andstageofdevelopmentintermsoftransportationandcoalhandlingfacilities.PetroViet Nam has recently signed three contracts that provide frameworks for coalimport from Australia and Indonesia, and is reportedly in negotiation for twofurthersupplycontractswithIndonesia.
3.3 NaturalGasResources
3.3.1 GasReserves
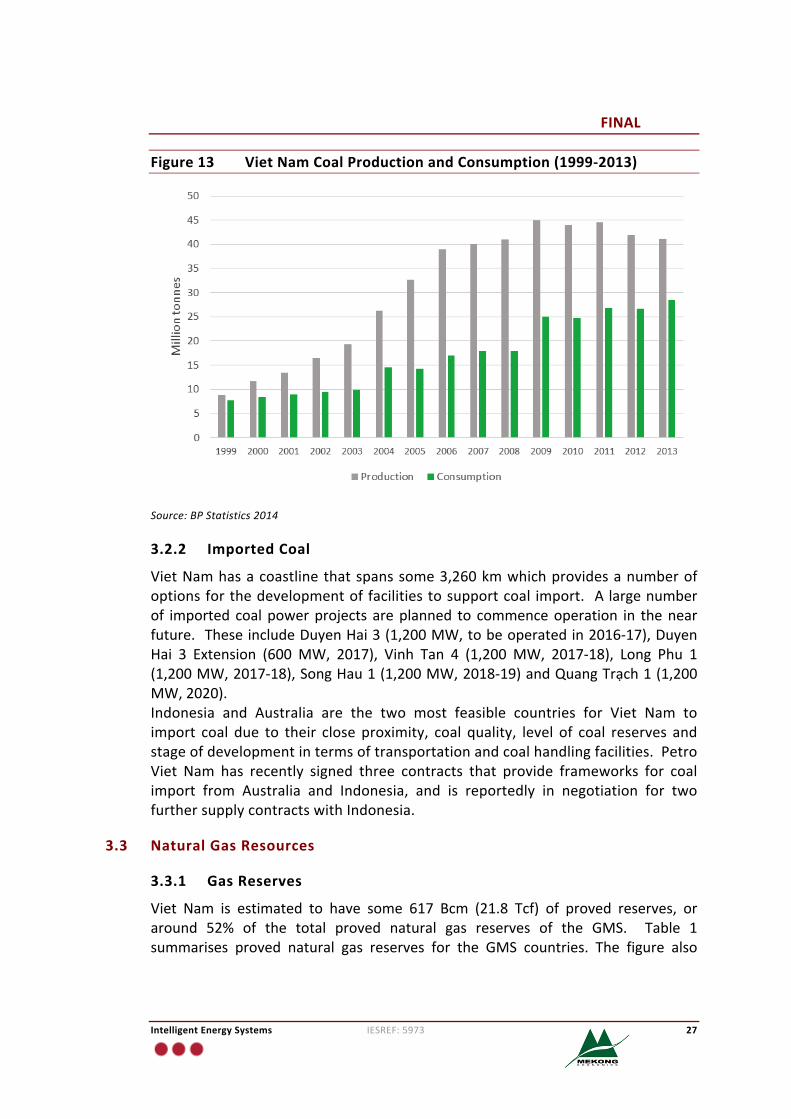
Viet Nam is estimated to have some 617 Bcm (21.8 Tcf) of proved reserves, oraround 52% of the total proved natural gas reserves of the GMS. Table 1summarises proved natural gas reserves for the GMS countries. The figure also
FINAL
IntelligentEnergySystems IESREF:5973 28
shows the reserves to production ratio (RPR)7. For Viet Nam, the number isrelativelyhighbecauseanumberoffieldswithprovenreserveshavenotbeenputintoproduction.ThemostcommerciallyviablereservesarethoselocatedoffVietNam’ssoutherncoastwhicharerelativelyclosetothemostprospectivemarkets8.
Table1 ProvedNaturalGasReservesinGMSCountries
ProvedReserves RPRBcm Tcf Years
Myanmar 283 10 22Thailand 285 10 7VietNam 617 22 63Source:BPStatistics2014
3.3.2 GasInfrastructure
ThekeyinfrastructureinVietNamthatsuppliesgastoonshorefacilitiesincludes:
• Rang Dong-Bach Ho transmission system. This gas transmission systemsupplies natural gas via a 160 kmpipeline from the BachHo field in the CuuLongbasin.Itcommencedoperationin1995totransportgastopowerstationsin Phu My. This pipeline is owned by the Viet Nam Oil and Gas Group(PetroVietnam, or PVN, Viet Nam’s state-owned energy consortium) andoperatedbythesubsidiaryPVGas.In2002,anextensiontotransportgasfromRang Dong (also in the Cuu Long basin) was implemented – this increasedproductionfromaround1.5Bcm/yto2.0Bcm/y.NaturalgasfromtheCuuLongbasinissuppliedtothePhuMyFertiliserPlantandsomeotherindustrialusers;theremainingisusedforEVNgasfiredpowerstationsinthePhuMycomplexincludingPhuMy2.1,PhuMy2.1Extension,PhuMy4andBaRiaPowerPlant.
• PhuMy-NhonTrachonshorepipeline. ThePhuMy-NhonTrachpipelineisan(onshore)pipelinesystemtosupplygastoHiepPhuocandNhonTrachpowerstations and consumers in the Ho ChiMinh City area. It has a capacity of 2Bcm/yandbecameoperationalinAugust2009.
• Nam Con Son Gas Project (NCSGP). The NCSGP is is Viet Nam’s largestintegrated gas-to-power project delivering gas from the offshore natural gasfieldsofLanTayandLanDotothePhyMypowercomplexviaa370kmsubseapipeline.Thepowerstationssuppliedwithgasare:EVNownedplantsPhuMy1,PhuMy2-1,PhuMy2.1Extension,PhuMy4andBaRia;BOTplantsPhuMy2.2andPhuMy3;andPVPowerplantsNhonTrach1andNhonTrach2.The
7TheRPR istheprovedreservesdividedbytheamountofreservesproducedeachyearandthusaroughmeasureof how many years remain until the resource is depleted. Further information:http://en.wikipedia.org/wiki/Reserves-to-production_ratio.8 The Brookings Institution Center for Northeast Asian Policy Studies, “Policy Suggestions for the InitialDevelopmentofVietnam’sGasIndustry”,HaiTienLe,CNAPSVisitingFellow,Vietnam,2010.
FINAL
IntelligentEnergySystems IESREF:5973 29
LanTay/LanDofieldsreportedlyholdsome2Tcfofgasreserveswithoutputfrom the field said to be some 530mmcf/d (193Bcf/y). The project startedoperation in 2003. The project is operated by a consortium comprisingPetroVietnam(51%),BP(32.67%)andConocoPhilips(16.33%).BPoperatedthepipelinefromitsestablishment in2003until2008,when itwastransferredtoPVN. In the future, this pipelinemay be used to transport natural gas fromotherfieldswithintheNamConSonbasinonshore;andtosupplygastousersinPhuMy,DongNai,andHoChiMinhCity.
• PM3-Ca Mau pipeline9 . Commissioned in 2007, the PM3-Ca Mau pipelinesupplies gas from thePM3 /Block46 fields to the1,500MWCaMaupowercomplex.ThepipelinewascompletedunderthePM3CommercialArrangementArea(CAA)atthesoutherntipofVietNamandnationalproductionsurpassedBcmwith the transportation of natural gas fromBlock PM3 CAA and the CaiNuoc field – an offshore area administered jointly with Malaysia. Gas istransported to theCaMau1and2power stations,which consumearound2Bcmperyear.IntheCaMaugasdistributionstation,thereisafuturetie-infortheCaMaufertilizerplantwhichconsumesaround500MMCMofgasperyear,as well as other users in Ca Mau province. The pipeline system is fundedcompletely by PVN; PVGas operates this pipeline system on behalf ofPetroVietnam.
3.3.3 PastProductionandConsumption
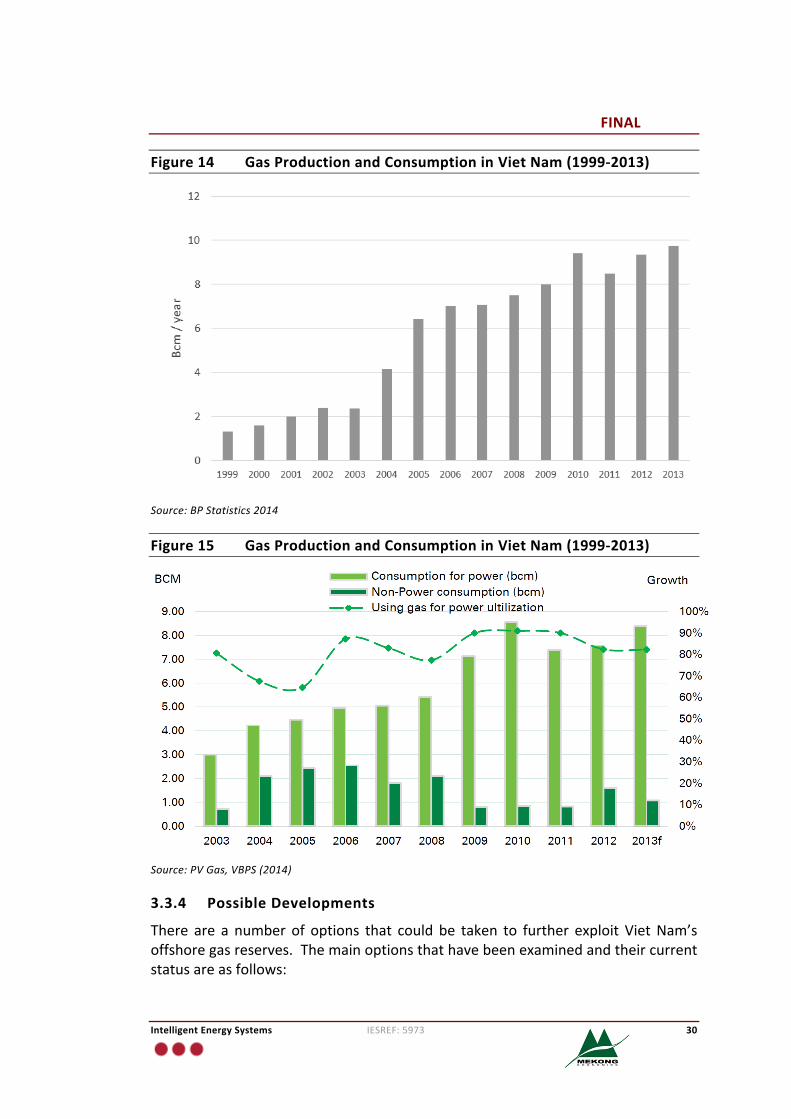
Being a coastal country, Viet Nam has several hundred thousand squarekilometresofcontinentalshelfinwhichseventertiarybasinshavebeenidentified.Gasreserveshavebeenfoundinfiveofthesevenoffshorebasins:SongHong,PhuKhanh,NamConSon,CuuLongandMalay-ThoChu.Figure14showsthetrendingasproductioninVietNam(allgasproducedisconsumedwithinVietNam).Gasproductionisobservedtohaverampedupsince2003andagainin2007coincidingwiththecommissioningoftheNamConSonGasProjectandtheCaMaupipelinedevelopments.
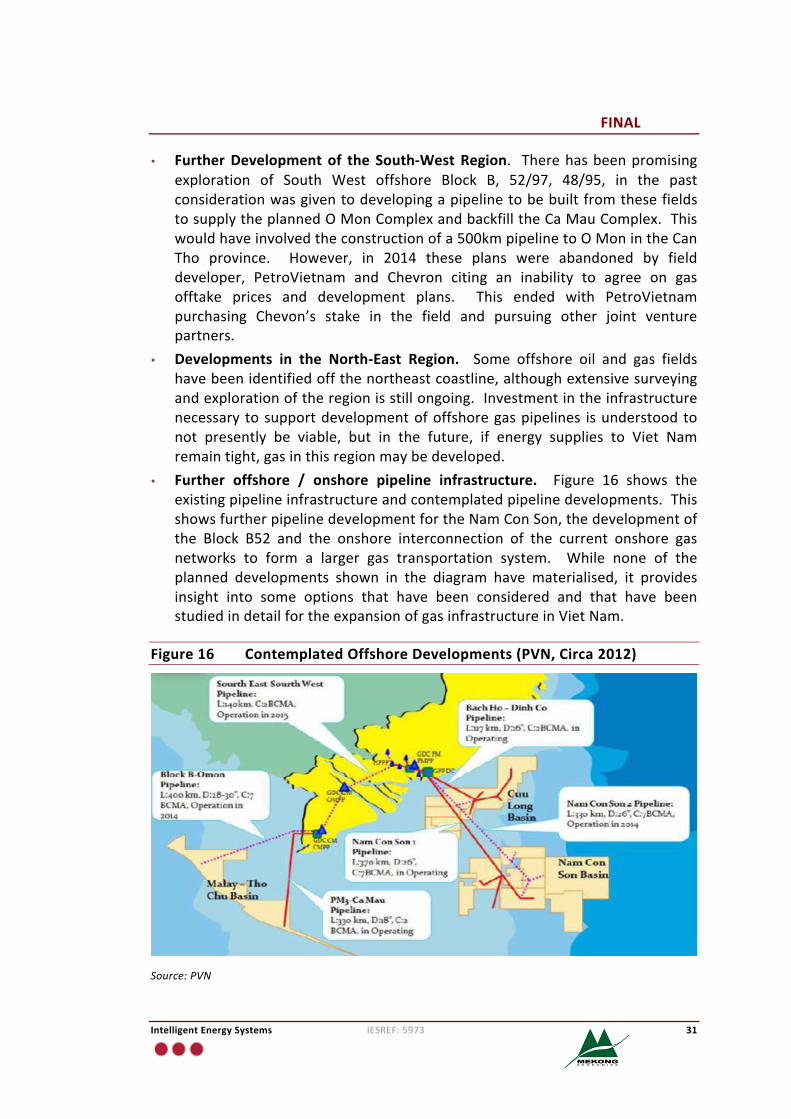
Figure 15 shows the gas consumption trend for the period 1999 to 2013 asreportedbyPVGasin2014.Around85%ofnaturalgasconsumptionisattributableto power generation, 10% for fertilizer production, and the rest provided to lowpressuregasnetworksorasLPGtoindustrialconsumers.Currentgassupplyisonlysatisfying 60% of the demand for gas for VietNam’s power demand, 30% of thedemandforfertilizerfeedstocksand60%ofthedemandforLPG10.
9 The Brookings Institution Center for Northeast Asian Policy Studies, “Policy Suggestions for the InitialDevelopmentofVietnam’sGasIndustry”,HaiTienLe,CNAPSVisitingFellow,Vietnam,2010.10Around half of Vietnam’s LPG demand is satisfied by domestic production, with the remainder imported fromChina,Australia,UnitedArabEmiratesandothers.
FINAL
IntelligentEnergySystems IESREF:5973 30
Figure14 GasProductionandConsumptioninVietNam(1999-2013)
Source:BPStatistics2014
Figure15 GasProductionandConsumptioninVietNam(1999-2013)
Source:PVGas,VBPS(2014)
3.3.4 PossibleDevelopments
There are a number of options that could be taken to further exploit VietNam’soffshoregasreserves.Themainoptionsthathavebeenexaminedandtheircurrentstatusareasfollows:
FINAL
IntelligentEnergySystems IESREF:5973 31
• FurtherDevelopmentof the South-WestRegion. Therehasbeenpromisingexploration of South West offshore Block B, 52/97, 48/95, in the pastconsiderationwasgiventodevelopingapipelinetobebuiltfromthesefieldstosupplytheplannedOMonComplexandbackfilltheCaMauComplex.Thiswouldhaveinvolvedtheconstructionofa500kmpipelinetoOMonintheCanTho province. However, in 2014 these plans were abandoned by fielddeveloper, PetroVietnam and Chevron citing an inability to agree on gasofftake prices and development plans. This ended with PetroVietnampurchasing Chevon’s stake in the field and pursuing other joint venturepartners.
• Developments in the North-East Region. Some offshore oil and gas fieldshavebeenidentifiedoffthenortheastcoastline,althoughextensivesurveyingandexplorationoftheregionisstillongoing.Investmentintheinfrastructurenecessary tosupportdevelopmentofoffshoregaspipelines isunderstoodtonot presently be viable, but in the future, if energy supplies to Viet Namremaintight,gasinthisregionmaybedeveloped.
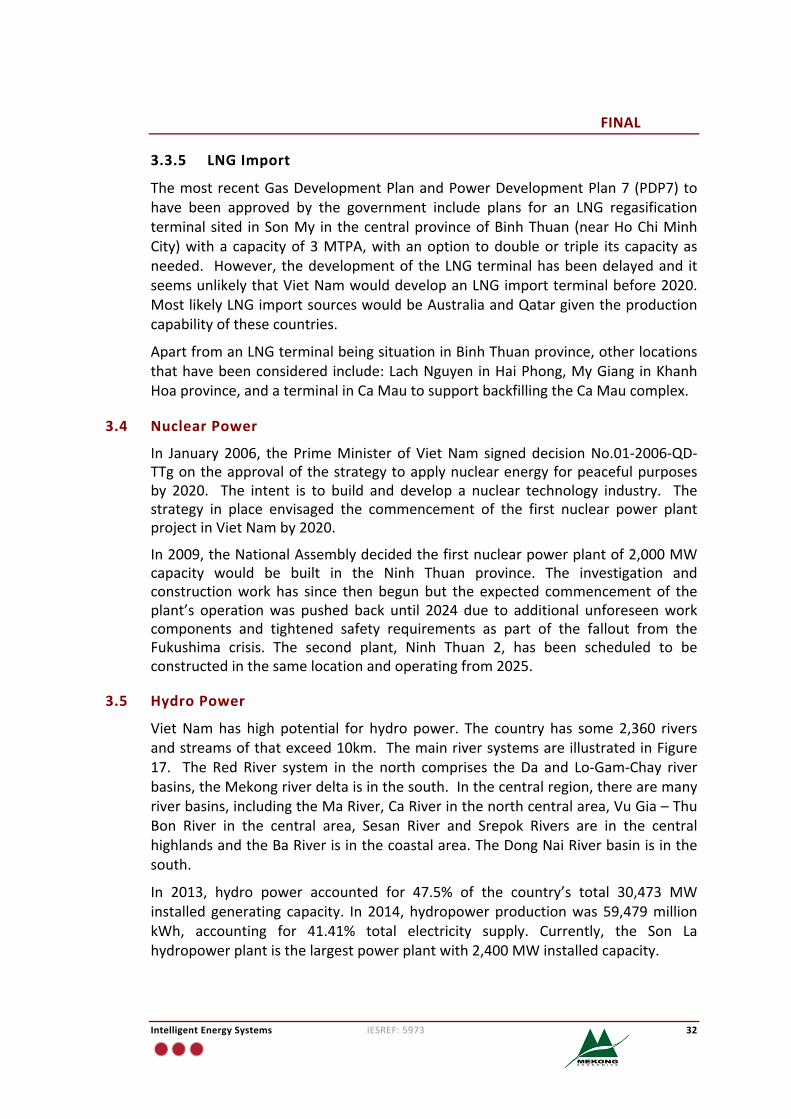
• Further offshore / onshore pipeline infrastructure. Figure 16 shows theexistingpipelineinfrastructureandcontemplatedpipelinedevelopments.ThisshowsfurtherpipelinedevelopmentfortheNamConSon,thedevelopmentofthe Block B52 and the onshore interconnection of the current onshore gasnetworks to form a larger gas transportation system. While none of theplanned developments shown in the diagram have materialised, it providesinsight into some options that have been considered and that have beenstudiedindetailfortheexpansionofgasinfrastructureinVietNam.
Figure16 ContemplatedOffshoreDevelopments(PVN,Circa2012)
Source:PVN
FINAL
IntelligentEnergySystems IESREF:5973 32
3.3.5 LNGImport
ThemostrecentGasDevelopmentPlanandPowerDevelopmentPlan7(PDP7)tohave been approved by the government include plans for an LNG regasificationterminalsited inSonMy inthecentralprovinceofBinhThuan(nearHoChiMinhCity)withacapacityof3MTPA,withanoption todoubleor triple its capacityasneeded. However, thedevelopmentof theLNGterminalhasbeendelayedand itseemsunlikelythatVietNamwoulddevelopanLNGimportterminalbefore2020.MostlikelyLNGimportsourceswouldbeAustraliaandQatargiventheproductioncapabilityofthesecountries.
ApartfromanLNGterminalbeingsituationinBinhThuanprovince,otherlocationsthathavebeenconsideredinclude:LachNguyeninHaiPhong,MyGianginKhanhHoaprovince,andaterminalinCaMautosupportbackfillingtheCaMaucomplex.
3.4 NuclearPower
In January2006, thePrimeMinister ofVietNam signeddecisionNo.01-2006-QD-TTgontheapprovalofthestrategytoapplynuclearenergyforpeacefulpurposesby 2020. The intent is to build and develop a nuclear technology industry. Thestrategy in place envisaged the commencement of the first nuclear power plantprojectinVietNamby2020.
In2009,theNationalAssemblydecidedthefirstnuclearpowerplantof2,000MWcapacity would be built in the Ninh Thuan province. The investigation andconstructionworkhas since thenbegunbut the expected commencementof theplant’s operationwas pushed back until 2024 due to additional unforeseenworkcomponents and tightened safety requirements as part of the fallout from theFukushima crisis. The second plant, Ninh Thuan 2, has been scheduled to beconstructedinthesamelocationandoperatingfrom2025.
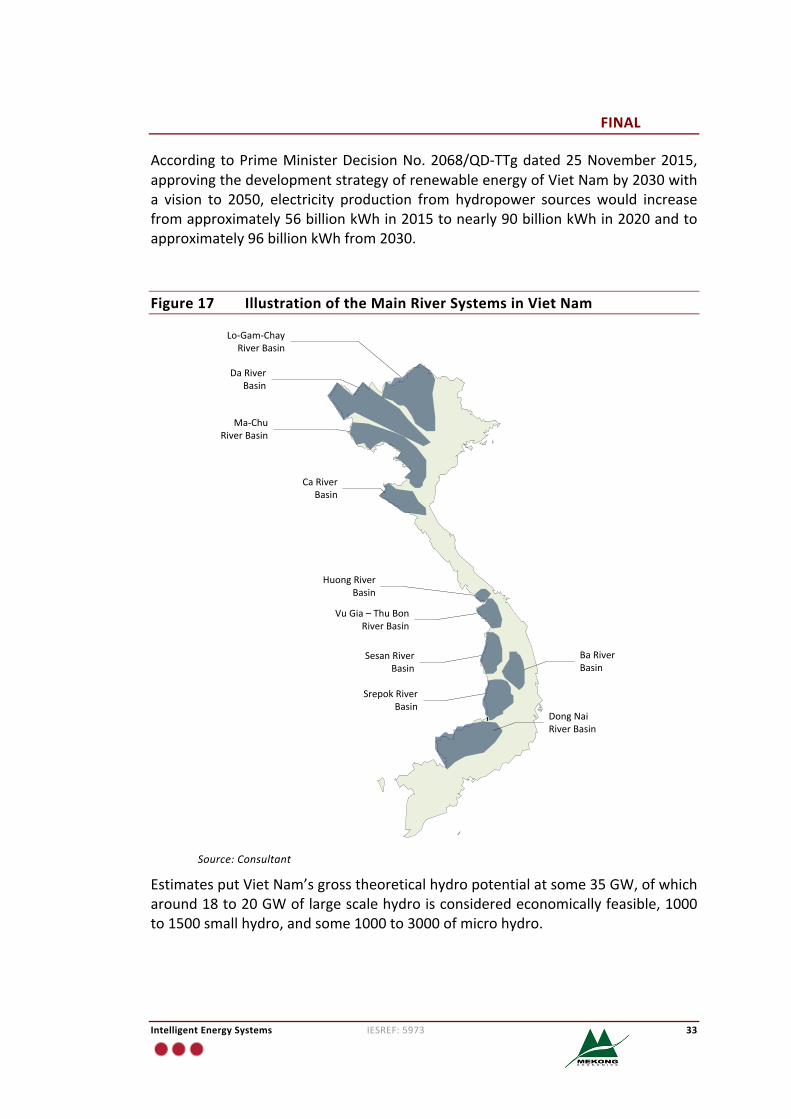
3.5 HydroPower
VietNamhas high potential for hydro power. The country has some2,360 riversandstreamsofthatexceed10km.ThemainriversystemsareillustratedinFigure17. The Red River system in the north comprises theDa and Lo-Gam-Chay riverbasins,theMekongriverdeltaisinthesouth.Inthecentralregion,therearemanyriverbasins,includingtheMaRiver,CaRiverinthenorthcentralarea,VuGia–ThuBon River in the central area, Sesan River and Srepok Rivers are in the centralhighlandsandtheBaRiverisinthecoastalarea.TheDongNaiRiverbasinisinthesouth.
In 2013, hydro power accounted for 47.5% of the country’s total 30,473 MWinstalled generating capacity. In 2014, hydropowerproductionwas59,479millionkWh, accounting for 41.41% total electricity supply. Currently, the Son Lahydropowerplantisthelargestpowerplantwith2,400MWinstalledcapacity.
FINAL
IntelligentEnergySystems IESREF:5973 33
According toPrimeMinisterDecisionNo.2068/QD-TTgdated25November2015,approvingthedevelopmentstrategyofrenewableenergyofVietNamby2030witha vision to 2050, electricity production from hydropower sourceswould increasefromapproximately56billionkWhin2015tonearly90billionkWhin2020andtoapproximately96billionkWhfrom2030.
Figure17 IllustrationoftheMainRiverSystemsinVietNam
Source:Consultant
EstimatesputVietNam’sgrosstheoreticalhydropotentialatsome35GW,ofwhicharound18to20GWoflargescalehydroisconsideredeconomicallyfeasible,1000to1500smallhydro,andsome1000to3000ofmicrohydro.
Lo-Gam-ChayRiverBasin
DaRiverBasin
Ma-ChuRiverBasin
CaRiverBasin
HuongRiverBasin
VuGia–ThuBonRiverBasin
SesanRiverBasin
SrepokRiverBasin
BaRiverBasin
DongNaiRiverBasin
FINAL
IntelligentEnergySystems IESREF:5973 34
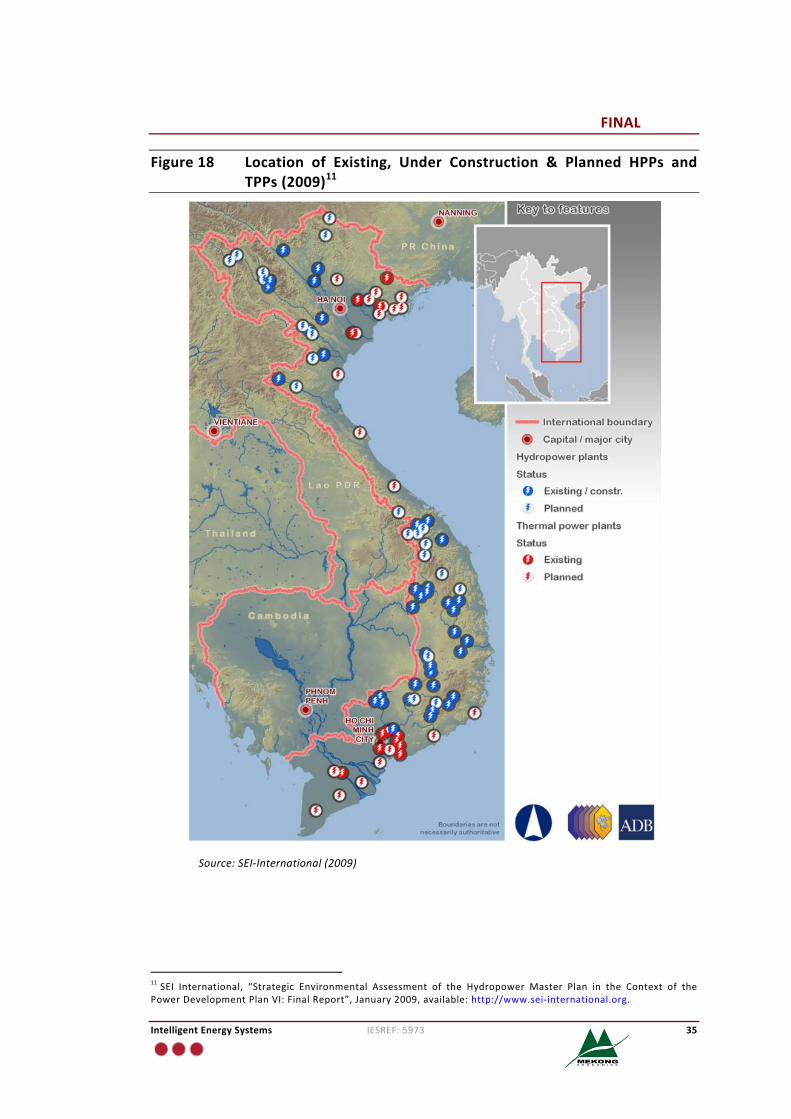
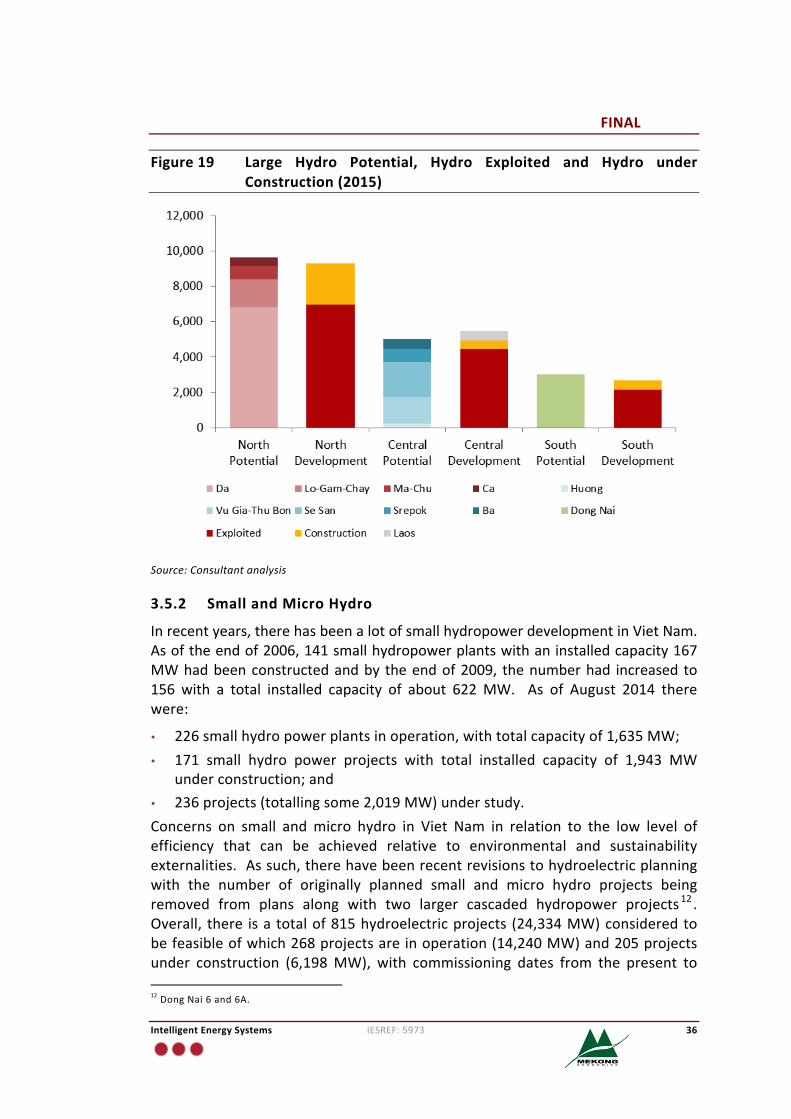
3.5.1 LargeScaleHydro
Mosthydroelectricreserveswithcapacityinexcessof50MWhavebeenexploitedinVietNamorareunderdevelopment.Figure18providesabasicoverviewofthelocation of existing and planned hydro developments in Viet Nam. A chart tocomparethepotentials(forlargescalehydro)comparedwithhydrocapacitythathas been developed or that is under construction is shown in Figure 19. Thisillustrates quite clearly that all large scale hydro potential in Viet Nam isessentially exploited and in the case of the central region there has beenexploitation of hydro power potential in neighbouring Laos. Thus future hydrodevelopmentis likelytobedrivenbytwoforms:(1) importsfromhydroprojectsdevelopedinneighbouringcountries,and(2)smallhydroelectricplantsdevelopedinthemoreremoteregions.
FINAL
IntelligentEnergySystems IESREF:5973 35
Figure18 Location of Existing, Under Construction & Planned HPPs andTPPs(2009)11
Source:SEI-International(2009)
11SEI International, “Strategic Environmental Assessment of the Hydropower Master Plan in the Context of thePowerDevelopmentPlanVI:FinalReport”,January2009,available:http://www.sei-international.org.
FINAL
IntelligentEnergySystems IESREF:5973 36
Figure19 Large Hydro Potential, Hydro Exploited and Hydro underConstruction(2015)
Source:Consultantanalysis
3.5.2 SmallandMicroHydro
Inrecentyears,therehasbeenalotofsmallhydropowerdevelopmentinVietNam.Asoftheendof2006,141smallhydropowerplantswithaninstalledcapacity167MWhadbeenconstructedandby theendof2009, thenumberhad increased to156 with a total installed capacity of about 622MW. As of August 2014 therewere:
• 226smallhydropowerplantsinoperation,withtotalcapacityof1,635MW;• 171 small hydro power projects with total installed capacity of 1,943 MW
underconstruction;and• 236projects(totallingsome2,019MW)understudy.Concerns on small andmicro hydro in Viet Nam in relation to the low level ofefficiency that can be achieved relative to environmental and sustainabilityexternalities.Assuch,therehavebeenrecentrevisionstohydroelectricplanningwith the number of originally planned small and micro hydro projects beingremoved from plans along with two larger cascaded hydropower projects 12 .Overall, there isatotalof815hydroelectricprojects (24,334MW)consideredtobefeasibleofwhich268projectsareinoperation(14,240MW)and205projectsunder construction (6,198MW), with commissioning dates from the present to12DongNai6and6A.
FINAL
IntelligentEnergySystems IESREF:5973 37
2017.
3.5.3 PumpedStorageHydro
VietNamdoesnotpresentlyhaveanypumpedstoragehydroplant inoperation.However,feasibilitystudieshavebeencarriedoutandshowthatpumpedstoragepowerplantsmaybefeasiblewiththesouthandcentralregionsofferingthemostfavourable geographical conditions. Pumped storagehydroplants do feature ingovernmentplansfortheelectricityindustry.TheNationalMasterPlanforpowerdevelopmentforthe2011-2020periodwiththe vision to 2030 has included five pumped storage hydro plants to beconstructed between 2019 and 2030. These projects include Bac Ai 1 (4 x 300MW),DongPhuYen(4x300MW),DonDuong(4x300MW),NinhSon(4x300MW)andaPumpedStorageHydroplantintheNorth(3x300MW).According to the latest Prime Minister’s Decision No. 2068/QD-TTg dated 25November2015,approvingthedevelopmentstrategyofrenewableenergyofVietNamby2030withavisionto2050,pumpstoragehydroinstalledcapacityshouldtarget2,400MWby2030to8,000MWby2050.
3.6 WindPower
Viet Nam is considered to have moderate to good wind energy potential.However, likemany other developing countries, the potential ofwind power inViet Nam has not yet been quantified in detail. In 2011, the World Banksupported theMinistry of Industry and Trade to reconstruct theWindResourceAtlasofVietNam.Basedon this study, theyestimateda totalof10,000MWofonshore wind capacity could be theoretically exploited at surfaces with 80 mheightandwithwindspeedsover6m/s.
However, more recent studies have indicated that onshore wind potential inVietnam is considerably higher,with estimates as high as almost 27 GWMW13.According to the latest Prime Minister’s Decision No. 2068/QD-TTg dated 25November2015,approvingthedevelopmentstrategyofrenewableenergyofVietNamby2030withavisionto2050,totalelectricityproductionfromwindpowerwouldincreasefrom180millionkWhin2015toabout2.5billionkWhin2020(1%share),approximately16billionkWh in2030 (2.7%)andabout53billionkWh in2050(5%).
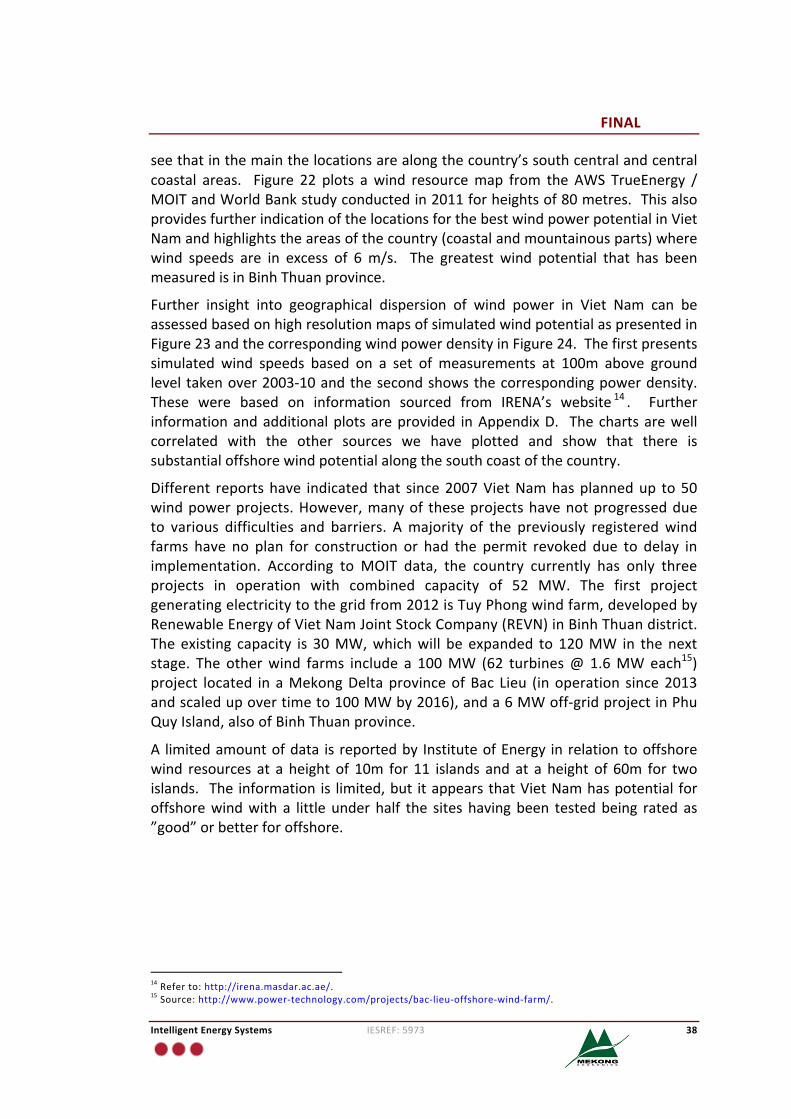
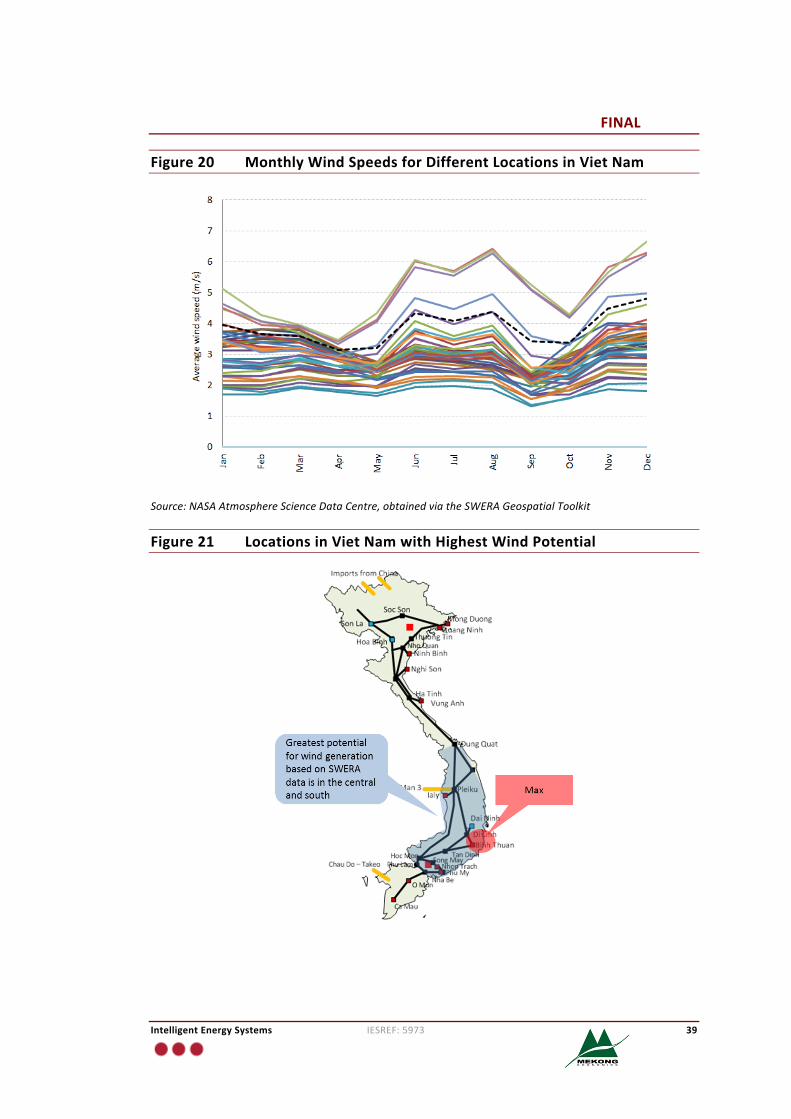
Figure20showsmonthlywindspeedmeasurementsforallregionsinVietNamasreportedbyNASAAtmosphereScienceDataCentreofeachregioninVietNamwiththedashedlinerepresentingtheaveragespeedofthetop7squareprofiles(above5.2m/s).ThisgraphshowsthatmanylocationsinVietNamrecordreasonablewindspeeds throughout the year except for April, May and September. When theselocationsareshadedoverthemapofVietNam,asillustratedinFigure21,wecan
13Forexample:26,673MWissuggestedbyADB(2015)
FINAL
IntelligentEnergySystems IESREF:5973 38
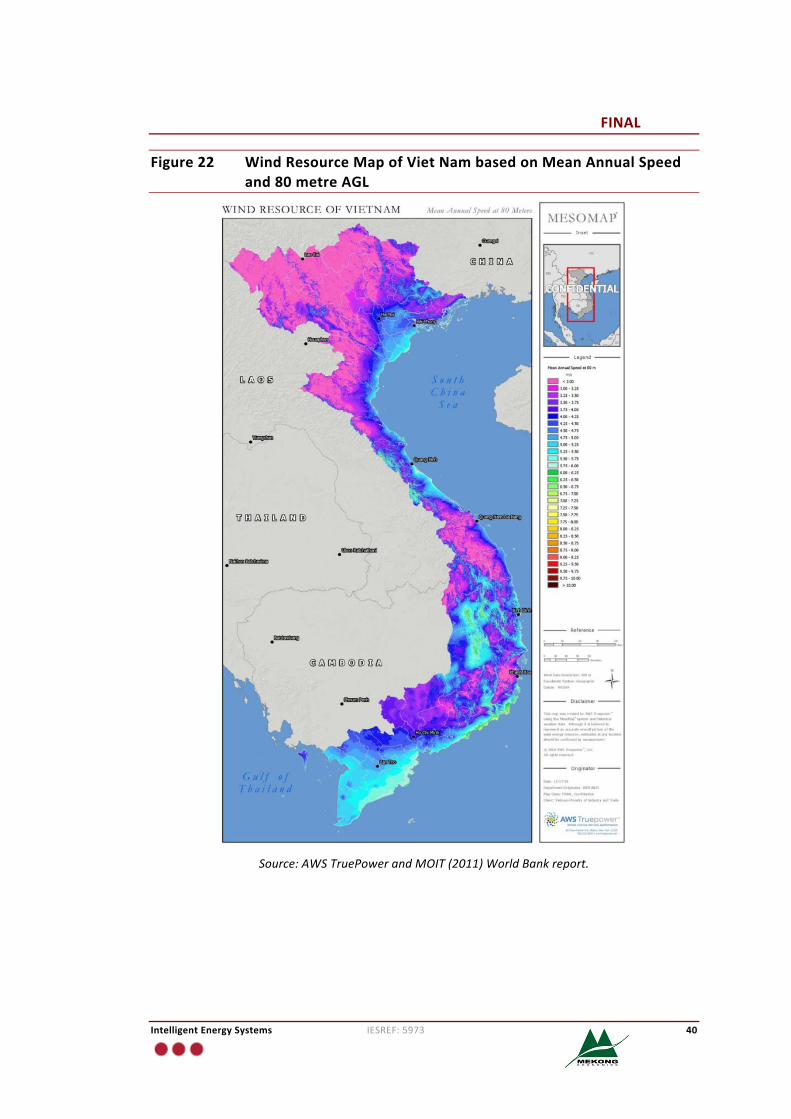
seethatinthemainthelocationsarealongthecountry’ssouthcentralandcentralcoastal areas. Figure 22 plots awind resourcemap from the AWS TrueEnergy /MOITandWorldBankstudyconductedin2011forheightsof80metres.ThisalsoprovidesfurtherindicationofthelocationsforthebestwindpowerpotentialinVietNamandhighlightstheareasofthecountry(coastalandmountainousparts)wherewind speeds are in excess of 6m/s. The greatest wind potential that has beenmeasuredisinBinhThuanprovince.
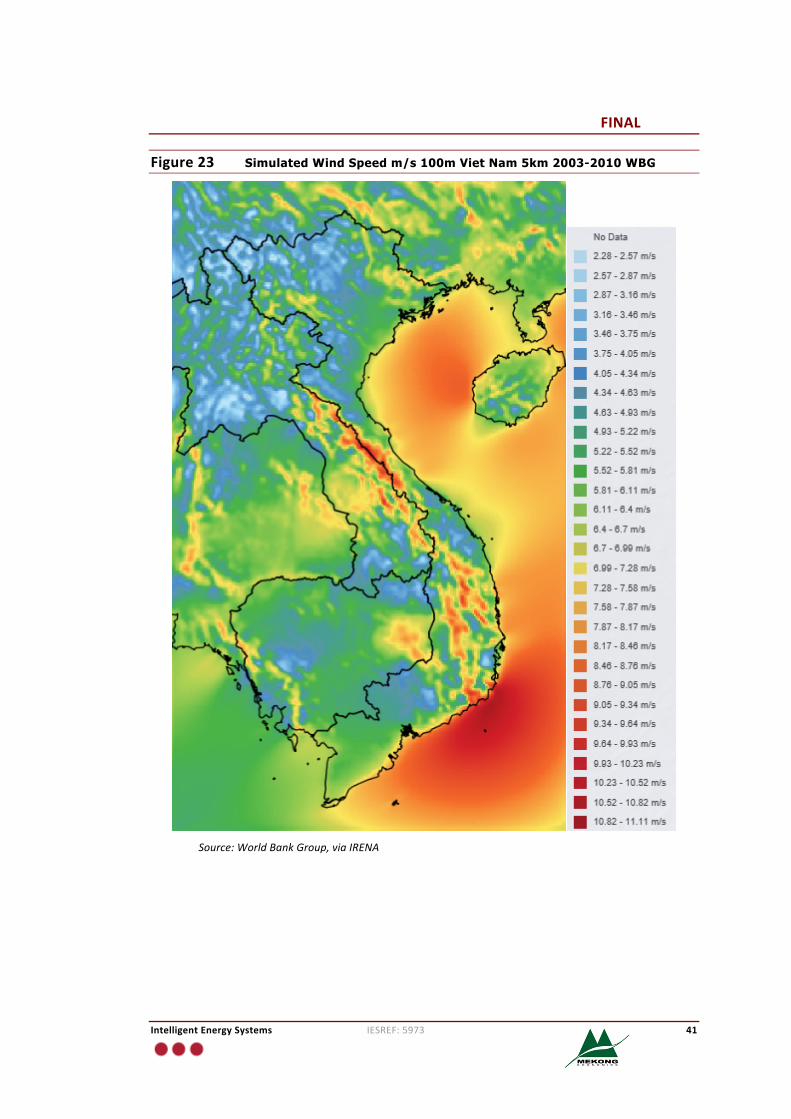
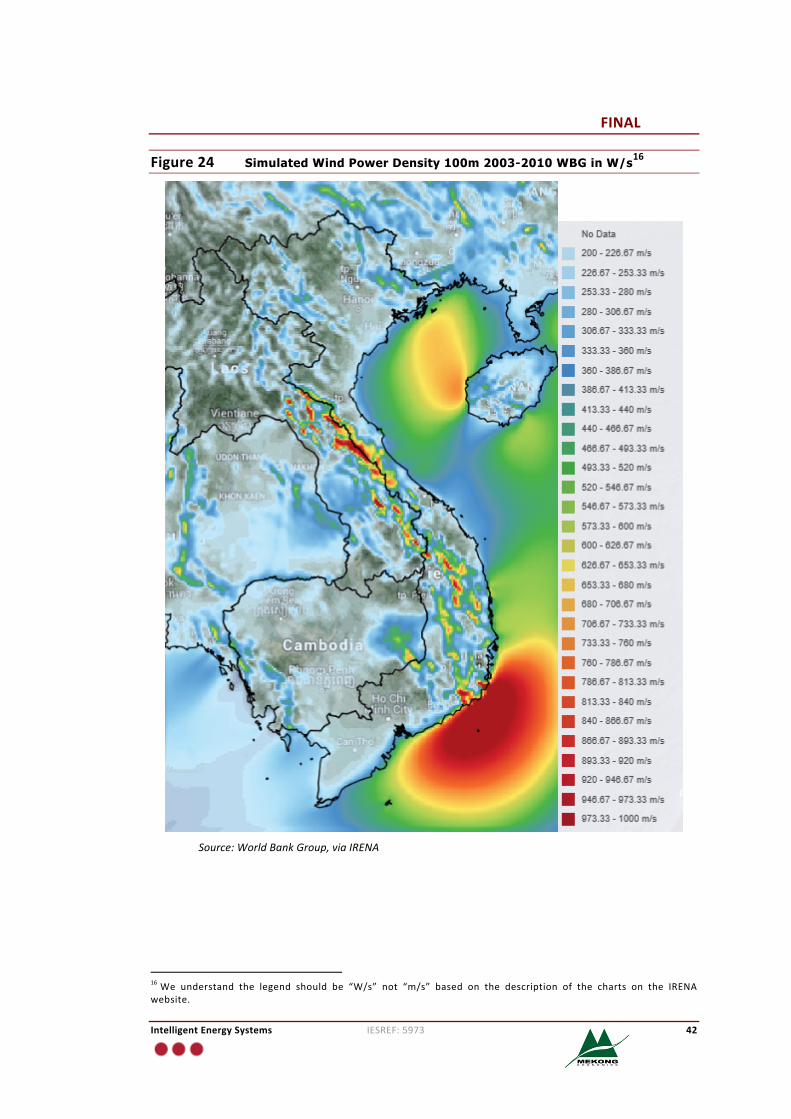
Further insight into geographical dispersion of wind power in Viet Nam can beassessedbasedonhighresolutionmapsofsimulatedwindpotentialaspresentedinFigure23andthecorrespondingwindpowerdensityinFigure24.Thefirstpresentssimulated wind speeds based on a set of measurements at 100m above groundlevel takenover2003-10andthesecondshowsthecorrespondingpowerdensity.These were based on information sourced from IRENA’s website 14 . Furtherinformationandadditionalplotsareprovided inAppendixD. Thechartsarewellcorrelated with the other sources we have plotted and show that there issubstantialoffshorewindpotentialalongthesouthcoastofthecountry.
Different reportshave indicated that since2007VietNamhasplannedup to50windpowerprojects.However,manyof theseprojectshavenotprogresseddueto various difficulties and barriers. Amajority of the previously registeredwindfarms have no plan for construction or had the permit revoked due to delay inimplementation. According to MOIT data, the country currently has only threeprojects in operation with combined capacity of 52 MW. The first projectgeneratingelectricitytothegridfrom2012isTuyPhongwindfarm,developedbyRenewableEnergyofVietNamJointStockCompany(REVN)inBinhThuandistrict.Theexisting capacity is 30MW,whichwill beexpanded to120MW in thenextstage. The otherwind farms include a 100MW (62 [email protected])project located inaMekongDeltaprovinceofBac Lieu (inoperation since2013andscaledupovertimeto100MWby2016),anda6MWoff-gridprojectinPhuQuyIsland,alsoofBinhThuanprovince.
A limitedamountofdata is reportedby InstituteofEnergy inrelationtooffshorewind resources at a height of 10m for 11 islands and at a height of 60m for twoislands. The information is limited,but itappearsthatVietNamhaspotential foroffshorewindwith a little underhalf the siteshavingbeen testedbeing rated as”good”orbetterforoffshore.
14Referto:http://irena.masdar.ac.ae/.15Source:http://www.power-technology.com/projects/bac-lieu-offshore-wind-farm/.
FINAL
IntelligentEnergySystems IESREF:5973 39
Figure20 MonthlyWindSpeedsforDifferentLocationsinVietNam
Source:NASAAtmosphereScienceDataCentre,obtainedviatheSWERAGeospatialToolkit
Figure21 LocationsinVietNamwithHighestWindPotential
FINAL
IntelligentEnergySystems IESREF:5973 40
Figure22 WindResourceMapofVietNambasedonMeanAnnualSpeedand80metreAGL
Source:AWSTruePowerandMOIT(2011)WorldBankreport.
FINAL
IntelligentEnergySystems IESREF:5973 41
Figure23 Simulated Wind Speed m/s 100m Viet Nam 5km 2003-2010 WBG
Source:WorldBankGroup,viaIRENA
FINAL
IntelligentEnergySystems IESREF:5973 42
Figure24 Simulated Wind Power Density 100m 2003-2010 WBG in W/s16
Source:WorldBankGroup,viaIRENA
16We understand the legend should be “W/s” not “m/s” based on the description of the charts on the IRENAwebsite.
FINAL
IntelligentEnergySystems IESREF:5973 43
3.7 SolarPower
Viet Nam is considered to have high potential for the development of solarenergy.Thecountryhas13weatherstationstomeasureradiation,andover170weatherstationsdistributedovermostof theprovinces tomeasure thenumberofhoursofsunshine.Thenumberofhoursofsunshinerangesfrom1,300to2,900hoursperyear,dependingonthestationtendsto increasegradually fromnorthto south. The total installed capacity of solar PV in Viet Nam until 2014 wasapproximately4MWp.
According to the latest Prime Minister’s Decision No. 2068/QD-TTg dated 25November2015,approvingthedevelopmentstrategyofrenewableenergyofVietNamby2030withavisionto2050,totalelectricityproductionfromsolarpowerwould increase from 10 million kWh in 2015 to 1.4 billion kWh in 2020 (0.5%share), about 35.4 billion kWh in 2030 (6%) and about 210 billion kWh in 2050(20%).
A number of studies have been conducted on assessing the potential, themostrecentanddetailedofwhichwasa studyentitled: “Mapsof SolarResourceandPotential in Viet Nam”, published in January 2015. This was undertaken by theMOIT and a Spanish Consortium consisting of Centro de InvestigacionesEnergeticas Medioambientales y Tecnológicas (CIEMAT), National RenewableEnergyCentre(CENER)andInstitutoparalaDiversificaciónyAhorrodelaEnergía(IDAE).
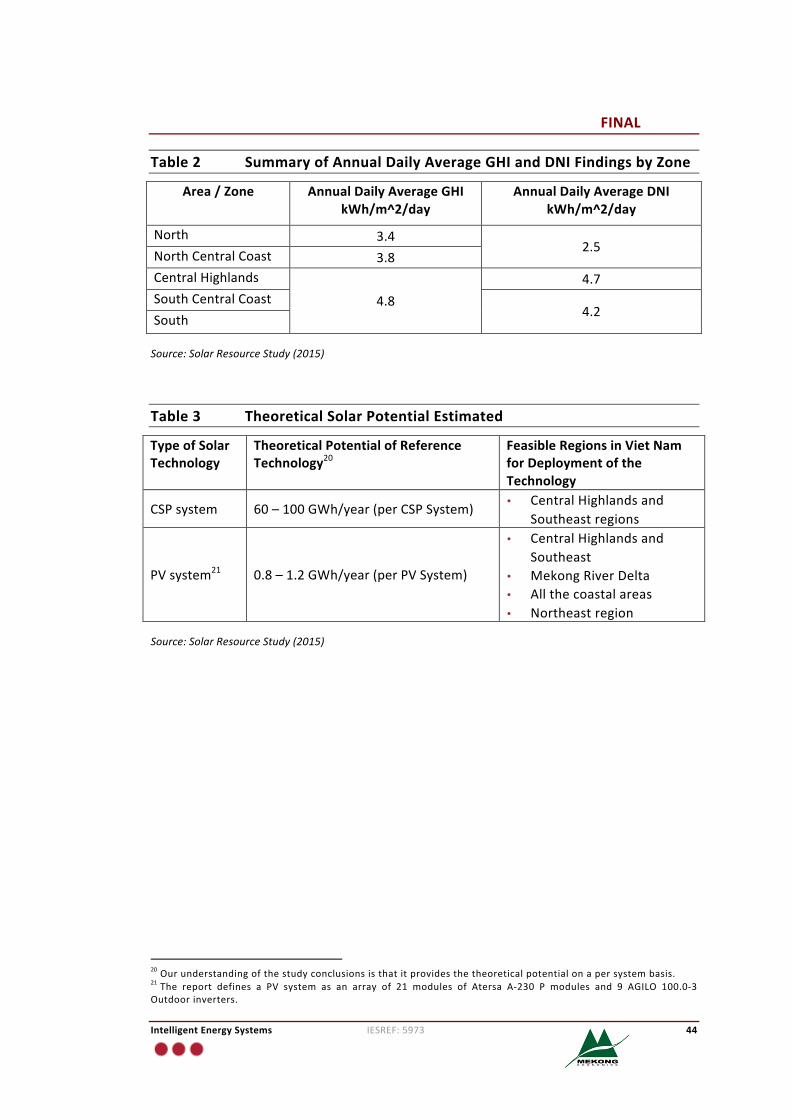
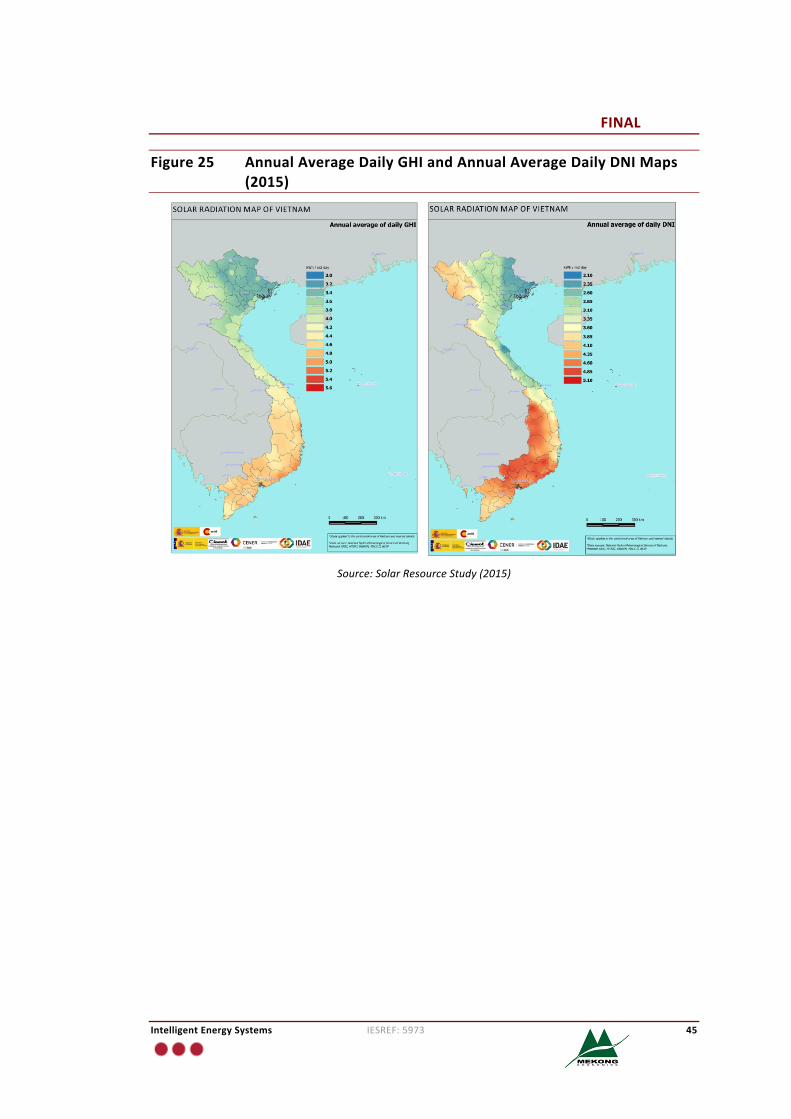
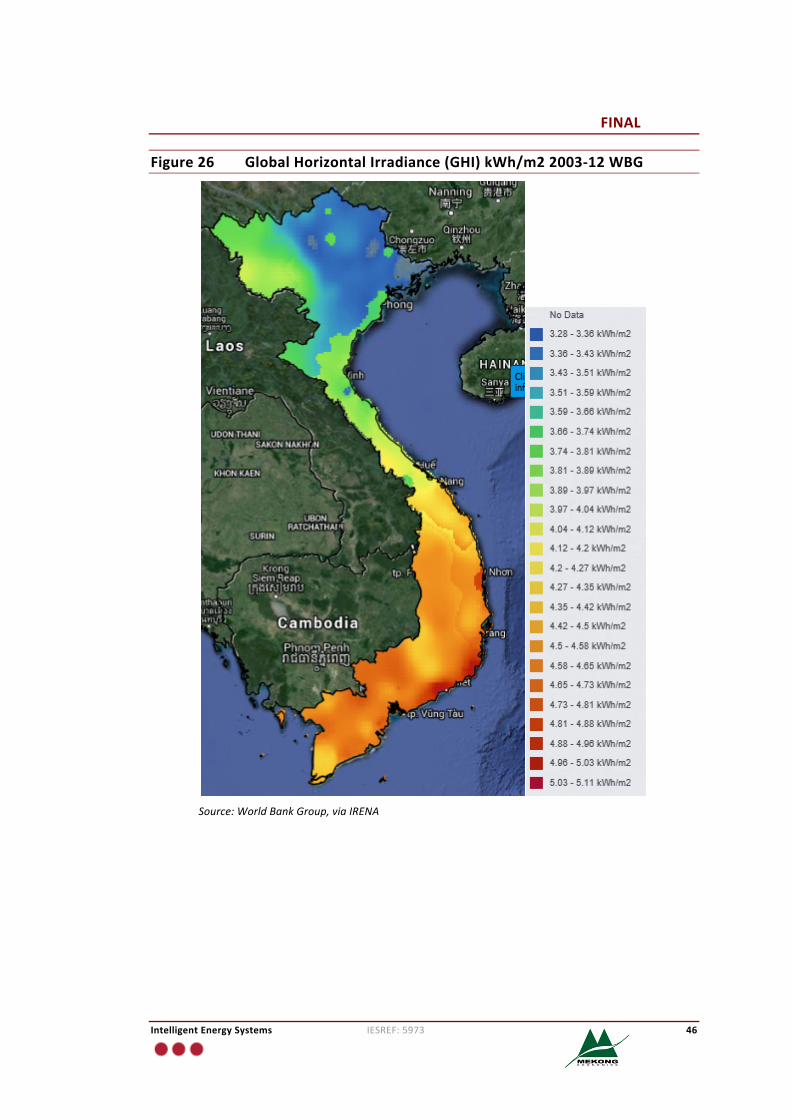
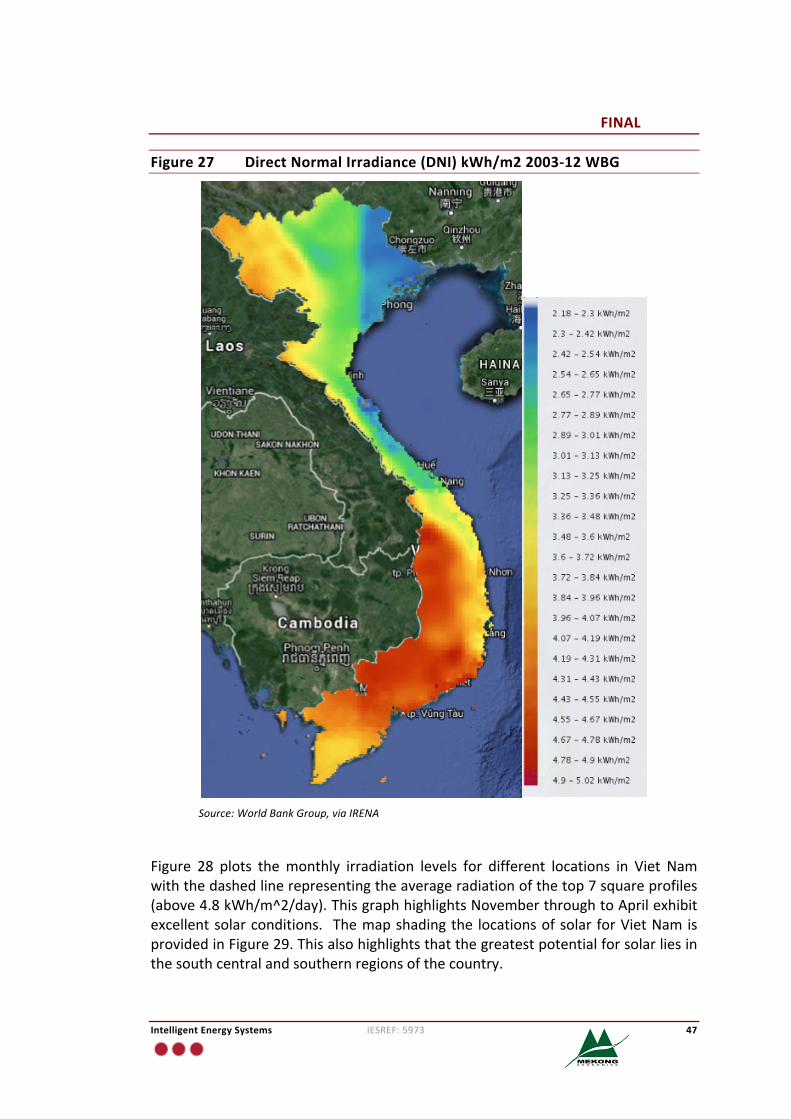
Figure25,Figure26andFigure27showsolarresourcemapsofannualaverageofdailyGlobalHorizontal Insolation (GHI)17andDirectNormal Insolation (DNI)18; thefirst illustrates the solar irradiation map for 2015 data, while the latter arerespectivelyGHIandDNImapsfor thebasedonannualdata for theperiod2003-1219. Table 2 summarises the findings of the Spanish Consortium’s study inrelationtothedailyaverageGlobalHorizontalInsolation(GHI)andDirectNormalInsolation (DNI) findings by zone. GHI provides an indication for flat-panelphotovoltaic (PV) potential while DNI provides the potential for concentratedsolarpower(CSP).ThetheoreticalpotentialforCSPandPVsystemsisprovidedinthestudyandtheareaswhereitcouldbedeployedaresetoutinTable3.
17GHIissolarradiationmeasuredwithaninstrumentmountedhorizontallysothatitseesthewholesky(effectivelyitisthedirectinsolationplusanydiffuseradiationthatoccursfromthescatteringoflight).18DNI is solar radiation solar radiation that comes directly from the sun,withminimal attenuation by the Earth’satmosphereorobstacles.19Maps were plotted using IRENA’s freeware tool here: http://irena.masdar.ac.ae/ and they are based onWorldBankGroup(WBG)data.
FINAL
IntelligentEnergySystems IESREF:5973 44
Table2 SummaryofAnnualDailyAverageGHIandDNIFindingsbyZone
Area/Zone AnnualDailyAverageGHIkWh/m^2/day
AnnualDailyAverageDNIkWh/m^2/day
North 3.42.5
NorthCentralCoast 3.8CentralHighlands
4.84.7
SouthCentralCoast4.2South
Source:SolarResourceStudy(2015)
Table3 TheoreticalSolarPotentialEstimated
TypeofSolarTechnology
TheoreticalPotentialofReferenceTechnology20
FeasibleRegionsinVietNamforDeploymentoftheTechnology
CSPsystem 60–100GWh/year(perCSPSystem) • CentralHighlandsandSoutheastregions
PVsystem21 0.8–1.2GWh/year(perPVSystem)
• CentralHighlandsandSoutheast
• MekongRiverDelta• Allthecoastalareas• Northeastregion
Source:SolarResourceStudy(2015)
20Ourunderstandingofthestudyconclusionsisthatitprovidesthetheoreticalpotentialonapersystembasis.21The report defines a PV system as an array of 21 modules of Atersa A-230 P modules and 9 AGILO 100.0-3Outdoorinverters.
FINAL
IntelligentEnergySystems IESREF:5973 45
Figure25 AnnualAverageDailyGHIandAnnualAverageDailyDNIMaps(2015)
Source:SolarResourceStudy(2015)
FINAL
IntelligentEnergySystems IESREF:5973 46
Figure26 GlobalHorizontalIrradiance(GHI)kWh/m22003-12WBG
Source:WorldBankGroup,viaIRENA
FINAL
IntelligentEnergySystems IESREF:5973 47
Figure27 DirectNormalIrradiance(DNI)kWh/m22003-12WBG
Source:WorldBankGroup,viaIRENA
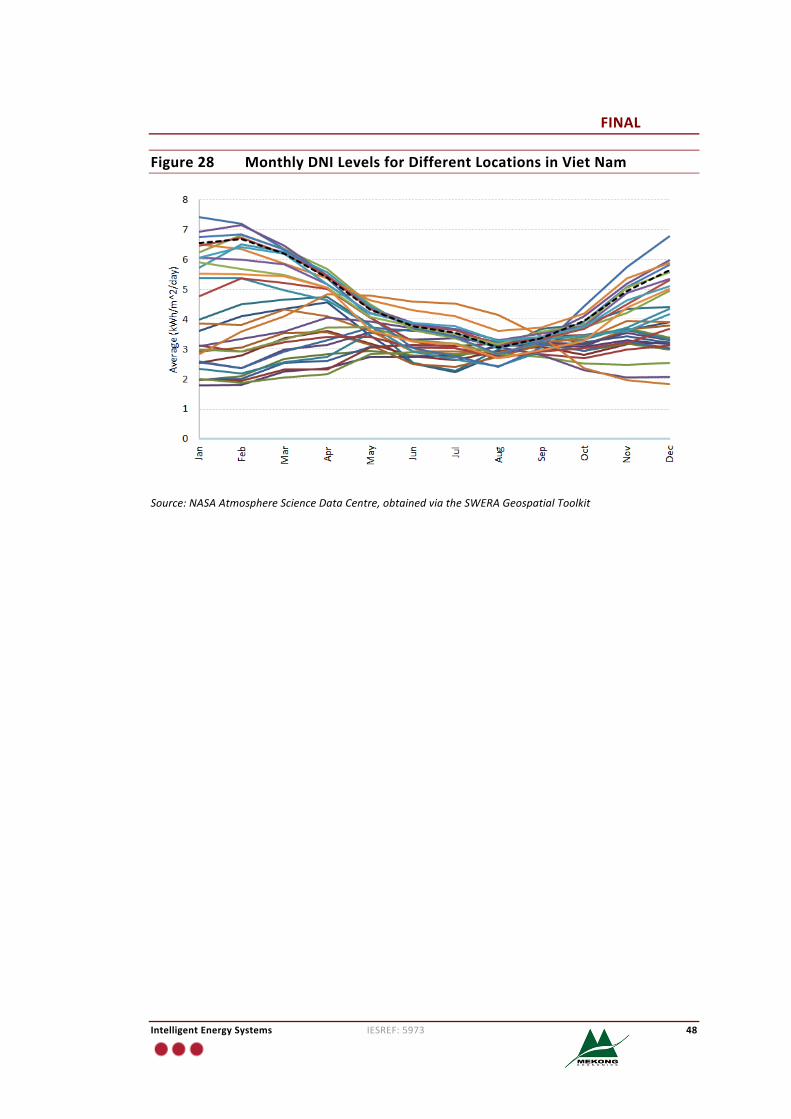
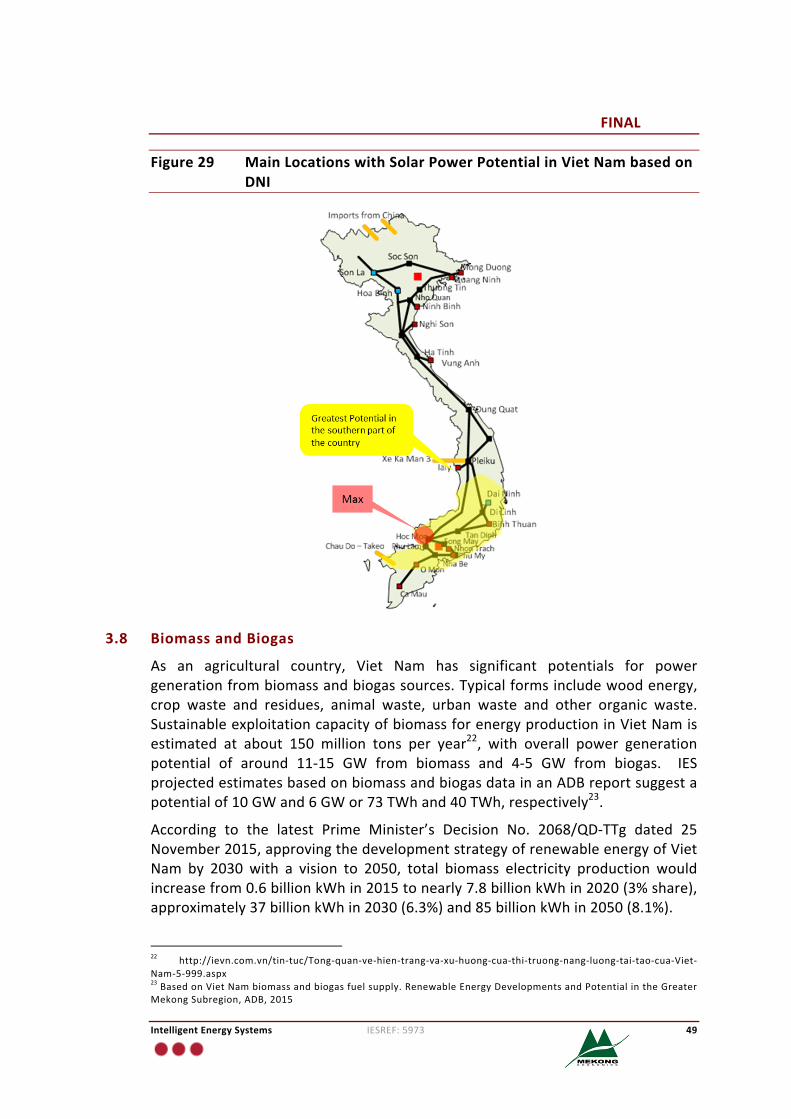
Figure 28 plots themonthly irradiation levels for different locations in Viet Namwiththedashedlinerepresentingtheaverageradiationofthetop7squareprofiles(above4.8kWh/m^2/day).ThisgraphhighlightsNovemberthroughtoAprilexhibitexcellentsolarconditions. Themapshadingthe locationsofsolar forVietNamisprovidedinFigure29.Thisalsohighlightsthatthegreatestpotentialforsolarliesinthesouthcentralandsouthernregionsofthecountry.
FINAL
IntelligentEnergySystems IESREF:5973 48
Figure28 MonthlyDNILevelsforDifferentLocationsinVietNam
Source:NASAAtmosphereScienceDataCentre,obtainedviatheSWERAGeospatialToolkit
FINAL
IntelligentEnergySystems IESREF:5973 49
Figure29 MainLocationswithSolarPowerPotentialinVietNambasedonDNI
3.8 BiomassandBiogas
As an agricultural country, Viet Nam has significant potentials for powergenerationfrombiomassandbiogassources.Typicalformsincludewoodenergy,crop waste and residues, animal waste, urban waste and other organic waste.SustainableexploitationcapacityofbiomassforenergyproductioninVietNamisestimated at about 150 million tons per year22, with overall power generationpotential of around 11-15 GW from biomass and 4-5 GW from biogas. IESprojectedestimatesbasedonbiomassandbiogasdatainanADBreportsuggestapotentialof10GWand6GWor73TWhand40TWh,respectively23.
According to the latest Prime Minister’s Decision No. 2068/QD-TTg dated 25November2015,approvingthedevelopmentstrategyofrenewableenergyofVietNam by 2030 with a vision to 2050, total biomass electricity production wouldincreasefrom0.6billionkWhin2015tonearly7.8billionkWhin2020(3%share),approximately37billionkWhin2030(6.3%)and85billionkWhin2050(8.1%).
22 http://ievn.com.vn/tin-tuc/Tong-quan-ve-hien-trang-va-xu-huong-cua-thi-truong-nang-luong-tai-tao-cua-Viet-Nam-5-999.aspx23BasedonVietNambiomassandbiogasfuelsupply.RenewableEnergyDevelopmentsandPotentialintheGreaterMekongSubregion,ADB,2015
FINAL
IntelligentEnergySystems IESREF:5973 50
Bagassehasbeenused forcombinedheatandpower (CHP)production inabout40 sugar mills in Viet Nam for a long time. By 2009, the total installed powercapacityofallCHPsystemswasaround150MW.In2007,sugarmillsinVietNamhave processed 9.4 million tons of sugar cane producing 2.8 million tons ofbagasse(495kTOE).However,only70-80%ofthisamount(i.e.2.1milliontonsor370kTOE)wasusedforheatandpowergeneration.Thisamountofbagassecouldgeneratemorethan300GWhofelectricityperyear.
Biogas energy was introduced into Viet Nam in the early 1960s. Many biogasdigester models were developed and widely disseminated by various localresearch and development institutions. At present, more than 200,000 biogasplants have been constructed in Viet Nam. Most operating biogas plants arefamily-sized with a digester capacity of 5 m3 to 20 m3. Biogas produced fromthese biogas plants is mainly used as fuel for cooking and lighting in thehouseholds.Thetotalbiogasproductionfromtheoperatingbiogasplantscouldbeestimatedat120millionm3,whichcontributedabout2.1millionGJ(50kTOE)tothetotalenergybalanceofVietNam.
To provide support for investors, the Vietnamese Government has recentlyestablishedthelevelsoffeedintariffsforbiomasspowergenerationprojectsandprojectssolidwaste.Theestablishedpricesforthebuyerare5.8UScents/kWhfor biomass sources, 10.05 US cents / kWh for generation sources on directly-burntsolidand7.28UScents/kWhforprojectsusingcombustiongascollectedfromthesolidwastelandfill.
3.9 GeothermalEnergy
Presently therearenogeothermalpowerplants inVietNam.However,basedonsurveys and studies carried out over the last few decades on geothermal energyresources, the country is recognised to have a limited amount of geothermalpotential.Estimatessuggestthereisthepotentialforbetween300MWto400MWwiththefollowingareas/regionsbeingidentifiedastheprimecandidates:• A 1993 study “Study and Assessment of Geothermal Potential from Quang
Nam – Da Nang to Ba Ria – Vung Tau” (Institute of Geology andMinerals),identified6potentialsites:(i)Bang,(ii)TuBong,(iii)HoiVan,(iv)DanhThanh,(v)MoDuc,and(vi)NghiaThang;
• A study in 1996, “Assessment of Geothermal Potential in Northern CentralRegion” (also carriedoutby the InstituteofGeology), refined someof thesefindings;
• ORMAT in coordination with EVN undertook a pre-feasibility study and it isunderstoodthatthefindingsleadtothemapplyinginApril2012foralicensetobuild5geothermalenergyplants inLeThuy (QuangBinh),MoDuc,NghiaThang(QuangNgai),HoiVan(BinhDinh)andTuiBong(KhanhHoa)withtotalcapacityofthegeneratorsintherangefrom150to200MW;
FINAL
IntelligentEnergySystems IESREF:5973 51
• VietNamGeothermal Energy Corp is also reportedlyworkingwithOrmat asthemajortechnicalpartnerfortwoprojects inMoDucandTuNghiadistrict,QuangNgaiprovincewithadesignedcapacityeachbeing18.7MW;and
• In 2013, Quang Tri Province granted investment certificate and constructionpermit for a geothermal energy plantwith a capacity of 25MWat Dakrongand according to press, the project’s price tag has been stated as US$46.3million.
3.10 OceanEnergy
VietNam’s3,200kmcoastlineandthousandsofislandspresentsignificantpotentialforwaveandtidal-basedenergytechnologies. Thecountryisestimatedtohaveatidal energy potential of around 1,753 GWh per year andwave energy potentialbetween40–411kW/mlocatedaroundBinhThuanandcentralVietNam24. Thegovernmenthas includedoceanenergyaspartof itsVietNamMarineStrategyto202025.
3.11 RenewableEnergyPotentialandDiversity
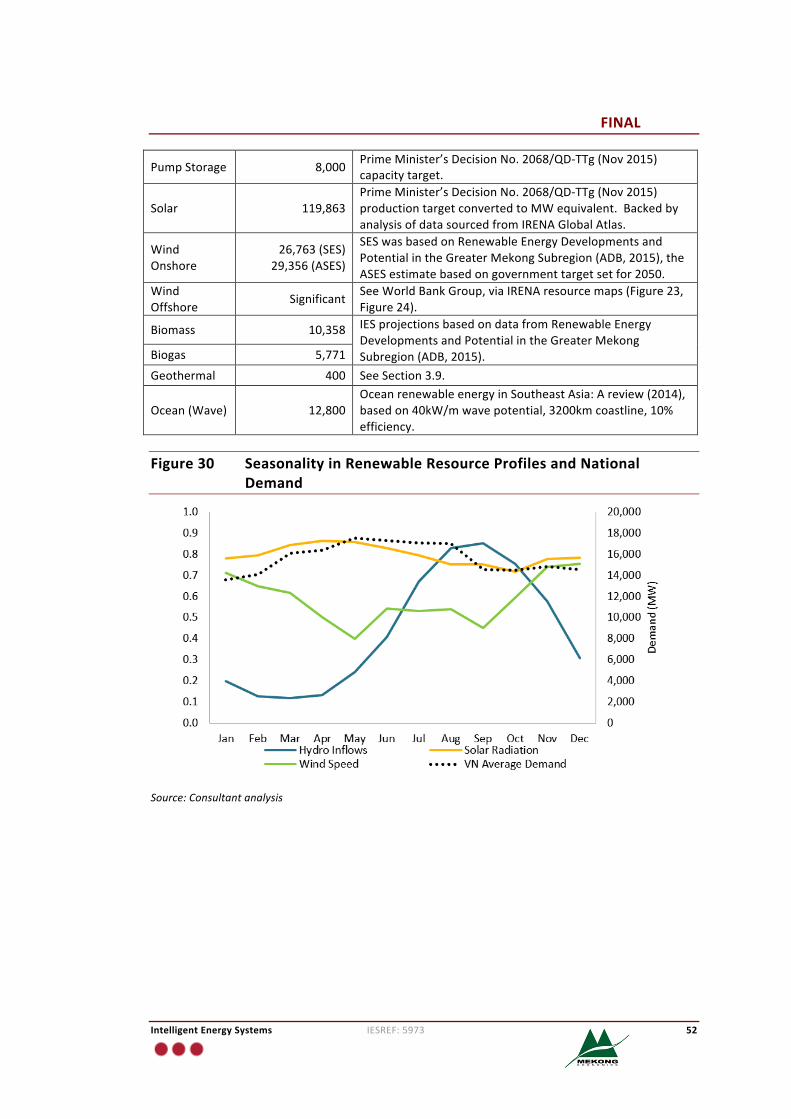
In summary, the renewableenergypotential forVietNam isprovided inTable4.Thenumberspresentedherehavebeendrawnfrommultiplesourcesandinformedby analysis of IRENAGlobal Atlas data. Figure 30 shows on amonthly basis thenormalised hydro inflows, solar radiation and wind speeds respectively for thenorth,centralandsouthregions.Thisallowsseasonalvariationintheavailabilityofsolar,wind,hydroanditscoincidencewithaveragemonthlydemandprofilestobeobservedatthenationallevel.Itshouldbenotedthatthekeyissueinthechartsiscorrelation but not amplitude, and furthermore, that the hydro inflows fall intoreservoirs,somewithsignificantamountofstorage,whichenablessmoothingoutgeneration throughout the year (within the limits of the storage capacity of thereservoirs), thus there is some scope for the role / operation of hydro powerstations tochange inVietNamtoaccommodatehigh levelsof renewableenergy.These charts show that there is some natural seasonal / monthly diversificationbetween resources: wind speeds tend to be high as the wet season ends, solarradiation tends to reach a peak as wind speeds become lower. They not onlyhighlightseasonaldiversificationamongthesolar,hydroandwindtechnologies;inVietNamthereisalsodiversificationbetweenthemainregions.
Table4 Summary of Estimated Renewable Energy Potential (CompiledfromVariousSourcesandAnalysis)
VietNam Potential(MW) Sourceandcomments
Hydro(Large) Morethan30,000 IESanalysis,seeFigure19.
Hydro(Small) 24,334 IESanalysis,seeSection3.5.2.
24OceanrenewableenergyinSoutheastAsia:Areview(Quirapas,Lin,Abundo,Brahim,Santos,2014)25Referto:http://english.vietnamnet.vn/fms/special-reports/144832/vietnam-and-the-marine-strategy.html
FINAL
IntelligentEnergySystems IESREF:5973 52
PumpStorage 8,000 PrimeMinister’sDecisionNo.2068/QD-TTg(Nov2015)capacitytarget.
Solar 119,863PrimeMinister’sDecisionNo.2068/QD-TTg(Nov2015)productiontargetconvertedtoMWequivalent.BackedbyanalysisofdatasourcedfromIRENAGlobalAtlas.
WindOnshore
26,763(SES)29,356(ASES)
SESwasbasedonRenewableEnergyDevelopmentsandPotentialintheGreaterMekongSubregion(ADB,2015),theASESestimatebasedongovernmenttargetsetfor2050.
WindOffshore
Significant SeeWorldBankGroup,viaIRENAresourcemaps(Figure23,Figure24).
Biomass 10,358 IESprojectionsbasedondatafromRenewableEnergyDevelopmentsandPotentialintheGreaterMekongSubregion(ADB,2015).Biogas 5,771
Geothermal 400 SeeSection3.9.
Ocean(Wave) 12,800OceanrenewableenergyinSoutheastAsia:Areview(2014),basedon40kW/mwavepotential,3200kmcoastline,10%efficiency.
Figure30 SeasonalityinRenewableResourceProfilesandNationalDemand
Source:Consultantanalysis
FINAL
IntelligentEnergySystems IESREF:5973 53
4 VietNamDevelopmentScenariosInthissection,wedefinethethreescenariosforVietNam’selectricitysectorthatwe havemodelled: the Business as Usual (BAU), Sustainable Energy Sector (SES),and Advanced SES (ASES) scenarios. We also set out the assumptionsmade fortechnologycostsand fuelpricesbeforeprovidingthedetails foranumberofVietNam specific assumptions– inparticular: our assumedeconomicoutlook forVietNam,alistofgenerationprojectsthatweconsidercommitted26andcommentsonthe status of power import projects. Further assumptions for each scenario areprovidedinsections5,6and7.
4.1 Scenarios
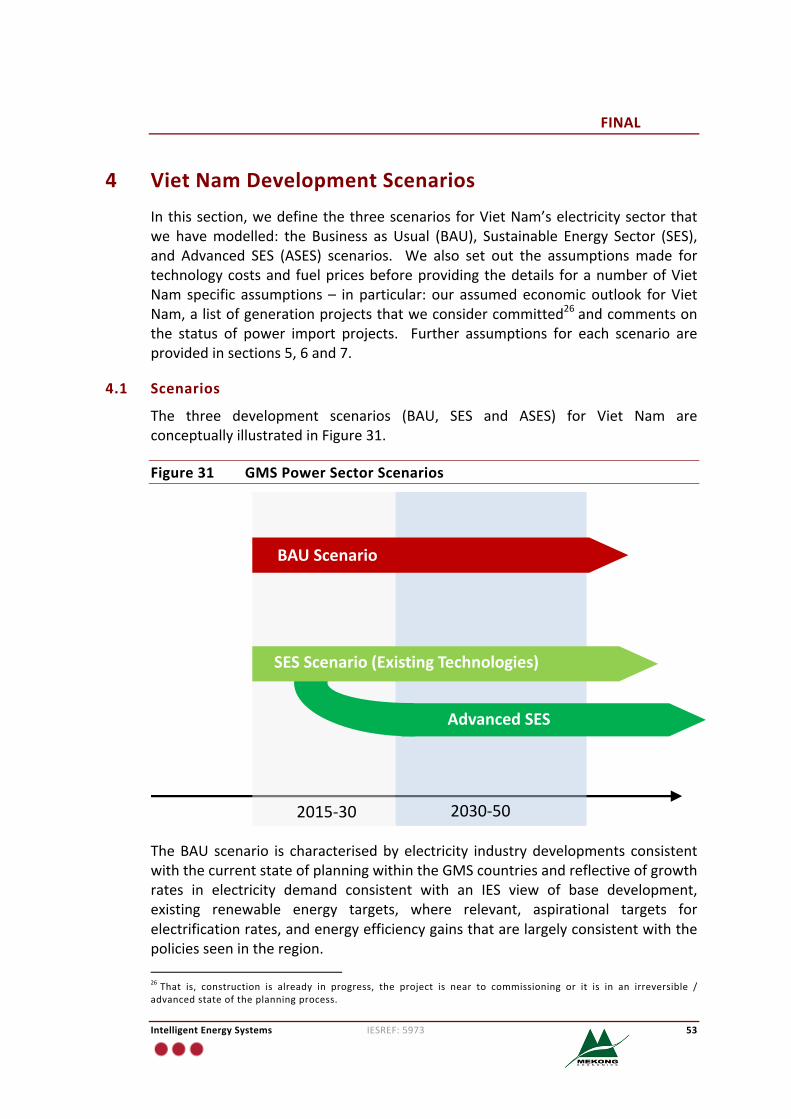
The three development scenarios (BAU, SES and ASES) for Viet Nam areconceptuallyillustratedinFigure31.
Figure31 GMSPowerSectorScenarios
TheBAU scenario is characterisedbyelectricity industrydevelopments consistentwiththecurrentstateofplanningwithintheGMScountriesandreflectiveofgrowthrates in electricity demand consistent with an IES view of base development,existing renewable energy targets, where relevant, aspirational targets forelectrificationrates,andenergyefficiencygainsthatarelargelyconsistentwiththepoliciesseenintheregion.26That is, construction is already in progress, the project is near to commissioning or it is in an irreversible /advancedstateoftheplanningprocess.
2015-30 2030-50
AdvancedSES
BAUScenario
SESScenario(ExistingTechnologies)
FINAL
IntelligentEnergySystems IESREF:5973 54
Incontrast,theSESseekstotransitionelectricitydemandtowardsthebestpracticebenchmarksofotherdevelopedcountries in termsofenergyefficiency,maximisetherenewableenergydevelopment,ceasethedevelopmentoffossilfuelresources,and make sustainable and prudent use of undeveloped conventional hydroresources.Whererelevant,itleveragesadvancesinoff-gridtechnologiestoprovideaccesstoelectricity toremotecommunities. TheSEStakesadvantageofexisting,technicallyprovenandcommerciallyviablerenewableenergytechnologies.
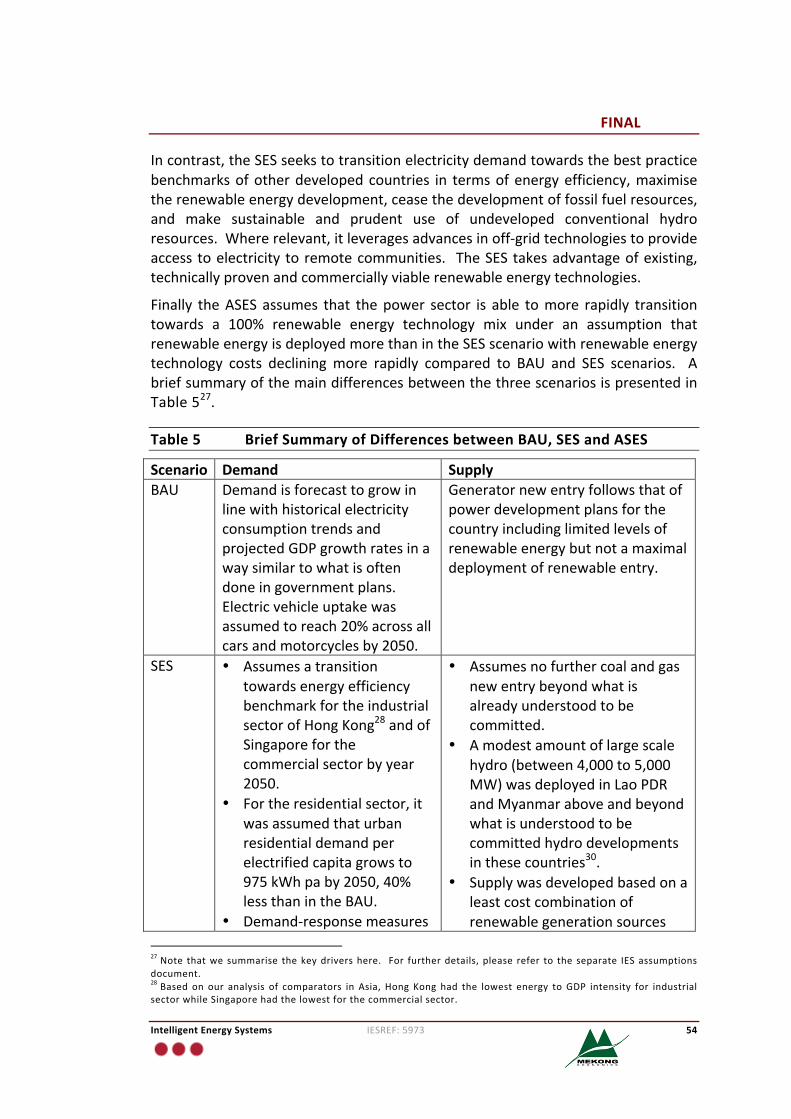
Finally theASES assumes that thepower sector is able tomore rapidly transitiontowards a 100% renewable energy technology mix under an assumption thatrenewableenergyisdeployedmorethanintheSESscenariowithrenewableenergytechnology costs decliningmore rapidly compared to BAU and SES scenarios. AbriefsummaryofthemaindifferencesbetweenthethreescenariosispresentedinTable527.
Table5 BriefSummaryofDifferencesbetweenBAU,SESandASES
Scenario Demand SupplyBAU Demandisforecasttogrowin
linewithhistoricalelectricityconsumptiontrendsandprojectedGDPgrowthratesinawaysimilartowhatisoftendoneingovernmentplans.Electricvehicleuptakewasassumedtoreach20%acrossallcarsandmotorcyclesby2050.
Generatornewentryfollowsthatofpowerdevelopmentplansforthecountryincludinglimitedlevelsofrenewableenergybutnotamaximaldeploymentofrenewableentry.
SES • AssumesatransitiontowardsenergyefficiencybenchmarkfortheindustrialsectorofHongKong28andofSingaporeforthecommercialsectorbyyear2050.
• Fortheresidentialsector,itwasassumedthaturbanresidentialdemandperelectrifiedcapitagrowsto975kWhpaby2050,40%lessthanintheBAU.
• Demand-responsemeasures
• Assumesnofurthercoalandgasnewentrybeyondwhatisalreadyunderstoodtobecommitted.
• Amodestamountoflargescalehydro(between4,000to5,000MW)wasdeployedinLaoPDRandMyanmaraboveandbeyondwhatisunderstoodtobecommittedhydrodevelopmentsinthesecountries30.
• Supplywasdevelopedbasedonaleastcostcombinationofrenewablegenerationsources
27Note thatwe summarise thekeydrivershere. For furtherdetails,please refer to the separate IESassumptionsdocument.28Based on our analysis of comparators in Asia, Hong Kong had the lowest energy to GDP intensity for industrialsectorwhileSingaporehadthelowestforthecommercialsector.
FINAL
IntelligentEnergySystems IESREF:5973 55
Scenario Demand Supplyassumedtobephasedinfrom2021withsome15%ofdemandbeingflexible29by2050.
• SlowerelectrificationratesforthenationalgridsinCambodiaandMyanmarcomparedtotheBAU,butdeploymentofoff-gridsolutionsthatachievesimilarlevelsofelectricityaccess.
• Mini-grids(off-gridnetworks)areassumedtoconnecttothenationalsysteminthelonger-term.
• ElectricvehicleuptakeaspertheBAU.
limitedbyestimatesofpotentialratesofdeploymentandjudgmentsinonwhentechnologieswouldbefeasibleforimplementationtodeliverapowersystemwiththesamelevelofreliabilityastheBAU.
• Technologiesusedinclude:solarphotovoltaics,biomass,biogasandmunicipalwasteplants,CSPwithstorage,onshoreandoffshorewind,utilityscalebatteries,geothermalandoceanenergy.
• TransmissionlimitsbetweenregionswereupgradedasrequiredtosupportpowersectordevelopmentintheGMSasanintegratedwhole,andthetransmissionplanallowedtobedifferentcomparedtothetransmissionplanoftheBAU.
ASES TheASESdemandassumptionsaredoneasasensitivitytotheSES:• Anadditional10%energyefficiencyappliedtotheSESdemands(excludingtransport).
• Flexibledemandassumedtoreach25%by2050.
• Uptakeofelectricvehiclesdoubledby2050.
ASESsupplyassumptionswerealsoimplementedasasensitivitytotheSES,withthefollowingmaindifferences:• AllowratesofrenewableenergydeploymenttobemorerapidcomparedtotheBAUandSES.
• Technologycostreductionswereacceleratedforrenewableenergytechnologies.
• Implementamorerapidprogrammeofretirementsforfossilfuelbasedpowerstations.
• Energypolicytargetsof70%renewablegenerationby2030,90%by2040and100%by2050acrosstheregionareinplace.
30ThisisimportanttoallcountriesbecausetheGMSismodelledasaninterconnectedregion.29Flexible demand is demand that can be rescheduled at short notice andwould be implemented by a variety ofsmartgridanddemandresponsetechnologies.
FINAL
IntelligentEnergySystems IESREF:5973 56
Scenario Demand Supply• Assumethattechnical/operationalissueswithpowersystemoperationandcontrolforaveryhighlevelofrenewableenergyareaddressed31.
4.2 TechnologyCostAssumptions
Technology capital cost estimates from a variety of sources were collected andnormalised tobeona consistentanduniformbasis32. Mid-pointswere taken foreachtechnologythatisrelevanttotheGMSregion.Thedatapointscollatedreflectovernight, turnkey engineering procurement construction capital costs and areexclusive of fixed operating and maintenance costs, variable operating andmaintenancecostsandfuelcosts. Thecapitalcostsbytechnologyassumedinthestudy are presented in Figure 32for the BAU and SES scenarios. For the ASESscenario,weassumedthatthetechnologycostsofrenewabletechnologiesdeclinemorerapidly.ThesetechnologycostassumptionsarelistedinFigure33.Notethatthetechnologycapitalcostshavenot includedlandcosts,transmissionequipmentcosts,nordecommissioningcostsandarequotedonaRealUSD2014basis.
CommentsonthevarioustechnologiesarediscussedbelowinrelationtotheBAUandSEStechnologycosts:
• Conventional thermal technology costs areassumed todecreaseat a rateof0.05%pa citingmaturation of the technologieswith no significant scope forcostimprovement.
• Onshorewindcostswerebasedon thecurrent installedpricesseen inChinaand Indiawith future costs decreasing at a rate of 0.6% pa. Future offshorewind costs were developed by applying the current percentage differencebetweencurrentonshoreandoffshorecapitalcostsforallfutureyears.
• Largeandsmall-scalehydrocostsareassumedtoincreaseovertimereflectingeasyandmorecost-efficienthydroopportunitiesbeingdeveloped inthefirstinstance. IRENA reported no cost improvements for hydro over the periodfrom 2010 to 2014. Adjustments are made in the case of Lao PDR andMyanmarwheresignificanthydroresourcesaredevelopedintheBAUcase33.
31Inparticular:(1)sufficientreal-timemonitoringforbothsupplyanddemandsideoftheindustry,(2)appropriateforecasting for solar and wind and centralised real-time control systems in place to manage a more distributedsupplyside,storagesandflexibledemandresources,and(3)powersystemsdesignedtobeabletomanagevoltage,frequency and stability issues that may arise from having a power system that is dominated an asynchronoustechnologies.32WestandardisedonReal2014USDwithalltechnologiescostsnormalisedtoreflectturnkeycapitalcosts.33Capitalcostsforlargescalehydroprojectsareassumedtoincreaseto$3,000/kWby2050consistentwithhavingthemosteconomicallyfeasiblehydroresourcesdevelopedaheadoflesseconomicallyfeasibleresources.
FINAL
IntelligentEnergySystems IESREF:5973 57
• Solar PV costs are based on the more mature crystalline silicon technologywhich accounts for up to 90% of solar PV installations (IRENA, 2015), andforecasttocontinuetodrop(2.3%pa)albeitataslowerpacethaninpreviousyears.
• Utility scalebattery costsarequotedona$/kWhbasis, andcostprojectionsbasedon a report byDeutscheBank (2015)which took into account severalforecastsfromBNEF,EIAandNavigant.
• Solarthermal(CSP)capitalcostsareprojectedtofallat2.8%paonthebasisofthe IRENA 2015 CSP LCOE projections. While globally there are many CSPinstallations in place, the technology has not taken off and the cost of CSPtechnology over the past 5 years has not been observed to have fallen asrapidlyassolarPV.
• BiomasscapitalcostsarebasedoncostsobservedintheAsiaregionwhicharesignificantly less than those observed in OECD countries. Capital costs wereassumed to fall at 0.1% pa. Biogas capital costs were based on anaerobicdigestionandassumedtodeclineatthesamerateasbiomass.
• Ocean energy (wave and tidal) technologieswere based on learning rates inthe ‘Ocean Energy: Cost of Energy and Cost Reduction Opportunities’ (SIOcean,2013)reportassumingglobalinstallationcapacitiesincreaseto20GWby205034.
• Capitalcostswerediscountedat8%paacrossalltechnologiesovertheprojectlifetimes.Decommissioningcostswerenotfactoredintothestudy.
• Fortechnologiesthatrunonimportedcoalandnaturalgas,wehavefactoredin the additional capital cost of developing import / fuel managementinfrastructureinthemodelling.
For reference, Appendix A tabulates the technology cost assumptions that wehaveusedinthemodelling.
34Waveandtidalcostswereaveraged.
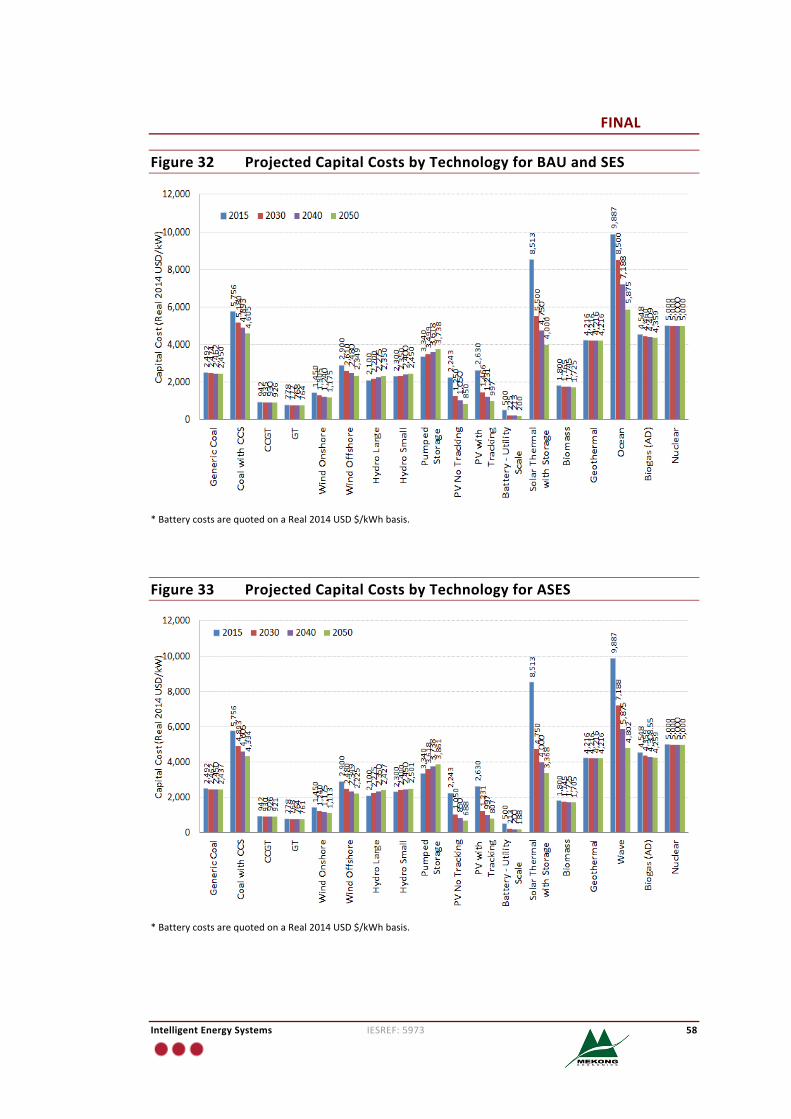
FINAL
IntelligentEnergySystems IESREF:5973 58
Figure32 ProjectedCapitalCostsbyTechnologyforBAUandSES
*BatterycostsarequotedonaReal2014USD$/kWhbasis.
Figure33 ProjectedCapitalCostsbyTechnologyforASES
*BatterycostsarequotedonaReal2014USD$/kWhbasis.
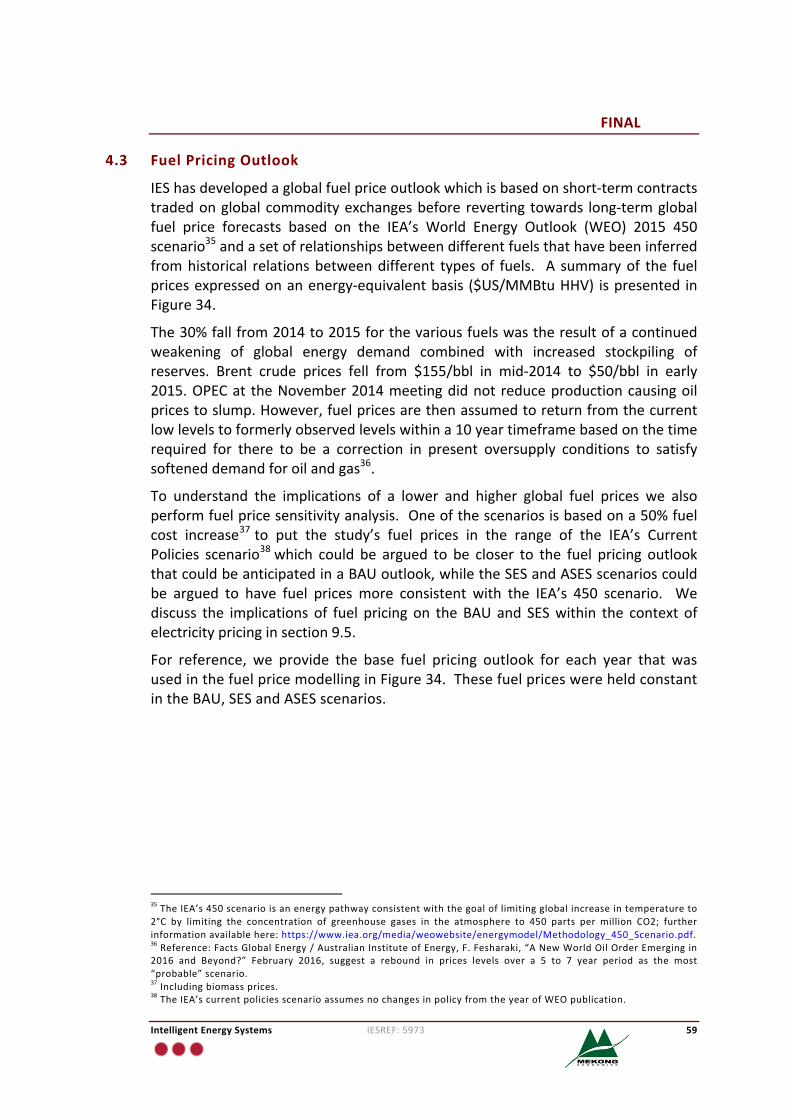
FINAL
IntelligentEnergySystems IESREF:5973 59
4.3 FuelPricingOutlook
IEShasdevelopedaglobalfuelpriceoutlookwhichisbasedonshort-termcontractstradedonglobalcommodityexchangesbeforereverting towards long-termglobalfuel price forecasts based on the IEA’s World Energy Outlook (WEO) 2015 450scenario35andasetofrelationshipsbetweendifferentfuelsthathavebeeninferredfromhistorical relationsbetweendifferent typesof fuels. A summaryof the fuelpricesexpressedonanenergy-equivalentbasis ($US/MMBtuHHV) ispresented inFigure34.
The30%fallfrom2014to2015forthevariousfuelswastheresultofacontinuedweakening of global energy demand combined with increased stockpiling ofreserves. Brent crude prices fell from $155/bbl in mid-2014 to $50/bbl in early2015.OPECat theNovember2014meetingdidnot reduceproductioncausingoilpricestoslump.However,fuelpricesarethenassumedtoreturnfromthecurrentlowlevelstoformerlyobservedlevelswithina10yeartimeframebasedonthetimerequired for there to be a correction in present oversupply conditions to satisfysofteneddemandforoilandgas36.
To understand the implications of a lower and higher global fuel prices we alsoperformfuelpricesensitivityanalysis.Oneofthescenariosisbasedona50%fuelcost increase37to put the study’s fuel prices in the range of the IEA’s CurrentPolicies scenario38which could be argued to be closer to the fuel pricing outlookthatcouldbeanticipatedinaBAUoutlook,whiletheSESandASESscenarioscouldbe argued to have fuel prices more consistent with the IEA’s 450 scenario. Wediscuss the implications of fuel pricing on theBAU and SESwithin the context ofelectricitypricinginsection9.5.
For reference, we provide the base fuel pricing outlook for each year that wasusedinthefuelpricemodellinginFigure34.ThesefuelpriceswereheldconstantintheBAU,SESandASESscenarios.
35TheIEA’s450scenarioisanenergypathwayconsistentwiththegoaloflimitingglobalincreaseintemperatureto2°C by limiting the concentration of greenhouse gases in the atmosphere to 450 parts per million CO2; furtherinformationavailablehere:https://www.iea.org/media/weowebsite/energymodel/Methodology_450_Scenario.pdf.36Reference:FactsGlobalEnergy/AustralianInstituteofEnergy,F.Fesharaki,“ANewWorldOilOrderEmergingin2016 and Beyond?” February 2016, suggest a rebound in prices levels over a 5 to 7 year period as the most“probable”scenario.37Includingbiomassprices.38TheIEA’scurrentpoliciesscenarioassumesnochangesinpolicyfromtheyearofWEOpublication.
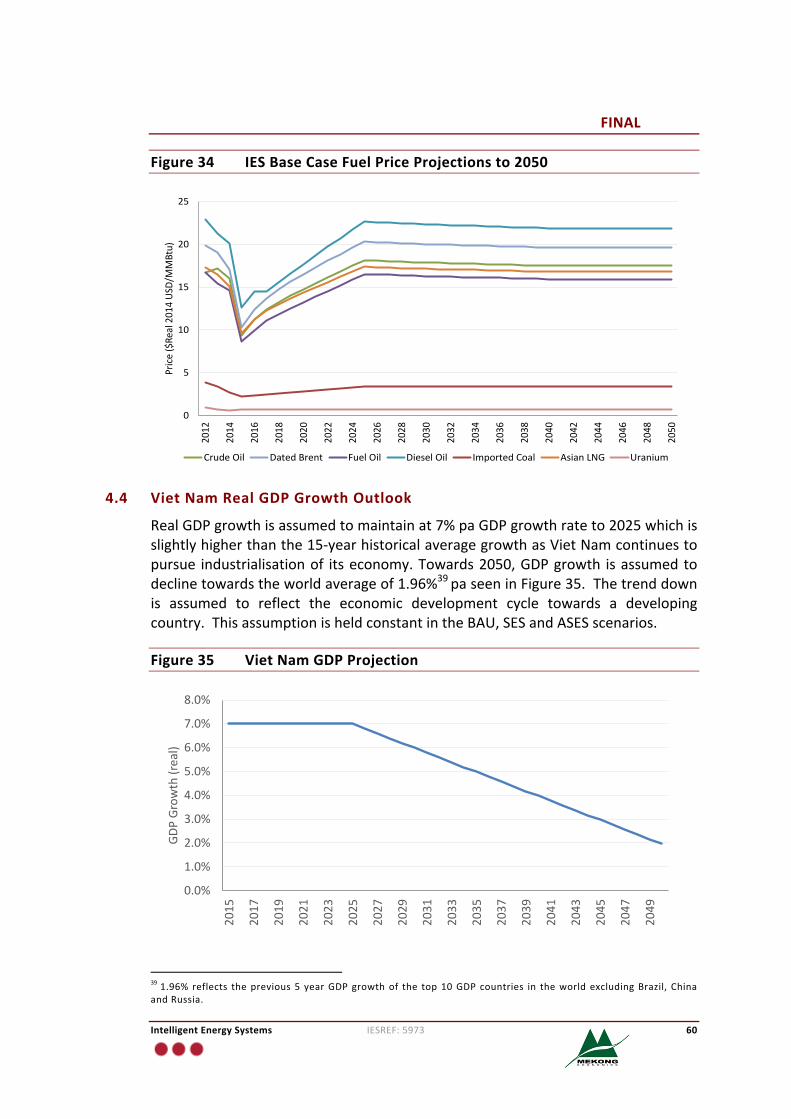
FINAL
IntelligentEnergySystems IESREF:5973 60
Figure34 IESBaseCaseFuelPriceProjectionsto2050
4.4 VietNamRealGDPGrowthOutlook
RealGDPgrowthisassumedtomaintainat7%paGDPgrowthrateto2025whichisslightlyhigherthanthe15-yearhistoricalaveragegrowthasVietNamcontinuestopursue industrialisationof itseconomy.Towards2050,GDPgrowth isassumedtodeclinetowardstheworldaverageof1.96%39paseeninFigure35.Thetrenddownis assumed to reflect the economic development cycle towards a developingcountry.ThisassumptionisheldconstantintheBAU,SESandASESscenarios.
Figure35 VietNamGDPProjection
391.96% reflects theprevious5 yearGDPgrowthof the top10GDPcountries in theworldexcludingBrazil, ChinaandRussia.
0
5
10
15
20
252012
2014
2016
2018
2020
2022
2024
2026
2028
2030
2032
2034
2036
2038
2040
2042
2044
2046
2048
2050
Price
($Re
al201
4US
D/MMBtu)
CrudeOil DatedBrent FuelOil DieselOil ImportedCoal AsianLNG Uranium
0.0%
1.0%
2.0%
3.0%
4.0%
5.0%
6.0%
7.0%
8.0%
2015
2017
2019
2021
2023
2025
2027
2029
2031
2033
2035
2037
2039
2041
2043
2045
2047
2049
GDPGrow
th(real)
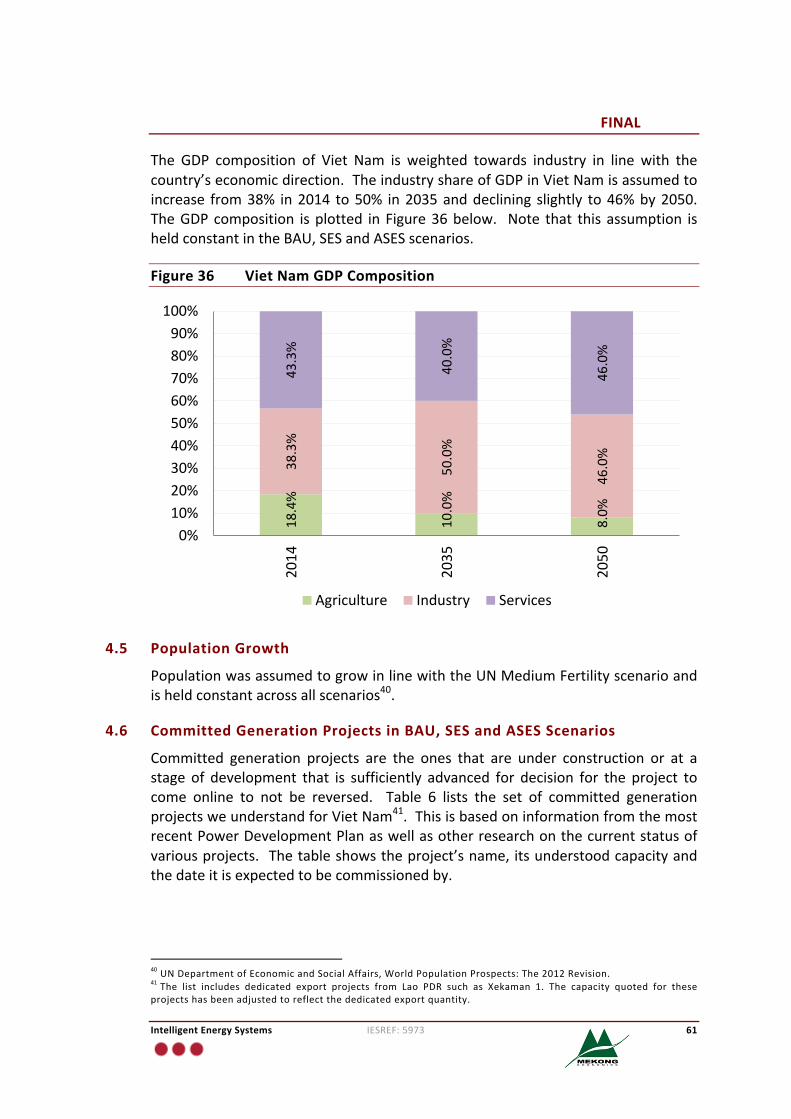
FINAL
IntelligentEnergySystems IESREF:5973 61
The GDP composition of Viet Nam is weighted towards industry in line with thecountry’seconomicdirection.TheindustryshareofGDPinVietNamisassumedtoincrease from38% in2014 to50% in2035anddeclining slightly to46%by2050.TheGDPcomposition isplotted inFigure36below. Note that this assumption isheldconstantintheBAU,SESandASESscenarios.
Figure36 VietNamGDPComposition
4.5 PopulationGrowth
PopulationwasassumedtogrowinlinewiththeUNMediumFertilityscenarioandisheldconstantacrossallscenarios40.
4.6 CommittedGenerationProjectsinBAU,SESandASESScenarios
Committed generation projects are the ones that are under construction or at astage of development that is sufficiently advanced for decision for the project tocome online to not be reversed. Table 6 lists the set of committed generationprojectsweunderstandforVietNam41.ThisisbasedoninformationfromthemostrecentPowerDevelopmentPlanaswellasotherresearchonthecurrentstatusofvariousprojects. Thetableshowstheproject’sname,itsunderstoodcapacityandthedateitisexpectedtobecommissionedby.
40UNDepartmentofEconomicandSocialAffairs,WorldPopulationProspects:The2012Revision.41The list includes dedicated export projects from Lao PDR such as Xekaman 1. The capacity quoted for theseprojectshasbeenadjustedtoreflectthededicatedexportquantity.
18.4%
10.0%
8.0%
38.3%
50.0%
46.0%
43.3%
40.0%
46.0%
0%10%20%30%40%50%60%70%80%90%
100%2014
2035
2050
Agriculture Industry Services
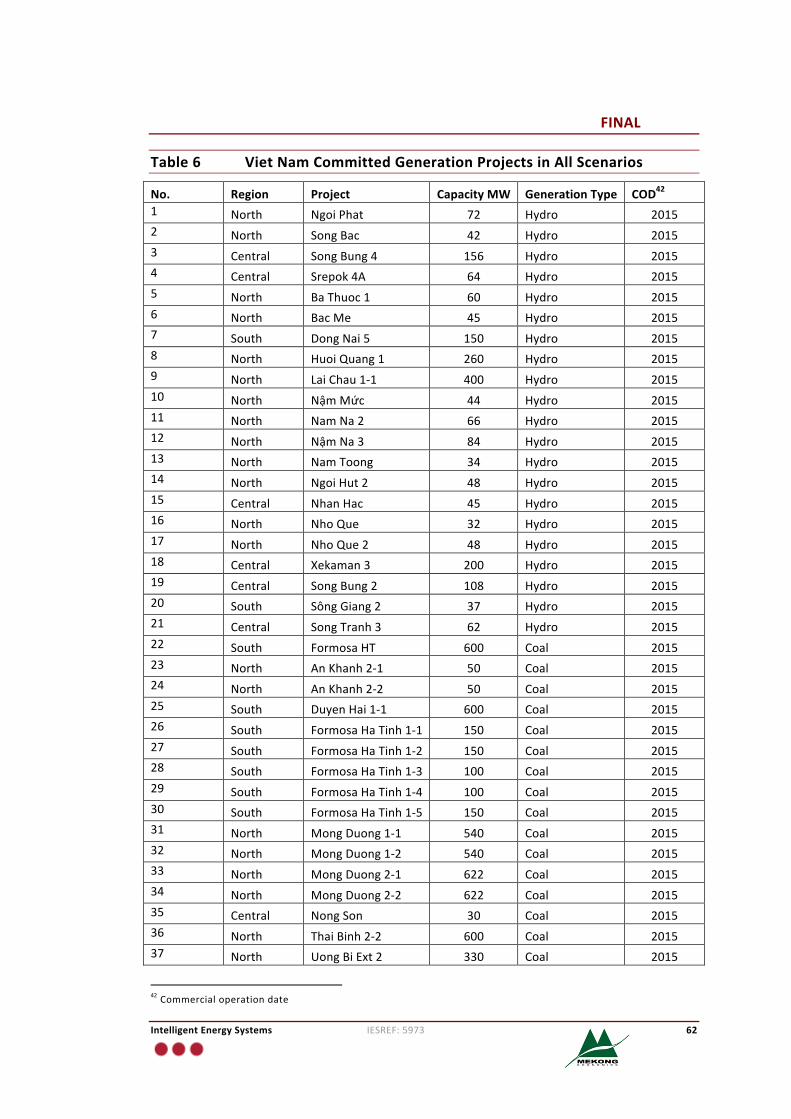
FINAL
IntelligentEnergySystems IESREF:5973 62
Table6 VietNamCommittedGenerationProjectsinAllScenarios
No. Region Project CapacityMW GenerationType COD421 North NgoiPhat 72 Hydro 20152 North SongBac 42 Hydro 20153 Central SongBung4 156 Hydro 20154 Central Srepok4A 64 Hydro 20155 North BaThuoc1 60 Hydro 20156 North BacMe 45 Hydro 20157 South DongNai5 150 Hydro 20158 North HuoiQuang1 260 Hydro 20159 North LaiChau1-1 400 Hydro 201510 North NậmMức 44 Hydro 201511 North NamNa2 66 Hydro 201512 North NậmNa3 84 Hydro 201513 North NamToong 34 Hydro 201514 North NgoiHut2 48 Hydro 201515 Central NhanHac 45 Hydro 201516 North NhoQue 32 Hydro 201517 North NhoQue2 48 Hydro 201518 Central Xekaman3 200 Hydro 201519 Central SongBung2 108 Hydro 201520 South SôngGiang2 37 Hydro 201521 Central SongTranh3 62 Hydro 201522 South FormosaHT 600 Coal 201523 North AnKhanh2-1 50 Coal 201524 North AnKhanh2-2 50 Coal 201525 South DuyenHai1-1 600 Coal 201526 South FormosaHaTinh1-1 150 Coal 201527 South FormosaHaTinh1-2 150 Coal 201528 South FormosaHaTinh1-3 100 Coal 201529 South FormosaHaTinh1-4 100 Coal 201530 South FormosaHaTinh1-5 150 Coal 201531 North MongDuong1-1 540 Coal 201532 North MongDuong1-2 540 Coal 201533 North MongDuong2-1 622 Coal 201534 North MongDuong2-2 622 Coal 201535 Central NongSon 30 Coal 201536 North ThaiBinh2-2 600 Coal 201537 North UongBiExt2 330 Coal 2015
42Commercialoperationdate
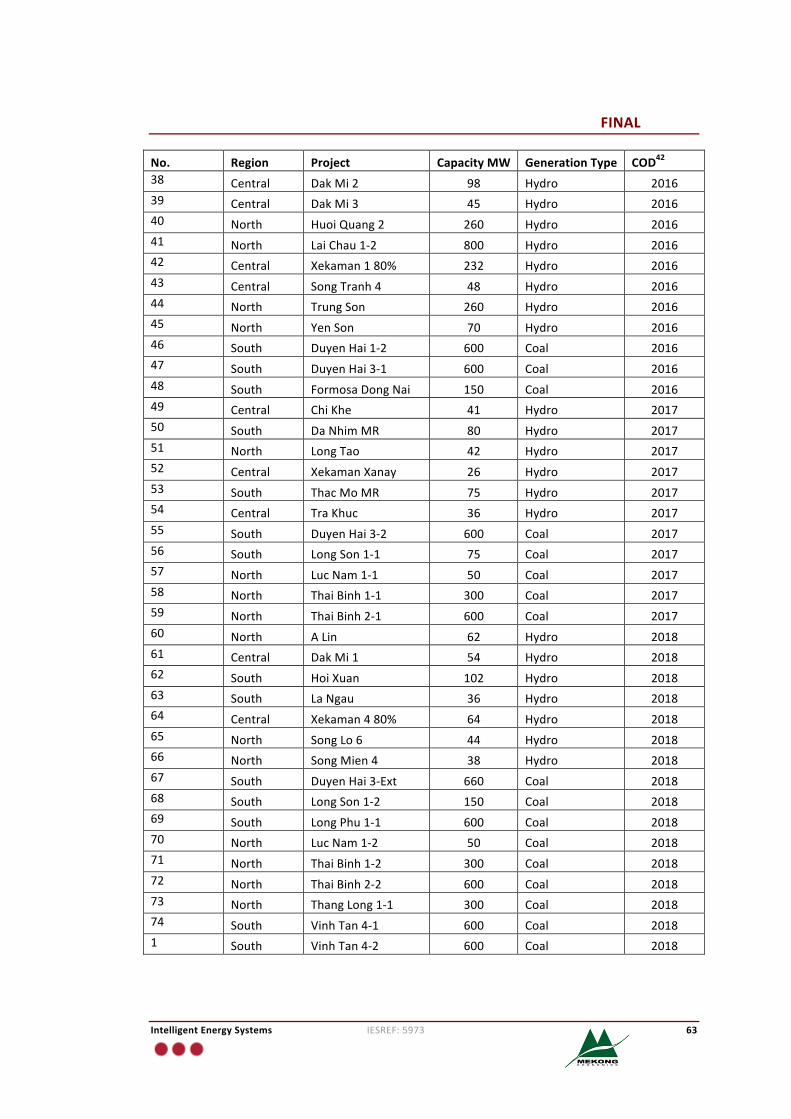
FINAL
IntelligentEnergySystems IESREF:5973 63
No. Region Project CapacityMW GenerationType COD4238 Central DakMi2 98 Hydro 201639 Central DakMi3 45 Hydro 201640 North HuoiQuang2 260 Hydro 201641 North LaiChau1-2 800 Hydro 201642 Central Xekaman180% 232 Hydro 201643 Central SongTranh4 48 Hydro 201644 North TrungSon 260 Hydro 201645 North YenSon 70 Hydro 201646 South DuyenHai1-2 600 Coal 201647 South DuyenHai3-1 600 Coal 201648 South FormosaDongNai 150 Coal 201649 Central ChiKhe 41 Hydro 201750 South DaNhimMR 80 Hydro 201751 North LongTao 42 Hydro 201752 Central XekamanXanay 26 Hydro 201753 South ThacMoMR 75 Hydro 201754 Central TraKhuc 36 Hydro 201755 South DuyenHai3-2 600 Coal 201756 South LongSon1-1 75 Coal 201757 North LucNam1-1 50 Coal 201758 North ThaiBinh1-1 300 Coal 201759 North ThaiBinh2-1 600 Coal 201760 North ALin 62 Hydro 201861 Central DakMi1 54 Hydro 201862 South HoiXuan 102 Hydro 201863 South LaNgau 36 Hydro 201864 Central Xekaman480% 64 Hydro 201865 North SongLo6 44 Hydro 201866 North SongMien4 38 Hydro 201867 South DuyenHai3-Ext 660 Coal 201868 South LongSon1-2 150 Coal 201869 South LongPhu1-1 600 Coal 201870 North LucNam1-2 50 Coal 201871 North ThaiBinh1-2 300 Coal 201872 North ThaiBinh2-2 600 Coal 201873 North ThangLong1-1 300 Coal 201874 South VinhTan4-1 600 Coal 20181 South VinhTan4-2 600 Coal 2018
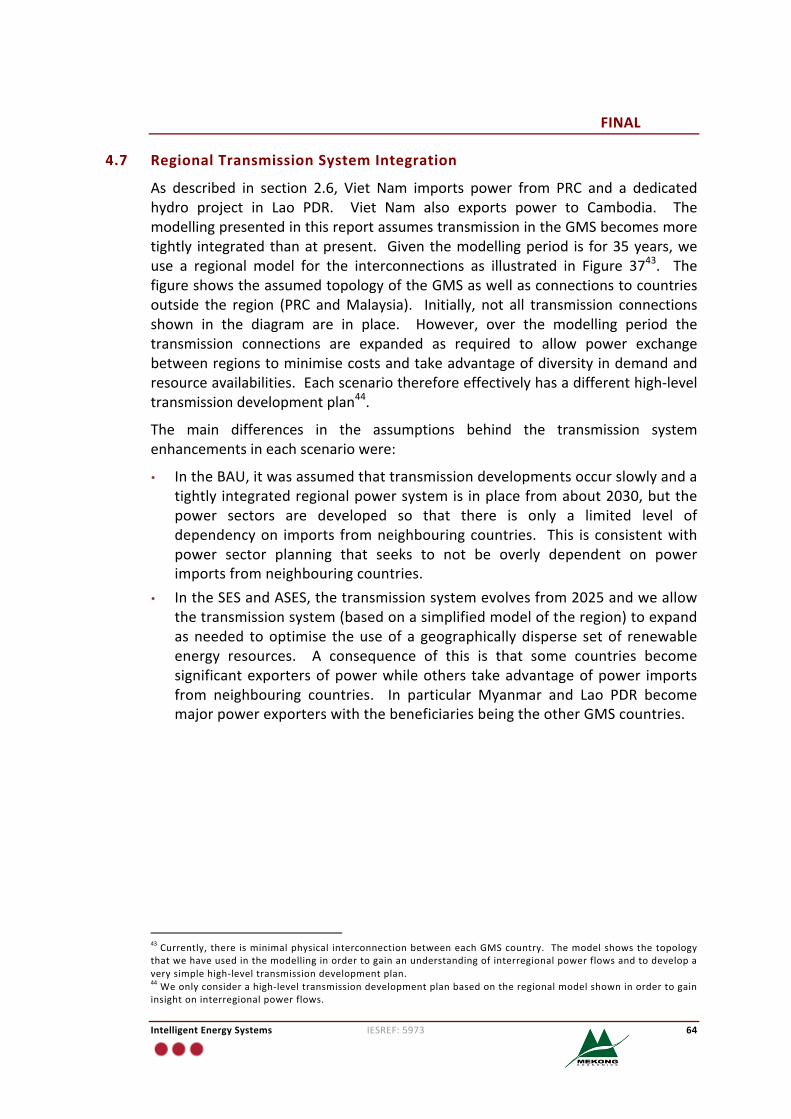
FINAL
IntelligentEnergySystems IESREF:5973 64
4.7 RegionalTransmissionSystemIntegration
As described in section 2.6, Viet Nam imports power from PRC and a dedicatedhydro project in Lao PDR. Viet Nam also exports power to Cambodia. ThemodellingpresentedinthisreportassumestransmissionintheGMSbecomesmoretightly integratedthanatpresent. Giventhemodellingperiod is for35years,weuse a regional model for the interconnections as illustrated in Figure 3743. ThefigureshowstheassumedtopologyoftheGMSaswellasconnectionstocountriesoutside the region (PRC andMalaysia). Initially, not all transmission connectionsshown in the diagram are in place. However, over the modelling period thetransmission connections are expanded as required to allow power exchangebetweenregionstominimisecostsandtakeadvantageofdiversityindemandandresourceavailabilities.Eachscenariothereforeeffectivelyhasadifferenthigh-leveltransmissiondevelopmentplan44.
The main differences in the assumptions behind the transmission systemenhancementsineachscenariowere:
• IntheBAU,itwasassumedthattransmissiondevelopmentsoccurslowlyandatightly integratedregionalpowersystemis inplacefromabout2030,butthepower sectors are developed so that there is only a limited level ofdependencyon imports fromneighbouringcountries. This is consistentwithpower sector planning that seeks to not be overly dependent on powerimportsfromneighbouringcountries.
• IntheSESandASES,thetransmissionsystemevolvesfrom2025andweallowthetransmissionsystem(basedonasimplifiedmodeloftheregion)toexpandasneeded tooptimise theuseof a geographicallydisperse setof renewableenergy resources. A consequence of this is that some countries becomesignificantexportersofpowerwhileothers takeadvantageofpower importsfrom neighbouring countries. In particular Myanmar and Lao PDR becomemajorpowerexporterswiththebeneficiariesbeingtheotherGMScountries.
43Currently,there isminimalphysical interconnectionbetweeneachGMScountry. Themodelshowsthetopologythatwehaveusedinthemodellinginordertogainanunderstandingofinterregionalpowerflowsandtodevelopaverysimplehigh-leveltransmissiondevelopmentplan.44Weonlyconsiderahigh-leveltransmissiondevelopmentplanbasedontheregionalmodelshowninordertogaininsightoninterregionalpowerflows.
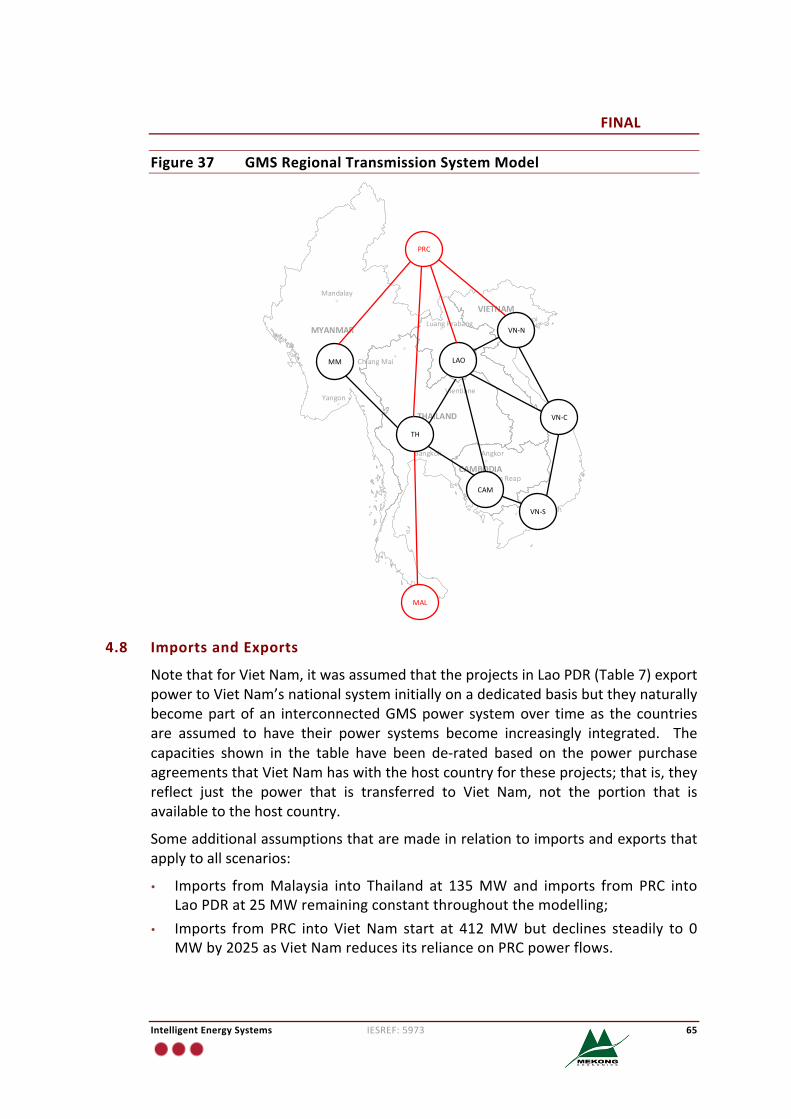
FINAL
IntelligentEnergySystems IESREF:5973 65
Figure37 GMSRegionalTransmissionSystemModel
4.8 ImportsandExports
NotethatforVietNam,itwasassumedthattheprojectsinLaoPDR(Table7)exportpowertoVietNam’snationalsysteminitiallyonadedicatedbasisbuttheynaturallybecomepartof an interconnectedGMSpower systemover timeas the countriesare assumed to have their power systems become increasingly integrated. Thecapacities shown in the table have been de-rated based on the power purchaseagreementsthatVietNamhaswiththehostcountryfortheseprojects;thatis,theyreflect just the power that is transferred to Viet Nam, not the portion that isavailabletothehostcountry.
Someadditionalassumptionsthataremadeinrelationtoimportsandexportsthatapplytoallscenarios:
• Imports fromMalaysia into Thailand at 135MW and imports from PRC intoLaoPDRat25MWremainingconstantthroughoutthemodelling;
• Imports from PRC into Viet Nam start at 412MWbut declines steadily to 0MWby2025asVietNamreducesitsrelianceonPRCpowerflows.
THAILAND
MYANMAR
CAMBODIA
VIETNAM
LAOPDR
HanoiLuangPrabang
Vientiane
Mandalay
Yangon
HoChiMinhCity
PhnomPenh
Bangkok Angkor
SiemReap
Vientiane
ChiangMaiMM
TH
LAO
CAM
VN-S
VN-C
VN-N
PRC
MAL
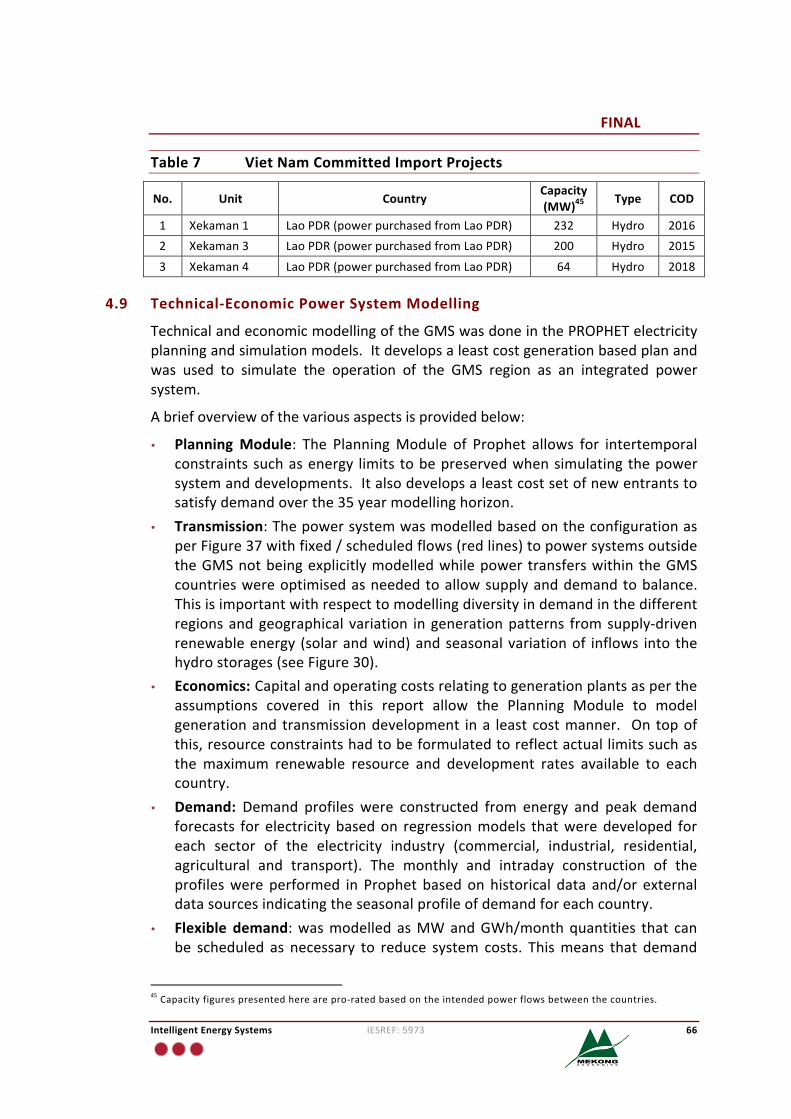
FINAL
IntelligentEnergySystems IESREF:5973 66
Table7 VietNamCommittedImportProjects
No. Unit CountryCapacity(MW)45 Type COD
1 Xekaman1 LaoPDR(powerpurchasedfromLaoPDR) 232 Hydro 20162 Xekaman3 LaoPDR(powerpurchasedfromLaoPDR) 200 Hydro 2015
3 Xekaman4 LaoPDR(powerpurchasedfromLaoPDR) 64 Hydro 2018
4.9 Technical-EconomicPowerSystemModelling
TechnicalandeconomicmodellingoftheGMSwasdoneinthePROPHETelectricityplanningandsimulationmodels.Itdevelopsaleastcostgenerationbasedplanandwas used to simulate the operation of the GMS region as an integrated powersystem.
Abriefoverviewofthevariousaspectsisprovidedbelow:
• PlanningModule: The PlanningModule of Prophet allows for intertemporalconstraintssuchasenergy limits tobepreservedwhensimulatingthepowersystemanddevelopments.Italsodevelopsaleastcostsetofnewentrantstosatisfydemandoverthe35yearmodellinghorizon.
• Transmission:ThepowersystemwasmodelledbasedontheconfigurationasperFigure37withfixed/scheduledflows(redlines)topowersystemsoutsidetheGMSnotbeingexplicitlymodelledwhilepowertransferswithintheGMScountrieswereoptimisedasneededtoallowsupplyanddemandtobalance.Thisisimportantwithrespecttomodellingdiversityindemandinthedifferentregionsandgeographical variation ingenerationpatterns fromsupply-drivenrenewableenergy (solarandwind)andseasonalvariationof inflows into thehydrostorages(seeFigure30).
• Economics:Capitalandoperatingcostsrelatingtogenerationplantsaspertheassumptions covered in this report allow the Planning Module to modelgenerationand transmissiondevelopment ina leastcostmanner. On topofthis,resourceconstraintshadtobeformulatedtoreflectactuallimitssuchasthemaximum renewable resource and development rates available to eachcountry.
• Demand:Demand profiles were constructed from energy and peak demandforecasts for electricitybasedon regressionmodels thatweredeveloped foreach sector of the electricity industry (commercial, industrial, residential,agricultural and transport). The monthly and intraday construction of theprofileswereperformed in Prophet basedonhistorical data and/or externaldatasourcesindicatingtheseasonalprofileofdemandforeachcountry.
• Flexible demand:wasmodelledasMWandGWh/monthquantities that canbe scheduled as necessary to reduce system costs. Thismeans that demand
45Capacityfigurespresentedherearepro-ratedbasedontheintendedpowerflowsbetweenthecountries.
FINAL
IntelligentEnergySystems IESREF:5973 67
tendstobeshiftedfromperiodswhensupplyanddemandwouldotherwisebetighttoothertimes.Thetechnologyforreschedulingdemandwasassumedtobeinplacefrom2020intheSESandASESscenarios.
• Supply: The approach taken for modelling generation supply technologiesvariedaccordingtothetechnologytype.Thisisdiscussedfurtherbelow:- Conventionalthermalplant:ismodelledascapacitylimitedplants,withfuel
takeorpaycontractsappliedtogeneratorswhererelevantandotherfuelsupplyconstraintsinplacewhererelevant–forexample,gassupplylimitsapplied to LNG facilities or offshore gas fields. Examples of such plantsincludecoal,biomass,gas,anddieselgenerators.
- Energylimitedplants:suchaslarge-scalehydroswithreservoirs/storagesandCSPhavemonthlyenergylimitscorrespondingtoseasonalvariationsinenergy inflows. The equivalent capacity factors are based on externalreportsforhydroandresourcedataforCSP(seenextpoint).
- Supply-drivengenerationforms:Seasonalprofilesforwind,solarandrunofriver hydros without reservoirs were developed on an hourly basis. Forwind and solar they were derived frommonthly resource data collectedfromavarietyofsourcesincludingNASA,NREL46andaccessedviatheSolarandWindEnergyResourceAtlas (SWERA)Toolkitand IRENAGlobalAtlas.Resourceamountswerematchedagainstactualgenerationdataforknownplants to develop equivalent monthly capacity factors at various highresource pockets in each country. Several traces were built from knowngenerationtracestoprovidediversificationbenefits.
- PumpStorageandbatterystorage:thesearemodelledinasimilarwaytoflexibledemandinthatdemandcanbeshiftedwithacapacityandenergylimit but the scheduled demand is stored for generation later with anappropriateenergyconversionefficiency(pumpedstoragesassumedtobe70%andbatterystoragesystemsat85%).
46DNIandWindNASALowResolutionandNRELDIModerateResolutiondata.
FINAL
IntelligentEnergySystems IESREF:5973 68
5 BusinessasUsualScenario
5.1 BusinessasUsualScenario
TheBAUscenarioassumesindustrydevelopmentsconsistentwiththecurrentstateof planning in Viet Nam and reflective of growth rates in electricity demandconsistent with an IES view of base development, existing renewable energytargets, where relevant, aspirational targets for electrification rates, and energyefficiencygainsthatarelargelyconsistentwiththepoliciesseenintheregion.ForViet Nam, the Business as Usual (BAU) scenario was based on a strategy ofconventionalpowersectorplanningforVietNam.TheBAUscenario’sstrategyforVietNam’selectricityindustryischaracterisedbythefollowing:
• Minimal advancements and efforts in the area of energy efficiency anddemand-sidemanagement;
• Heavy use of domestic and imported coal resources, requiring thedevelopmentofcoalimportandhandlingfacilities;
• OngoingexploitationofVietNam’soffshorereservesofgas,andinthelonger-term developing LNG regasification facilities to backfill gas reserves atinternationalgaspricesasoffshorereservesbecomedepleted;
• Continueddevelopmentofnuclearpowercapabilityandeventuallyexercisingthatoptiontosatisfygrowingdemandoverthelong-run;
• Inrelationtohydropower:- NofurtherdevelopmentoflargescalehydroprojectssitedwithinVietNam
beyondwhatisunderconstruction,asitiswellrecognisedthatVietNam’slargescalehydropotentialhasbeenalmostfullyexploited;
- Development of small scale hydro potential continues as is presentlyplanned,althoughitisnotcontinuedbeyondtheatotalofthe5597MWofpotential that has been identified andwhich is considered sustainable todevelop;
- Development of pumped storage hydro power plants in linewith currentthinkinginVietNam’spowerdevelopmentplans;
• Limiteddeploymentof themost readilyexploited renewableenergyprojectsinthecountrytoachievearound10%ofthetotalgenerationmixby2030,and10% by 2050, including the following types of renewable energy (consistentwithcurrentBAUrenewableenergyplanninginVietNam):solarphotovoltaics,onshorewindfarmsandbiomassandbiogasprojects;and
• Continued development of power import projects from neighbouringcountries,includinghydroprojectsinCambodiaandLaoPDR.
• Electric cars andmotorcycles are expected to displace traditional fuel-basedtransportduetolowerrunningandmaintenancecostsandtheexpectationoflowerbatterycostsasglobalproductionincreases.
FINAL
IntelligentEnergySystems IESREF:5973 69
The BAU scenario developed and presented in this report reflects future powersectordevelopmentsthatarelargelyconsistentwithourunderstandingofcurrentpowerdevelopmentplans,plansforrenewableenergy,plansforenhancingenergyefficiency in Viet Nam, and measures currently in place for mitigating climatechange.
5.2 ProjectedDemandGrowth
Viet Nam’s on-grid electricity demand (including transmission and distributionlosses47) is plotted in Figure 38. Viet Nam’s electricity demand is forecast toincreaseatarateof5.1%paoverthe35-yearperiodto2050withaslowdowningrowthbeyond2040witheconomicgrowthratestrendingtowardsgrowthratesofdevelopedcountriesandpopulationgrowthratesslowing.
To 2050, electricity demand attributable to the commercial sector has beenprojected to grow the fastest at 6.4%pa, followedby industrial sector growth at5.2%,residentialat2.8%andtheagriculturalsectorat3.3%.ThisisinlinewithGDPcomposition transitioning towards industry and commercial services by 2030 andbeyond, in line with the country’s current economic strategies. Electricityconsumption attributable to the transport sector becoming increasingly based onelectricvehicles is forecast toreachsome29TWhby2050as thenumberofcarsand uptake of electric cars and motorbikes increase to 20% uptake. Viet Namelectricitydemand is forecast toreachsome861TWhby2050withthe industrialsectoraccountingfor57%oftotalelectricitydemand.
Peak demand is plotted below in Figure 39 and shows peak demand growing at4.8%paandreaching122GWby2050.Theloadfactorisassumedtotrendtowards80% by 2040 in linewith having increasing levels of industrial load in themix ofelectricitycustomers.Keydrivers fordemandgrowthandthedemandprojectionsaresummarisedinTable8.
47Note that unless otherwise stated, all other demand charts and statistics include transmission and distributionlosses.
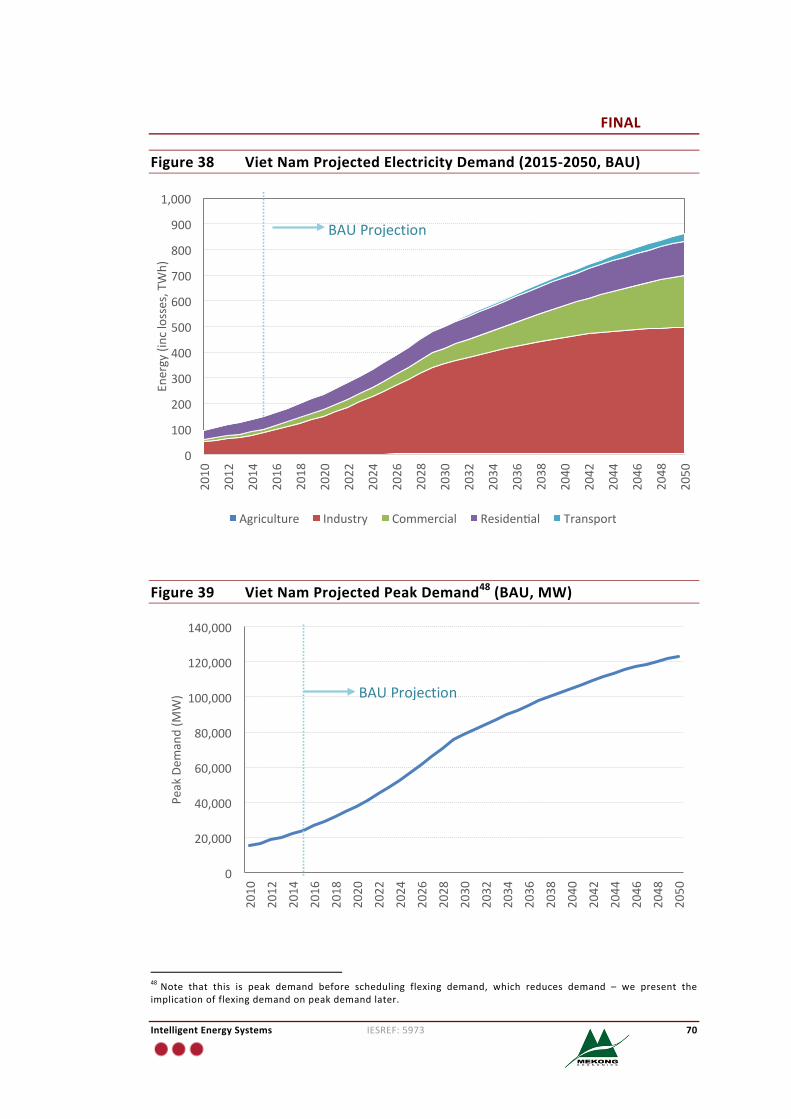
FINAL
IntelligentEnergySystems IESREF:5973 70
Figure38 VietNamProjectedElectricityDemand(2015-2050,BAU)
Figure39 VietNamProjectedPeakDemand48(BAU,MW)
48Note that this is peak demand before scheduling flexing demand, which reduces demand – we present theimplicationofflexingdemandonpeakdemandlater.
0
100
200
300
400
500
600
700
800
900
1,0002010
2012
2014
2016
2018
2020
2022
2024
2026
2028
2030
2032
2034
2036
2038
2040
2042
2044
2046
2048
2050
Energy(inclosses,TWh)
Agriculture Industry Commercial Residen�al Transport
0
20,000
40,000
60,000
80,000
100,000
120,000
140,000
2010
2012
2014
2016
2018
2020
2022
2024
2026
2028
2030
2032
2034
2036
2038
2040
2042
2044
2046
2048
2050
PeakDem
and(M
W)
BAUProjection
BAUProjection
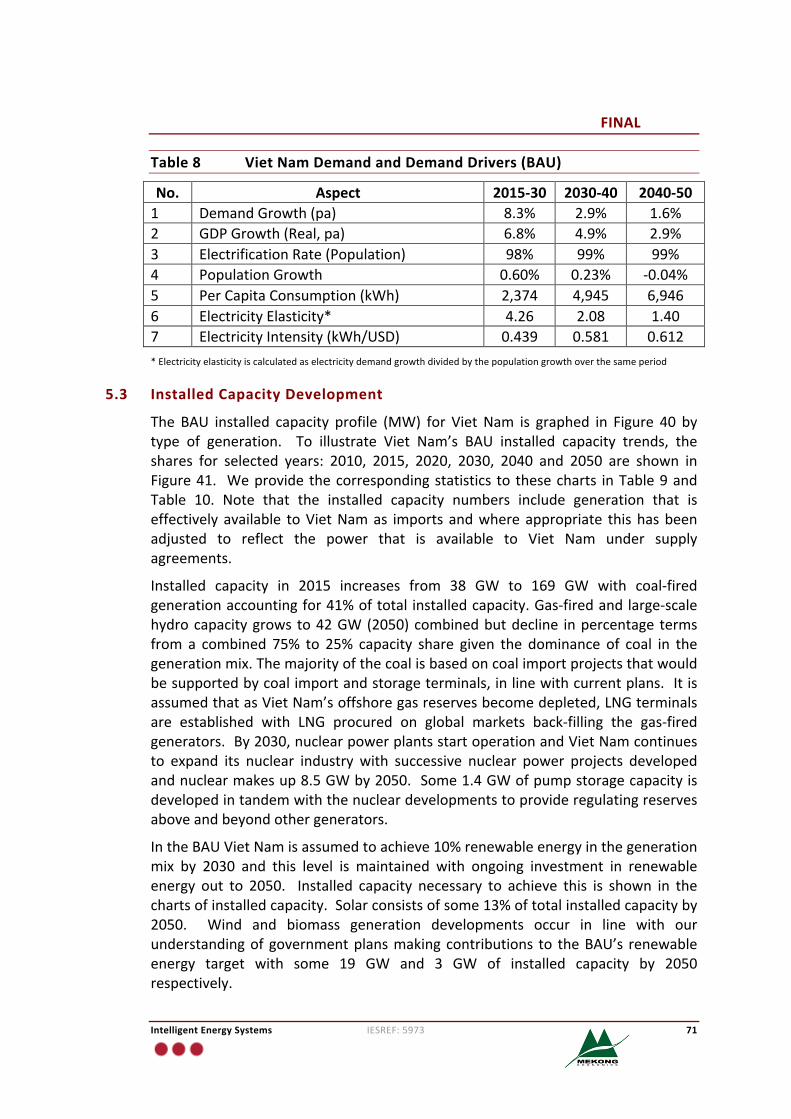
FINAL
IntelligentEnergySystems IESREF:5973 71
Table8 VietNamDemandandDemandDrivers(BAU)
No. Aspect 2015-30 2030-40 2040-501 DemandGrowth(pa) 8.3% 2.9% 1.6%2 GDPGrowth(Real,pa) 6.8% 4.9% 2.9%3 ElectrificationRate(Population) 98% 99% 99%4 PopulationGrowth 0.60% 0.23% -0.04%5 PerCapitaConsumption(kWh) 2,374 4,945 6,9466 ElectricityElasticity* 4.26 2.08 1.407 ElectricityIntensity(kWh/USD) 0.439 0.581 0.612*Electricityelasticityiscalculatedaselectricitydemandgrowthdividedbythepopulationgrowthoverthesameperiod
5.3 InstalledCapacityDevelopment
The BAU installed capacity profile (MW) for Viet Nam is graphed in Figure 40 bytype of generation. To illustrate Viet Nam’s BAU installed capacity trends, theshares for selected years: 2010, 2015, 2020, 2030, 2040 and 2050 are shown inFigure41. Weprovidethecorrespondingstatistics to thesecharts inTable9andTable 10. Note that the installed capacity numbers include generation that iseffectively available toVietNamas imports andwhereappropriate thishasbeenadjusted to reflect the power that is available to Viet Nam under supplyagreements.
Installed capacity in 2015 increases from 38 GW to 169 GW with coal-firedgenerationaccountingfor41%oftotal installedcapacity.Gas-firedandlarge-scalehydrocapacitygrowsto42GW(2050)combinedbutdecline inpercentage termsfrom a combined 75% to 25% capacity share given the dominance of coal in thegenerationmix.Themajorityofthecoalisbasedoncoalimportprojectsthatwouldbesupportedbycoalimportandstorageterminals,inlinewithcurrentplans.ItisassumedthatasVietNam’soffshoregasreservesbecomedepleted,LNGterminalsare established with LNG procured on global markets back-filling the gas-firedgenerators.By2030,nuclearpowerplantsstartoperationandVietNamcontinuesto expand its nuclear industry with successive nuclear power projects developedandnuclearmakesup8.5GWby2050.Some1.4GWofpumpstoragecapacityisdevelopedintandemwiththenucleardevelopmentstoprovideregulatingreservesaboveandbeyondothergenerators.
IntheBAUVietNamisassumedtoachieve10%renewableenergyinthegenerationmix by 2030 and this level is maintained with ongoing investment in renewableenergy out to 2050. Installed capacity necessary to achieve this is shown in thechartsofinstalledcapacity.Solarconsistsofsome13%oftotalinstalledcapacityby2050. Wind and biomass generation developments occur in line with ourunderstandingofgovernmentplansmakingcontributions to theBAU’s renewableenergy target with some 19 GW and 3 GW of installed capacity by 2050respectively.
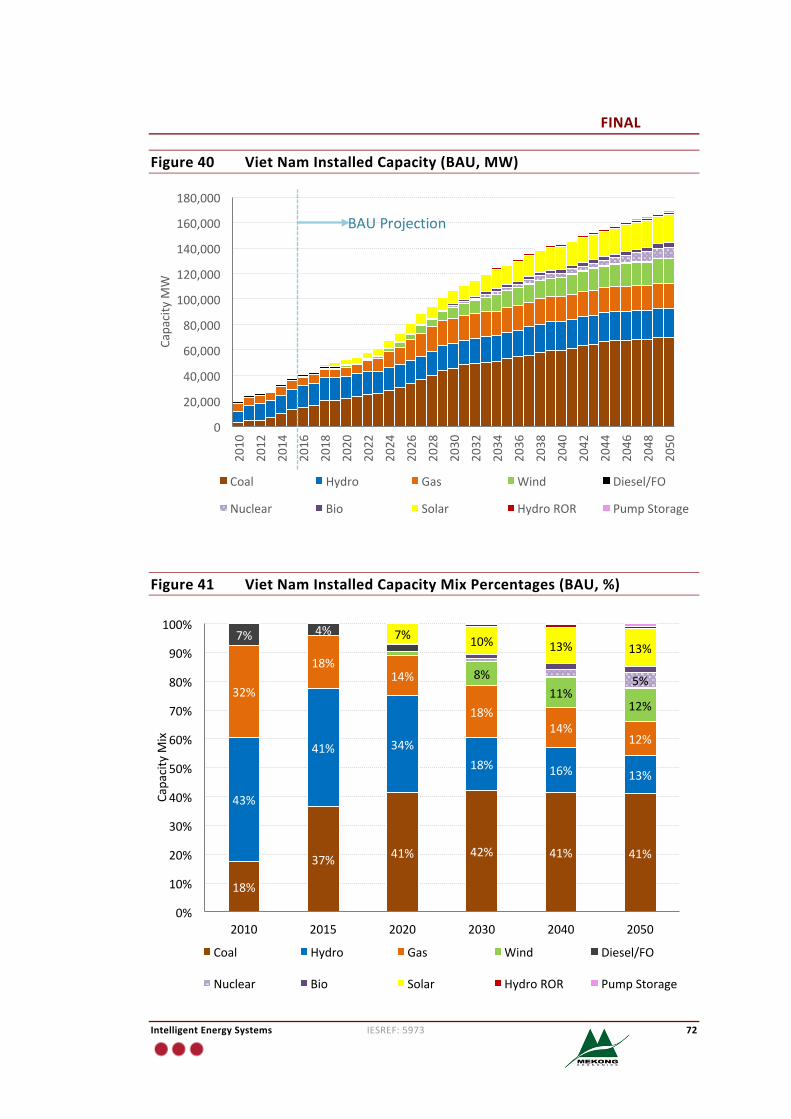
FINAL
IntelligentEnergySystems IESREF:5973 72
Figure40 VietNamInstalledCapacity(BAU,MW)
Figure41 VietNamInstalledCapacityMixPercentages(BAU,%)
0
20,000
40,000
60,000
80,000
100,000
120,000
140,000
160,000
180,000
2010
2012
2014
2016
2018
2020
2022
2024
2026
2028
2030
2032
2034
2036
2038
2040
2042
2044
2046
2048
2050
CapacityM
W
Coal Hydro Gas Wind Diesel/FO
Nuclear Bio Solar HydroROR PumpStorage
18%
37% 41% 42% 41% 41%
43%
41% 34%18% 16% 13%
32%
18%14%
18%14%
12%
8%11%
12%
7% 4%
5%
7% 10% 13% 13%
0%
10%
20%
30%
40%
50%
60%
70%
80%
90%
100%
2010 2015 2020 2030 2040 2050
CapacityM
ix
Coal Hydro Gas Wind Diesel/FO
Nuclear Bio Solar HydroROR PumpStorage
BAUProjection
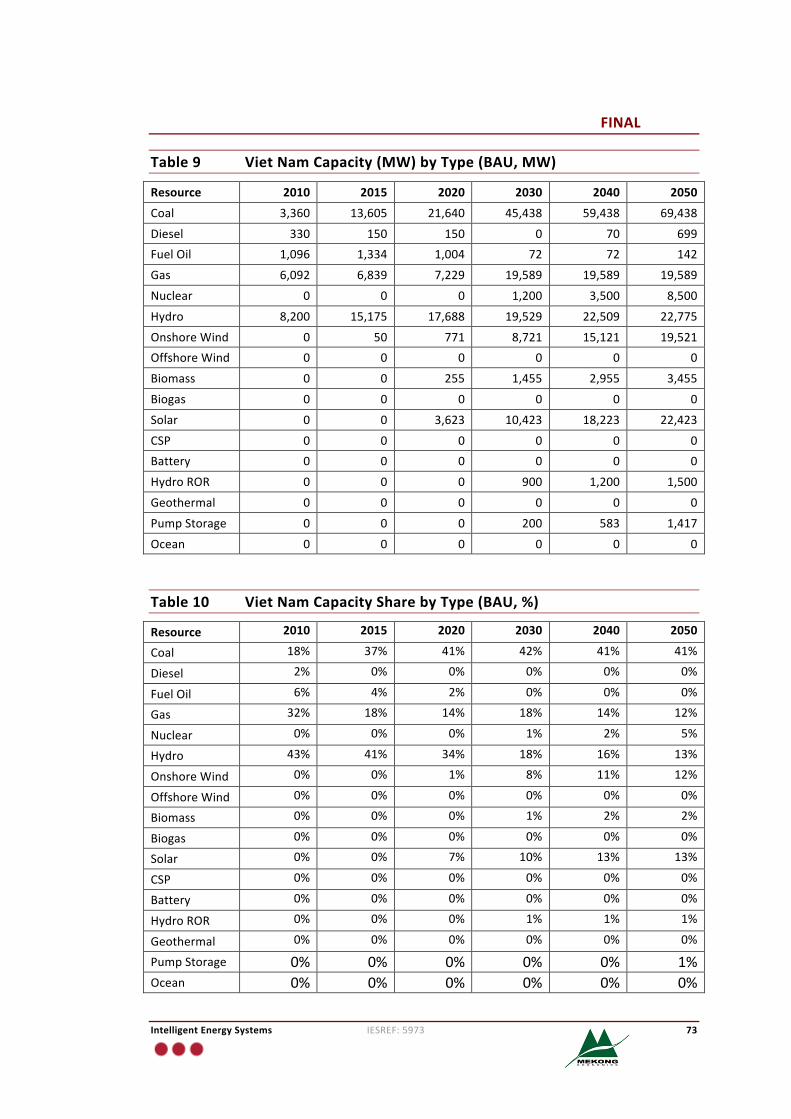
FINAL
IntelligentEnergySystems IESREF:5973 73
Table9 VietNamCapacity(MW)byType(BAU,MW)
Resource 2010 2015 2020 2030 2040 2050
Coal 3,360 13,605 21,640 45,438 59,438 69,438
Diesel 330 150 150 0 70 699FuelOil 1,096 1,334 1,004 72 72 142
Gas 6,092 6,839 7,229 19,589 19,589 19,589
Nuclear 0 0 0 1,200 3,500 8,500
Hydro 8,200 15,175 17,688 19,529 22,509 22,775
OnshoreWind 0 50 771 8,721 15,121 19,521OffshoreWind 0 0 0 0 0 0
Biomass 0 0 255 1,455 2,955 3,455
Biogas 0 0 0 0 0 0
Solar 0 0 3,623 10,423 18,223 22,423
CSP 0 0 0 0 0 0Battery 0 0 0 0 0 0
HydroROR 0 0 0 900 1,200 1,500
Geothermal 0 0 0 0 0 0
PumpStorage 0 0 0 200 583 1,417
Ocean 0 0 0 0 0 0
Table10 VietNamCapacitySharebyType(BAU,%)
Resource 2010 2015 2020 2030 2040 2050
Coal 18% 37% 41% 42% 41% 41%
Diesel 2% 0% 0% 0% 0% 0%
FuelOil 6% 4% 2% 0% 0% 0%
Gas 32% 18% 14% 18% 14% 12%
Nuclear 0% 0% 0% 1% 2% 5%
Hydro 43% 41% 34% 18% 16% 13%
OnshoreWind 0% 0% 1% 8% 11% 12%
OffshoreWind 0% 0% 0% 0% 0% 0%
Biomass 0% 0% 0% 1% 2% 2%
Biogas 0% 0% 0% 0% 0% 0%
Solar 0% 0% 7% 10% 13% 13%
CSP 0% 0% 0% 0% 0% 0%
Battery 0% 0% 0% 0% 0% 0%
HydroROR 0% 0% 0% 1% 1% 1%
Geothermal 0% 0% 0% 0% 0% 0%
PumpStorage 0% 0% 0% 0% 0% 1%Ocean 0% 0% 0% 0% 0% 0%
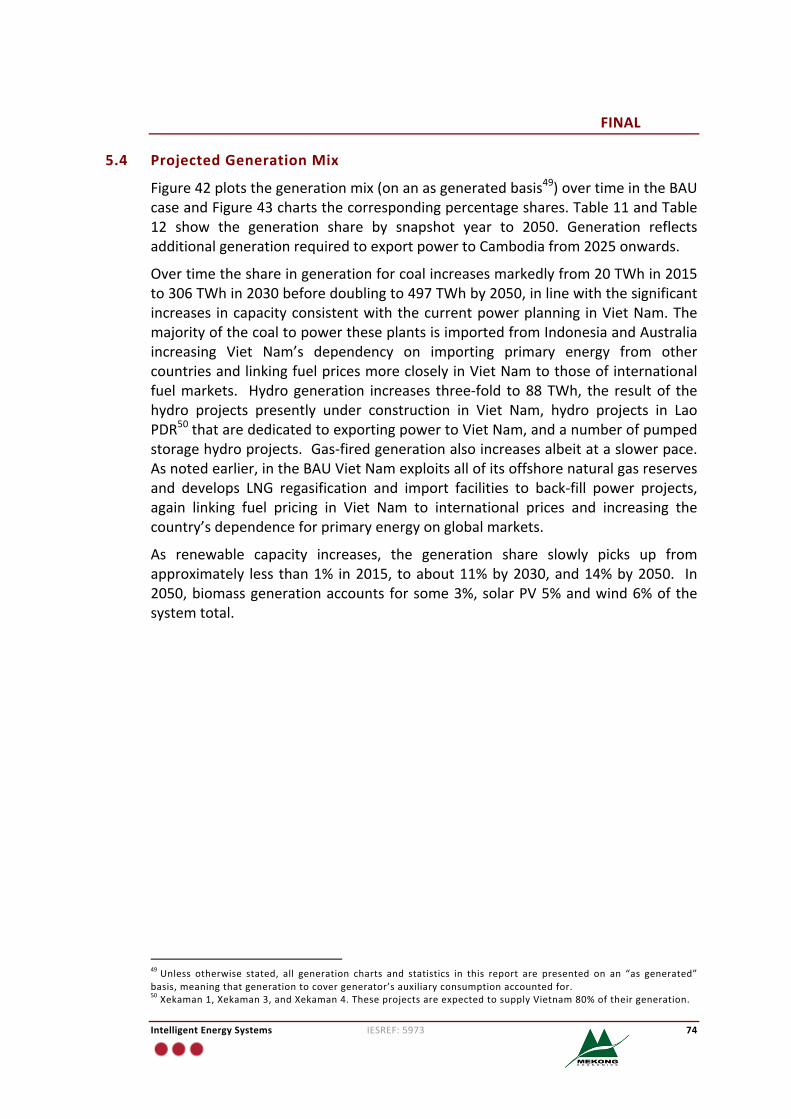
FINAL
IntelligentEnergySystems IESREF:5973 74
5.4 ProjectedGenerationMix
Figure42plotsthegenerationmix(onanasgeneratedbasis49)overtimeintheBAUcaseandFigure43chartsthecorrespondingpercentageshares.Table11andTable12 show the generation share by snapshot year to 2050. Generation reflectsadditionalgenerationrequiredtoexportpowertoCambodiafrom2025onwards.
Overtimetheshareingenerationforcoalincreasesmarkedlyfrom20TWhin2015to306TWhin2030beforedoublingto497TWhby2050,inlinewiththesignificantincreases incapacityconsistentwiththecurrentpowerplanning inVietNam.ThemajorityofthecoaltopowertheseplantsisimportedfromIndonesiaandAustraliaincreasing Viet Nam’s dependency on importing primary energy from othercountriesandlinkingfuelpricesmorecloselyinVietNamtothoseofinternationalfuelmarkets. Hydrogeneration increases three-fold to88TWh, the resultof thehydro projects presently under construction in Viet Nam, hydro projects in LaoPDR50thatarededicatedtoexportingpowertoVietNam,andanumberofpumpedstoragehydroprojects.Gas-firedgenerationalsoincreasesalbeitataslowerpace.Asnotedearlier,intheBAUVietNamexploitsallofitsoffshorenaturalgasreservesand develops LNG regasification and import facilities to back-fill power projects,again linking fuel pricing in Viet Nam to international prices and increasing thecountry’sdependenceforprimaryenergyonglobalmarkets.
As renewable capacity increases, the generation share slowly picks up fromapproximately less than1% in2015, toabout11%by2030,and14%by2050. In2050,biomassgenerationaccounts forsome3%,solarPV5%andwind6%ofthesystemtotal.
49Unless otherwise stated, all generation charts and statistics in this report are presented on an “as generated”basis,meaningthatgenerationtocovergenerator’sauxiliaryconsumptionaccountedfor.50Xekaman1,Xekaman3,andXekaman4.TheseprojectsareexpectedtosupplyVietnam80%oftheirgeneration.
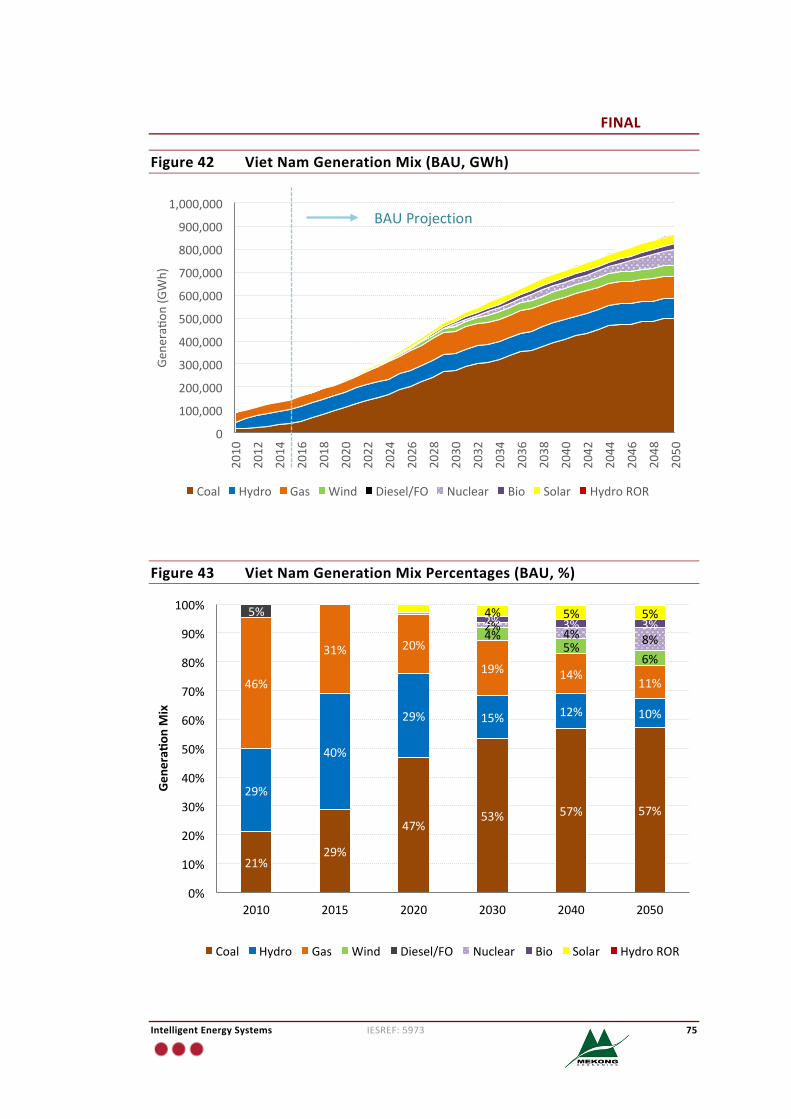
FINAL
IntelligentEnergySystems IESREF:5973 75
Figure42 VietNamGenerationMix(BAU,GWh)
Figure43 VietNamGenerationMixPercentages(BAU,%)
0
100,000
200,000
300,000
400,000
500,000
600,000
700,000
800,000
900,000
1,000,000
2010
2012
2014
2016
2018
2020
2022
2024
2026
2028
2030
2032
2034
2036
2038
2040
2042
2044
2046
2048
2050
Gene
ra�o
n(GWh)
Coal Hydro Gas Wind Diesel/FO Nuclear Bio Solar HydroROR
21%29%
47%53% 57% 57%
29%
40%
29% 15% 12% 10%
46%
31% 20%
19% 14%11%
4%5%
6%
5%2% 4% 8%2% 3% 3%4% 5% 5%
0%
10%
20%
30%
40%
50%
60%
70%
80%
90%
100%
2010 2015 2020 2030 2040 2050
Gen
eraf
onM
ix
Coal Hydro Gas Wind Diesel/FO Nuclear Bio Solar HydroROR
BAUProjection
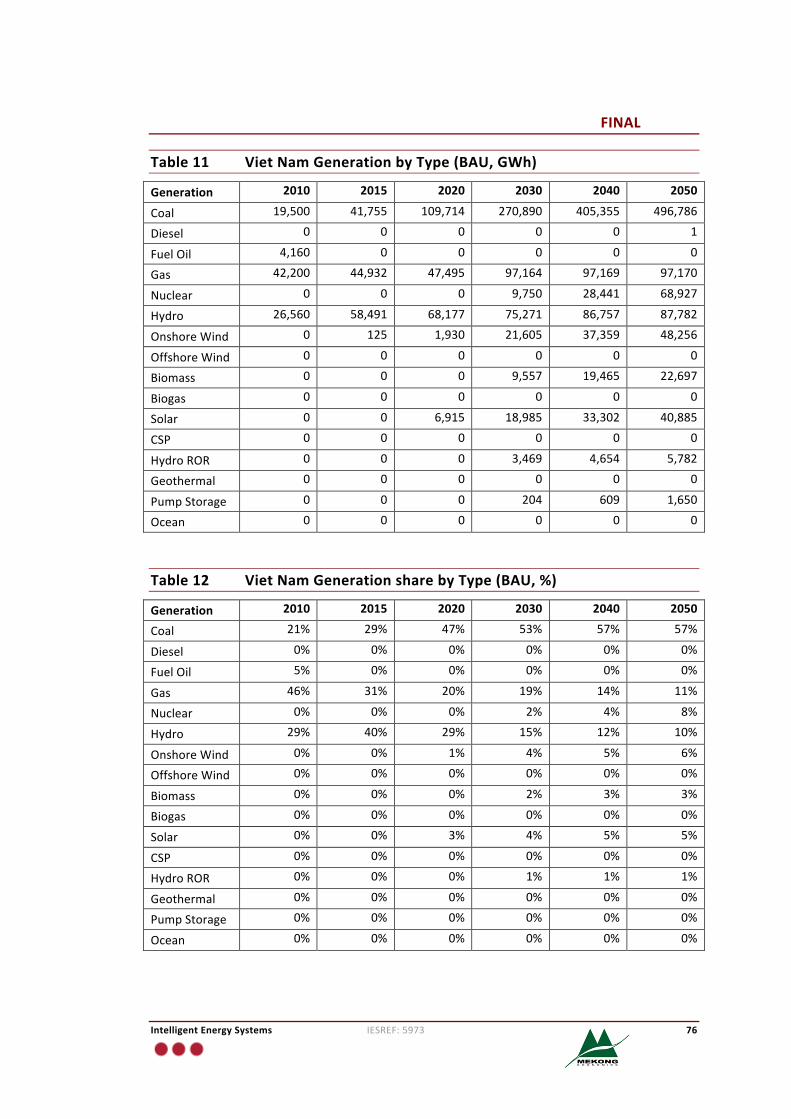
FINAL
IntelligentEnergySystems IESREF:5973 76
Table11 VietNamGenerationbyType(BAU,GWh)
Generation 2010 2015 2020 2030 2040 2050
Coal 19,500 41,755 109,714 270,890 405,355 496,786
Diesel 0 0 0 0 0 1
FuelOil 4,160 0 0 0 0 0
Gas 42,200 44,932 47,495 97,164 97,169 97,170
Nuclear 0 0 0 9,750 28,441 68,927
Hydro 26,560 58,491 68,177 75,271 86,757 87,782
OnshoreWind 0 125 1,930 21,605 37,359 48,256
OffshoreWind 0 0 0 0 0 0
Biomass 0 0 0 9,557 19,465 22,697
Biogas 0 0 0 0 0 0
Solar 0 0 6,915 18,985 33,302 40,885
CSP 0 0 0 0 0 0
HydroROR 0 0 0 3,469 4,654 5,782
Geothermal 0 0 0 0 0 0
PumpStorage 0 0 0 204 609 1,650
Ocean 0 0 0 0 0 0
Table12 VietNamGenerationsharebyType(BAU,%)
Generation 2010 2015 2020 2030 2040 2050
Coal 21% 29% 47% 53% 57% 57%
Diesel 0% 0% 0% 0% 0% 0%
FuelOil 5% 0% 0% 0% 0% 0%
Gas 46% 31% 20% 19% 14% 11%
Nuclear 0% 0% 0% 2% 4% 8%
Hydro 29% 40% 29% 15% 12% 10%
OnshoreWind 0% 0% 1% 4% 5% 6%
OffshoreWind 0% 0% 0% 0% 0% 0%
Biomass 0% 0% 0% 2% 3% 3%
Biogas 0% 0% 0% 0% 0% 0%
Solar 0% 0% 3% 4% 5% 5%
CSP 0% 0% 0% 0% 0% 0%
HydroROR 0% 0% 0% 1% 1% 1%
Geothermal 0% 0% 0% 0% 0% 0%
PumpStorage 0% 0% 0% 0% 0% 0%
Ocean 0% 0% 0% 0% 0% 0%
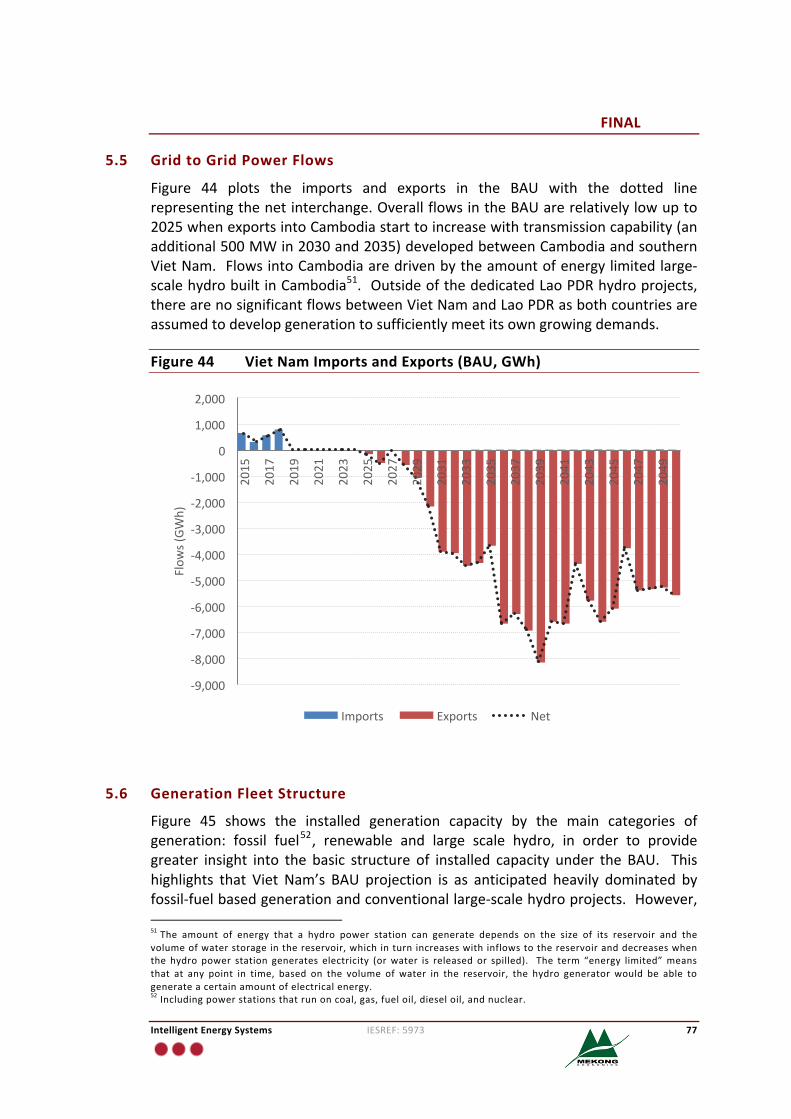
FINAL
IntelligentEnergySystems IESREF:5973 77
5.5 GridtoGridPowerFlows
Figure 44 plots the imports and exports in the BAU with the dotted linerepresentingthenetinterchange.OverallflowsintheBAUarerelativelylowupto2025whenexportsintoCambodiastarttoincreasewithtransmissioncapability(anadditional500MWin2030and2035)developedbetweenCambodiaandsouthernVietNam.FlowsintoCambodiaaredrivenbytheamountofenergylimitedlarge-scalehydrobuiltinCambodia51.OutsideofthededicatedLaoPDRhydroprojects,therearenosignificantflowsbetweenVietNamandLaoPDRasbothcountriesareassumedtodevelopgenerationtosufficientlymeetitsowngrowingdemands.
Figure44 VietNamImportsandExports(BAU,GWh)
5.6 GenerationFleetStructure
Figure 45 shows the installed generation capacity by the main categories ofgeneration: fossil fuel52, renewable and large scale hydro, in order to providegreater insight into the basic structure of installed capacity under the BAU. Thishighlights that Viet Nam’s BAU projection is as anticipated heavily dominated byfossil-fuelbasedgenerationandconventionallarge-scalehydroprojects.However,51The amount of energy that a hydro power station can generate depends on the size of its reservoir and thevolumeofwaterstorageinthereservoir,whichinturnincreaseswithinflowstothereservoiranddecreaseswhenthe hydro power station generates electricity (orwater is released or spilled). The term “energy limited”meansthat at any point in time, based on the volume of water in the reservoir, the hydro generator would be able togenerateacertainamountofelectricalenergy.52Includingpowerstationsthatrunoncoal,gas,fueloil,dieseloil,andnuclear.
-9,000
-8,000
-7,000
-6,000
-5,000
-4,000
-3,000
-2,000
-1,000
0
1,000
2,000
2015
2017
2019
2021
2023
2025
2027
2029
2031
2033
2035
2037
2039
2041
2043
2045
2047
2049
Flow
s(GW
h)
Imports Exports Net
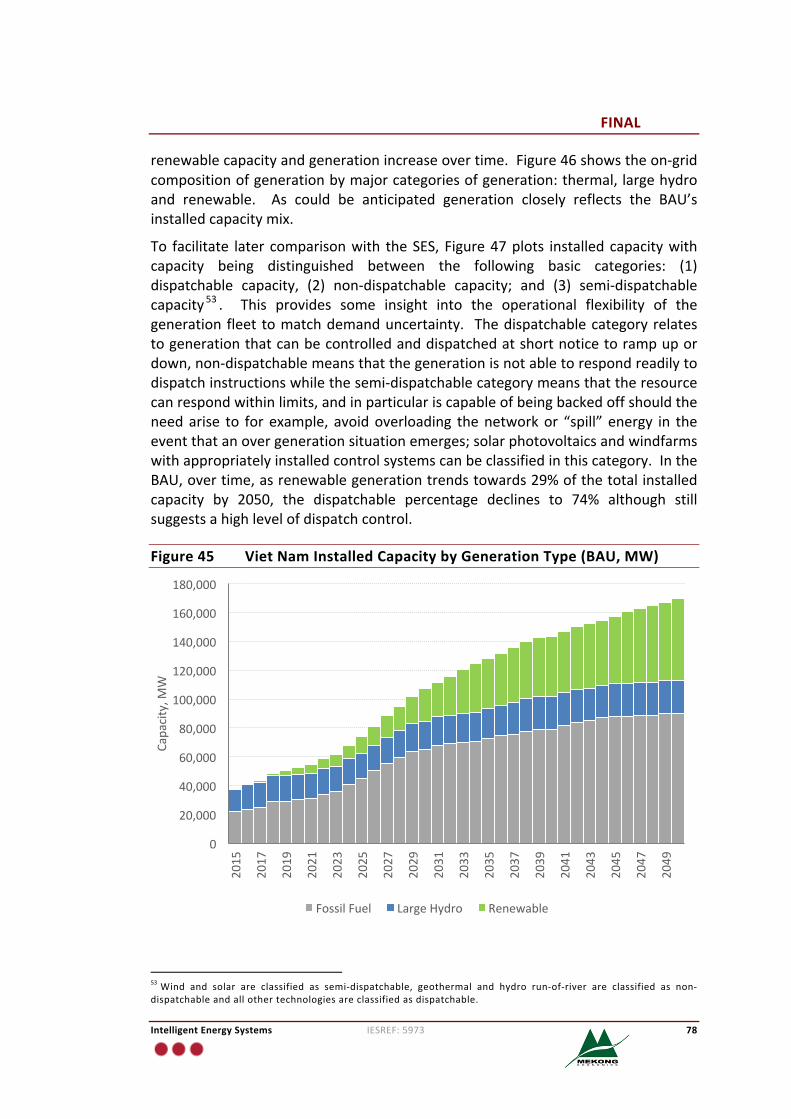
FINAL
IntelligentEnergySystems IESREF:5973 78
renewablecapacityandgenerationincreaseovertime.Figure46showstheon-gridcompositionofgenerationbymajorcategoriesofgeneration:thermal,largehydroand renewable. As could be anticipated generation closely reflects the BAU’sinstalledcapacitymix.
To facilitate later comparisonwith theSES, Figure47plots installedcapacitywithcapacity being distinguished between the following basic categories: (1)dispatchable capacity, (2) non-dispatchable capacity; and (3) semi-dispatchablecapacity 53 . This provides some insight into the operational flexibility of thegeneration fleet tomatchdemanduncertainty. Thedispatchablecategoryrelatestogenerationthatcanbecontrolledanddispatchedatshortnoticetorampupordown,non-dispatchablemeansthatthegenerationisnotabletorespondreadilytodispatchinstructionswhilethesemi-dispatchablecategorymeansthattheresourcecanrespondwithinlimits,andinparticulariscapableofbeingbackedoffshouldtheneedarise to forexample, avoidoverloading thenetworkor “spill” energy in theeventthatanovergenerationsituationemerges;solarphotovoltaicsandwindfarmswithappropriatelyinstalledcontrolsystemscanbeclassifiedinthiscategory.IntheBAU,overtime,asrenewablegenerationtrendstowards29%ofthetotalinstalledcapacity by 2050, the dispatchable percentage declines to 74% although stillsuggestsahighlevelofdispatchcontrol.
Figure45 VietNamInstalledCapacitybyGenerationType(BAU,MW)
53Wind and solar are classified as semi-dispatchable, geothermal and hydro run-of-river are classified as non-dispatchableandallothertechnologiesareclassifiedasdispatchable.
0
20,000
40,000
60,000
80,000
100,000
120,000
140,000
160,000
180,000
2015
2017
2019
2021
2023
2025
2027
2029
2031
2033
2035
2037
2039
2041
2043
2045
2047
2049
Capacity,M
W
FossilFuel LargeHydro Renewable
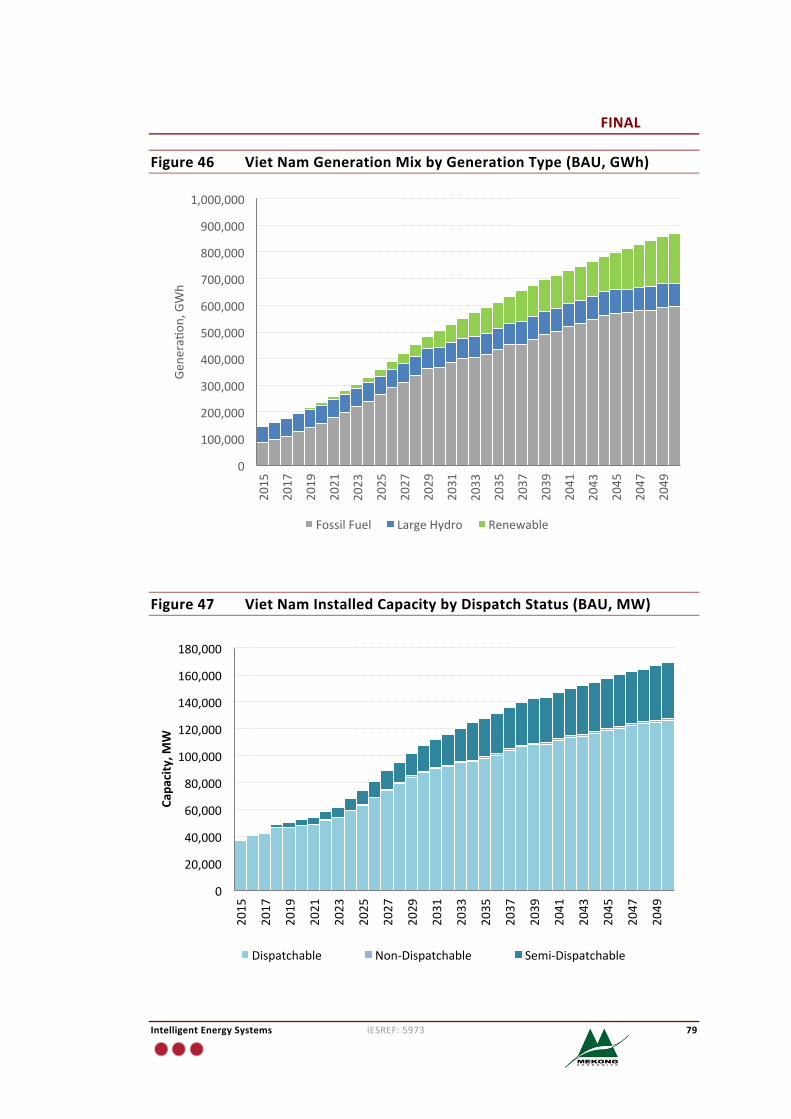
FINAL
IntelligentEnergySystems IESREF:5973 79
Figure46 VietNamGenerationMixbyGenerationType(BAU,GWh)
Figure47 VietNamInstalledCapacitybyDispatchStatus(BAU,MW)
0
100,000
200,000
300,000
400,000
500,000
600,000
700,000
800,000
900,000
1,000,000
2015
2017
2019
2021
2023
2025
2027
2029
2031
2033
2035
2037
2039
2041
2043
2045
2047
2049
Gene
ra�o
n,GWh
FossilFuel LargeHydro Renewable
0
20,000
40,000
60,000
80,000
100,000
120,000
140,000
160,000
180,000
2015
2017
2019
2021
2023
2025
2027
2029
2031
2033
2035
2037
2039
2041
2043
2045
2047
2049
Capa
city,M
W
Dispatchable Non-Dispatchable Semi-Dispatchable
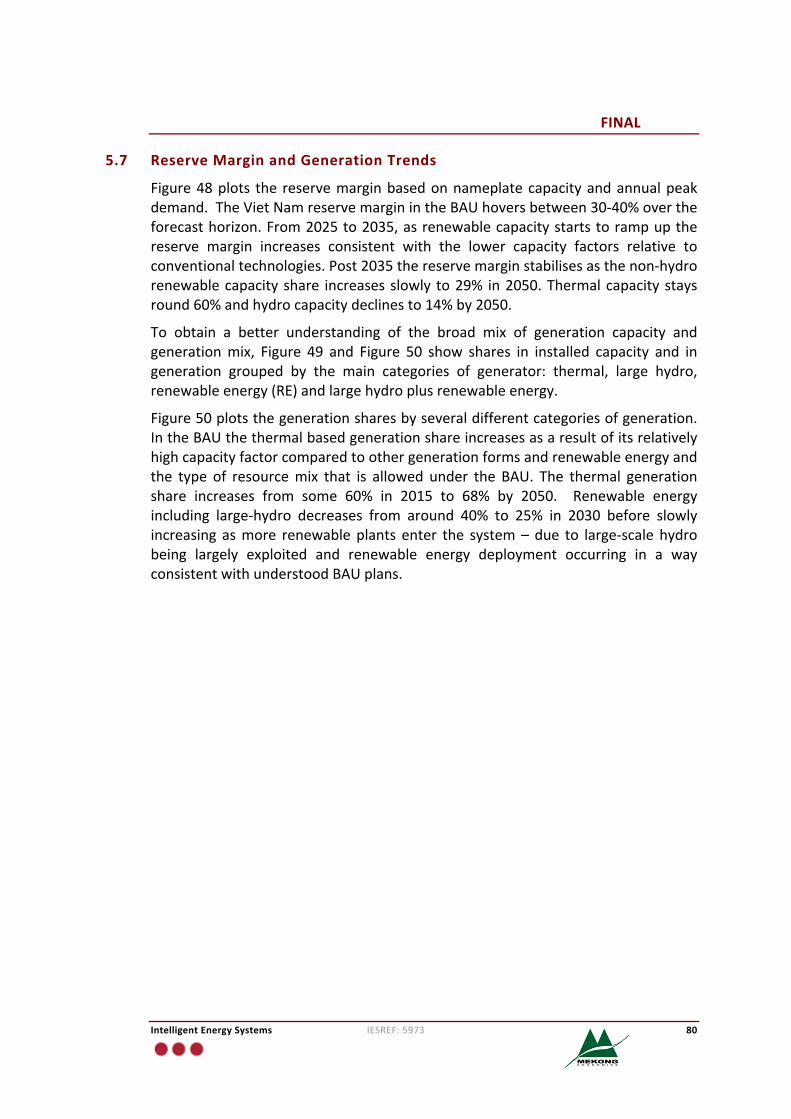
FINAL
IntelligentEnergySystems IESREF:5973 80
5.7 ReserveMarginandGenerationTrends
Figure48plots the reservemarginbasedonnameplatecapacityandannualpeakdemand.TheVietNamreservemarginintheBAUhoversbetween30-40%overtheforecasthorizon.From2025to2035,asrenewablecapacitystartstorampupthereserve margin increases consistent with the lower capacity factors relative toconventionaltechnologies.Post2035thereservemarginstabilisesasthenon-hydrorenewablecapacityshare increasesslowly to29% in2050.Thermalcapacitystaysround60%andhydrocapacitydeclinesto14%by2050.
To obtain a better understanding of the broad mix of generation capacity andgenerationmix, Figure 49 and Figure 50 show shares in installed capacity and ingeneration grouped by the main categories of generator: thermal, large hydro,renewableenergy(RE)andlargehydroplusrenewableenergy.
Figure50plotsthegenerationsharesbyseveraldifferentcategoriesofgeneration.IntheBAUthethermalbasedgenerationshareincreasesasaresultofitsrelativelyhighcapacityfactorcomparedtoothergenerationformsandrenewableenergyandthe type of resourcemix that is allowed under the BAU. The thermal generationshare increases from some 60% in 2015 to 68% by 2050. Renewable energyincluding large-hydro decreases from around 40% to 25% in 2030 before slowlyincreasing asmore renewableplants enter the system–due to large-scalehydrobeing largely exploited and renewable energy deployment occurring in a wayconsistentwithunderstoodBAUplans.
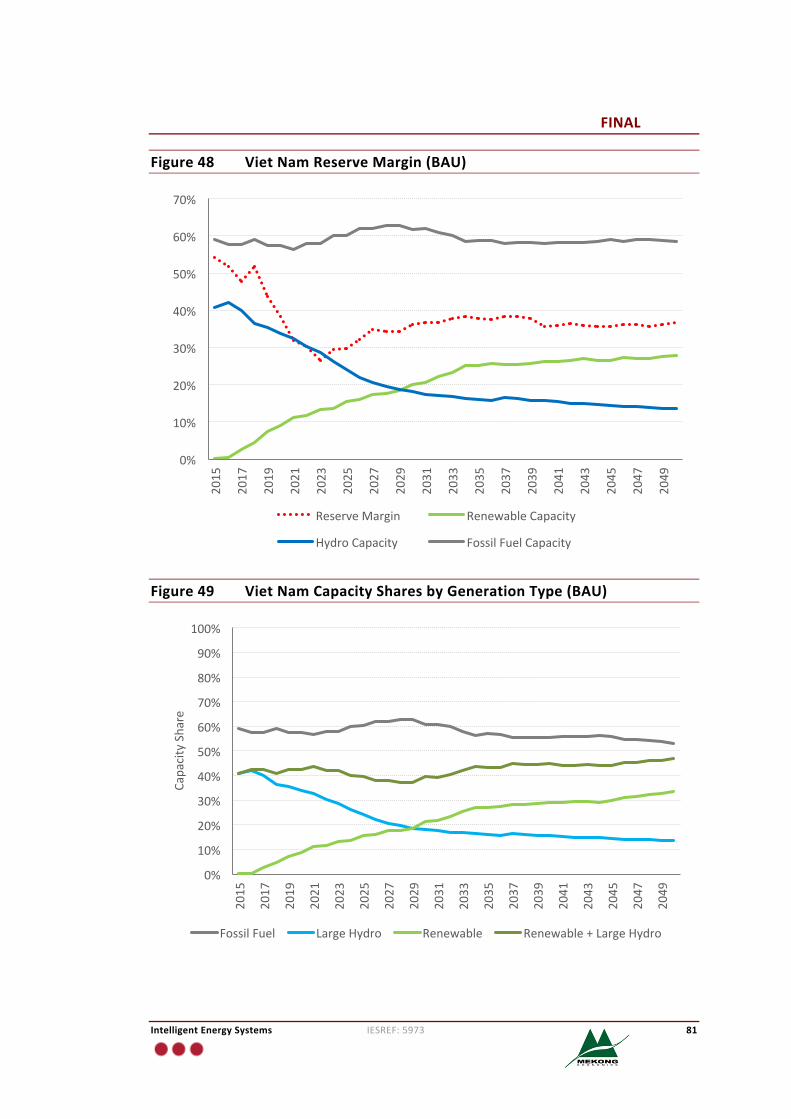
FINAL
IntelligentEnergySystems IESREF:5973 81
Figure48 VietNamReserveMargin(BAU)
Figure49 VietNamCapacitySharesbyGenerationType(BAU)
0%
10%
20%
30%
40%
50%
60%
70%2015
2017
2019
2021
2023
2025
2027
2029
2031
2033
2035
2037
2039
2041
2043
2045
2047
2049
ReserveMargin RenewableCapacity
HydroCapacity FossilFuelCapacity
0%
10%
20%
30%
40%
50%
60%
70%
80%
90%
100%
2015
2017
2019
2021
2023
2025
2027
2029
2031
2033
2035
2037
2039
2041
2043
2045
2047
2049
CapacityShare
FossilFuel LargeHydro Renewable Renewable+LargeHydro
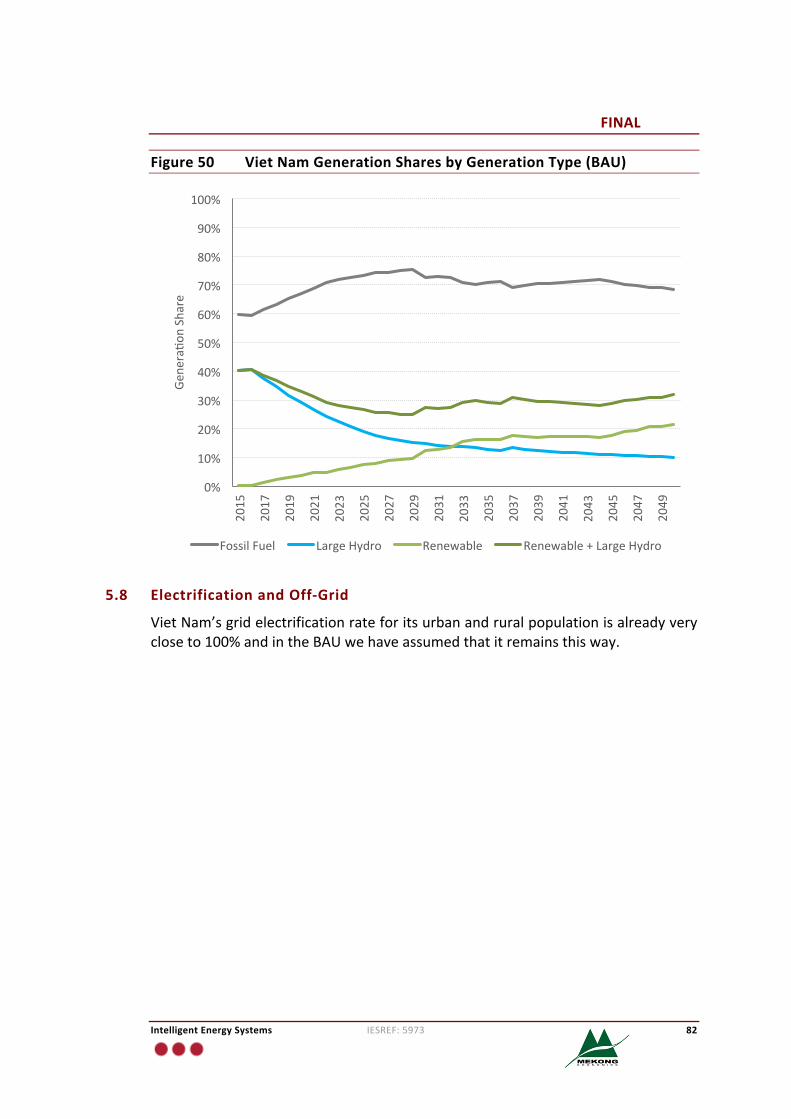
FINAL
IntelligentEnergySystems IESREF:5973 82
Figure50 VietNamGenerationSharesbyGenerationType(BAU)
5.8 ElectrificationandOff-Grid
VietNam’sgridelectrificationrateforitsurbanandruralpopulationisalreadyverycloseto100%andintheBAUwehaveassumedthatitremainsthisway.
0%
10%
20%
30%
40%
50%
60%
70%
80%
90%
100%
2015
2017
2019
2021
2023
2025
2027
2029
2031
2033
2035
2037
2039
2041
2043
2045
2047
2049
Gene
ra�o
nShare
FossilFuel LargeHydro Renewable Renewable+LargeHydro
FINAL
IntelligentEnergySystems IESREF:5973 83
6 SustainableEnergySectorScenario
6.1 SustainableEnergySectorScenario
Asnotedearlier,VietNamhasexperiencedaperiodofveryhighdemandgrowthinthe recent past and this has placed pressure on the Government to formulateappropriateplanstoensurethattheelectricity industrycancontinuetoprovideastable supply of electricity to endusers, thereby ensuring the country’s economycan continue to expand. As outlined in section 3, VietNamhas awide range ofoptionsthatcanbeexploited.ThestrategyadoptedintheBAUwasbasedlargelyon the development of fossil fuel options, a limited number of resources inneighbouringLaoPDRandCambodiatoexportpowertoVietNam,minimisefurtherexploitationoflargescalehydroresourceswithinVietNamasitisconsideredtobean exhausted resource, and make some progress in terms of integration ofrenewableenergyintothenationalpowersystemandtoenhanceenergyefficiency.In contrast to the BAU scenario, the SES seeks to transition electricity demandtowards the best practice benchmarks of other developed countries in terms ofenergy efficiency, maximise the renewable energy development, cease thedevelopment of fossil fuel resources, and make sustainable and prudent use ofundeveloped conventional hydro resources. The SES takes advantageof existing,technicallyprovenandcommerciallyviablerenewableenergytechnologies.
6.2 ProjectedDemandGrowth
Figure51plotsVietNam’sforecastenergyconsumptionfrom2015to2050withtheBAUtrajectorychartedwithadashedlineforcomparison.Theenergysavingsare due to allowing Viet Nam’s energy demand to transition towards energyintensity benchmarks of comparable developed countries in Asia 54 . The SESdemandgrowsataslowerrateof4.0%paovertheperiodfrom2015to2050withthe commercial sector at 6.3% pa, industry growing at 4.3% pa and residentialsectorgrowingat1.3%pa.Uptakeofelectric transportoptionsoccur from2025onwardsandgrowsto28TWhaccountingfor5%oftotaldemandby2050,or20%ofallvehicles.
Figure 52 plots peak demand of Viet Nam. The firm blue line represents peakdemand before any flexible demand side resources have been scheduled 55 .Flexibledemandresponseis“dispatched”inthemodelinlinewiththeleastcostdispatchofall resources in thepowersystem. Thedashed line representswhatpeak demand became as a consequence of scheduling (“time-shifting”)54Vietnam’s industrial intensity was trended towards levels commensuratewith South Korea (2014) by 2035 andallowedtodeclineatthesamerateto2050.55Flexibledemandresponse is “dispatched” in themodel in linewith the leastcostdispatchofall resources. Thesolidlinerepresentspeakdemandasputinthemodel,whilethedashedlinerepresentswhatpeakdemandendedup being as a consequence of shifting demand from one period of time to another. This includes scheduling ofloads associated with battery storage devices and rescheduling (time-shifting) commercial, industrial andresidentialloads.
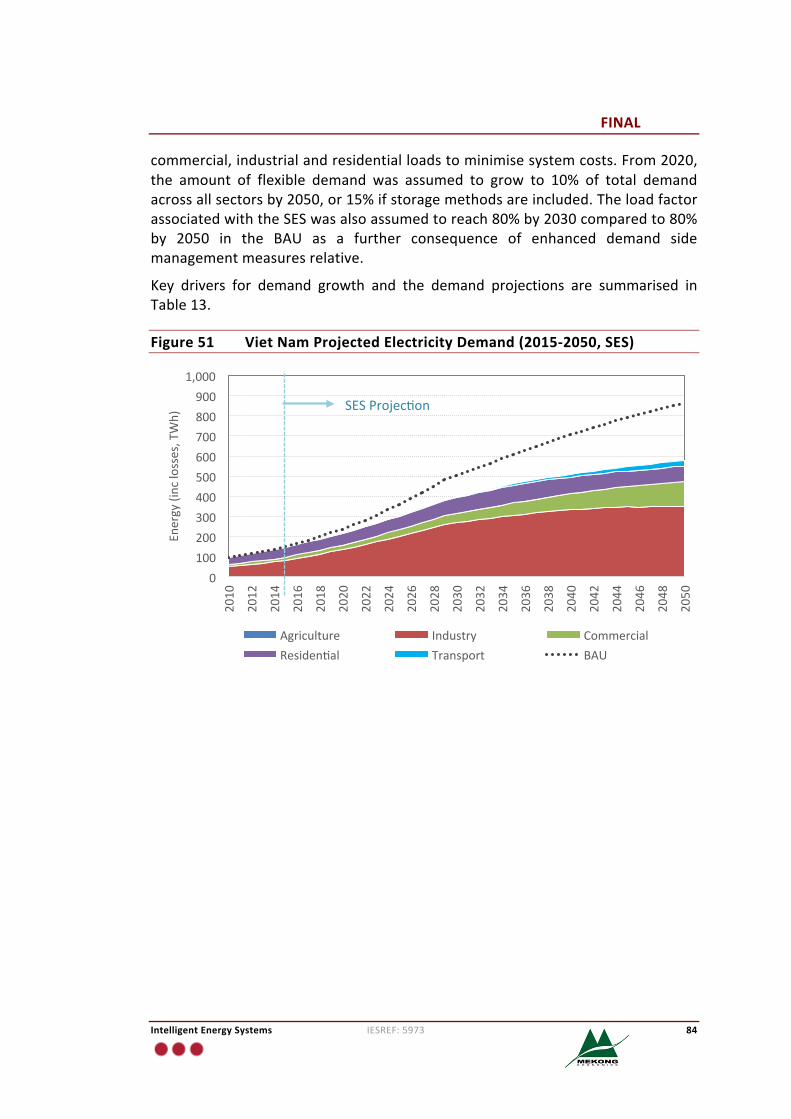
FINAL
IntelligentEnergySystems IESREF:5973 84
commercial,industrialandresidentialloadstominimisesystemcosts.From2020,the amount of flexible demand was assumed to grow to 10% of total demandacrossallsectorsby2050,or15%ifstoragemethodsareincluded.TheloadfactorassociatedwiththeSESwasalsoassumedtoreach80%by2030comparedto80%by 2050 in the BAU as a further consequence of enhanced demand sidemanagementmeasuresrelative.
Key drivers for demand growth and the demand projections are summarised inTable13.
Figure51 VietNamProjectedElectricityDemand(2015-2050,SES)
0100200300400500600700800900
1,000
2010
2012
2014
2016
2018
2020
2022
2024
2026
2028
2030
2032
2034
2036
2038
2040
2042
2044
2046
2048
2050
Energy(inclosses,TWh)
Agriculture Industry CommercialResiden�al Transport BAU
SESProjec�on
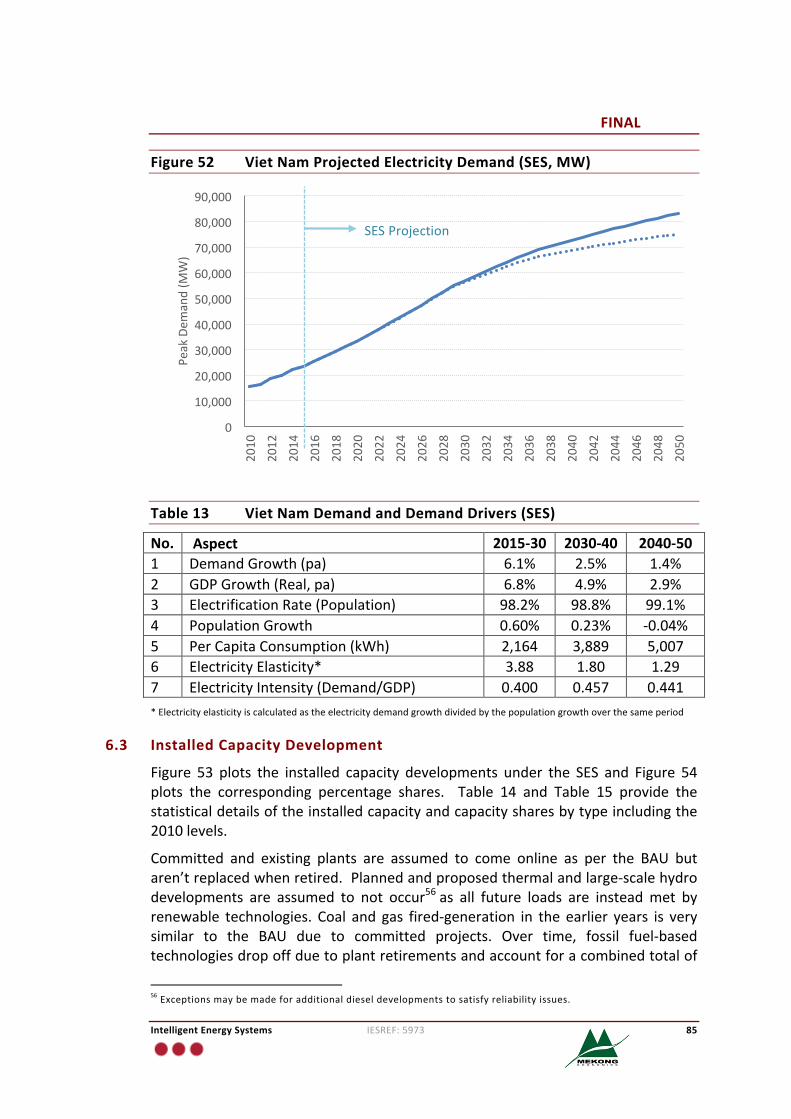
FINAL
IntelligentEnergySystems IESREF:5973 85
Figure52 VietNamProjectedElectricityDemand(SES,MW)
Table13 VietNamDemandandDemandDrivers(SES)
No. Aspect 2015-30 2030-40 2040-501 DemandGrowth(pa) 6.1% 2.5% 1.4%2 GDPGrowth(Real,pa) 6.8% 4.9% 2.9%3 ElectrificationRate(Population) 98.2% 98.8% 99.1%4 PopulationGrowth 0.60% 0.23% -0.04%5 PerCapitaConsumption(kWh) 2,164 3,889 5,0076 ElectricityElasticity* 3.88 1.80 1.297 ElectricityIntensity(Demand/GDP) 0.400 0.457 0.441*Electricityelasticityiscalculatedastheelectricitydemandgrowthdividedbythepopulationgrowthoverthesameperiod
6.3 InstalledCapacityDevelopment
Figure 53 plots the installed capacity developments under the SES and Figure 54plots the corresponding percentage shares. Table 14 and Table 15 provide thestatisticaldetailsoftheinstalledcapacityandcapacitysharesbytypeincludingthe2010levels.
Committed and existing plants are assumed to come online as per the BAU butaren’treplacedwhenretired.Plannedandproposedthermalandlarge-scalehydrodevelopments are assumed to not occur56as all future loads are insteadmet byrenewable technologies. Coal and gas fired-generation in the earlier years is verysimilar to the BAU due to committed projects. Over time, fossil fuel-basedtechnologiesdropoffduetoplantretirementsandaccountforacombinedtotalof
56Exceptionsmaybemadeforadditionaldieseldevelopmentstosatisfyreliabilityissues.
0
10,000
20,000
30,000
40,000
50,000
60,000
70,000
80,000
90,000
2010
2012
2014
2016
2018
2020
2022
2024
2026
2028
2030
2032
2034
2036
2038
2040
2042
2044
2046
2048
2050
PeakDem
and(M
W)
SESProjection
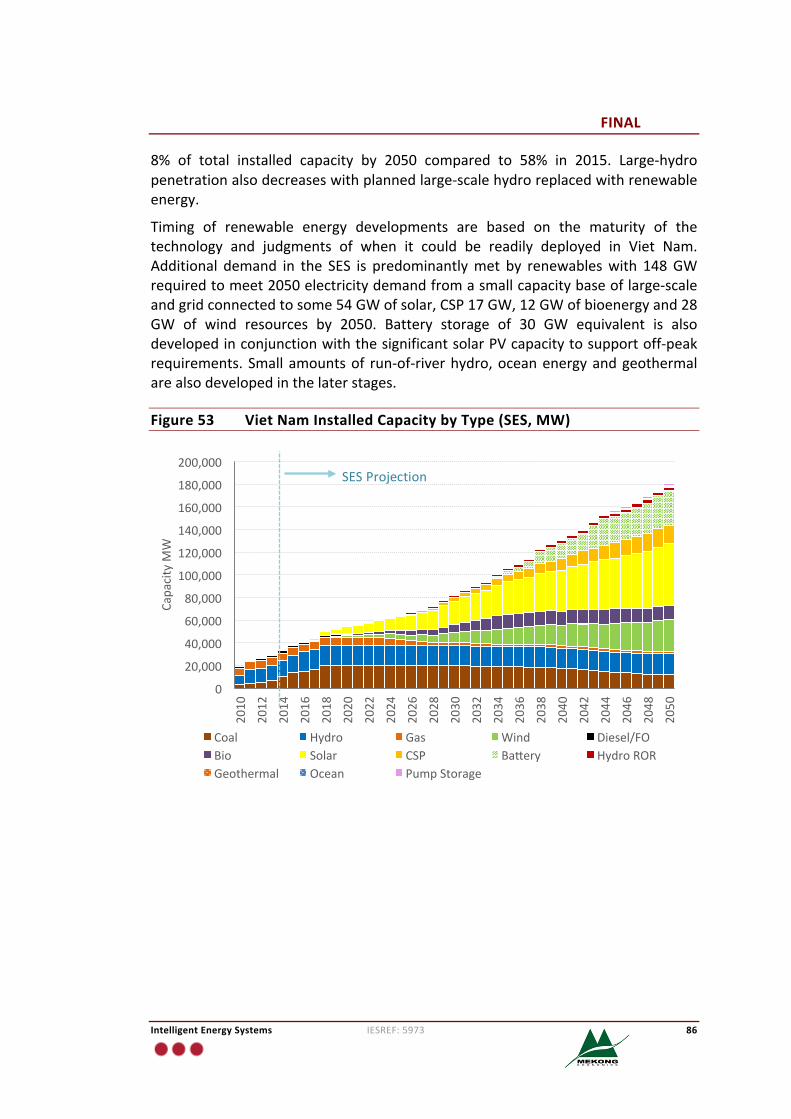
FINAL
IntelligentEnergySystems IESREF:5973 86
8% of total installed capacity by 2050 compared to 58% in 2015. Large-hydropenetrationalsodecreaseswithplannedlarge-scalehydroreplacedwithrenewableenergy.
Timing of renewable energy developments are based on the maturity of thetechnology and judgments of when it could be readily deployed in Viet Nam.Additional demand in the SES is predominantlymet by renewableswith 148GWrequiredtomeet2050electricitydemandfromasmallcapacitybaseoflarge-scaleandgridconnectedtosome54GWofsolar,CSP17GW,12GWofbioenergyand28GW of wind resources by 2050. Battery storage of 30 GW equivalent is alsodevelopedinconjunctionwiththesignificantsolarPVcapacitytosupportoff-peakrequirements. Smallamountsof run-of-riverhydro,oceanenergyandgeothermalarealsodevelopedinthelaterstages.
Figure53 VietNamInstalledCapacitybyType(SES,MW)
0
20,000
40,000
60,000
80,000
100,000
120,000
140,000
160,000
180,000
200,000
2010
2012
2014
2016
2018
2020
2022
2024
2026
2028
2030
2032
2034
2036
2038
2040
2042
2044
2046
2048
2050
CapacityM
W
Coal Hydro Gas Wind Diesel/FOBio Solar CSP Ba�ery HydroRORGeothermal Ocean PumpStorage
SESProjection
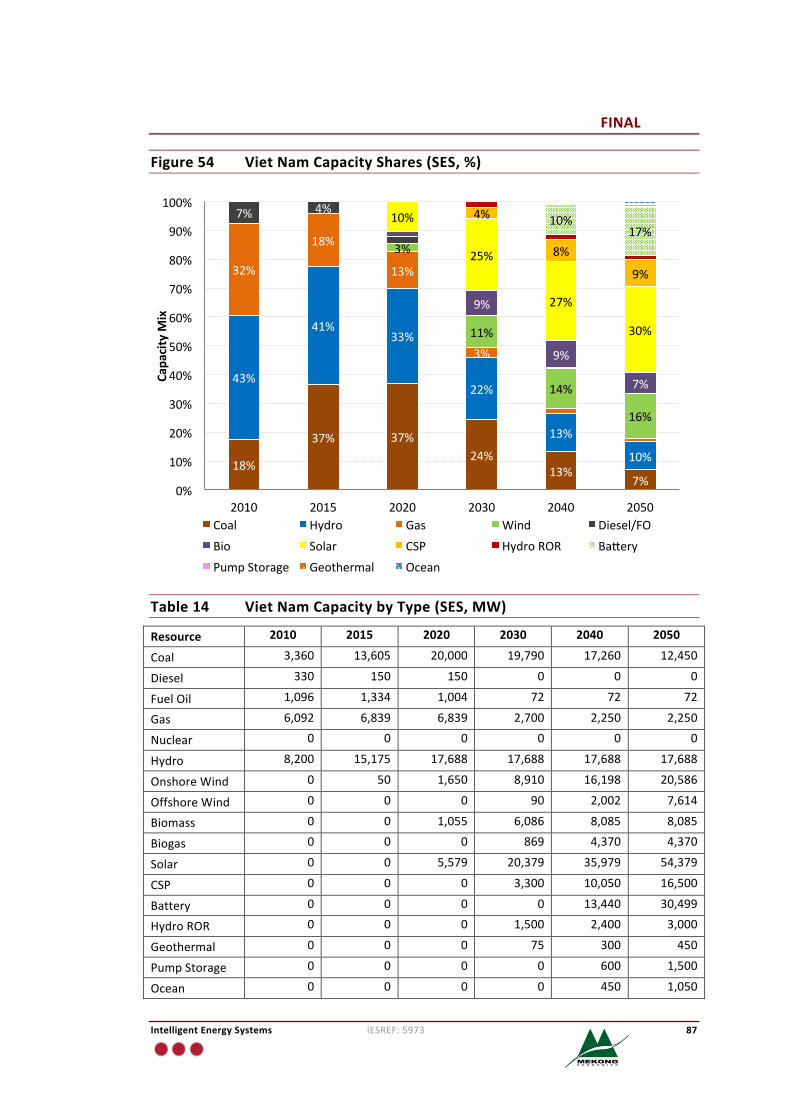
FINAL
IntelligentEnergySystems IESREF:5973 87
Figure54 VietNamCapacityShares(SES,%)
Table14 VietNamCapacitybyType(SES,MW)
Resource 2010 2015 2020 2030 2040 2050
Coal 3,360 13,605 20,000 19,790 17,260 12,450
Diesel 330 150 150 0 0 0
FuelOil 1,096 1,334 1,004 72 72 72
Gas 6,092 6,839 6,839 2,700 2,250 2,250
Nuclear 0 0 0 0 0 0
Hydro 8,200 15,175 17,688 17,688 17,688 17,688
OnshoreWind 0 50 1,650 8,910 16,198 20,586
OffshoreWind 0 0 0 90 2,002 7,614
Biomass 0 0 1,055 6,086 8,085 8,085
Biogas 0 0 0 869 4,370 4,370
Solar 0 0 5,579 20,379 35,979 54,379
CSP 0 0 0 3,300 10,050 16,500
Battery 0 0 0 0 13,440 30,499
HydroROR 0 0 0 1,500 2,400 3,000
Geothermal 0 0 0 75 300 450
PumpStorage 0 0 0 0 600 1,500
Ocean 0 0 0 0 450 1,050
18%
37% 37%24%
13%7%
43%
41%33%
22%
13%
10%
32%
18%
13%
3%
3%
11%
14%
16%
7% 4%
9%
9%
7%
10%
25%
27%
30%
4%
8%
9%
10%17%
0%
10%
20%
30%
40%
50%
60%
70%
80%
90%
100%
2010 2015 2020 2030 2040 2050
Capa
cityM
ix
Coal Hydro Gas Wind Diesel/FO
Bio Solar CSP HydroROR Ba�ery
PumpStorage Geothermal Ocean
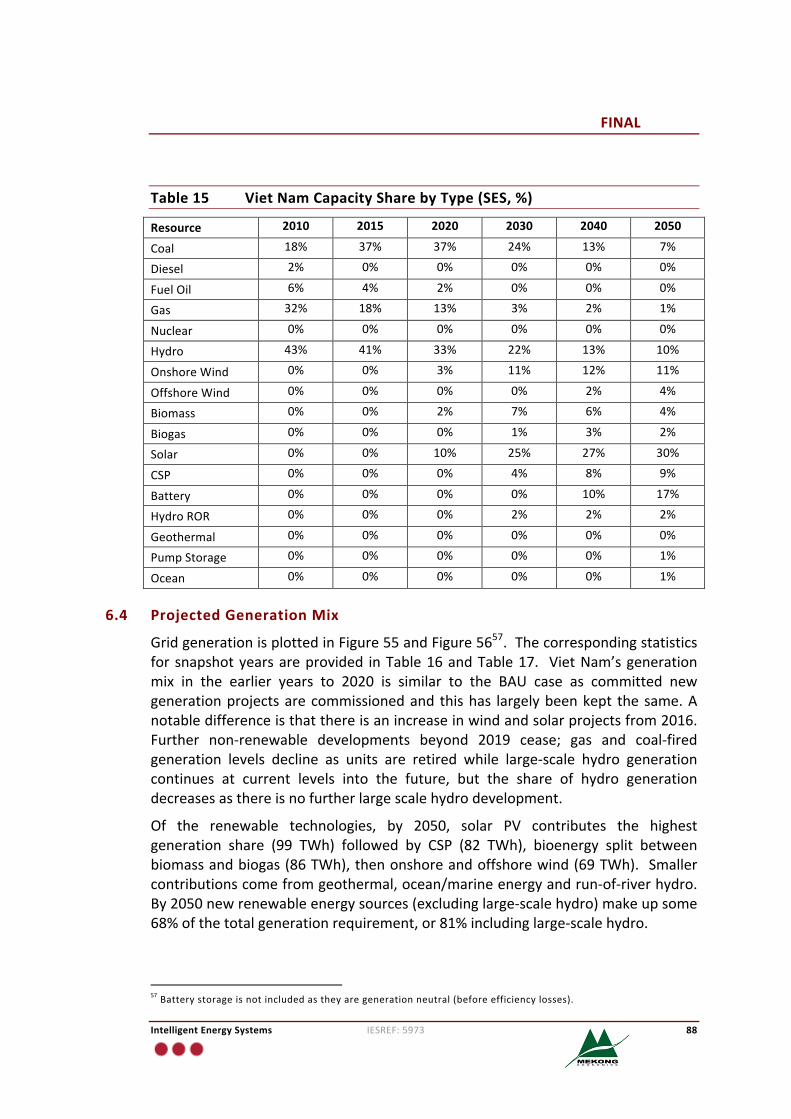
FINAL
IntelligentEnergySystems IESREF:5973 88
Table15 VietNamCapacitySharebyType(SES,%)
Resource 2010 2015 2020 2030 2040 2050
Coal 18% 37% 37% 24% 13% 7%
Diesel 2% 0% 0% 0% 0% 0%
FuelOil 6% 4% 2% 0% 0% 0%
Gas 32% 18% 13% 3% 2% 1%
Nuclear 0% 0% 0% 0% 0% 0%
Hydro 43% 41% 33% 22% 13% 10%
OnshoreWind 0% 0% 3% 11% 12% 11%
OffshoreWind 0% 0% 0% 0% 2% 4%
Biomass 0% 0% 2% 7% 6% 4%
Biogas 0% 0% 0% 1% 3% 2%
Solar 0% 0% 10% 25% 27% 30%
CSP 0% 0% 0% 4% 8% 9%
Battery 0% 0% 0% 0% 10% 17%
HydroROR 0% 0% 0% 2% 2% 2%
Geothermal 0% 0% 0% 0% 0% 0%
PumpStorage 0% 0% 0% 0% 0% 1%
Ocean 0% 0% 0% 0% 0% 1%
6.4 ProjectedGenerationMix
GridgenerationisplottedinFigure55andFigure5657.Thecorrespondingstatisticsforsnapshotyearsareprovided inTable16andTable17. VietNam’sgenerationmix in the earlier years to 2020 is similar to the BAU case as committed newgenerationprojectsarecommissionedand thishas largelybeenkept thesame.Anotabledifferenceisthatthereisanincreaseinwindandsolarprojectsfrom2016.Further non-renewable developments beyond 2019 cease; gas and coal-firedgeneration levels decline as units are retired while large-scale hydro generationcontinues at current levels into the future, but the share of hydro generationdecreasesasthereisnofurtherlargescalehydrodevelopment.
Of the renewable technologies, by 2050, solar PV contributes the highestgeneration share (99 TWh) followed by CSP (82 TWh), bioenergy split betweenbiomassandbiogas(86TWh),thenonshoreandoffshorewind(69TWh). Smallercontributionscomefromgeothermal,ocean/marineenergyandrun-of-riverhydro.By2050newrenewableenergysources(excludinglarge-scalehydro)makeupsome68%ofthetotalgenerationrequirement,or81%includinglarge-scalehydro.
57Batterystorageisnotincludedastheyaregenerationneutral(beforeefficiencylosses).
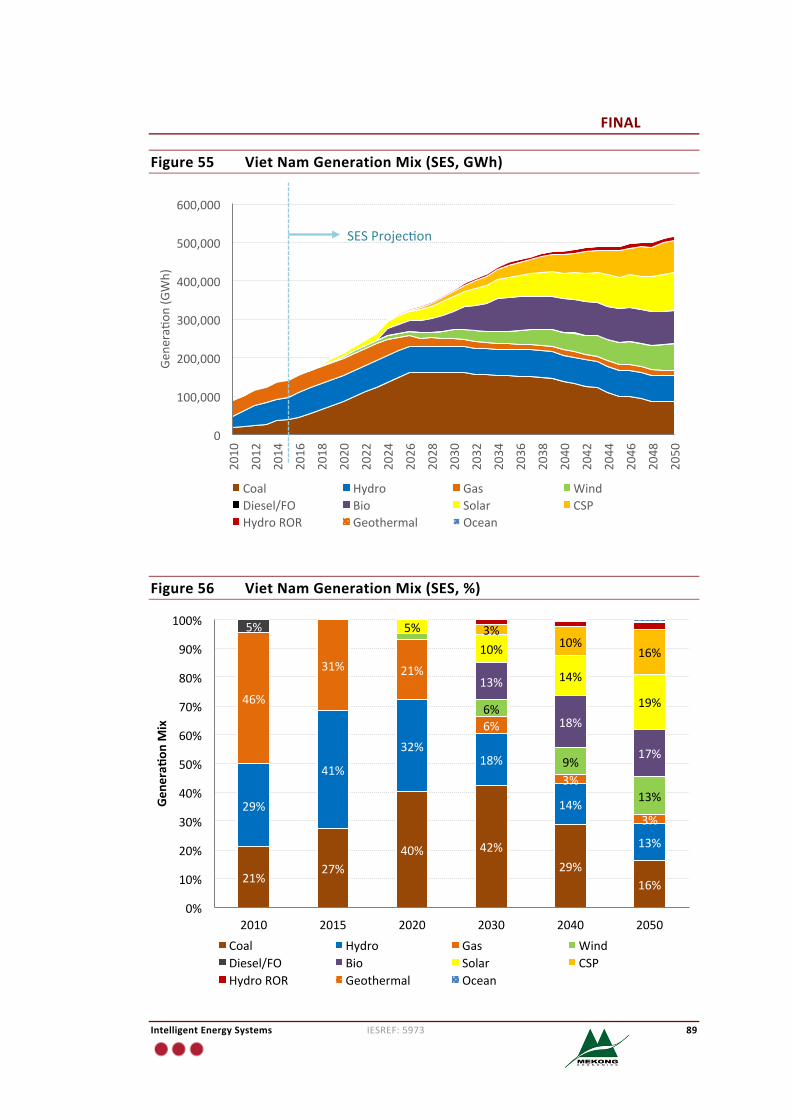
FINAL
IntelligentEnergySystems IESREF:5973 89
Figure55 VietNamGenerationMix(SES,GWh)
Figure56 VietNamGenerationMix(SES,%)
0
100,000
200,000
300,000
400,000
500,000
600,000
2010
2012
2014
2016
2018
2020
2022
2024
2026
2028
2030
2032
2034
2036
2038
2040
2042
2044
2046
2048
2050
Gene
ra�o
n(GWh)
Coal Hydro Gas WindDiesel/FO Bio Solar CSPHydroROR Geothermal Ocean
SESProjec�on
21%27%
40% 42%29%
16%
29%
41%
32%18%
14%
13%
46%
31% 21%
6%
3%
3%
6%
9%
13%
5%
13%
18%
17%
5%
10%
14%
19%
3%10%
16%
0%
10%
20%
30%
40%
50%
60%
70%
80%
90%
100%
2010 2015 2020 2030 2040 2050
Gen
eraf
onM
ix
Coal Hydro Gas WindDiesel/FO Bio Solar CSPHydroROR Geothermal Ocean
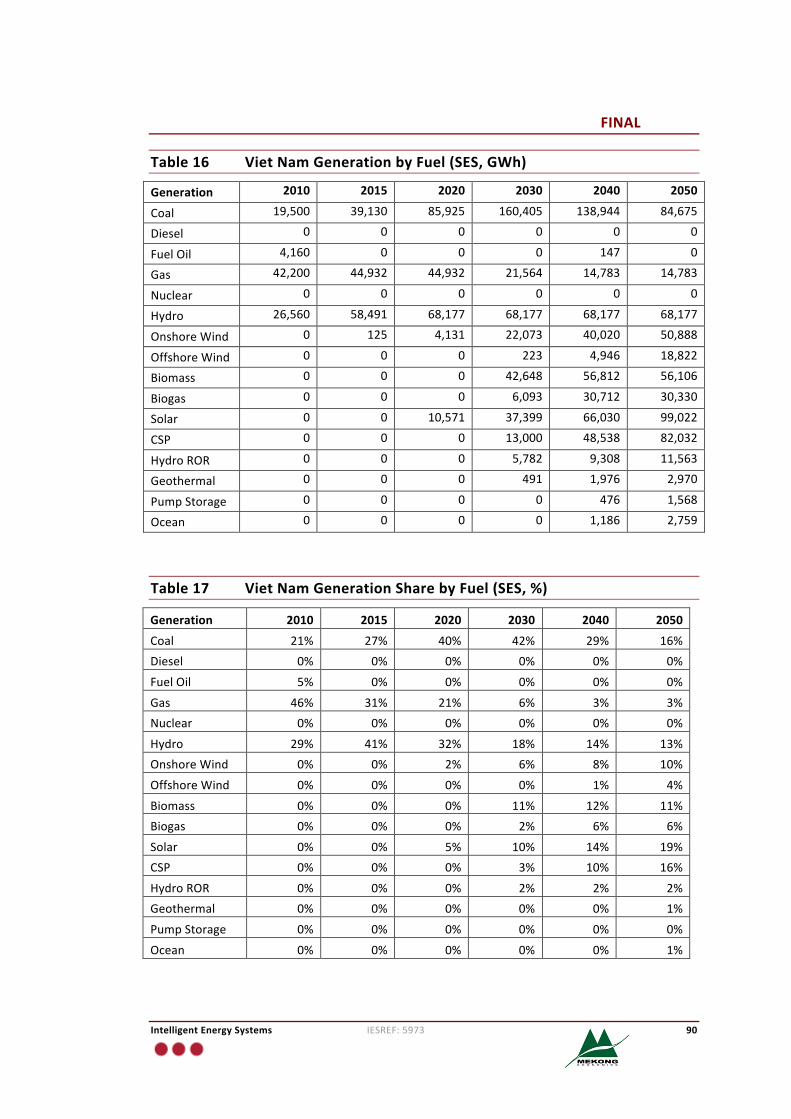
FINAL
IntelligentEnergySystems IESREF:5973 90
Table16 VietNamGenerationbyFuel(SES,GWh)
Generation 2010 2015 2020 2030 2040 2050
Coal 19,500 39,130 85,925 160,405 138,944 84,675
Diesel 0 0 0 0 0 0
FuelOil 4,160 0 0 0 147 0
Gas 42,200 44,932 44,932 21,564 14,783 14,783
Nuclear 0 0 0 0 0 0
Hydro 26,560 58,491 68,177 68,177 68,177 68,177
OnshoreWind 0 125 4,131 22,073 40,020 50,888
OffshoreWind 0 0 0 223 4,946 18,822
Biomass 0 0 0 42,648 56,812 56,106
Biogas 0 0 0 6,093 30,712 30,330
Solar 0 0 10,571 37,399 66,030 99,022
CSP 0 0 0 13,000 48,538 82,032
HydroROR 0 0 0 5,782 9,308 11,563
Geothermal 0 0 0 491 1,976 2,970
PumpStorage 0 0 0 0 476 1,568
Ocean 0 0 0 0 1,186 2,759
Table17 VietNamGenerationSharebyFuel(SES,%)
Generation 2010 2015 2020 2030 2040 2050
Coal 21% 27% 40% 42% 29% 16%Diesel 0% 0% 0% 0% 0% 0%
FuelOil 5% 0% 0% 0% 0% 0%
Gas 46% 31% 21% 6% 3% 3%Nuclear 0% 0% 0% 0% 0% 0%
Hydro 29% 41% 32% 18% 14% 13%OnshoreWind 0% 0% 2% 6% 8% 10%
OffshoreWind 0% 0% 0% 0% 1% 4%
Biomass 0% 0% 0% 11% 12% 11%Biogas 0% 0% 0% 2% 6% 6%
Solar 0% 0% 5% 10% 14% 19%CSP 0% 0% 0% 3% 10% 16%
HydroROR 0% 0% 0% 2% 2% 2%Geothermal 0% 0% 0% 0% 0% 1%
PumpStorage 0% 0% 0% 0% 0% 0%
Ocean 0% 0% 0% 0% 0% 1%
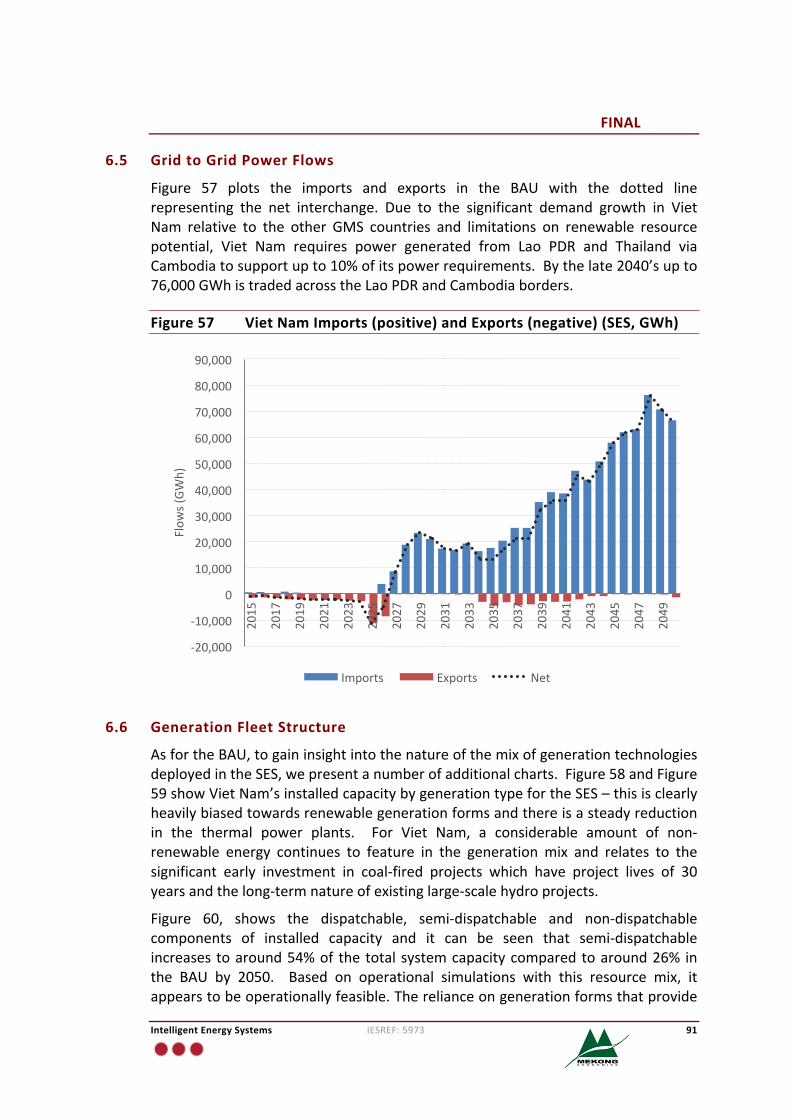
FINAL
IntelligentEnergySystems IESREF:5973 91
6.5 GridtoGridPowerFlows
Figure 57 plots the imports and exports in the BAU with the dotted linerepresenting the net interchange. Due to the significant demand growth in VietNam relative to the other GMS countries and limitations on renewable resourcepotential, Viet Nam requires power generated from Lao PDR and Thailand viaCambodiatosupportupto10%ofitspowerrequirements.Bythelate2040’supto76,000GWhistradedacrosstheLaoPDRandCambodiaborders.
Figure57 VietNamImports(positive)andExports(negative)(SES,GWh)
6.6 GenerationFleetStructure
AsfortheBAU,togaininsightintothenatureofthemixofgenerationtechnologiesdeployedintheSES,wepresentanumberofadditionalcharts.Figure58andFigure59showVietNam’sinstalledcapacitybygenerationtypefortheSES–thisisclearlyheavilybiasedtowardsrenewablegenerationformsandthereisasteadyreductionin the thermal power plants. For Viet Nam, a considerable amount of non-renewable energy continues to feature in the generationmix and relates to thesignificant early investment in coal-fired projects which have project lives of 30yearsandthelong-termnatureofexistinglarge-scalehydroprojects.
Figure 60, shows the dispatchable, semi-dispatchable and non-dispatchablecomponents of installed capacity and it can be seen that semi-dispatchableincreases toaround54%of thetotalsystemcapacitycomparedtoaround26% inthe BAU by 2050. Based on operational simulations with this resource mix, itappearstobeoperationallyfeasible.Therelianceongenerationformsthatprovide
-20,000
-10,000
0
10,000
20,000
30,000
40,000
50,000
60,000
70,000
80,000
90,000
2015
2017
2019
2021
2023
2025
2027
2029
2031
2033
2035
2037
2039
2041
2043
2045
2047
2049
Flow
s(GW
h)
Imports Exports Net
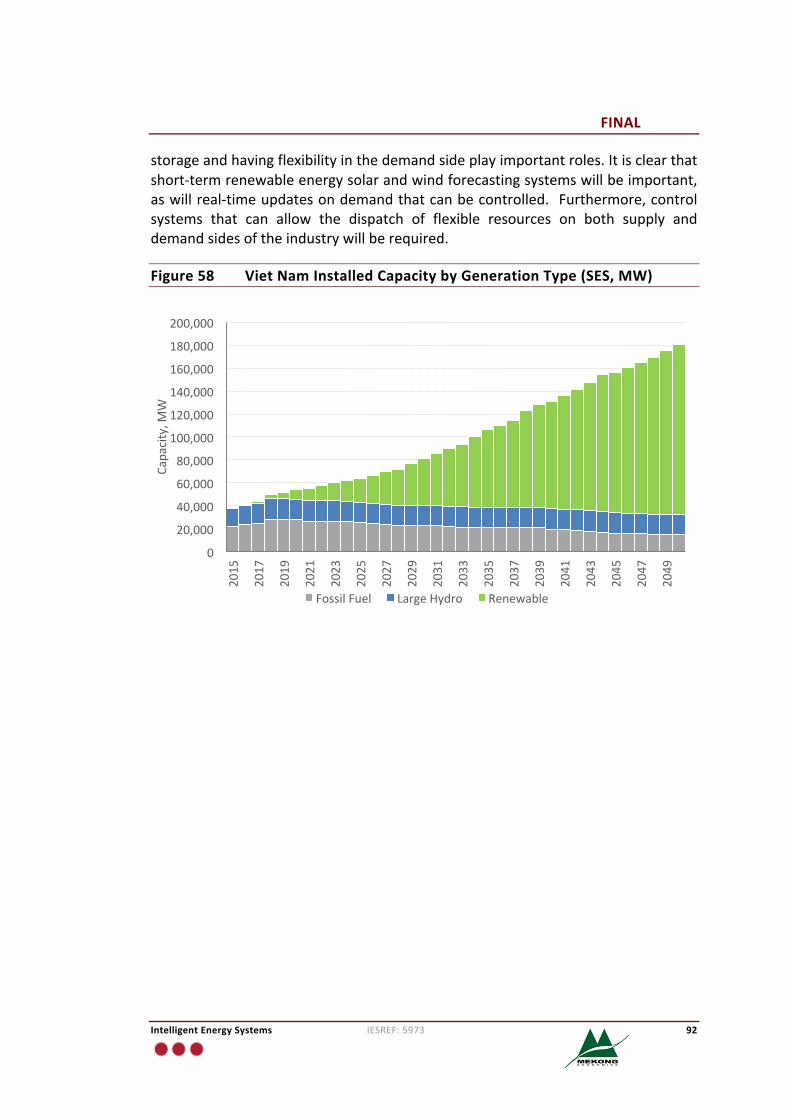
FINAL
IntelligentEnergySystems IESREF:5973 92
storageandhavingflexibilityinthedemandsideplayimportantroles.Itisclearthatshort-termrenewableenergysolarandwindforecastingsystemswillbeimportant,aswillreal-timeupdatesondemandthatcanbecontrolled. Furthermore,controlsystems that can allow the dispatch of flexible resources on both supply anddemandsidesoftheindustrywillberequired.
Figure58 VietNamInstalledCapacitybyGenerationType(SES,MW)
0
20,000
40,000
60,000
80,000
100,000
120,000
140,000
160,000
180,000
200,000
2015
2017
2019
2021
2023
2025
2027
2029
2031
2033
2035
2037
2039
2041
2043
2045
2047
2049
Capacity,M
W
FossilFuel LargeHydro Renewable
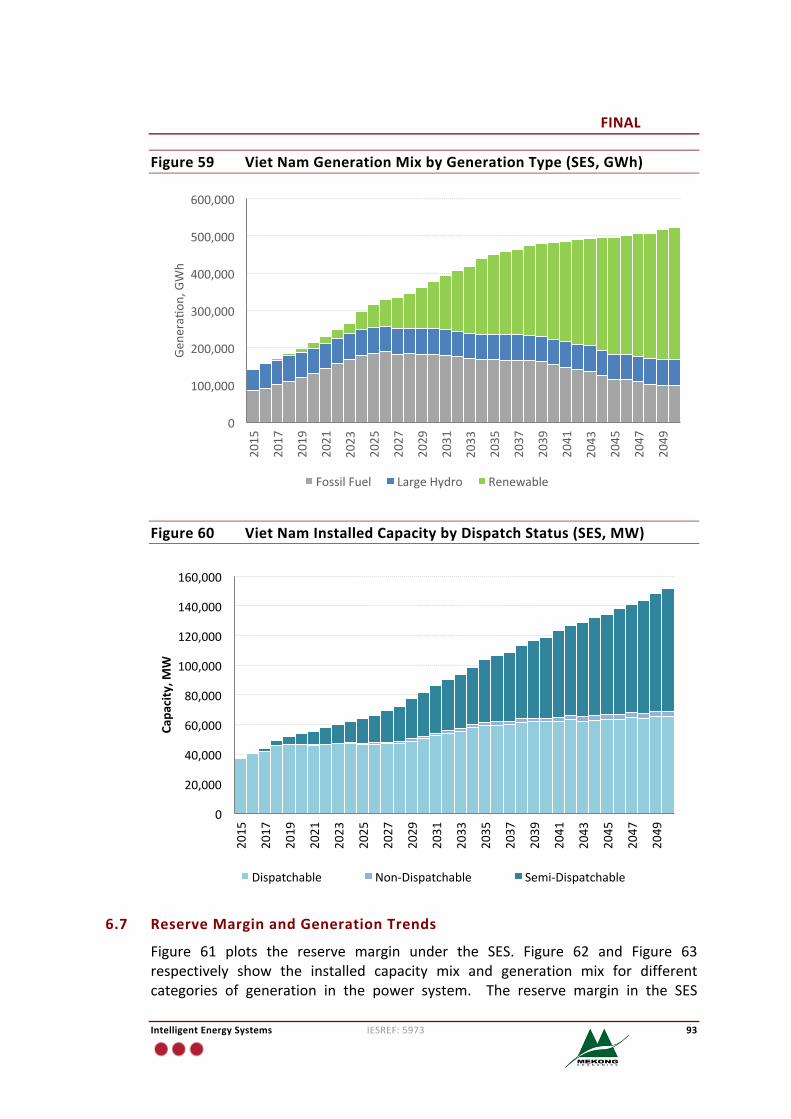
FINAL
IntelligentEnergySystems IESREF:5973 93
Figure59 VietNamGenerationMixbyGenerationType(SES,GWh)
Figure60 VietNamInstalledCapacitybyDispatchStatus(SES,MW)
6.7 ReserveMarginandGenerationTrends
Figure 61 plots the reserve margin under the SES. Figure 62 and Figure 63respectively show the installed capacity mix and generation mix for differentcategories of generation in the power system. The reserve margin in the SES
0
100,000
200,000
300,000
400,000
500,000
600,000
2015
2017
2019
2021
2023
2025
2027
2029
2031
2033
2035
2037
2039
2041
2043
2045
2047
2049
Gene
ra�o
n,GWh
FossilFuel LargeHydro Renewable
0
20,000
40,000
60,000
80,000
100,000
120,000
140,000
160,000
2015
2017
2019
2021
2023
2025
2027
2029
2031
2033
2035
2037
2039
2041
2043
2045
2047
2049
Capa
city,M
W
Dispatchable Non-Dispatchable Semi-Dispatchable
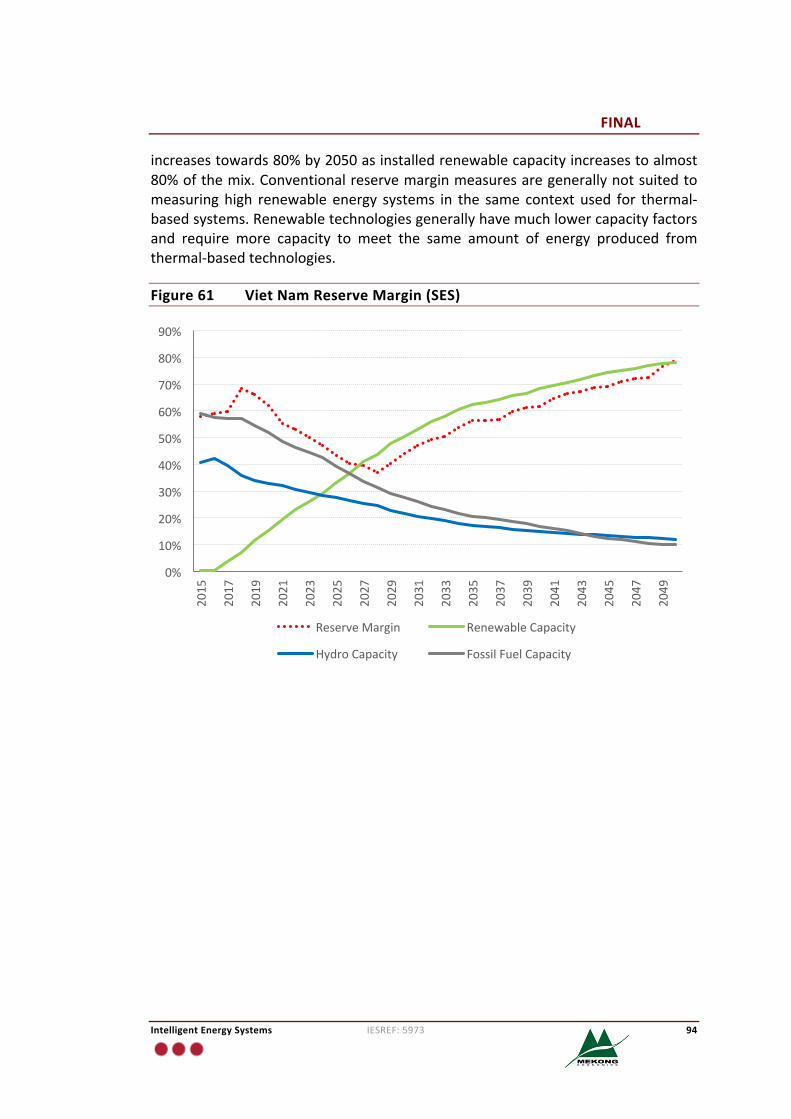
FINAL
IntelligentEnergySystems IESREF:5973 94
increasestowards80%by2050asinstalledrenewablecapacityincreasestoalmost80%ofthemix.Conventionalreservemarginmeasuresaregenerallynotsuitedtomeasuringhigh renewable energy systems in the same context used for thermal-basedsystems.Renewabletechnologiesgenerallyhavemuchlowercapacityfactorsand require more capacity to meet the same amount of energy produced fromthermal-basedtechnologies.
Figure61 VietNamReserveMargin(SES)
0%
10%
20%
30%
40%
50%
60%
70%
80%
90%
2015
2017
2019
2021
2023
2025
2027
2029
2031
2033
2035
2037
2039
2041
2043
2045
2047
2049
ReserveMargin RenewableCapacity
HydroCapacity FossilFuelCapacity
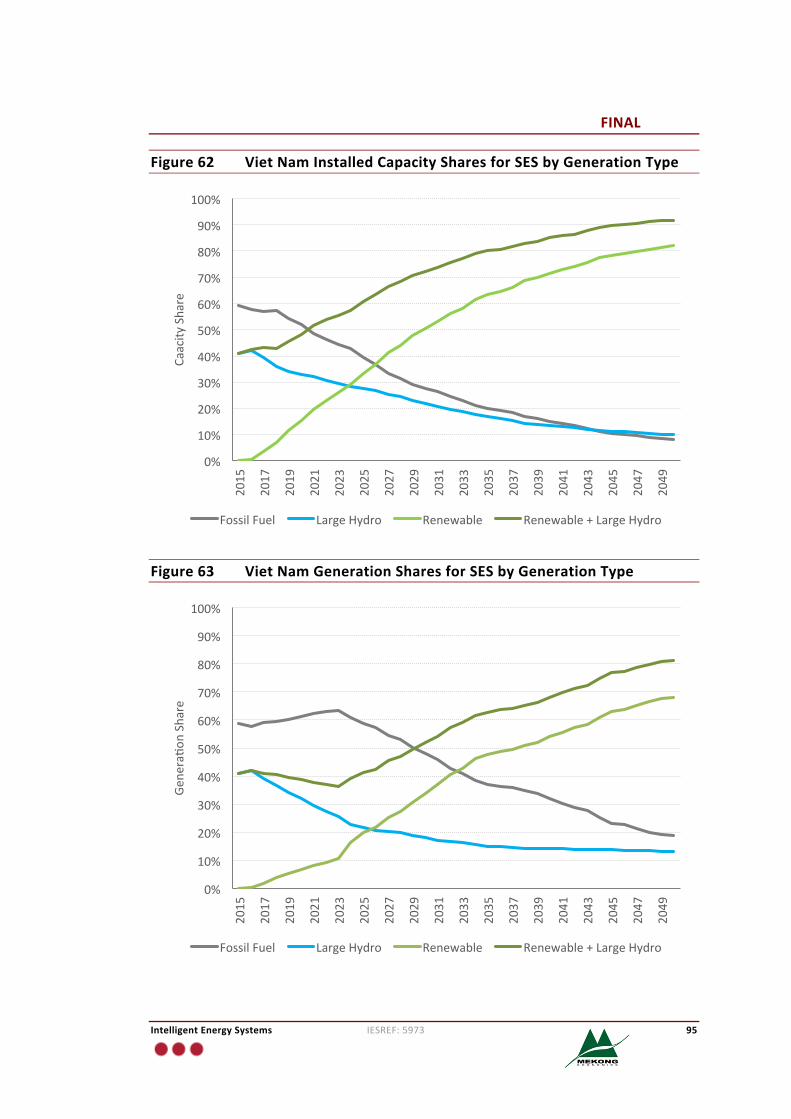
FINAL
IntelligentEnergySystems IESREF:5973 95
Figure62 VietNamInstalledCapacitySharesforSESbyGenerationType
Figure63 VietNamGenerationSharesforSESbyGenerationType
0%
10%
20%
30%
40%
50%
60%
70%
80%
90%
100%
2015
2017
2019
2021
2023
2025
2027
2029
2031
2033
2035
2037
2039
2041
2043
2045
2047
2049
Caacity
Share
FossilFuel LargeHydro Renewable Renewable+LargeHydro
0%
10%
20%
30%
40%
50%
60%
70%
80%
90%
100%
2015
2017
2019
2021
2023
2025
2027
2029
2031
2033
2035
2037
2039
2041
2043
2045
2047
2049
Gene
ra�o
nShare
FossilFuel LargeHydro Renewable Renewable+LargeHydro
FINAL
IntelligentEnergySystems IESREF:5973 96
6.8 ElectrificationandOff-Grid
Most of Viet Nam is already electrified and as per the BAU in the SES we haveassumedthatthegridremainscentrallyinterconnectedintothefuture.
FINAL
IntelligentEnergySystems IESREF:5973 97
7 AdvancedSustainableEnergySectorScenario
7.1 AdvancedSustainableEnergySectorScenario
TheASESassumesthatthepowersectorisabletomorerapidlytransitiontowardsa 100% renewable energy technologymix under an assumption that renewableenergy is deployed more than in the SES scenario with renewable energytechnologycostsdecliningmorerapidlycomparedtoBAUandSESscenarios.
7.2 ProjectedDemandGrowth
Figure64plotsVietNam’sforecastenergyconsumptionfrom2015to2050withtheBAUandSESenergytrajectorychartedwithadashedlineforcomparison.TheSESenergysavingsagainsttheBAUareduetoallowingVietNam’senergydemandto transition towards energy intensity benchmarks of comparable developedcountries inAsia58. TheASESappliesanadditional10%energyefficiencyagainsttheincrementalSESdemands.
TheSESdemandgrowsataslowerrateof3.9%paovertheperiodfrom2015to2050 with the commercial sector at 6.0% pa, industry growing at 4.0% pa andresidential sectorgrowingat1.3%pa. Demand fromthe transport sector in theASESisdoubledandgrowsto58TWh,10%oftotalelectricitydemandor40%ofallvehiclesby2050.
Figure65plotsthepeakdemandofVietNam.Thefirmbluelinerepresentspeakdemand without any demand side management impacts. Demand sidemanagement reflectsdemandresponses to tight supplyandnetworkconditions.This is assumed to grow to as much as 17.5% of demand across all sectors by2050, representing the portion of flexible demand that is not met throughtechnologymeans(i.e.batterystorage).TheloadfactoristhesameasintheSESi.e. assumed to reach 80% by 2030 compared to 80% by 2050 in the BAU as afurther consequence of enhanced demand side management measures. Keydrivers for demandgrowth and thedemandprojections are summarised in Table18.
58Vietnam’s industrial intensity was trended towards levels commensuratewith South Korea (2014) by 2035 andallowedtodeclineatthesamerateto2050whichrepresentsanenergysavingspotentialof62%.
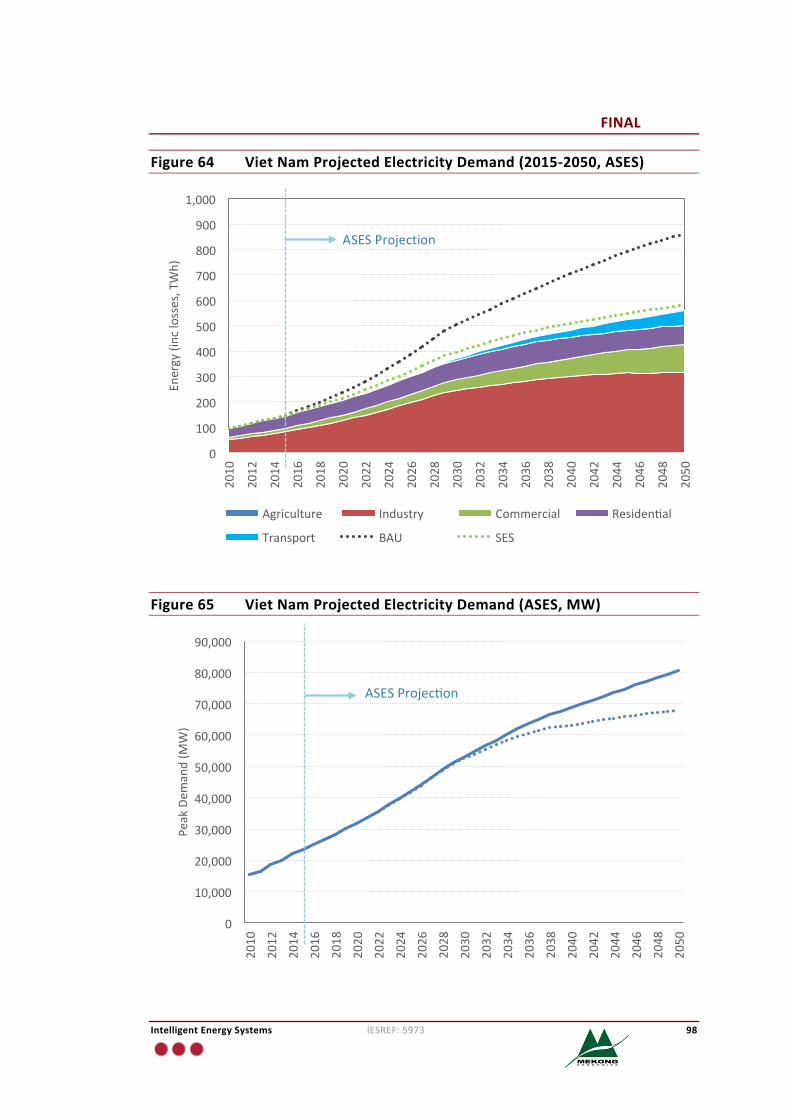
FINAL
IntelligentEnergySystems IESREF:5973 98
Figure64 VietNamProjectedElectricityDemand(2015-2050,ASES)
Figure65 VietNamProjectedElectricityDemand(ASES,MW)
0
100
200
300
400
500
600
700
800
900
1,000
2010
2012
2014
2016
2018
2020
2022
2024
2026
2028
2030
2032
2034
2036
2038
2040
2042
2044
2046
2048
2050
Energy(inclosses,TWh)
Agriculture Industry Commercial Residen�al
Transport BAU SES
0
10,000
20,000
30,000
40,000
50,000
60,000
70,000
80,000
90,000
2010
2012
2014
2016
2018
2020
2022
2024
2026
2028
2030
2032
2034
2036
2038
2040
2042
2044
2046
2048
2050
PeakDem
and(M
W)
ASESProjec�on
ASESProjection
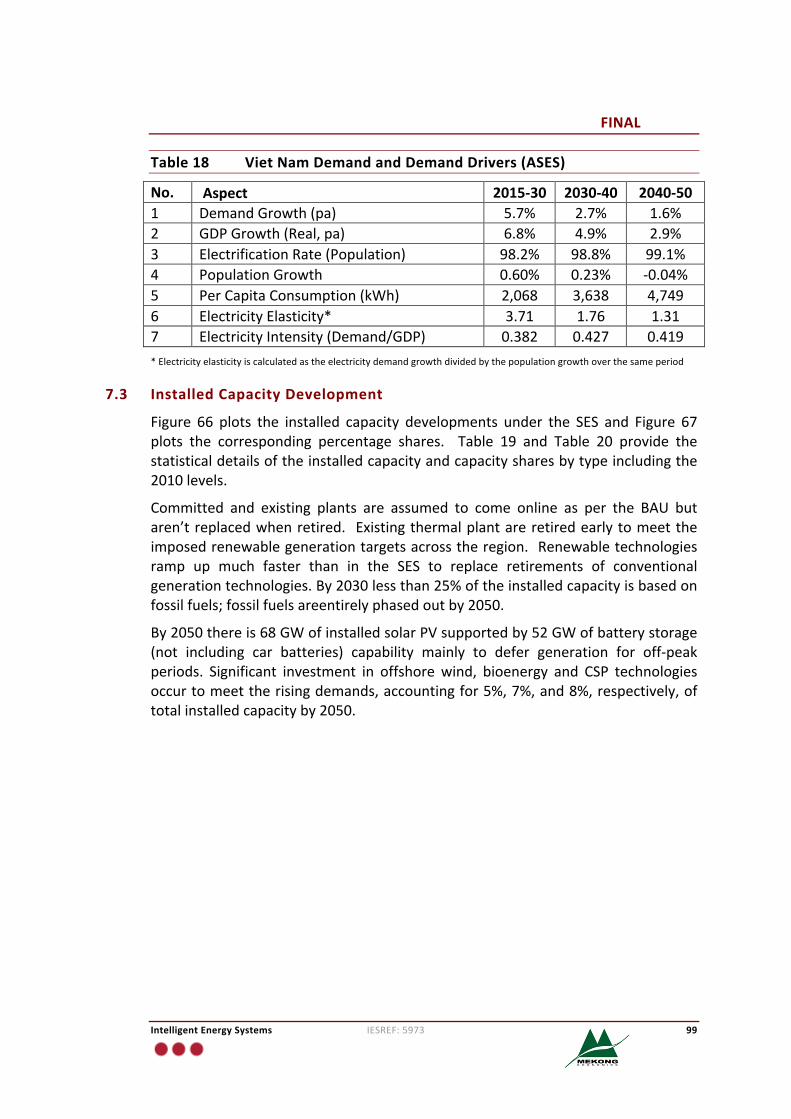
FINAL
IntelligentEnergySystems IESREF:5973 99
Table18 VietNamDemandandDemandDrivers(ASES)
No. Aspect 2015-30 2030-40 2040-501 DemandGrowth(pa) 5.7% 2.7% 1.6%2 GDPGrowth(Real,pa) 6.8% 4.9% 2.9%3 ElectrificationRate(Population) 98.2% 98.8% 99.1%4 PopulationGrowth 0.60% 0.23% -0.04%5 PerCapitaConsumption(kWh) 2,068 3,638 4,7496 ElectricityElasticity* 3.71 1.76 1.317 ElectricityIntensity(Demand/GDP) 0.382 0.427 0.419*Electricityelasticityiscalculatedastheelectricitydemandgrowthdividedbythepopulationgrowthoverthesameperiod
7.3 InstalledCapacityDevelopment
Figure 66 plots the installed capacity developments under the SES and Figure 67plots the corresponding percentage shares. Table 19 and Table 20 provide thestatisticaldetailsoftheinstalledcapacityandcapacitysharesbytypeincludingthe2010levels.
Committed and existing plants are assumed to come online as per the BAU butaren’treplacedwhenretired. Existingthermalplantareretiredearlytomeettheimposedrenewablegenerationtargetsacrosstheregion.Renewabletechnologiesramp up much faster than in the SES to replace retirements of conventionalgenerationtechnologies.By2030lessthan25%oftheinstalledcapacityisbasedonfossilfuels;fossilfuelsareentirelyphasedoutby2050.
By2050thereis68GWofinstalledsolarPVsupportedby52GWofbatterystorage(not including car batteries) capability mainly to defer generation for off-peakperiods. Significant investment in offshorewind, bioenergy and CSP technologiesoccurtomeettherisingdemands,accountingfor5%,7%,and8%,respectively,oftotalinstalledcapacityby2050.
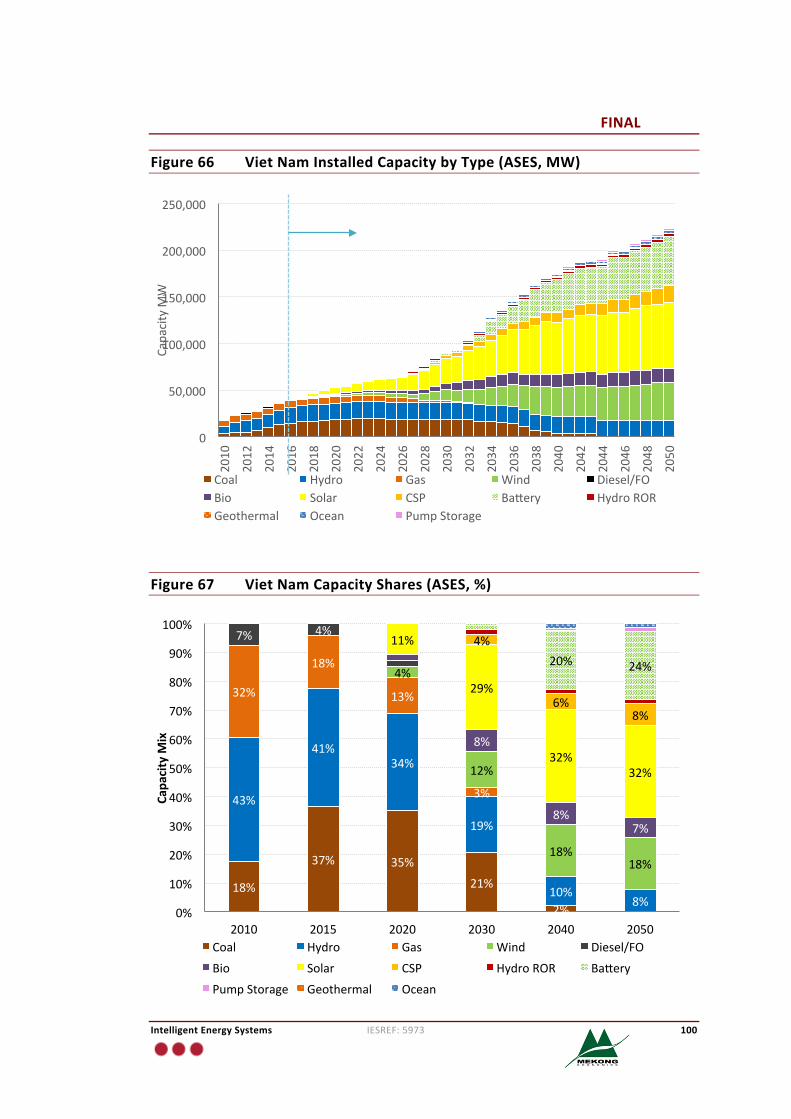
FINAL
IntelligentEnergySystems IESREF:5973 100
Figure66 VietNamInstalledCapacitybyType(ASES,MW)
Figure67 VietNamCapacityShares(ASES,%)
0
50,000
100,000
150,000
200,000
250,0002010
2012
2014
2016
2018
2020
2022
2024
2026
2028
2030
2032
2034
2036
2038
2040
2042
2044
2046
2048
2050
CapacityM
W
Coal Hydro Gas Wind Diesel/FOBio Solar CSP Ba�ery HydroRORGeothermal Ocean PumpStorage
18%
37% 35%
21%
2%
43%
41%34%
19%
10%8%
32%
18%
13%
3%
4%
12%
18%18%
7% 4%
8%
8%7%
11%
29%
32%32%
4%
6%8%
20% 24%
0%
10%
20%
30%
40%
50%
60%
70%
80%
90%
100%
2010 2015 2020 2030 2040 2050
Capa
cityM
ix
Coal Hydro Gas Wind Diesel/FO
Bio Solar CSP HydroROR Ba�ery
PumpStorage Geothermal Ocean
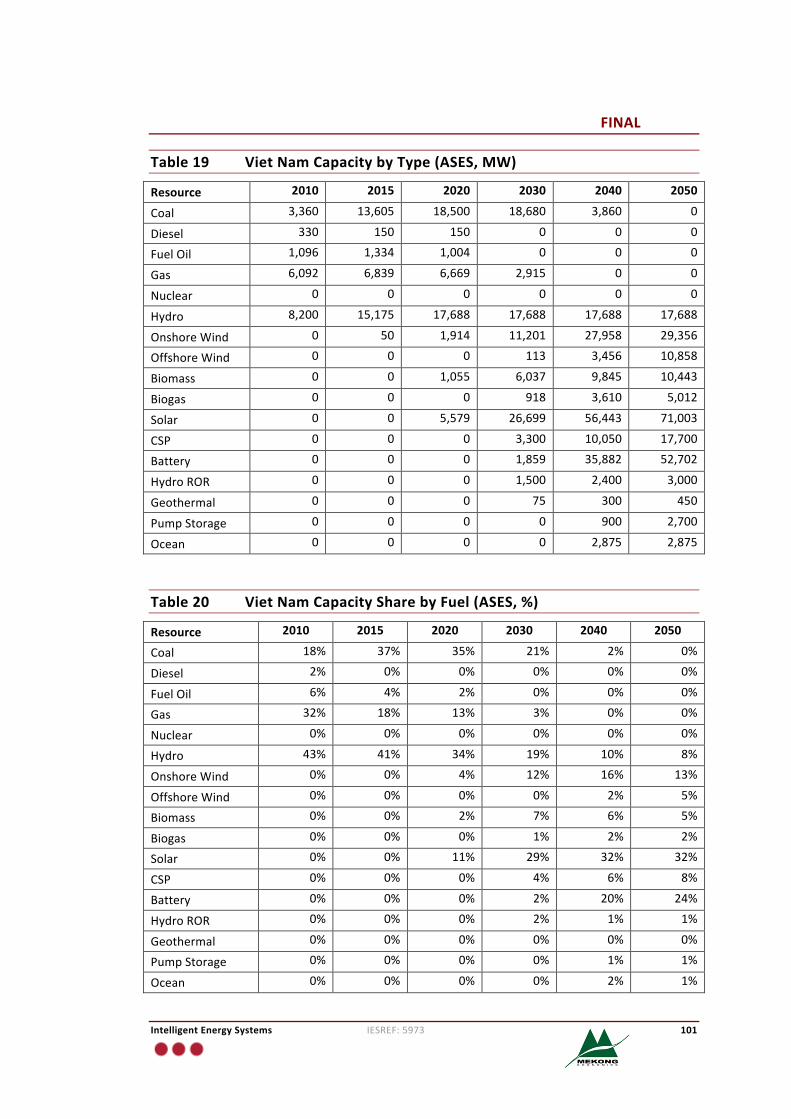
FINAL
IntelligentEnergySystems IESREF:5973 101
Table19 VietNamCapacitybyType(ASES,MW)
Resource 2010 2015 2020 2030 2040 2050
Coal 3,360 13,605 18,500 18,680 3,860 0
Diesel 330 150 150 0 0 0
FuelOil 1,096 1,334 1,004 0 0 0
Gas 6,092 6,839 6,669 2,915 0 0
Nuclear 0 0 0 0 0 0
Hydro 8,200 15,175 17,688 17,688 17,688 17,688
OnshoreWind 0 50 1,914 11,201 27,958 29,356
OffshoreWind 0 0 0 113 3,456 10,858
Biomass 0 0 1,055 6,037 9,845 10,443
Biogas 0 0 0 918 3,610 5,012
Solar 0 0 5,579 26,699 56,443 71,003
CSP 0 0 0 3,300 10,050 17,700
Battery 0 0 0 1,859 35,882 52,702
HydroROR 0 0 0 1,500 2,400 3,000
Geothermal 0 0 0 75 300 450
PumpStorage 0 0 0 0 900 2,700
Ocean 0 0 0 0 2,875 2,875
Table20 VietNamCapacitySharebyFuel(ASES,%)
Resource 2010 2015 2020 2030 2040 2050
Coal 18% 37% 35% 21% 2% 0%
Diesel 2% 0% 0% 0% 0% 0%
FuelOil 6% 4% 2% 0% 0% 0%
Gas 32% 18% 13% 3% 0% 0%
Nuclear 0% 0% 0% 0% 0% 0%
Hydro 43% 41% 34% 19% 10% 8%
OnshoreWind 0% 0% 4% 12% 16% 13%
OffshoreWind 0% 0% 0% 0% 2% 5%
Biomass 0% 0% 2% 7% 6% 5%
Biogas 0% 0% 0% 1% 2% 2%
Solar 0% 0% 11% 29% 32% 32%
CSP 0% 0% 0% 4% 6% 8%
Battery 0% 0% 0% 2% 20% 24%
HydroROR 0% 0% 0% 2% 1% 1%
Geothermal 0% 0% 0% 0% 0% 0%
PumpStorage 0% 0% 0% 0% 1% 1%
Ocean 0% 0% 0% 0% 2% 1%
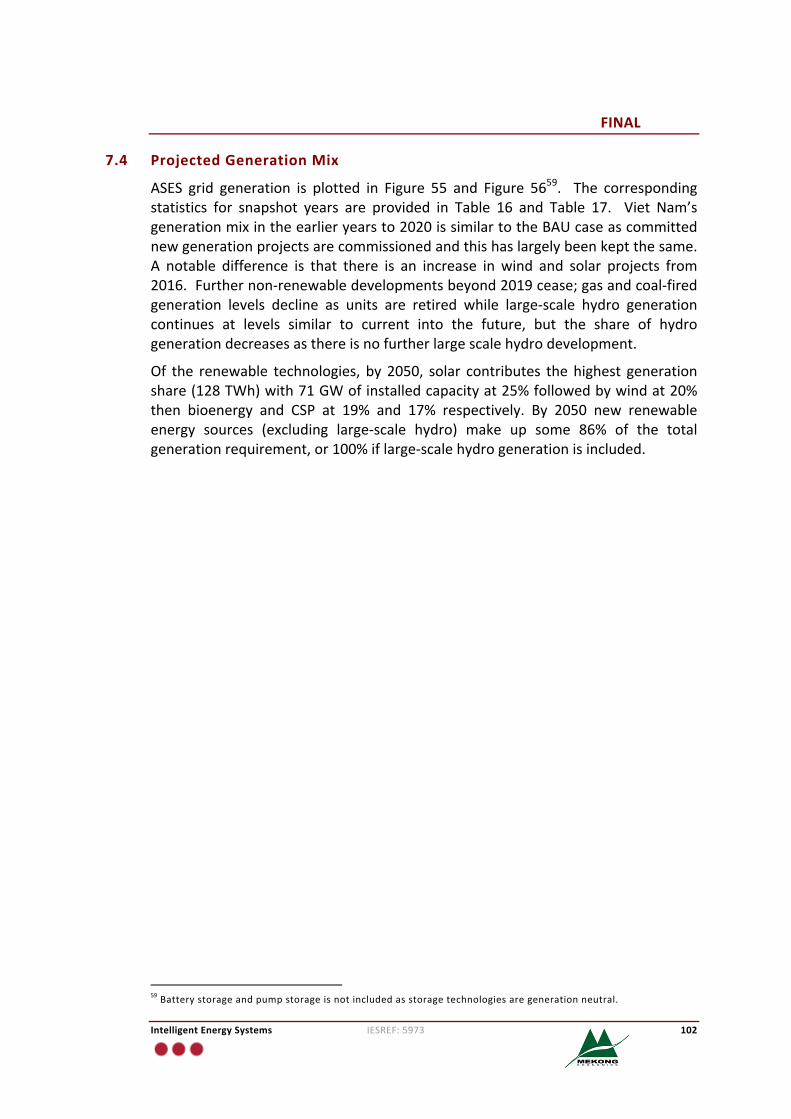
FINAL
IntelligentEnergySystems IESREF:5973 102
7.4 ProjectedGenerationMix
ASES grid generation is plotted in Figure 55 and Figure 5659. The correspondingstatistics for snapshot years are provided in Table 16 and Table 17. Viet Nam’sgenerationmixintheearlieryearsto2020issimilartotheBAUcaseascommittednewgenerationprojectsarecommissionedandthishaslargelybeenkeptthesame.A notable difference is that there is an increase in wind and solar projects from2016.Furthernon-renewabledevelopmentsbeyond2019cease;gasandcoal-firedgeneration levels decline as units are retired while large-scale hydro generationcontinues at levels similar to current into the future, but the share of hydrogenerationdecreasesasthereisnofurtherlargescalehydrodevelopment.
Of the renewable technologies, by 2050, solar contributes thehighest generationshare(128TWh)with71GWofinstalledcapacityat25%followedbywindat20%then bioenergy and CSP at 19% and 17% respectively. By 2050 new renewableenergy sources (excluding large-scale hydro) make up some 86% of the totalgenerationrequirement,or100%iflarge-scalehydrogenerationisincluded.
59Batterystorageandpumpstorageisnotincludedasstoragetechnologiesaregenerationneutral.
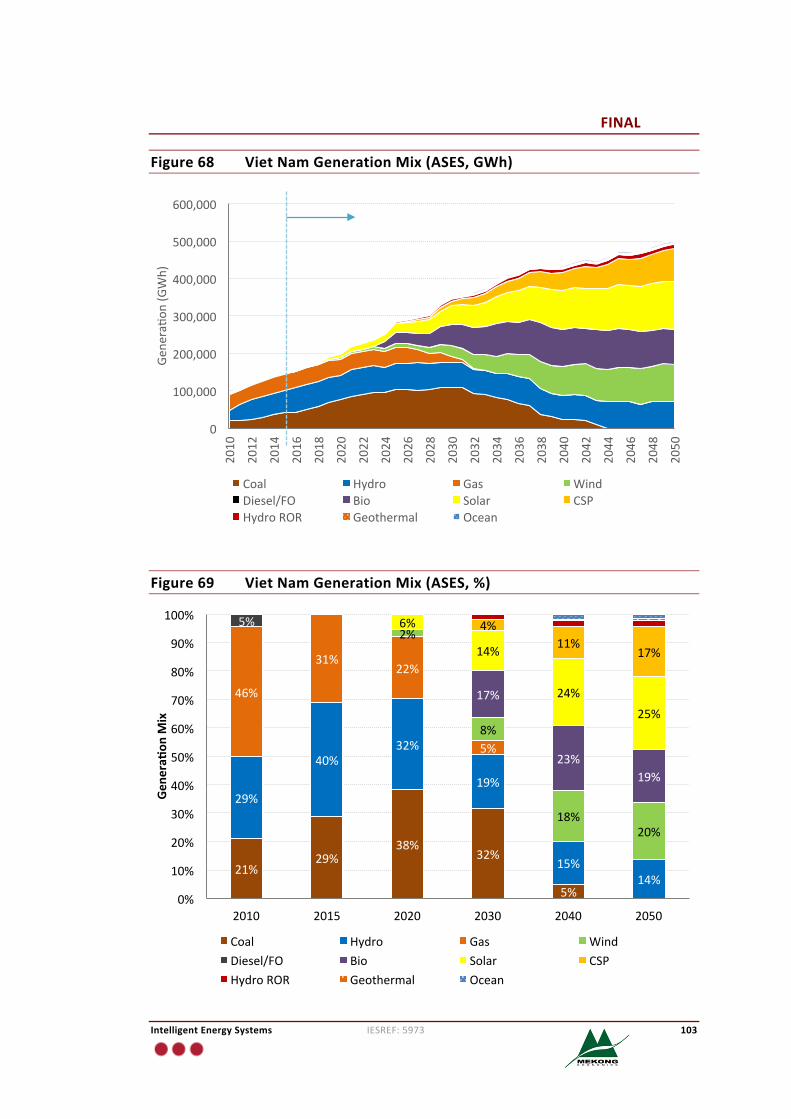
FINAL
IntelligentEnergySystems IESREF:5973 103
Figure68 VietNamGenerationMix(ASES,GWh)
Figure69 VietNamGenerationMix(ASES,%)
0
100,000
200,000
300,000
400,000
500,000
600,000
2010
2012
2014
2016
2018
2020
2022
2024
2026
2028
2030
2032
2034
2036
2038
2040
2042
2044
2046
2048
2050
Gene
ra�o
n(GWh)
Coal Hydro Gas WindDiesel/FO Bio Solar CSPHydroROR Geothermal Ocean
21%29%
38%32%
5%
29%
40%32%
19%
15%14%
46%
31%22%
5%
2%
8%
18%20%
5%
17%
23%19%
6%
14%
24%25%
4%11%
17%
0%
10%
20%
30%
40%
50%
60%
70%
80%
90%
100%
2010 2015 2020 2030 2040 2050
Gen
eraf
onM
ix
Coal Hydro Gas WindDiesel/FO Bio Solar CSPHydroROR Geothermal Ocean
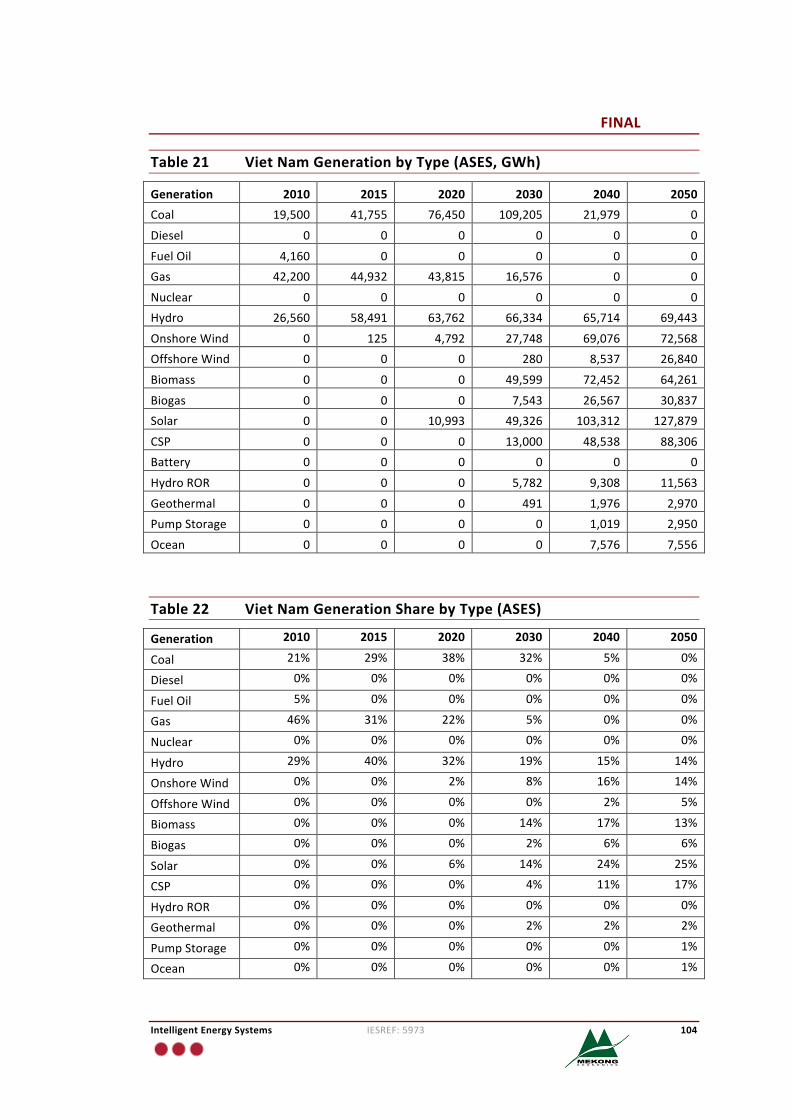
FINAL
IntelligentEnergySystems IESREF:5973 104
Table21 VietNamGenerationbyType(ASES,GWh)
Generation 2010 2015 2020 2030 2040 2050Coal 19,500 41,755 76,450 109,205 21,979 0
Diesel 0 0 0 0 0 0
FuelOil 4,160 0 0 0 0 0Gas 42,200 44,932 43,815 16,576 0 0
Nuclear 0 0 0 0 0 0Hydro 26,560 58,491 63,762 66,334 65,714 69,443
OnshoreWind 0 125 4,792 27,748 69,076 72,568OffshoreWind 0 0 0 280 8,537 26,840
Biomass 0 0 0 49,599 72,452 64,261
Biogas 0 0 0 7,543 26,567 30,837Solar 0 0 10,993 49,326 103,312 127,879
CSP 0 0 0 13,000 48,538 88,306Battery 0 0 0 0 0 0
HydroROR 0 0 0 5,782 9,308 11,563
Geothermal 0 0 0 491 1,976 2,970PumpStorage 0 0 0 0 1,019 2,950
Ocean 0 0 0 0 7,576 7,556
Table22 VietNamGenerationSharebyType(ASES)
Generation 2010 2015 2020 2030 2040 2050
Coal 21% 29% 38% 32% 5% 0%
Diesel 0% 0% 0% 0% 0% 0%
FuelOil 5% 0% 0% 0% 0% 0%
Gas 46% 31% 22% 5% 0% 0%
Nuclear 0% 0% 0% 0% 0% 0%
Hydro 29% 40% 32% 19% 15% 14%
OnshoreWind 0% 0% 2% 8% 16% 14%
OffshoreWind 0% 0% 0% 0% 2% 5%
Biomass 0% 0% 0% 14% 17% 13%
Biogas 0% 0% 0% 2% 6% 6%
Solar 0% 0% 6% 14% 24% 25%
CSP 0% 0% 0% 4% 11% 17%
HydroROR 0% 0% 0% 0% 0% 0%
Geothermal 0% 0% 0% 2% 2% 2%
PumpStorage 0% 0% 0% 0% 0% 1%
Ocean 0% 0% 0% 0% 0% 1%
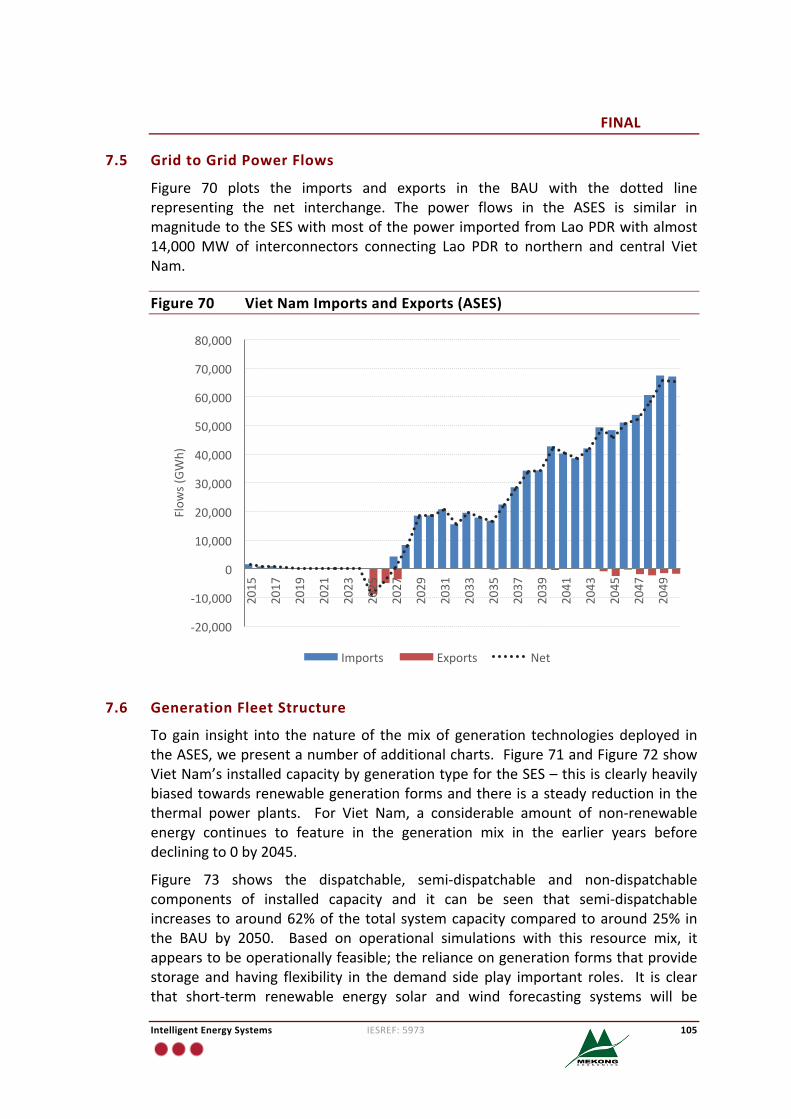
FINAL
IntelligentEnergySystems IESREF:5973 105
7.5 GridtoGridPowerFlows
Figure 70 plots the imports and exports in the BAU with the dotted linerepresenting the net interchange. The power flows in the ASES is similar inmagnitudetotheSESwithmostofthepowerimportedfromLaoPDRwithalmost14,000MW of interconnectors connecting Lao PDR to northern and central VietNam.
Figure70 VietNamImportsandExports(ASES)
7.6 GenerationFleetStructure
Togain insight into thenatureof themixof generation technologiesdeployed intheASES,wepresentanumberofadditionalcharts.Figure71andFigure72showVietNam’sinstalledcapacitybygenerationtypefortheSES–thisisclearlyheavilybiasedtowardsrenewablegenerationformsandthereisasteadyreductioninthethermal power plants. For Viet Nam, a considerable amount of non-renewableenergy continues to feature in the generation mix in the earlier years beforedecliningto0by2045.
Figure 73 shows the dispatchable, semi-dispatchable and non-dispatchablecomponents of installed capacity and it can be seen that semi-dispatchableincreases toaround62%of thetotalsystemcapacitycomparedtoaround25% inthe BAU by 2050. Based on operational simulations with this resource mix, itappearstobeoperationallyfeasible;therelianceongenerationformsthatprovidestorage andhaving flexibility in thedemand sideplay important roles. It is clearthat short-term renewable energy solar and wind forecasting systems will be
-20,000
-10,000
0
10,000
20,000
30,000
40,000
50,000
60,000
70,000
80,000
2015
2017
2019
2021
2023
2025
2027
2029
2031
2033
2035
2037
2039
2041
2043
2045
2047
2049
Flow
s(GW
h)
Imports Exports Net
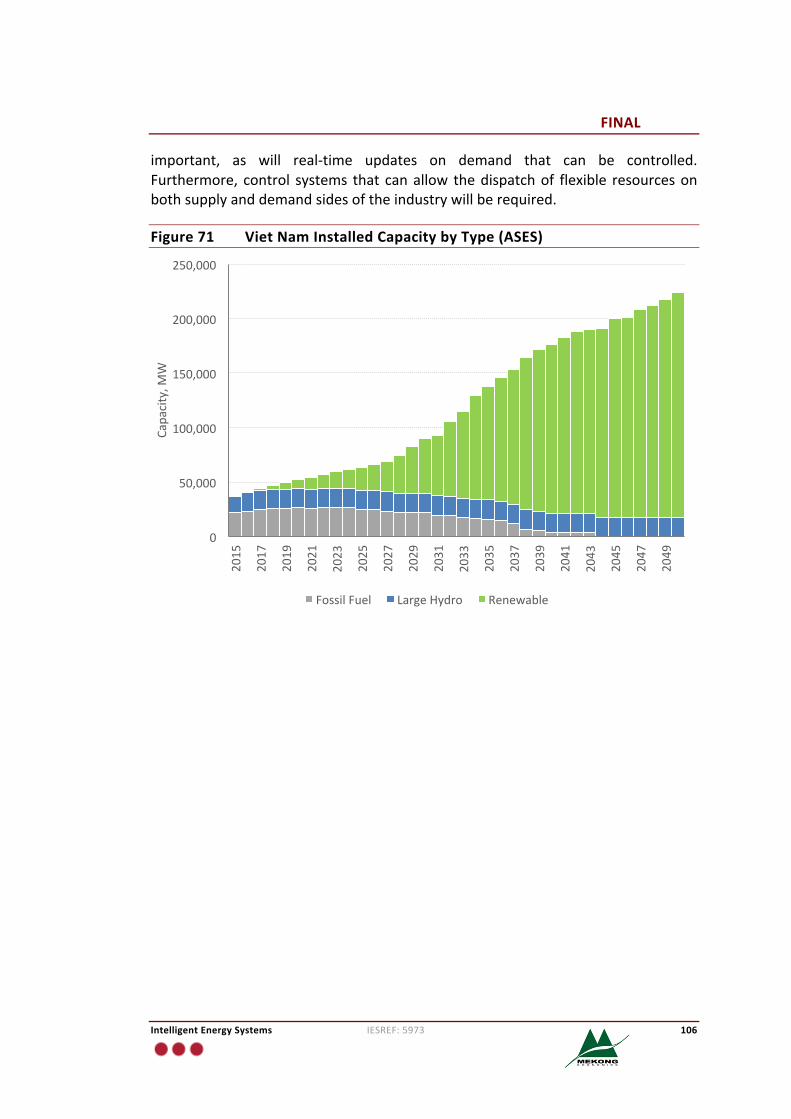
FINAL
IntelligentEnergySystems IESREF:5973 106
important, as will real-time updates on demand that can be controlled.Furthermore, control systems that canallow thedispatchof flexible resourcesonbothsupplyanddemandsidesoftheindustrywillberequired.
Figure71 VietNamInstalledCapacitybyType(ASES)
0
50,000
100,000
150,000
200,000
250,000
2015
2017
2019
2021
2023
2025
2027
2029
2031
2033
2035
2037
2039
2041
2043
2045
2047
2049
Capacity,M
W
FossilFuel LargeHydro Renewable
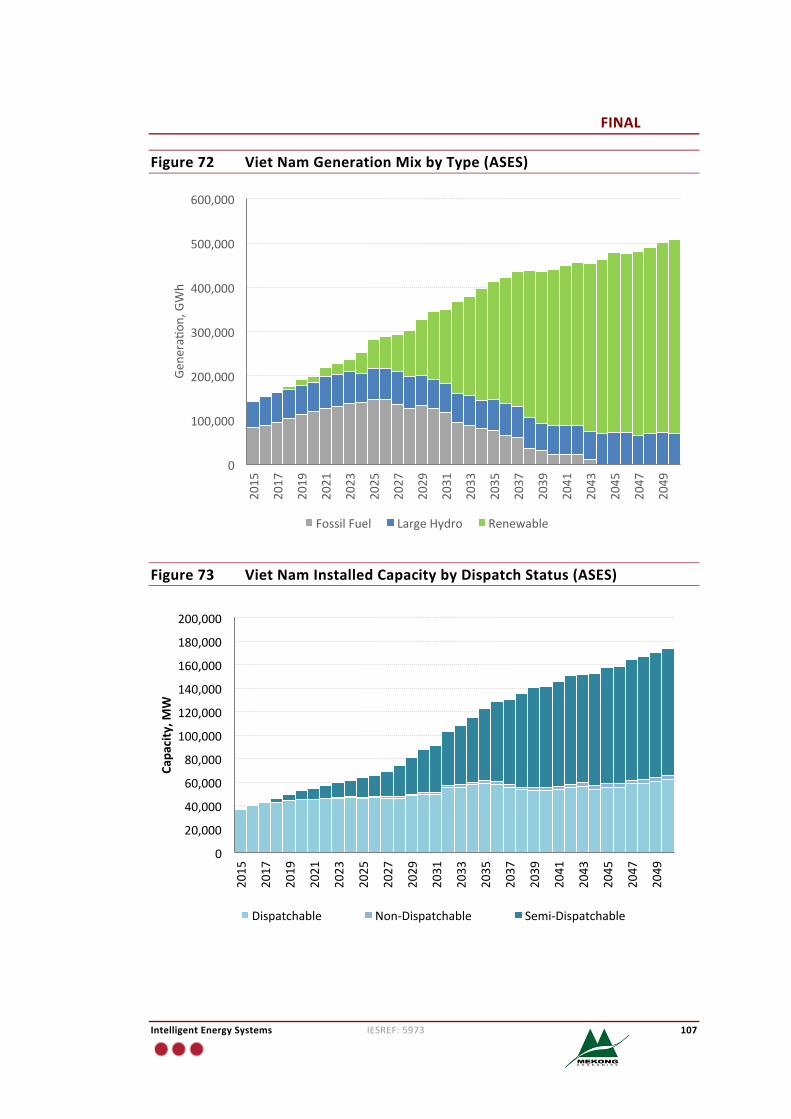
FINAL
IntelligentEnergySystems IESREF:5973 107
Figure72 VietNamGenerationMixbyType(ASES)
Figure73 VietNamInstalledCapacitybyDispatchStatus(ASES)
0
100,000
200,000
300,000
400,000
500,000
600,000
2015
2017
2019
2021
2023
2025
2027
2029
2031
2033
2035
2037
2039
2041
2043
2045
2047
2049
Gene
ra�o
n,GWh
FossilFuel LargeHydro Renewable
0
20,000
40,000
60,000
80,000
100,000
120,000
140,000
160,000
180,000
200,000
2015
2017
2019
2021
2023
2025
2027
2029
2031
2033
2035
2037
2039
2041
2043
2045
2047
2049
Capa
city,M
W
Dispatchable Non-Dispatchable Semi-Dispatchable
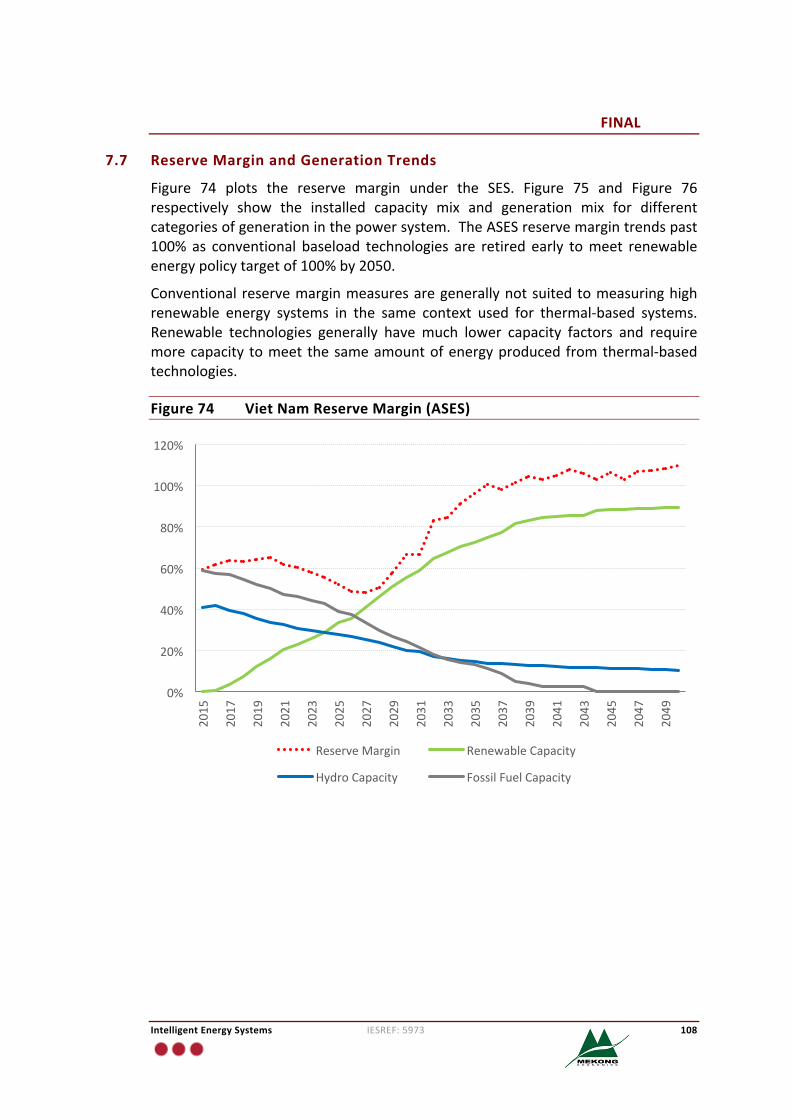
FINAL
IntelligentEnergySystems IESREF:5973 108
7.7 ReserveMarginandGenerationTrends
Figure 74 plots the reserve margin under the SES. Figure 75 and Figure 76respectively show the installed capacity mix and generation mix for differentcategoriesofgenerationinthepowersystem.TheASESreservemargintrendspast100% as conventional baseload technologies are retired early tomeet renewableenergypolicytargetof100%by2050.
Conventional reservemarginmeasuresaregenerallynotsuitedtomeasuringhighrenewable energy systems in the same context used for thermal-based systems.Renewable technologies generally have much lower capacity factors and requiremorecapacity tomeet thesameamountofenergyproducedfromthermal-basedtechnologies.
Figure74 VietNamReserveMargin(ASES)
0%
20%
40%
60%
80%
100%
120%
2015
2017
2019
2021
2023
2025
2027
2029
2031
2033
2035
2037
2039
2041
2043
2045
2047
2049
ReserveMargin RenewableCapacity
HydroCapacity FossilFuelCapacity
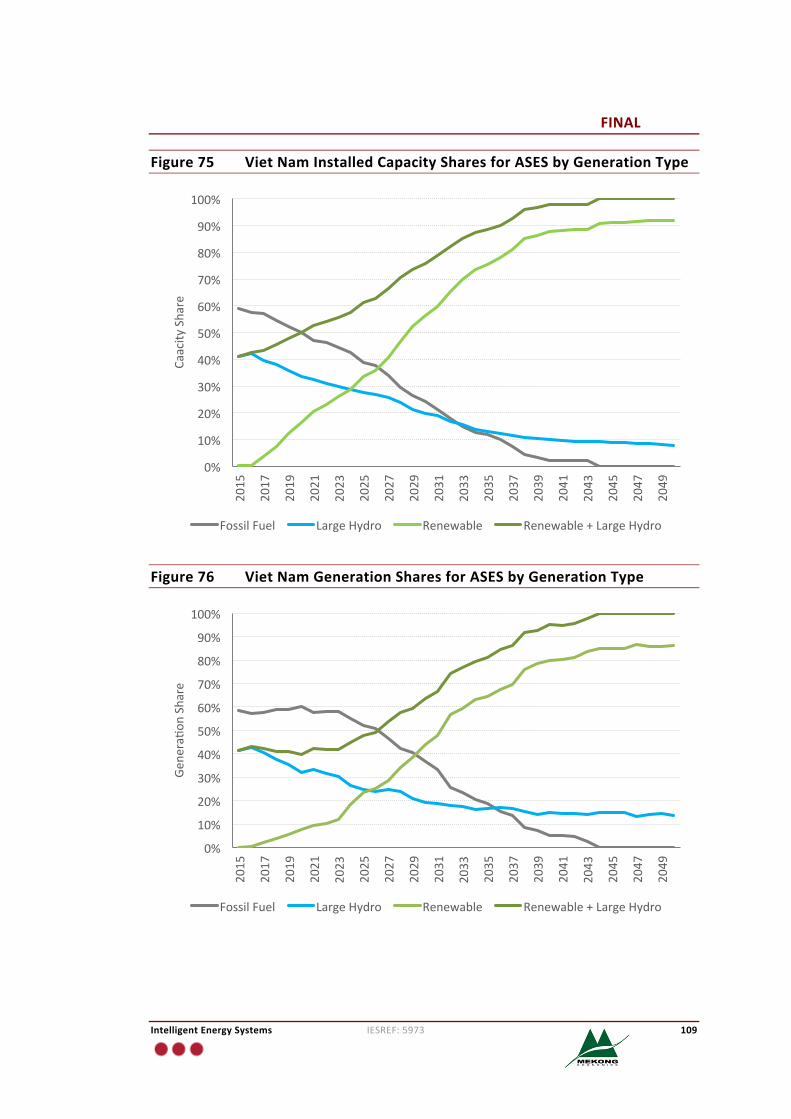
FINAL
IntelligentEnergySystems IESREF:5973 109
Figure75 VietNamInstalledCapacitySharesforASESbyGenerationType
Figure76 VietNamGenerationSharesforASESbyGenerationType
0%
10%
20%
30%
40%
50%
60%
70%
80%
90%
100%
2015
2017
2019
2021
2023
2025
2027
2029
2031
2033
2035
2037
2039
2041
2043
2045
2047
2049
Caacity
Share
FossilFuel LargeHydro Renewable Renewable+LargeHydro
0%
10%
20%
30%
40%
50%
60%
70%
80%
90%
100%
2015
2017
2019
2021
2023
2025
2027
2029
2031
2033
2035
2037
2039
2041
2043
2045
2047
2049
Gene
ra�o
nShare
FossilFuel LargeHydro Renewable Renewable+LargeHydro
FINAL
IntelligentEnergySystems IESREF:5973 110
7.8 ElectrificationandOff-Grid
MostofVietNamisalreadygridelectrifiedandaspertheBAUandSES,intheASESwehaveassumedthatthegridremainscentrallyinterconnectedintothefuture.
FINAL
IntelligentEnergySystems IESREF:5973 111
8 AnalysisofScenariosSection5,section6andsection7presentedprojectionsofcapacityandgenerationmixfortheBAU,SESandASESscenariosrespectively. InordertounderstandtheimplicationsoftheSESandASESovertheBAU,wehaveformulatedasetofmetricstoassistintheircomparison.
Theseareasfollows:
• Overallenergyconsumptionperyear;• Peakelectricitydemandperyear;• Renewableenergypercentagecomparisons;• Carbonemissionsmeasures;• Hydropowerdevelopments;• Analysisofbioenergysituation;• Anumberofsimplesecurityofsupplymeasures;and• Interregionalpowerflows.
8.1 EnergyandPeakDemand
Figure 77 compares the total electricity consumption of the BAU, SES and ASESwithFigure78plottingthepercentagereductioninelectricityconsumptionoftheSESrelativetotheBAUandASESrelativetotheBAU.Ascanbeseentheenergyconsumption of the SES is lower than the BAU with the main driver beingenhancementsinenergyefficiencyintheSES.ThereisasimilarsituationfortheASES noting that electric vehicle uptake was doubled in the ASES. Figure 79compares peak load and shows the same relativities. This is attributable toimprovements in load factor (reaching80%by2030 inSESandASES).On topofthis the SES and ASES has contributions from flexible and controllable demandthatallowsreductionsinpeakdemandconsumptionincludedinthescenarioasanassumption.
FINAL
IntelligentEnergySystems IESREF:5973 112
Figure77 VietNamEnergyDemandComparison
Figure78 VietNamPercentageReductioninElectricityDemand
0
100,000
200,000
300,000
400,000
500,000
600,000
700,000
800,000
900,000
1,000,000
2010
2012
2014
2016
2018
2020
2022
2024
2026
2028
2030
2032
2034
2036
2038
2040
2042
2044
2046
2048
2050
Energy(G
Wh)
BAU SES ASES
0%
5%
10%
15%
20%
25%
30%
35%
40%
2015
2017
2019
2021
2023
2025
2027
2029
2031
2033
2035
2037
2039
2041
2043
2045
2047
2049
SES ASES
FINAL
IntelligentEnergySystems IESREF:5973 113
Figure79 VietNamPeakDemandComparison
8.2 Energyintensity
Figure 80 plots the per capita electricity consumption per annum across thescenarios. Electricity consumption includes all electricity consumption across thecountry. In the BAU, per capita consumption levels increase at a rate of 4.8% toreach8,500kWhpawhichisbetweenSingaporeandTaiwan’scurrentlevels.IntheSES, it increasesmore slowly at 3.7%pa to reach 5,800 kWhpa and theASES at5,600 kWh by 2050. The SES and ASES assume higher energy efficiency savingskeeping per capita consumption below Hong Kong’s current levels. It should benotedthatGDPgrowthassumptionsremainconstantacrossallscenarioswiththedifferenceintheASESandSESbeingmeasurestakentoimproveenergyefficiency.
0
20,000
40,000
60,000
80,000
100,000
120,000
140,000
2010
2012
2014
2016
2018
2020
2022
2024
2026
2028
2030
2032
2034
2036
2038
2040
2042
2044
2046
2048
2050
PeakDem
and(M
W)
BAU
SES
ASES
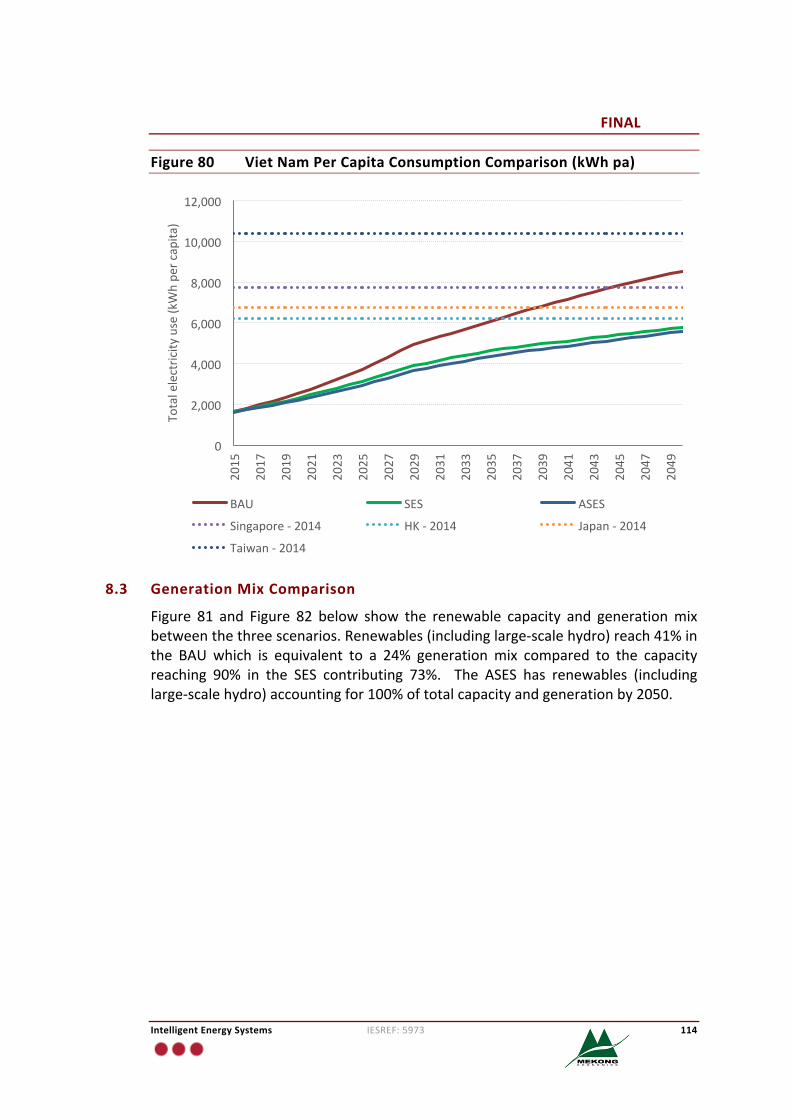
FINAL
IntelligentEnergySystems IESREF:5973 114
Figure80 VietNamPerCapitaConsumptionComparison(kWhpa)
8.3 GenerationMixComparison
Figure 81 and Figure 82 below show the renewable capacity and generationmixbetweenthethreescenarios.Renewables(includinglarge-scalehydro)reach41%inthe BAU which is equivalent to a 24% generationmix compared to the capacityreaching 90% in the SES contributing 73%. The ASES has renewables (includinglarge-scalehydro)accountingfor100%oftotalcapacityandgenerationby2050.
0
2,000
4,000
6,000
8,000
10,000
12,000
2015
2017
2019
2021
2023
2025
2027
2029
2031
2033
2035
2037
2039
2041
2043
2045
2047
2049
Totalelectricity
use(kWhpe
rcapita
)
BAU SES ASES
Singapore-2014 HK-2014 Japan-2014
Taiwan-2014
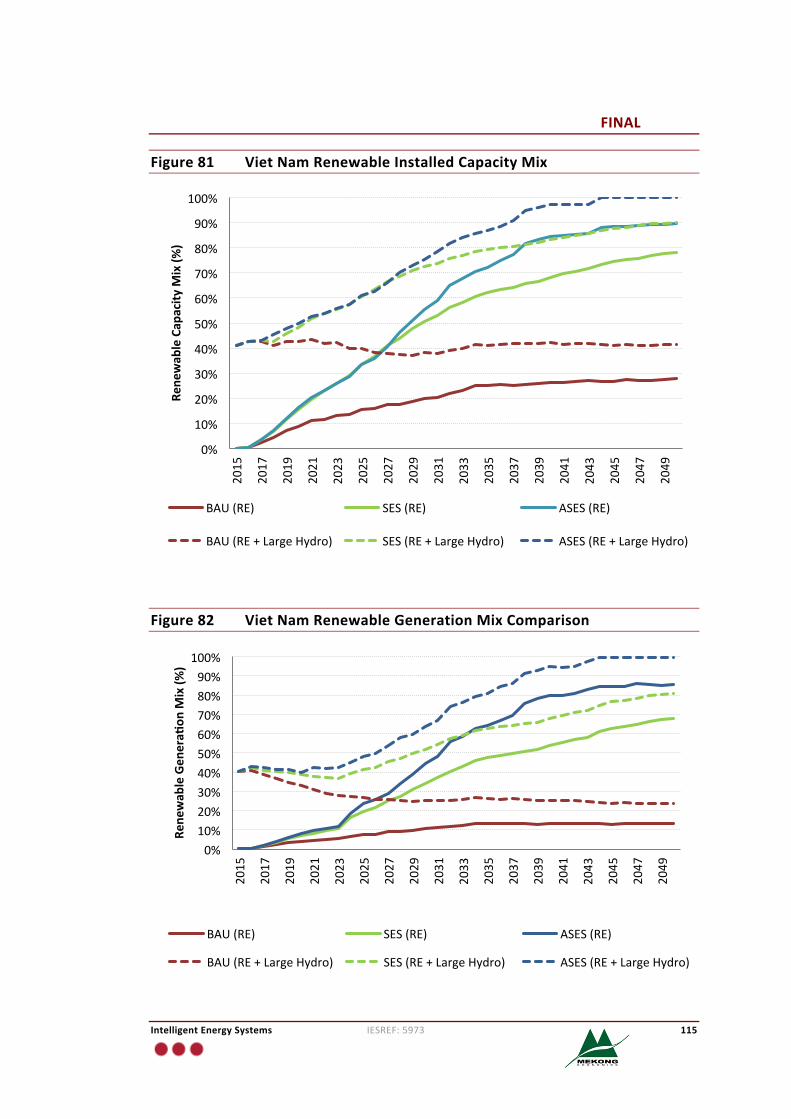
FINAL
IntelligentEnergySystems IESREF:5973 115
Figure81 VietNamRenewableInstalledCapacityMix
Figure82 VietNamRenewableGenerationMixComparison
0%
10%
20%
30%
40%
50%
60%
70%
80%
90%
100%
2015
2017
2019
2021
2023
2025
2027
2029
2031
2033
2035
2037
2039
2041
2043
2045
2047
2049
Rene
wab
leCap
acity
Mix(%
)
BAU(RE) SES(RE) ASES(RE)
BAU(RE+LargeHydro) SES(RE+LargeHydro) ASES(RE+LargeHydro)
0%10%20%30%40%50%60%70%80%90%100%
2015
2017
2019
2021
2023
2025
2027
2029
2031
2033
2035
2037
2039
2041
2043
2045
2047
2049
Rene
wab
leGen
eraf
onM
ix(%
)
BAU(RE) SES(RE) ASES(RE)
BAU(RE+LargeHydro) SES(RE+LargeHydro) ASES(RE+LargeHydro)
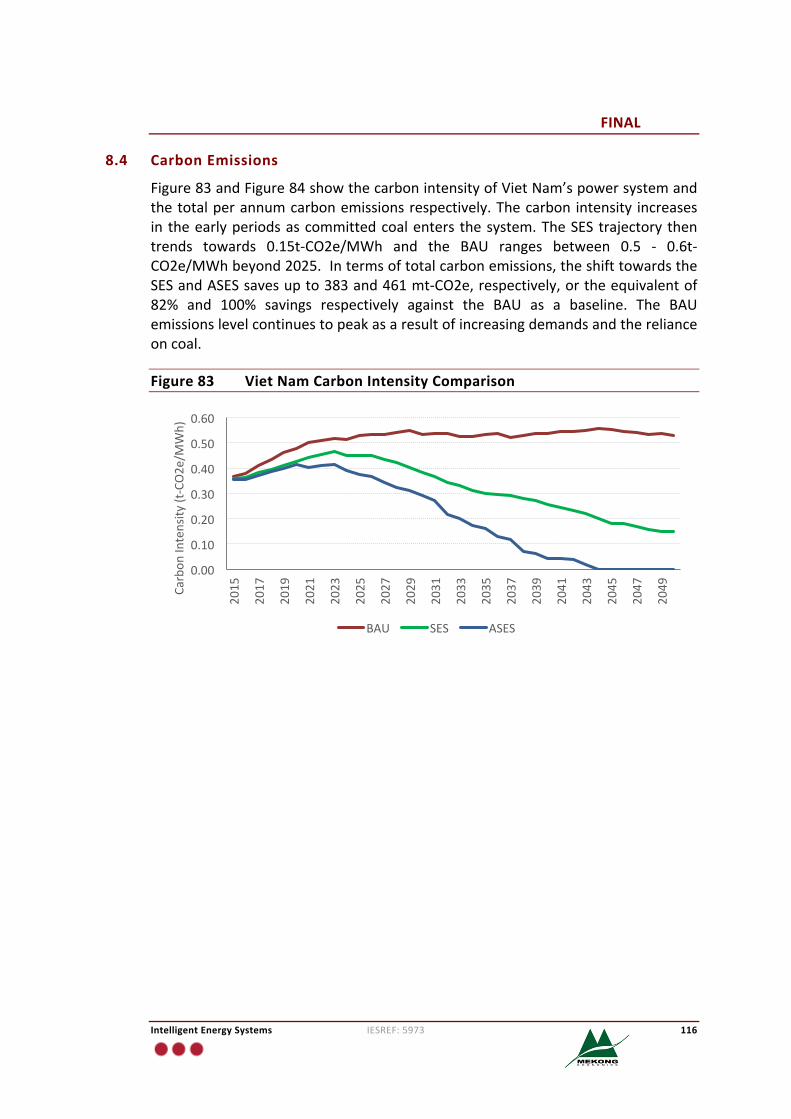
FINAL
IntelligentEnergySystems IESREF:5973 116
8.4 CarbonEmissions
Figure83andFigure84showthecarbonintensityofVietNam’spowersystemandthetotalperannumcarbonemissionsrespectively.Thecarbon intensity increasesin theearlyperiodsascommittedcoalenters thesystem.TheSEStrajectory thentrends towards 0.15t-CO2e/MWh and the BAU ranges between 0.5 - 0.6t-CO2e/MWhbeyond2025.Intermsoftotalcarbonemissions,theshifttowardstheSESandASESsavesupto383and461mt-CO2e,respectively,ortheequivalentof82% and 100% savings respectively against the BAU as a baseline. The BAUemissionslevelcontinuestopeakasaresultofincreasingdemandsandtherelianceoncoal.
Figure83 VietNamCarbonIntensityComparison
0.00
0.10
0.20
0.30
0.40
0.50
0.60
2015
2017
2019
2021
2023
2025
2027
2029
2031
2033
2035
2037
2039
2041
2043
2045
2047
2049
Carbon
Intensity
(t-CO2e/M
Wh)
BAU SES ASES
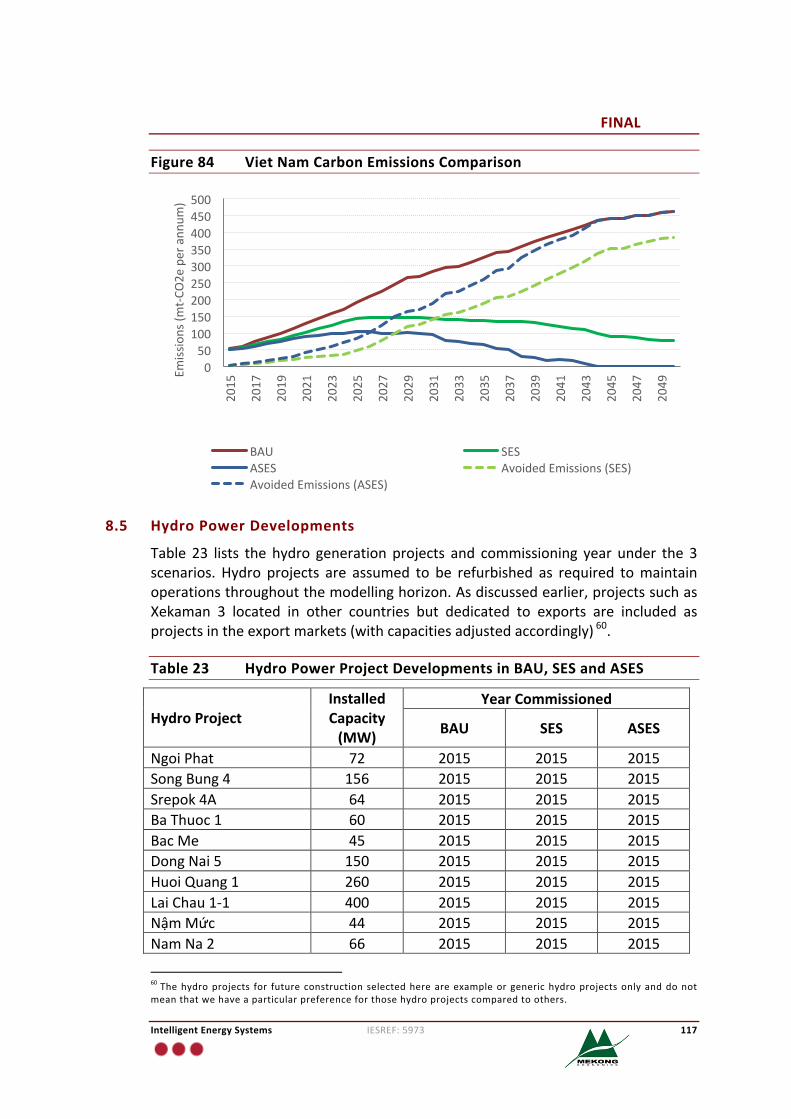
FINAL
IntelligentEnergySystems IESREF:5973 117
Figure84 VietNamCarbonEmissionsComparison
8.5 HydroPowerDevelopments
Table 23 lists the hydro generation projects and commissioning year under the 3scenarios. Hydro projects are assumed to be refurbished as required tomaintainoperationsthroughoutthemodellinghorizon.Asdiscussedearlier,projectssuchasXekaman 3 located in other countries but dedicated to exports are included asprojectsintheexportmarkets(withcapacitiesadjustedaccordingly)60.
Table23 HydroPowerProjectDevelopmentsinBAU,SESandASES
HydroProjectInstalledCapacity(MW)
YearCommissioned
BAU SES ASES
NgoiPhat 72 2015 2015 2015SongBung4 156 2015 2015 2015Srepok4A 64 2015 2015 2015BaThuoc1 60 2015 2015 2015BacMe 45 2015 2015 2015DongNai5 150 2015 2015 2015HuoiQuang1 260 2015 2015 2015LaiChau1-1 400 2015 2015 2015NậmMức 44 2015 2015 2015NamNa2 66 2015 2015 2015
60Thehydroprojects for futureconstruction selectedhereareexampleorgenerichydroprojectsonlyanddonotmeanthatwehaveaparticularpreferenceforthosehydroprojectscomparedtoothers.
050
100150200250300350400450500
2015
2017
2019
2021
2023
2025
2027
2029
2031
2033
2035
2037
2039
2041
2043
2045
2047
2049Em
issions(m
t-CO
2eperann
um)
BAU SESASES AvoidedEmissions(SES)AvoidedEmissions(ASES)
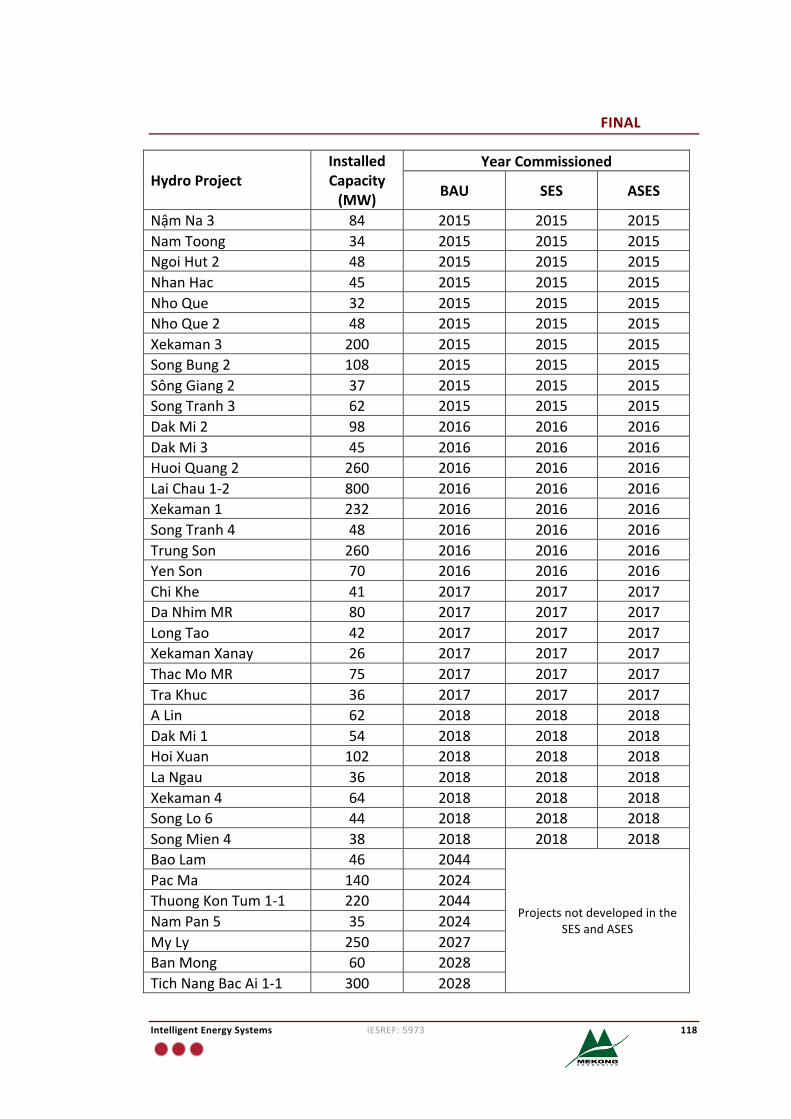
FINAL
IntelligentEnergySystems IESREF:5973 118
HydroProjectInstalledCapacity(MW)
YearCommissioned
BAU SES ASES
NậmNa3 84 2015 2015 2015NamToong 34 2015 2015 2015NgoiHut2 48 2015 2015 2015NhanHac 45 2015 2015 2015NhoQue 32 2015 2015 2015NhoQue2 48 2015 2015 2015Xekaman3 200 2015 2015 2015SongBung2 108 2015 2015 2015SôngGiang2 37 2015 2015 2015SongTranh3 62 2015 2015 2015DakMi2 98 2016 2016 2016DakMi3 45 2016 2016 2016HuoiQuang2 260 2016 2016 2016LaiChau1-2 800 2016 2016 2016Xekaman1 232 2016 2016 2016SongTranh4 48 2016 2016 2016TrungSon 260 2016 2016 2016YenSon 70 2016 2016 2016ChiKhe 41 2017 2017 2017DaNhimMR 80 2017 2017 2017LongTao 42 2017 2017 2017XekamanXanay 26 2017 2017 2017ThacMoMR 75 2017 2017 2017TraKhuc 36 2017 2017 2017ALin 62 2018 2018 2018DakMi1 54 2018 2018 2018HoiXuan 102 2018 2018 2018LaNgau 36 2018 2018 2018Xekaman4 64 2018 2018 2018SongLo6 44 2018 2018 2018SongMien4 38 2018 2018 2018BaoLam 46 2044
ProjectsnotdevelopedintheSESandASES
PacMa 140 2024ThuongKonTum1-1 220 2044NamPan5 35 2024MyLy 250 2027BanMong 60 2028TichNangBacAi1-1 300 2028
FINAL
IntelligentEnergySystems IESREF:5973 119
HydroProjectInstalledCapacity(MW)
YearCommissioned
BAU SES ASES
TichNangBacAi1-2 300 2029TichNangBacAi1-3 300 2030DongPhuYen1-1 300 2030PaMa 80 2032TichNangBacAi1-4 300 2033DongPhuYen1-2 300 2033HuoiTao 180 2034DongPhuYen1-3 300 2036LowerSrePok2 155 2027SamborDam 1820 2037
8.6 AnalysisofBioenergy
Figure 85shows a projection of the biomass available for the GMS (converted toGWh)andthetotalbiomassgenerationforeachscenariofortheGMS.Theshadedpink area represents the projected total technical biomass resource availability61while the solid lines show the biomass consumption used by each scenario. Theprojectedavailablebiomasswasbasedonforecastgrowthratesintheagriculturalsectors of each country. It was assumed that no more than 75% of the totalprojected available biomass resourcewas used. The remainder of the bioenergyrequirements for each scenario was then assumed to be satisfied by biogastechnologies.
Figure 86 shows a similar chart to Figure 85 for the GMS except for biogas. Thegreenshadedareainthischartrepresentstheamountofbiogasavailable(againinunitsofGWh)andthecorrespondinggenerationfrombiogasineachscenario.ThisshowsthattheSESandASESaredependentonbiogaswhiletheBAUisassumedtonot deploy this technology. Based on the projections the biomass and biogasresourcesavailabletotheregioncanbeseentobesufficienttosupporttheamountofbiomassandbiogasgenerationto2050.
61ProjectionsofbiomassavailabilitydevelopedbyIESbasedonbaselinesestablishedfrominformationonbiomassandbiogaspotentialreportedin‘RenewableEnergyDevelopmentsandPotentialintheGreaterMekongSubregion’,ADB(2015)report.
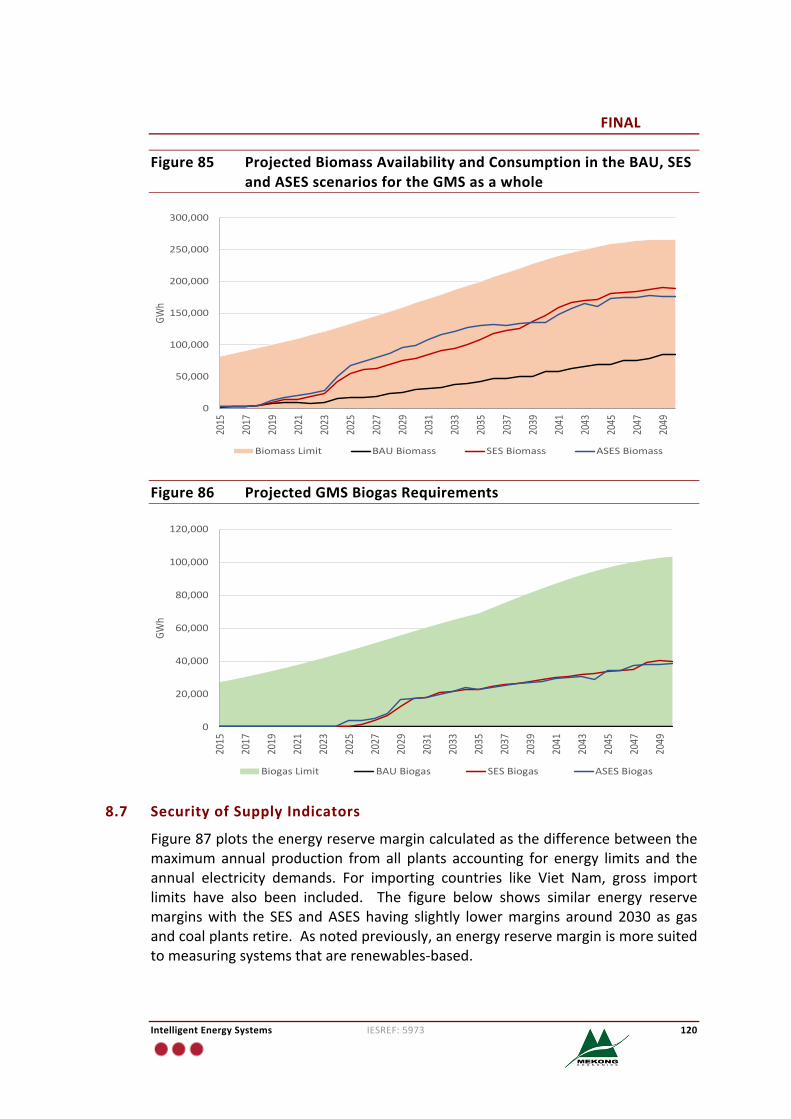
FINAL
IntelligentEnergySystems IESREF:5973 120
Figure85 ProjectedBiomassAvailabilityandConsumptionintheBAU,SESandASESscenariosfortheGMSasawhole
Figure86 ProjectedGMSBiogasRequirements
8.7 SecurityofSupplyIndicators
Figure87plotstheenergyreservemargincalculatedasthedifferencebetweenthemaximumannual production from all plants accounting for energy limits and theannual electricity demands. For importing countries like Viet Nam, gross importlimits have also been included. The figure below shows similar energy reservemarginswith the SES andASES having slightly lowermargins around 2030 as gasandcoalplantsretire.Asnotedpreviously,anenergyreservemarginismoresuitedtomeasuringsystemsthatarerenewables-based.
0
50,000
100,000
150,000
200,000
250,000
300,0002015
2017
2019
2021
2023
2025
2027
2029
2031
2033
2035
2037
2039
2041
2043
2045
2047
2049
GWh
BiomassLimit BAUBiomass SESBiomass ASESBiomass
0
20,000
40,000
60,000
80,000
100,000
120,000
2015
2017
2019
2021
2023
2025
2027
2029
2031
2033
2035
2037
2039
2041
2043
2045
2047
2049
GWh
BiogasLimit BAUBiogas SESBiogas ASESBiogas
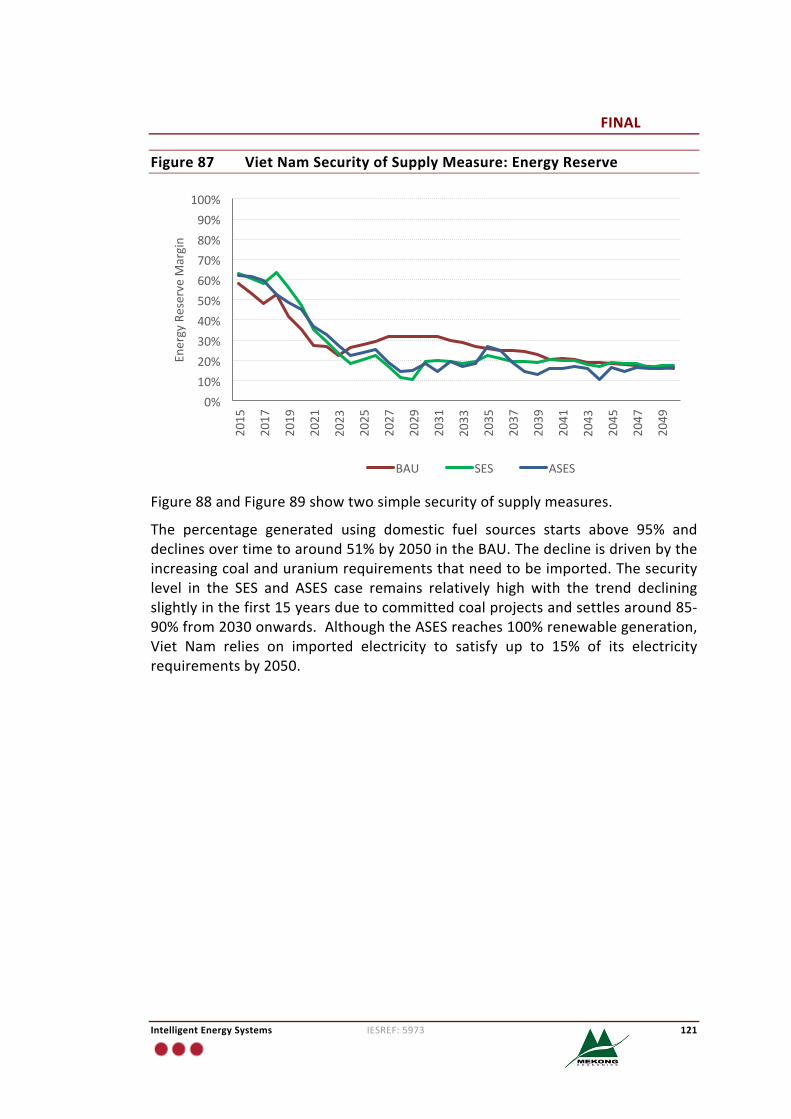
FINAL
IntelligentEnergySystems IESREF:5973 121
Figure87 VietNamSecurityofSupplyMeasure:EnergyReserve
Figure88andFigure89showtwosimplesecurityofsupplymeasures.
The percentage generated using domestic fuel sources starts above 95% anddeclinesovertimetoaround51%by2050intheBAU.Thedeclineisdrivenbytheincreasingcoalanduraniumrequirementsthatneedtobeimported.Thesecuritylevel in the SES and ASES case remains relatively high with the trend decliningslightlyinthefirst15yearsduetocommittedcoalprojectsandsettlesaround85-90%from2030onwards.AlthoughtheASESreaches100%renewablegeneration,Viet Nam relies on imported electricity to satisfy up to 15% of its electricityrequirementsby2050.
0%10%20%30%40%50%60%70%80%90%100%
2015
2017
2019
2021
2023
2025
2027
2029
2031
2033
2035
2037
2039
2041
2043
2045
2047
2049
EnergyReserveM
argin
BAU SES ASES
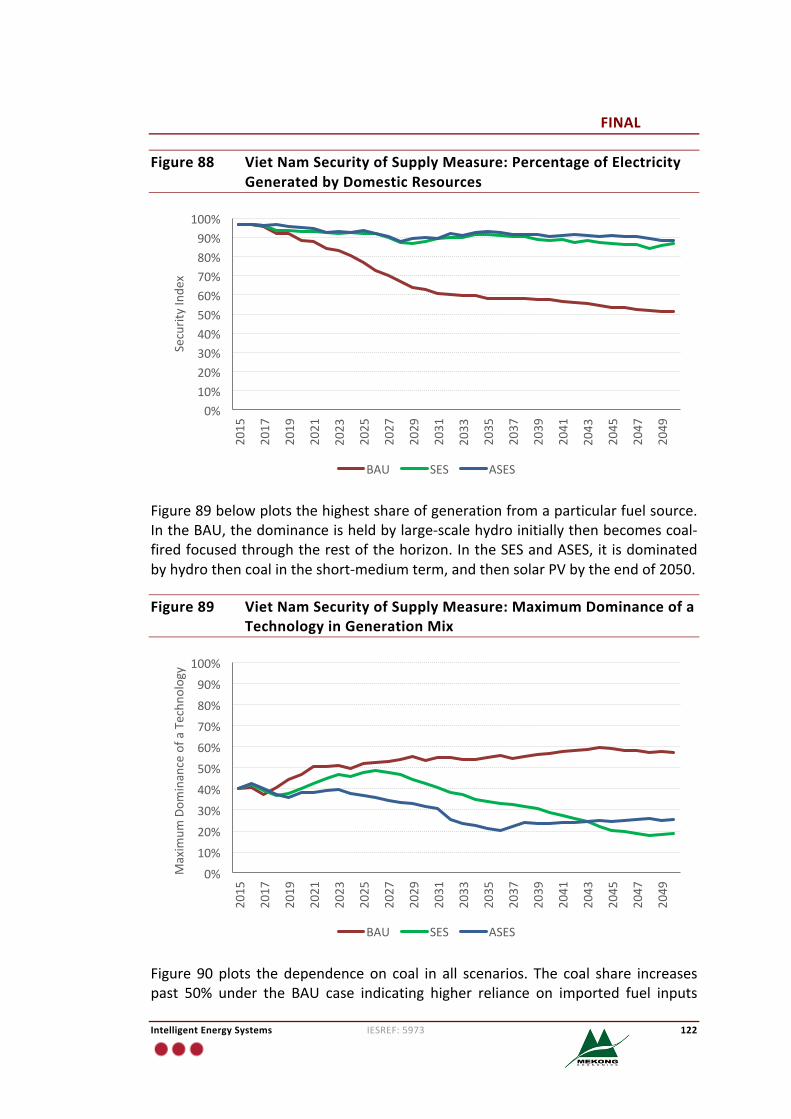
FINAL
IntelligentEnergySystems IESREF:5973 122
Figure88 VietNamSecurityofSupplyMeasure:PercentageofElectricityGeneratedbyDomesticResources
Figure89belowplotsthehighestshareofgenerationfromaparticularfuelsource.IntheBAU,thedominanceisheldbylarge-scalehydroinitiallythenbecomescoal-firedfocusedthroughtherestofthehorizon.IntheSESandASES,it isdominatedbyhydrothencoalintheshort-mediumterm,andthensolarPVbytheendof2050.
Figure89 VietNamSecurityofSupplyMeasure:MaximumDominanceofaTechnologyinGenerationMix
Figure 90 plots the dependenceon coal in all scenarios. The coal share increasespast 50% under the BAU case indicating higher reliance on imported fuel inputs
0%10%20%30%40%50%60%70%80%90%100%
2015
2017
2019
2021
2023
2025
2027
2029
2031
2033
2035
2037
2039
2041
2043
2045
2047
2049
SecurityInde
x
BAU SES ASES
0%
10%
20%
30%
40%
50%
60%
70%
80%
90%
100%
2015
2017
2019
2021
2023
2025
2027
2029
2031
2033
2035
2037
2039
2041
2043
2045
2047
2049M
axim
umDom
inanceofaTechn
ology
BAU SES ASES
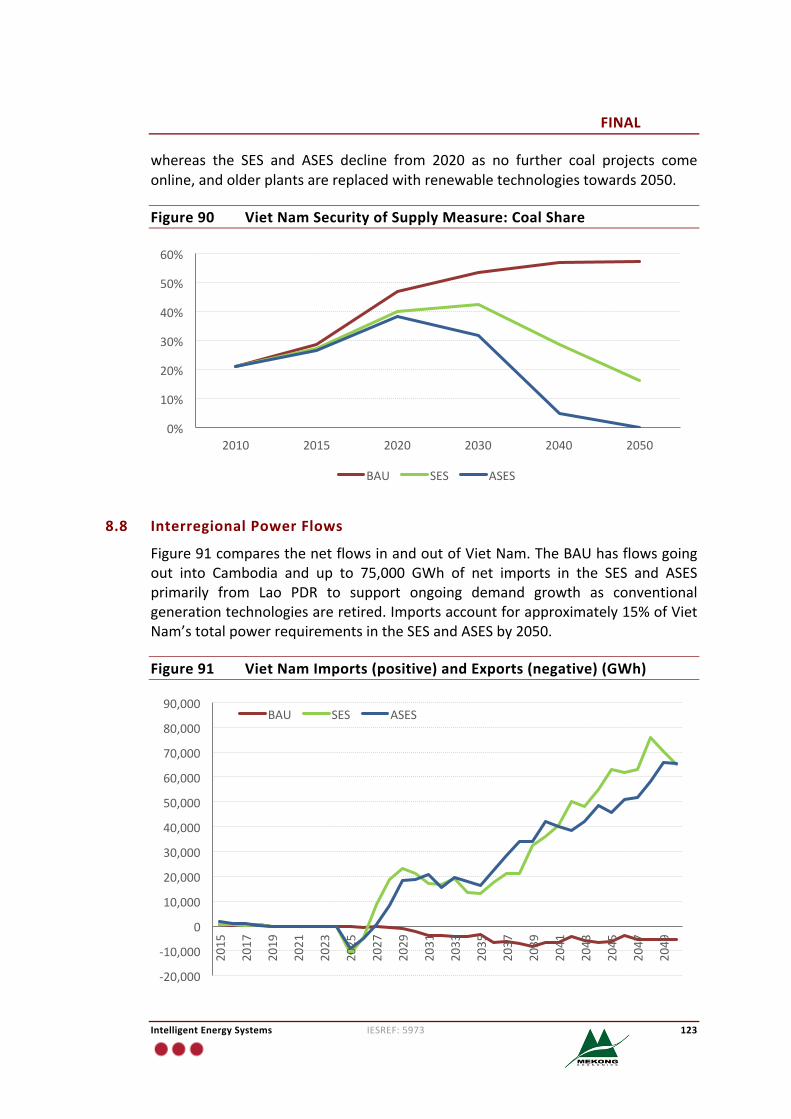
FINAL
IntelligentEnergySystems IESREF:5973 123
whereas the SES and ASES decline from 2020 as no further coal projects comeonline,andolderplantsarereplacedwithrenewabletechnologiestowards2050.
Figure90 VietNamSecurityofSupplyMeasure:CoalShare
8.8 InterregionalPowerFlows
Figure91comparesthenetflowsinandoutofVietNam.TheBAUhasflowsgoingout into Cambodia and up to 75,000 GWh of net imports in the SES and ASESprimarily from Lao PDR to support ongoing demand growth as conventionalgenerationtechnologiesareretired.Importsaccountforapproximately15%ofVietNam’stotalpowerrequirementsintheSESandASESby2050.
Figure91 VietNamImports(positive)andExports(negative)(GWh)
0%
10%
20%
30%
40%
50%
60%
2010 2015 2020 2030 2040 2050
BAU SES ASES
-20,000
-10,000
0
10,000
20,000
30,000
40,000
50,000
60,000
70,000
80,000
90,000
2015
2017
2019
2021
2023
2025
2027
2029
2031
2033
2035
2037
2039
2041
2043
2045
2047
2049
BAU SES ASES
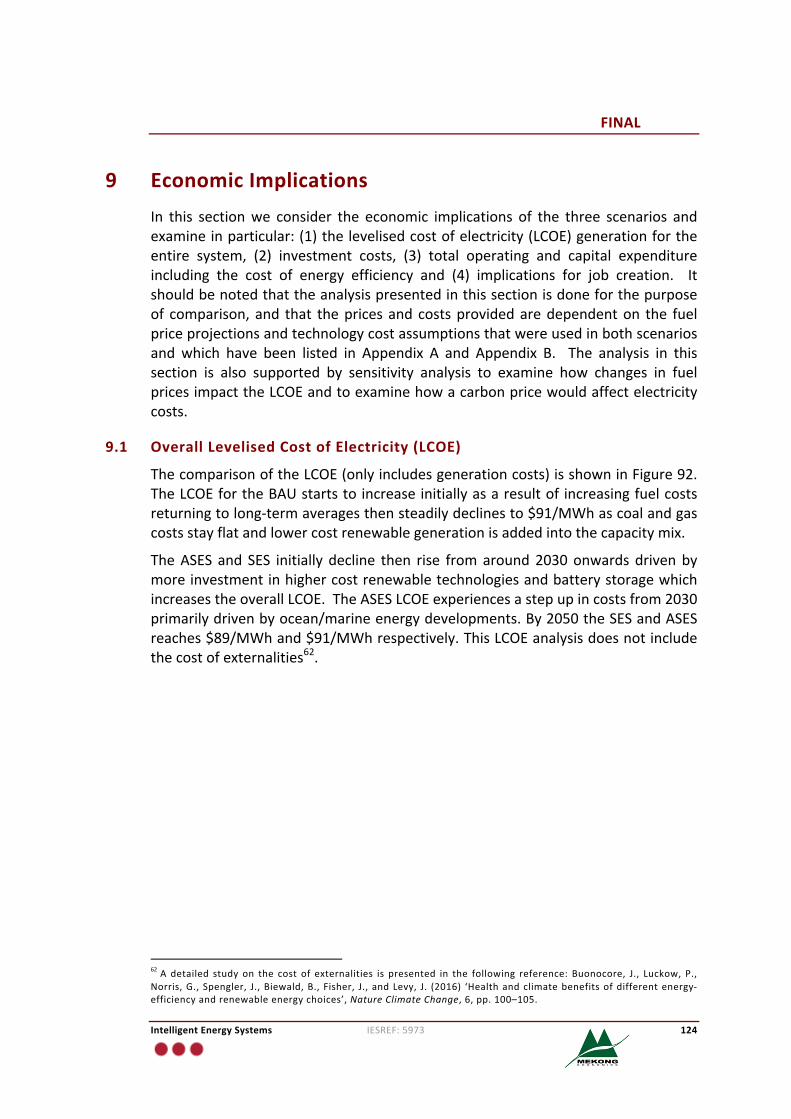
FINAL
IntelligentEnergySystems IESREF:5973 124
9 EconomicImplicationsIn this sectionwe consider the economic implications of the three scenarios andexamineinparticular:(1)thelevelisedcostofelectricity(LCOE)generationfortheentire system, (2) investment costs, (3) total operating and capital expenditureincluding the cost of energy efficiency and (4) implications for job creation. Itshouldbenotedthattheanalysispresentedinthissectionisdoneforthepurposeof comparison,and that thepricesandcostsprovidedaredependenton the fuelpriceprojectionsandtechnologycostassumptionsthatwereusedinbothscenariosand which have been listed in Appendix A and Appendix B. The analysis in thissection is also supported by sensitivity analysis to examine how changes in fuelpricesimpacttheLCOEandtoexaminehowacarbonpricewouldaffectelectricitycosts.
9.1 OverallLevelisedCostofElectricity(LCOE)
ThecomparisonoftheLCOE(onlyincludesgenerationcosts)isshowninFigure92.TheLCOEfortheBAUstartstoincreaseinitiallyasaresultof increasingfuelcostsreturningtolong-termaveragesthensteadilydeclinesto$91/MWhascoalandgascostsstayflatandlowercostrenewablegenerationisaddedintothecapacitymix.
TheASES and SES initially decline then rise fromaround2030onwardsdrivenbymoreinvestmentinhighercostrenewabletechnologiesandbatterystoragewhichincreasestheoverallLCOE.TheASESLCOEexperiencesastepupincostsfrom2030primarilydrivenbyocean/marineenergydevelopments.By2050theSESandASESreaches$89/MWhand$91/MWhrespectively.ThisLCOEanalysisdoesnotincludethecostofexternalities62.
62A detailed study on the cost of externalities is presented in the following reference: Buonocore, J., Luckow, P.,Norris,G.,Spengler, J.,Biewald,B., Fisher, J.,andLevy, J. (2016) ‘Healthandclimatebenefitsofdifferentenergy-efficiencyandrenewableenergychoices’,NatureClimateChange,6,pp.100–105.
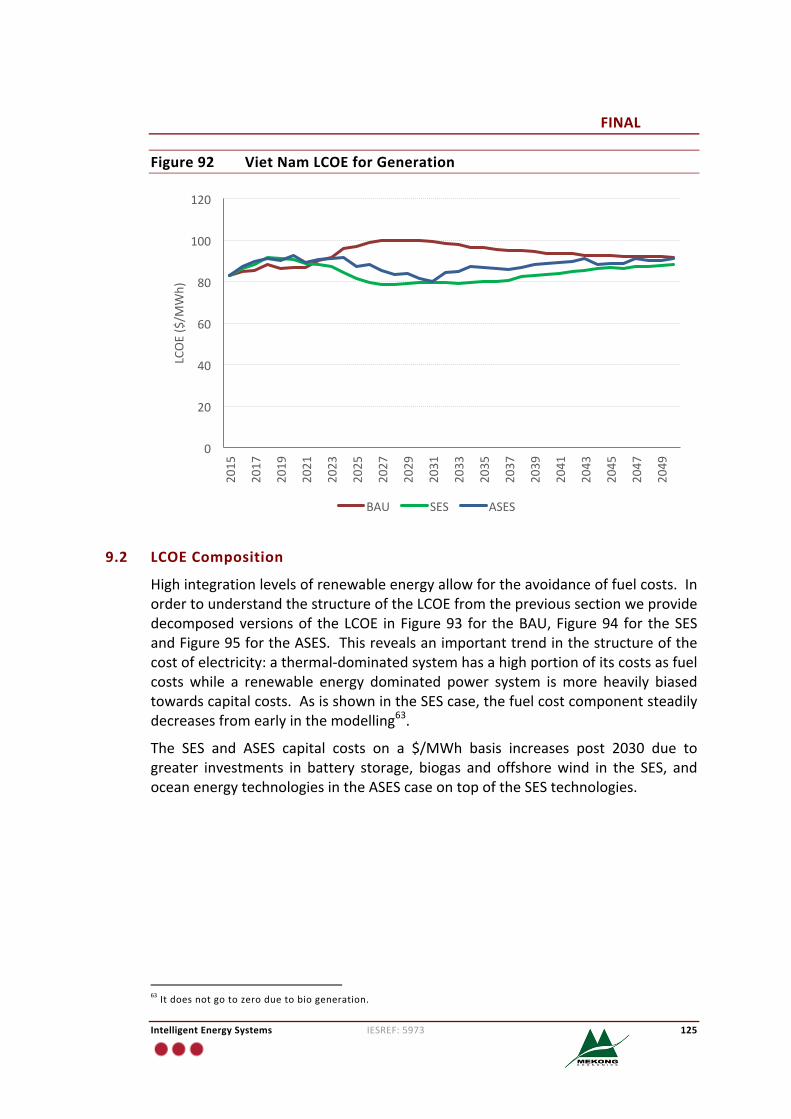
FINAL
IntelligentEnergySystems IESREF:5973 125
Figure92 VietNamLCOEforGeneration
9.2 LCOEComposition
Highintegrationlevelsofrenewableenergyallowfortheavoidanceoffuelcosts.InordertounderstandthestructureoftheLCOEfromtheprevioussectionweprovidedecomposedversionsof theLCOE inFigure93 for theBAU,Figure94 for theSESandFigure95fortheASES.Thisrevealsanimportanttrendinthestructureofthecostofelectricity:athermal-dominatedsystemhasahighportionofitscostsasfuelcosts while a renewable energy dominated power system ismore heavily biasedtowardscapitalcosts.AsisshownintheSEScase,thefuelcostcomponentsteadilydecreasesfromearlyinthemodelling63.
The SES and ASES capital costs on a $/MWh basis increases post 2030 due togreater investments in battery storage, biogas and offshorewind in the SES, andoceanenergytechnologiesintheASEScaseontopoftheSEStechnologies.
63Itdoesnotgotozeroduetobiogeneration.
0
20
40
60
80
100
120
2015
2017
2019
2021
2023
2025
2027
2029
2031
2033
2035
2037
2039
2041
2043
2045
2047
2049
LCOE($/M
Wh)
BAU SES ASES
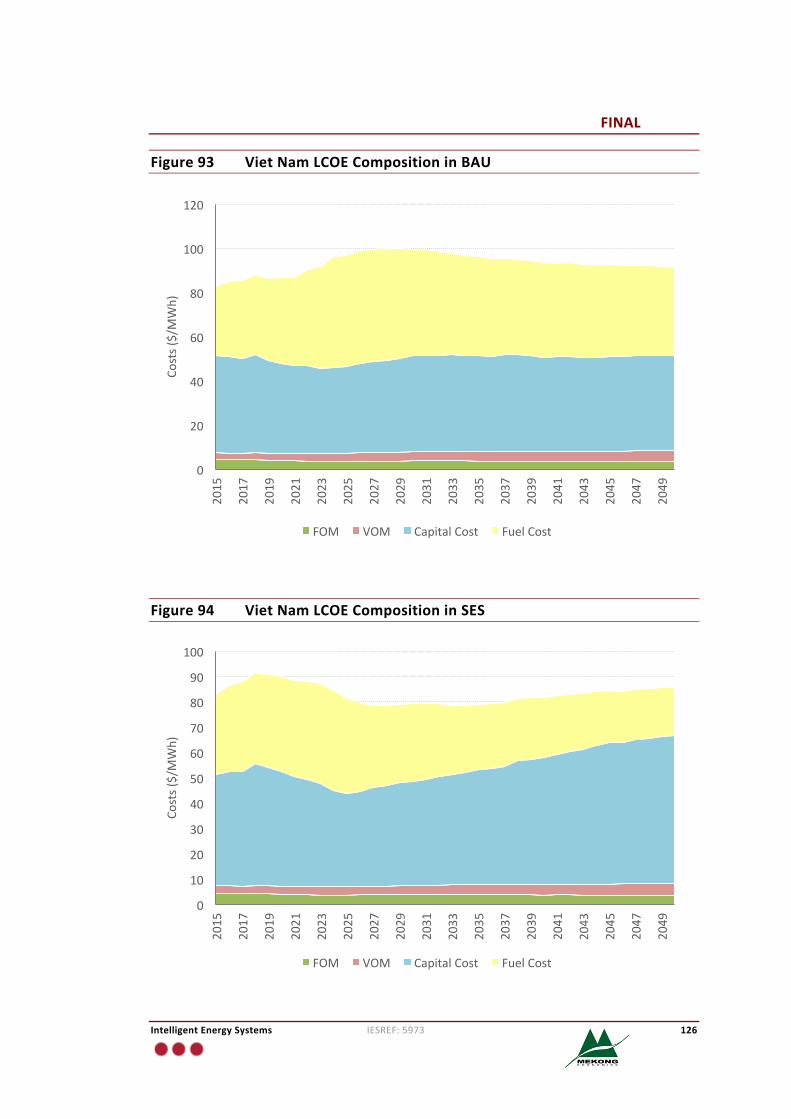
FINAL
IntelligentEnergySystems IESREF:5973 126
Figure93 VietNamLCOECompositioninBAU
Figure94 VietNamLCOECompositioninSES
0
20
40
60
80
100
1202015
2017
2019
2021
2023
2025
2027
2029
2031
2033
2035
2037
2039
2041
2043
2045
2047
2049
Costs($/MWh)
FOM VOM CapitalCost FuelCost
0
10
20
30
40
50
60
70
80
90
100
2015
2017
2019
2021
2023
2025
2027
2029
2031
2033
2035
2037
2039
2041
2043
2045
2047
2049
Costs($/MWh)
FOM VOM CapitalCost FuelCost
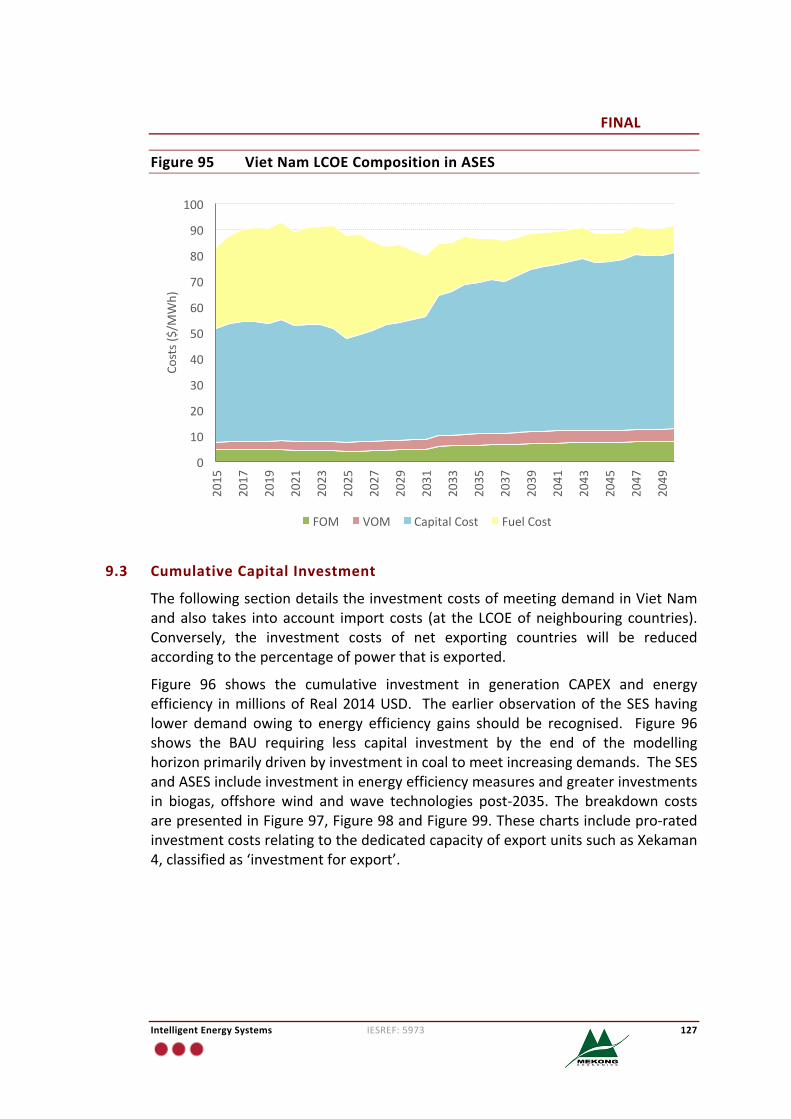
FINAL
IntelligentEnergySystems IESREF:5973 127
Figure95 VietNamLCOECompositioninASES
9.3 CumulativeCapitalInvestment
ThefollowingsectiondetailstheinvestmentcostsofmeetingdemandinVietNamandalso takes intoaccount import costs (at theLCOEofneighbouring countries).Conversely, the investment costs of net exporting countries will be reducedaccordingtothepercentageofpowerthatisexported.
Figure 96 shows the cumulative investment in generation CAPEX and energyefficiency inmillionsofReal2014USD. Theearlierobservationof theSEShavinglower demand owing to energy efficiency gains should be recognised. Figure 96shows the BAU requiring less capital investment by the end of the modellinghorizonprimarilydrivenbyinvestmentincoaltomeetincreasingdemands.TheSESandASESincludeinvestmentinenergyefficiencymeasuresandgreaterinvestmentsin biogas, offshorewind andwave technologies post-2035. The breakdown costsarepresentedinFigure97,Figure98andFigure99.Thesechartsincludepro-ratedinvestmentcostsrelatingtothededicatedcapacityofexportunitssuchasXekaman4,classifiedas‘investmentforexport’.
0
10
20
30
40
50
60
70
80
90
1002015
2017
2019
2021
2023
2025
2027
2029
2031
2033
2035
2037
2039
2041
2043
2045
2047
2049
Costs($/MWh)
FOM VOM CapitalCost FuelCost
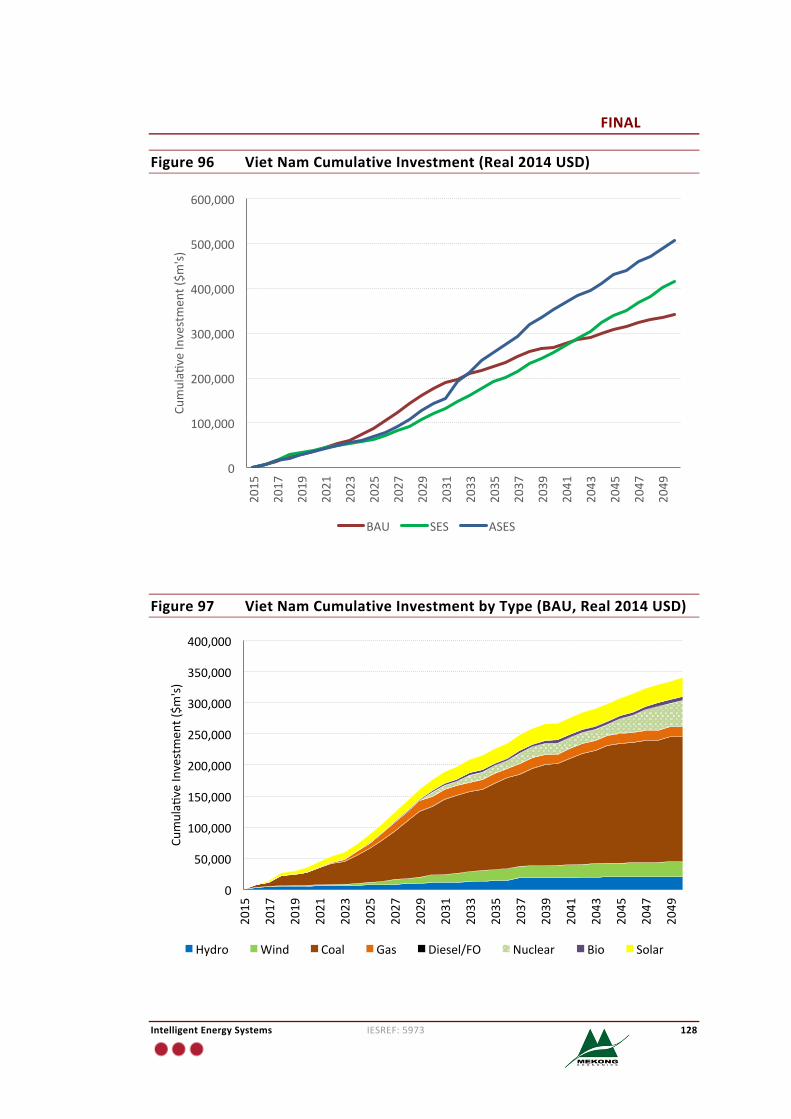
FINAL
IntelligentEnergySystems IESREF:5973 128
Figure96 VietNamCumulativeInvestment(Real2014USD)
Figure97 VietNamCumulativeInvestmentbyType(BAU,Real2014USD)
0
100,000
200,000
300,000
400,000
500,000
600,000
2015
2017
2019
2021
2023
2025
2027
2029
2031
2033
2035
2037
2039
2041
2043
2045
2047
2049
Cumula�
veInvestmen
t($m
's)
BAU SES ASES
0
50,000
100,000
150,000
200,000
250,000
300,000
350,000
400,000
2015
2017
2019
2021
2023
2025
2027
2029
2031
2033
2035
2037
2039
2041
2043
2045
2047
2049
Cumula�
veInvestmen
t($m
's)
Hydro Wind Coal Gas Diesel/FO Nuclear Bio Solar
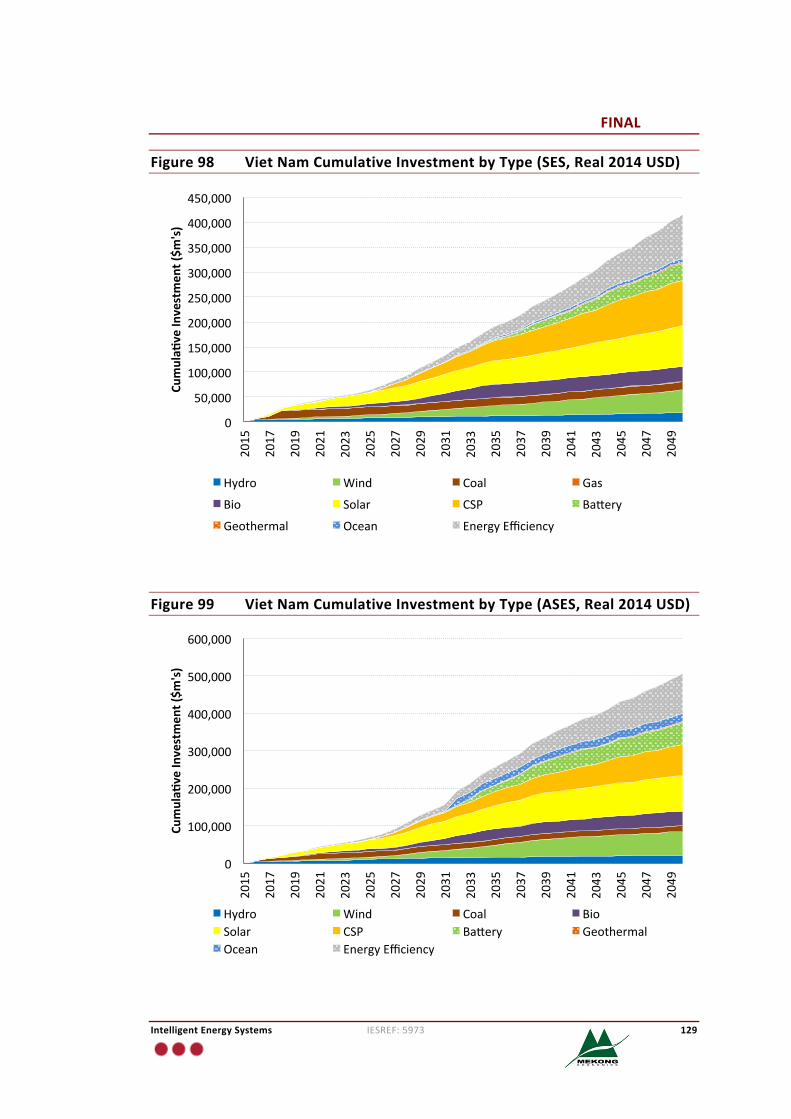
FINAL
IntelligentEnergySystems IESREF:5973 129
Figure98 VietNamCumulativeInvestmentbyType(SES,Real2014USD)
Figure99 VietNamCumulativeInvestmentbyType(ASES,Real2014USD)
0
50,000
100,000
150,000
200,000
250,000
300,000
350,000
400,000
450,000
2015
2017
2019
2021
2023
2025
2027
2029
2031
2033
2035
2037
2039
2041
2043
2045
2047
2049
Cumulaf
veIn
vestmen
t($m
's)
Hydro Wind Coal Gas
Bio Solar CSP Ba�ery
Geothermal Ocean EnergyEfficiency
0
100,000
200,000
300,000
400,000
500,000
600,000
2015
2017
2019
2021
2023
2025
2027
2029
2031
2033
2035
2037
2039
2041
2043
2045
2047
2049
Cumulaf
veIn
vestmen
t($m
's)
Hydro Wind Coal BioSolar CSP Ba�ery GeothermalOcean EnergyEfficiency
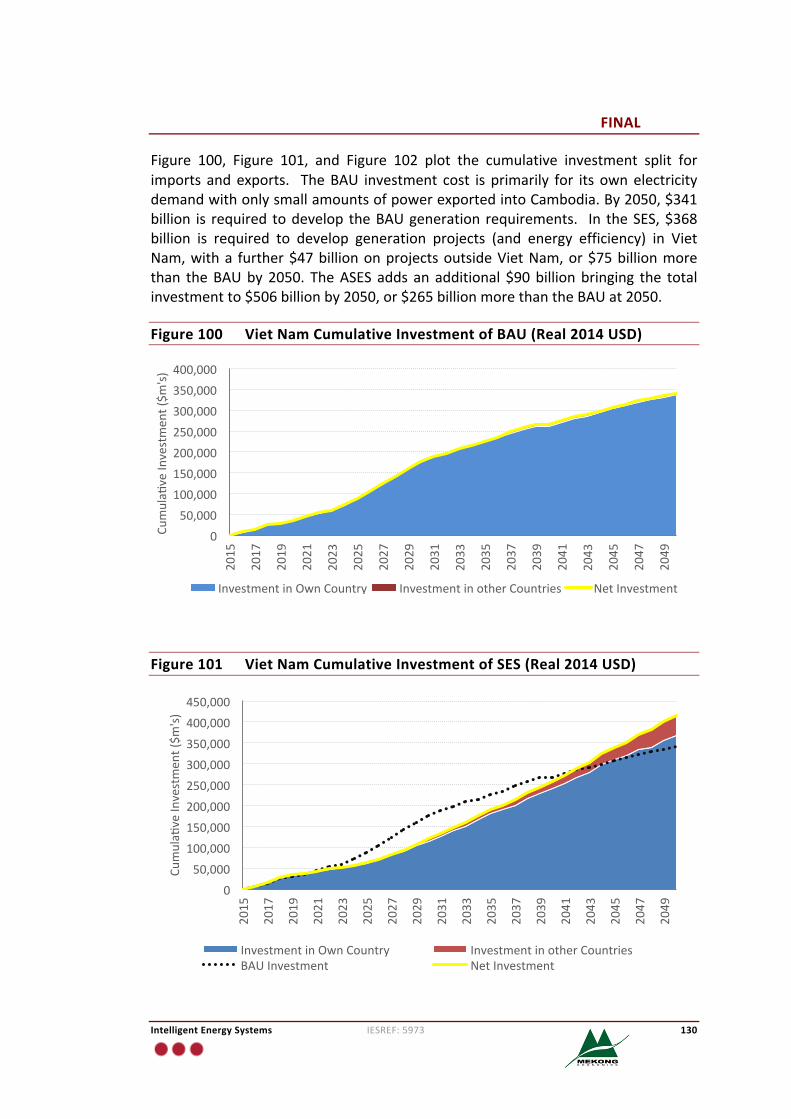
FINAL
IntelligentEnergySystems IESREF:5973 130
Figure 100, Figure 101, and Figure 102 plot the cumulative investment split forimports andexports. TheBAU investment cost is primarily for its ownelectricitydemandwithonlysmallamountsofpowerexportedintoCambodia.By2050,$341billion is required todevelop theBAUgeneration requirements. In theSES,$368billion is required to develop generation projects (and energy efficiency) in VietNam,witha further$47billiononprojectsoutsideVietNam,or$75billionmorethan theBAUby2050. TheASESadds an additional $90billionbringing the totalinvestmentto$506billionby2050,or$265billionmorethantheBAUat2050.
Figure100 VietNamCumulativeInvestmentofBAU(Real2014USD)
Figure101 VietNamCumulativeInvestmentofSES(Real2014USD)
050,000100,000150,000200,000250,000300,000350,000400,000
2015
2017
2019
2021
2023
2025
2027
2029
2031
2033
2035
2037
2039
2041
2043
2045
2047
2049
Cumula�
veInvestmen
t($m
's)
InvestmentinOwnCountry InvestmentinotherCountries NetInvestment
050,000100,000150,000200,000250,000300,000350,000400,000450,000
2015
2017
2019
2021
2023
2025
2027
2029
2031
2033
2035
2037
2039
2041
2043
2045
2047
2049
Cumula�
veInvestmen
t($m
's)
InvestmentinOwnCountry InvestmentinotherCountriesBAUInvestment NetInvestment
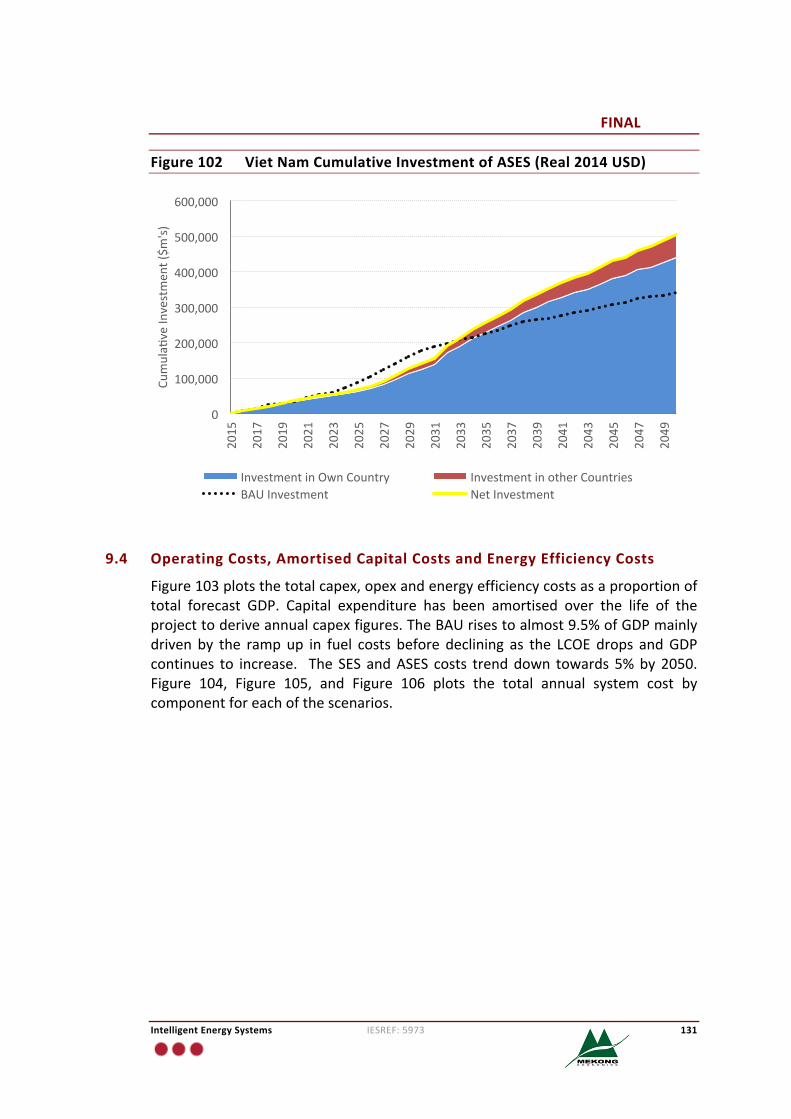
FINAL
IntelligentEnergySystems IESREF:5973 131
Figure102 VietNamCumulativeInvestmentofASES(Real2014USD)
9.4 OperatingCosts,AmortisedCapitalCostsandEnergyEfficiencyCosts
Figure103plotsthetotalcapex,opexandenergyefficiencycostsasaproportionoftotal forecast GDP. Capital expenditure has been amortised over the life of theprojecttoderiveannualcapexfigures.TheBAUrisestoalmost9.5%ofGDPmainlydriven by the rampup in fuel costs before declining as the LCOE drops andGDPcontinues to increase. The SES andASES costs trenddown towards 5%by2050.Figure 104, Figure 105, and Figure 106 plots the total annual system cost bycomponentforeachofthescenarios.
0
100,000
200,000
300,000
400,000
500,000
600,000
2015
2017
2019
2021
2023
2025
2027
2029
2031
2033
2035
2037
2039
2041
2043
2045
2047
2049
Cumula�
veInvestmen
t($m
's)
InvestmentinOwnCountry InvestmentinotherCountriesBAUInvestment NetInvestment
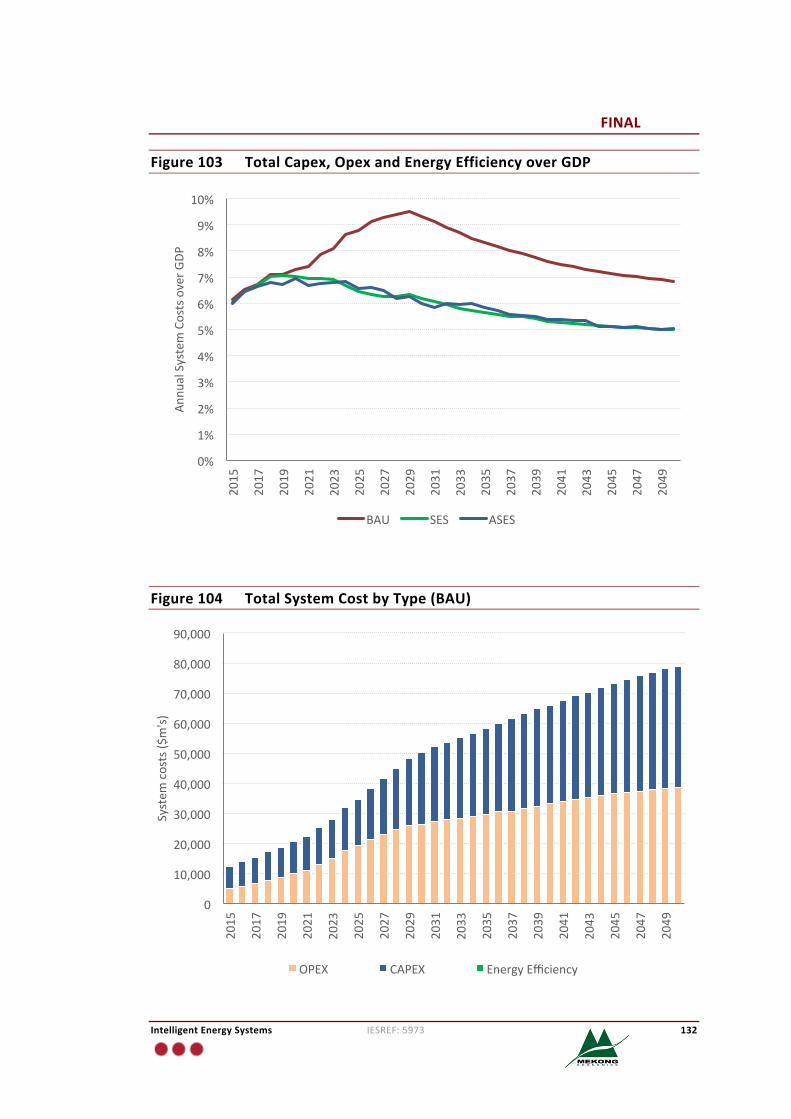
FINAL
IntelligentEnergySystems IESREF:5973 132
Figure103 TotalCapex,OpexandEnergyEfficiencyoverGDP
Figure104 TotalSystemCostbyType(BAU)
0%
1%
2%
3%
4%
5%
6%
7%
8%
9%
10%
2015
2017
2019
2021
2023
2025
2027
2029
2031
2033
2035
2037
2039
2041
2043
2045
2047
2049
Annu
alSystemCostsoverG
DP
BAU SES ASES
0
10,000
20,000
30,000
40,000
50,000
60,000
70,000
80,000
90,000
2015
2017
2019
2021
2023
2025
2027
2029
2031
2033
2035
2037
2039
2041
2043
2045
2047
2049
System
costs($
m's)
OPEX CAPEX EnergyEfficiency
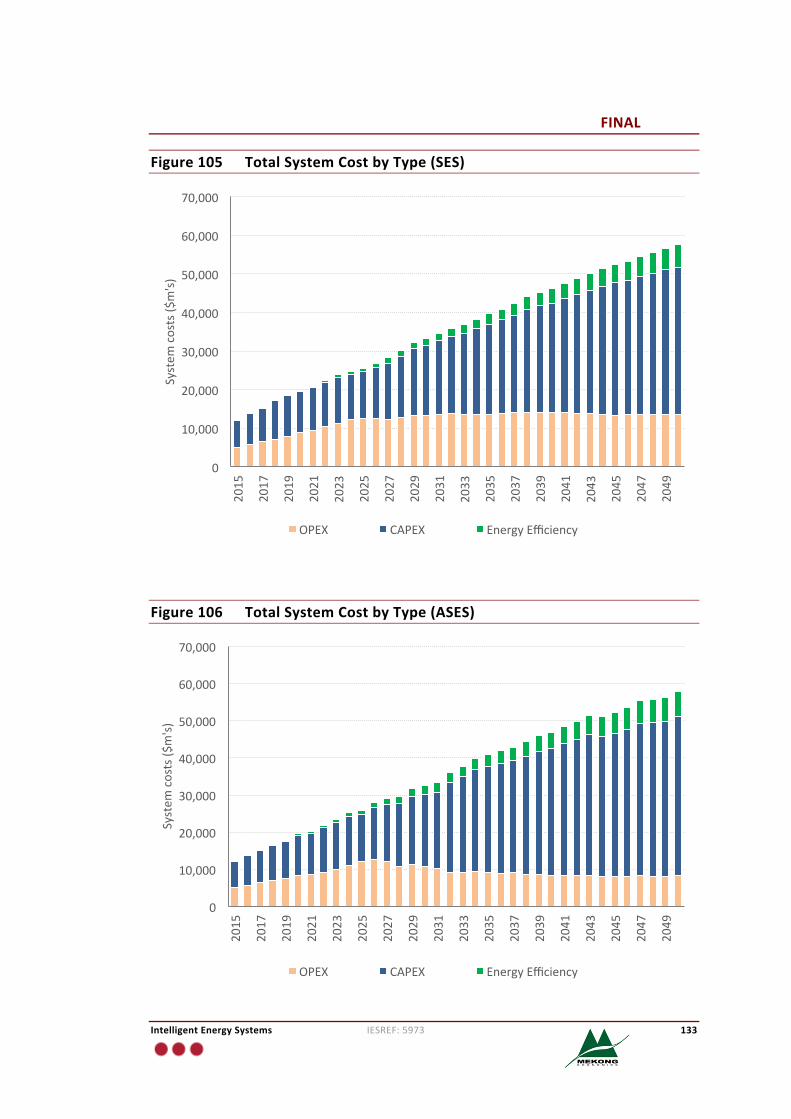
FINAL
IntelligentEnergySystems IESREF:5973 133
Figure105 TotalSystemCostbyType(SES)
Figure106 TotalSystemCostbyType(ASES)
0
10,000
20,000
30,000
40,000
50,000
60,000
70,000
2015
2017
2019
2021
2023
2025
2027
2029
2031
2033
2035
2037
2039
2041
2043
2045
2047
2049
System
costs($
m's)
OPEX CAPEX EnergyEfficiency
0
10,000
20,000
30,000
40,000
50,000
60,000
70,000
2015
2017
2019
2021
2023
2025
2027
2029
2031
2033
2035
2037
2039
2041
2043
2045
2047
2049
System
costs($
m's)
OPEX CAPEX EnergyEfficiency
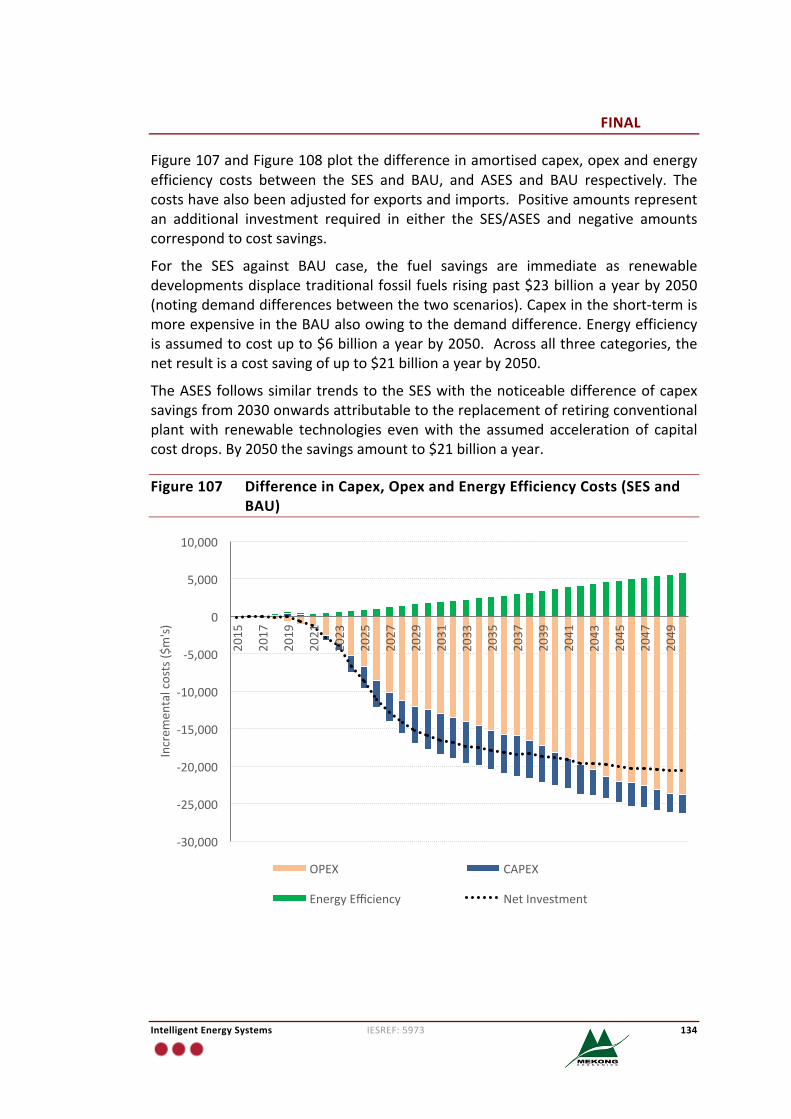
FINAL
IntelligentEnergySystems IESREF:5973 134
Figure107andFigure108plotthedifferenceinamortisedcapex,opexandenergyefficiency costs between the SES and BAU, and ASES and BAU respectively. Thecostshavealsobeenadjustedforexportsandimports.Positiveamountsrepresentan additional investment required in either the SES/ASES and negative amountscorrespondtocostsavings.
For the SES against BAU case, the fuel savings are immediate as renewabledevelopmentsdisplacetraditionalfossilfuelsrisingpast$23billionayearby2050(notingdemanddifferencesbetweenthetwoscenarios).Capexintheshort-termismoreexpensiveintheBAUalsoowingtothedemanddifference.Energyefficiencyisassumedtocostupto$6billionayearby2050.Acrossallthreecategories,thenetresultisacostsavingofupto$21billionayearby2050.
TheASESfollowssimilartrendstotheSESwiththenoticeabledifferenceofcapexsavingsfrom2030onwardsattributabletothereplacementofretiringconventionalplantwith renewable technologies evenwith the assumed acceleration of capitalcostdrops.By2050thesavingsamountto$21billionayear.
Figure107 DifferenceinCapex,OpexandEnergyEfficiencyCosts(SESandBAU)
-30,000
-25,000
-20,000
-15,000
-10,000
-5,000
0
5,000
10,000
2015
2017
2019
2021
2023
2025
2027
2029
2031
2033
2035
2037
2039
2041
2043
2045
2047
2049
Increm
entalcosts($
m's)
OPEX CAPEX
EnergyEfficiency NetInvestment
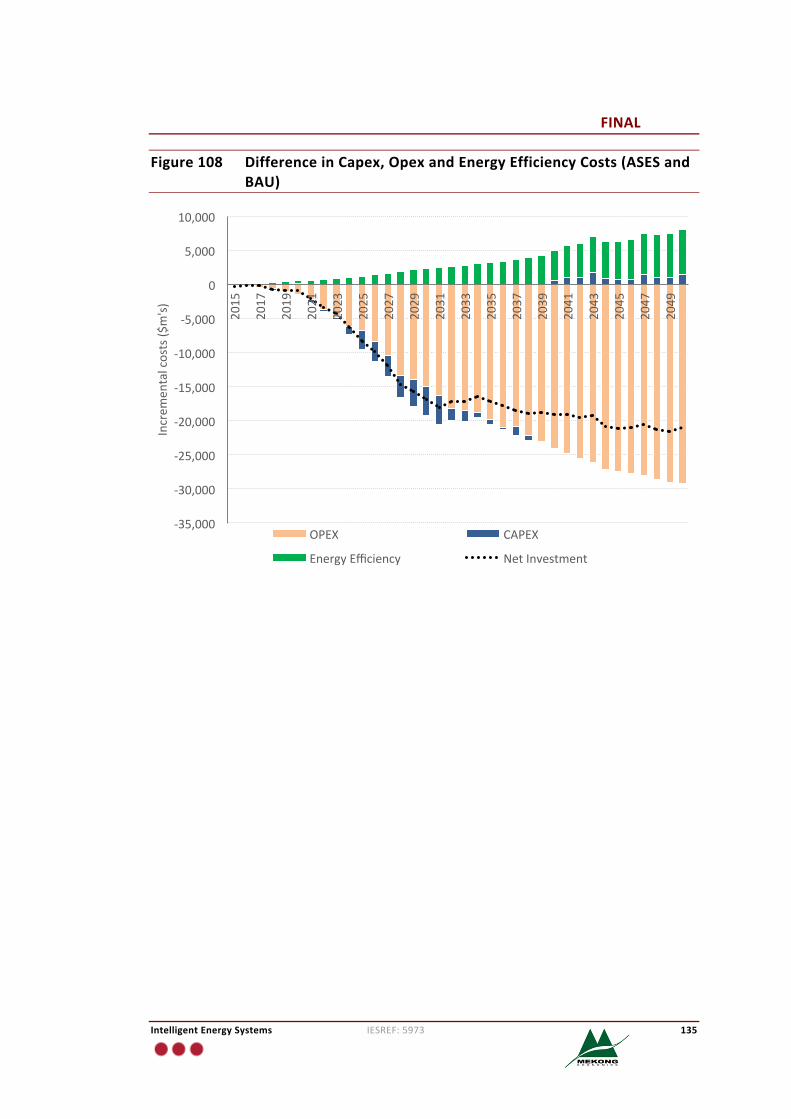
FINAL
IntelligentEnergySystems IESREF:5973 135
Figure108 DifferenceinCapex,OpexandEnergyEfficiencyCosts(ASESandBAU)
-35,000
-30,000
-25,000
-20,000
-15,000
-10,000
-5,000
0
5,000
10,0002015
2017
2019
2021
2023
2025
2027
2029
2031
2033
2035
2037
2039
2041
2043
2045
2047
2049
Increm
entalcosts($
m's)
OPEX CAPEX
EnergyEfficiency NetInvestment
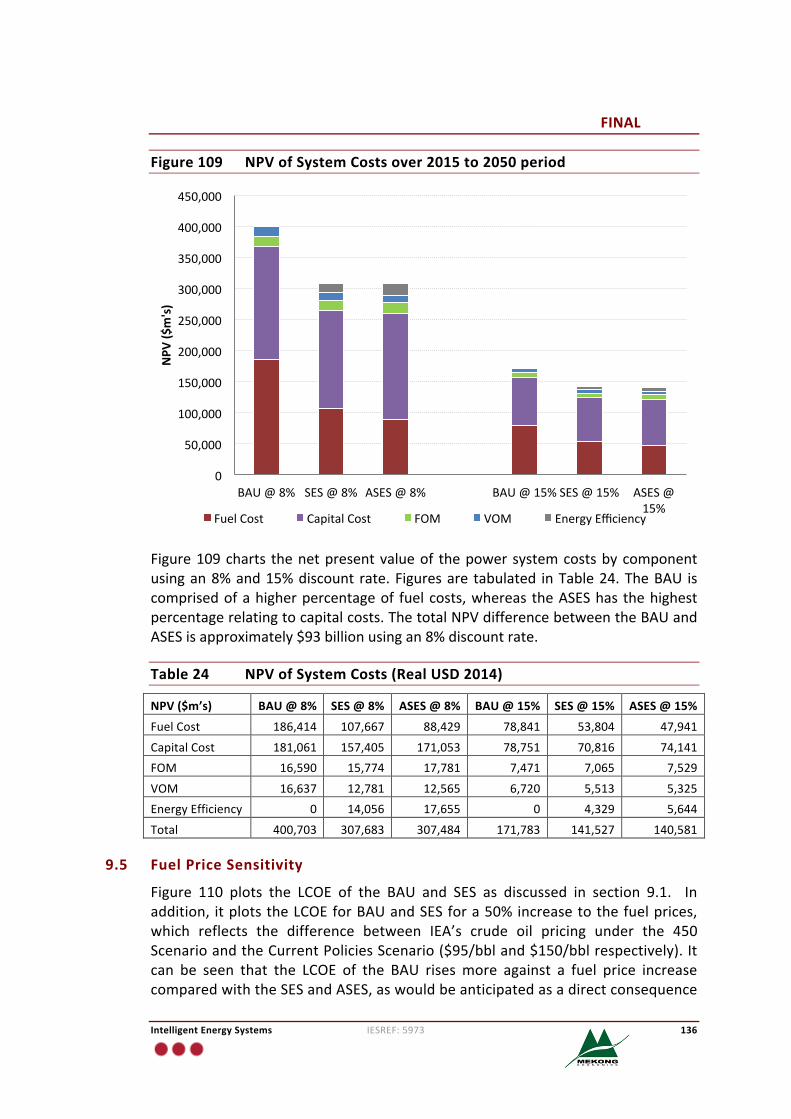
FINAL
IntelligentEnergySystems IESREF:5973 136
Figure109 NPVofSystemCostsover2015to2050period
Figure109charts thenetpresentvalueof thepowersystemcostsbycomponentusingan8%and15%discount rate.Figuresare tabulated inTable24.TheBAU iscomprisedofahigherpercentageof fuelcosts,whereas theASEShas thehighestpercentagerelatingtocapitalcosts.ThetotalNPVdifferencebetweentheBAUandASESisapproximately$93billionusingan8%discountrate.
Table24 NPVofSystemCosts(RealUSD2014)
NPV($m’s) BAU@8% SES@8% ASES@8% BAU@15% SES@15% ASES@15%
FuelCost 186,414 107,667 88,429 78,841 53,804 47,941
CapitalCost 181,061 157,405 171,053 78,751 70,816 74,141FOM 16,590 15,774 17,781 7,471 7,065 7,529
VOM 16,637 12,781 12,565 6,720 5,513 5,325EnergyEfficiency 0 14,056 17,655 0 4,329 5,644
Total 400,703 307,683 307,484 171,783 141,527 140,581
9.5 FuelPriceSensitivity
Figure 110 plots the LCOE of the BAU and SES as discussed in section 9.1. Inaddition, itplotstheLCOEforBAUandSESfora50%increasetothefuelprices,which reflects the difference between IEA’s crude oil pricing under the 450ScenarioandtheCurrentPoliciesScenario($95/bbland$150/bblrespectively).Itcan be seen that the LCOE of the BAU risesmore against a fuel price increasecomparedwiththeSESandASES,aswouldbeanticipatedasadirectconsequence
0
50,000
100,000
150,000
200,000
250,000
300,000
350,000
400,000
450,000
BAU@8% SES@8% ASES@8% BAU@15%SES@15% ASES@15%
NPV
($m's)
FuelCost CapitalCost FOM VOM EnergyEfficiency
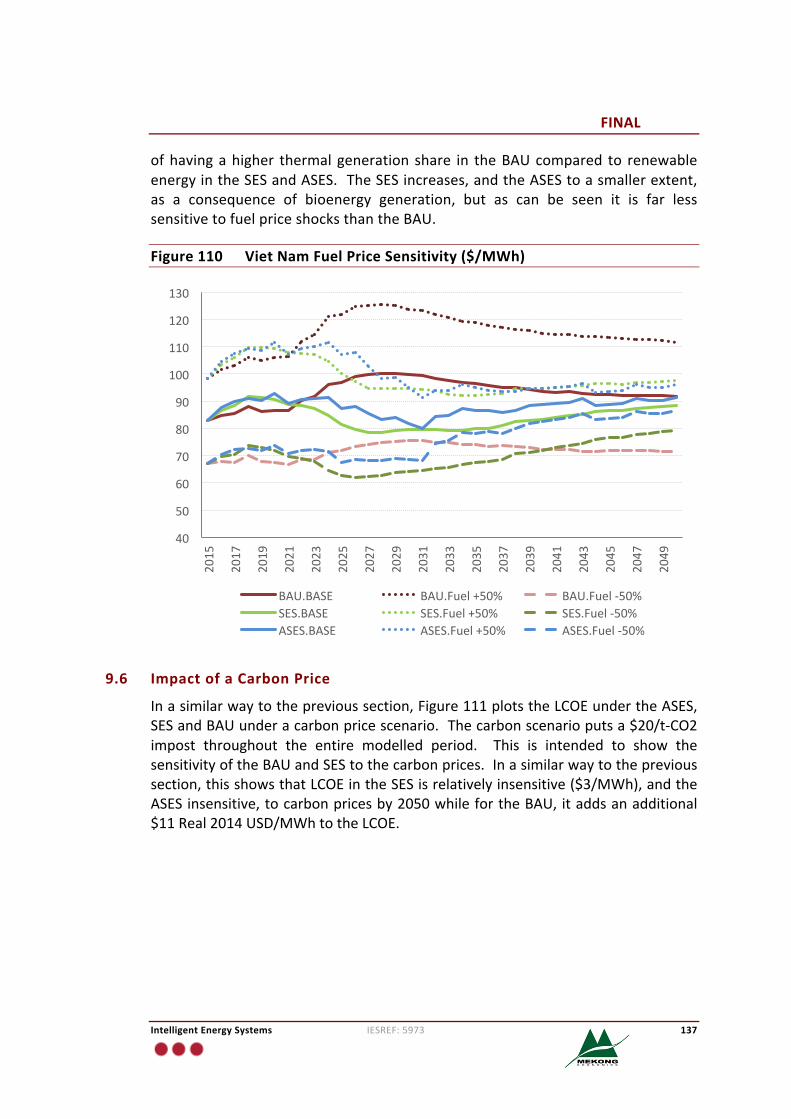
FINAL
IntelligentEnergySystems IESREF:5973 137
ofhavingahigher thermalgeneration share in theBAUcompared to renewableenergyintheSESandASES.TheSESincreases,andtheASEStoasmallerextent,as a consequence of bioenergy generation, but as can be seen it is far lesssensitivetofuelpriceshocksthantheBAU.
Figure110 VietNamFuelPriceSensitivity($/MWh)
9.6 ImpactofaCarbonPrice
Inasimilarwaytotheprevioussection,Figure111plotstheLCOEundertheASES,SESandBAUunderacarbonpricescenario.Thecarbonscenarioputsa$20/t-CO2impost throughout the entire modelled period. This is intended to show thesensitivityoftheBAUandSEStothecarbonprices.Inasimilarwaytotheprevioussection,thisshowsthatLCOEintheSESisrelativelyinsensitive($3/MWh),andtheASESinsensitive,tocarbonpricesby2050whilefortheBAU,itaddsanadditional$11Real2014USD/MWhtotheLCOE.
40
50
60
70
80
90
100
110
120
130
2015
2017
2019
2021
2023
2025
2027
2029
2031
2033
2035
2037
2039
2041
2043
2045
2047
2049
BAU.BASE BAU.Fuel+50% BAU.Fuel-50%SES.BASE SES.Fuel+50% SES.Fuel-50%ASES.BASE ASES.Fuel+50% ASES.Fuel-50%
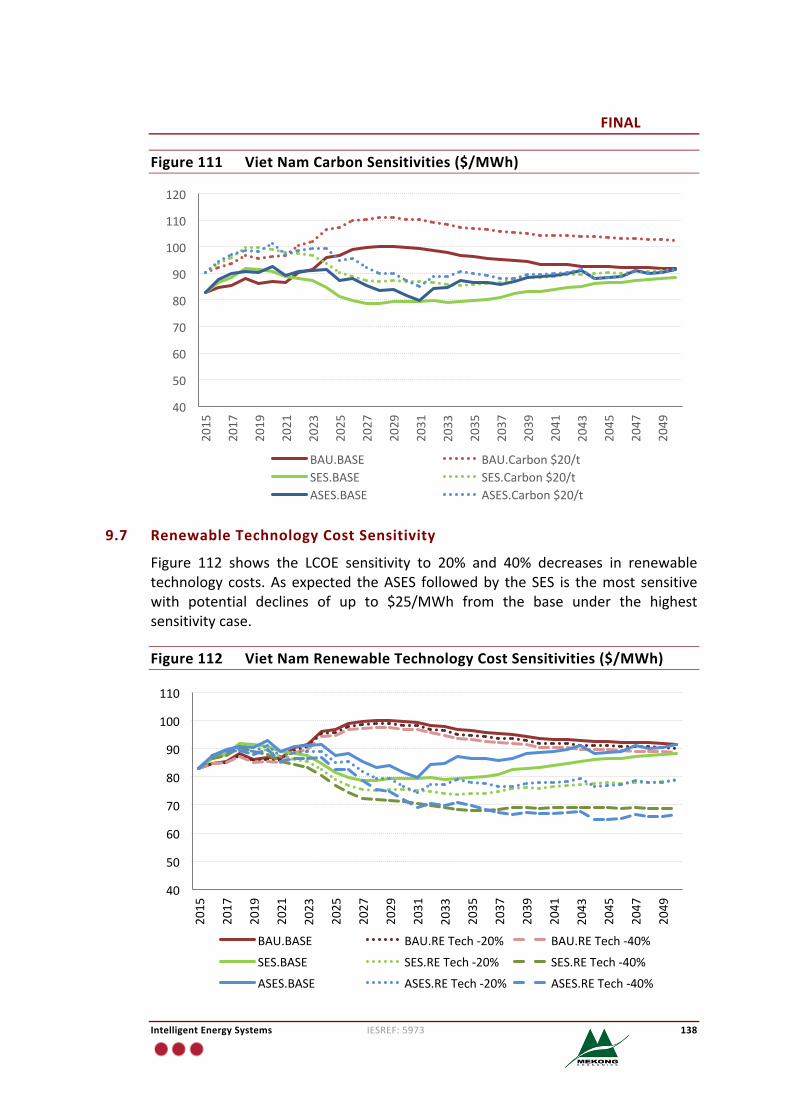
FINAL
IntelligentEnergySystems IESREF:5973 138
Figure111 VietNamCarbonSensitivities($/MWh)
9.7 RenewableTechnologyCostSensitivity
Figure 112 shows the LCOE sensitivity to 20% and 40% decreases in renewabletechnology costs.Asexpected theASES followedby theSES is themost sensitivewith potential declines of up to $25/MWh from the base under the highestsensitivitycase.
Figure112 VietNamRenewableTechnologyCostSensitivities($/MWh)
40
50
60
70
80
90
100
110
1202015
2017
2019
2021
2023
2025
2027
2029
2031
2033
2035
2037
2039
2041
2043
2045
2047
2049
BAU.BASE BAU.Carbon$20/tSES.BASE SES.Carbon$20/tASES.BASE ASES.Carbon$20/t
40
50
60
70
80
90
100
110
2015
2017
2019
2021
2023
2025
2027
2029
2031
2033
2035
2037
2039
2041
2043
2045
2047
2049
BAU.BASE BAU.RETech-20% BAU.RETech-40%
SES.BASE SES.RETech-20% SES.RETech-40%
ASES.BASE ASES.RETech-20% ASES.RETech-40%
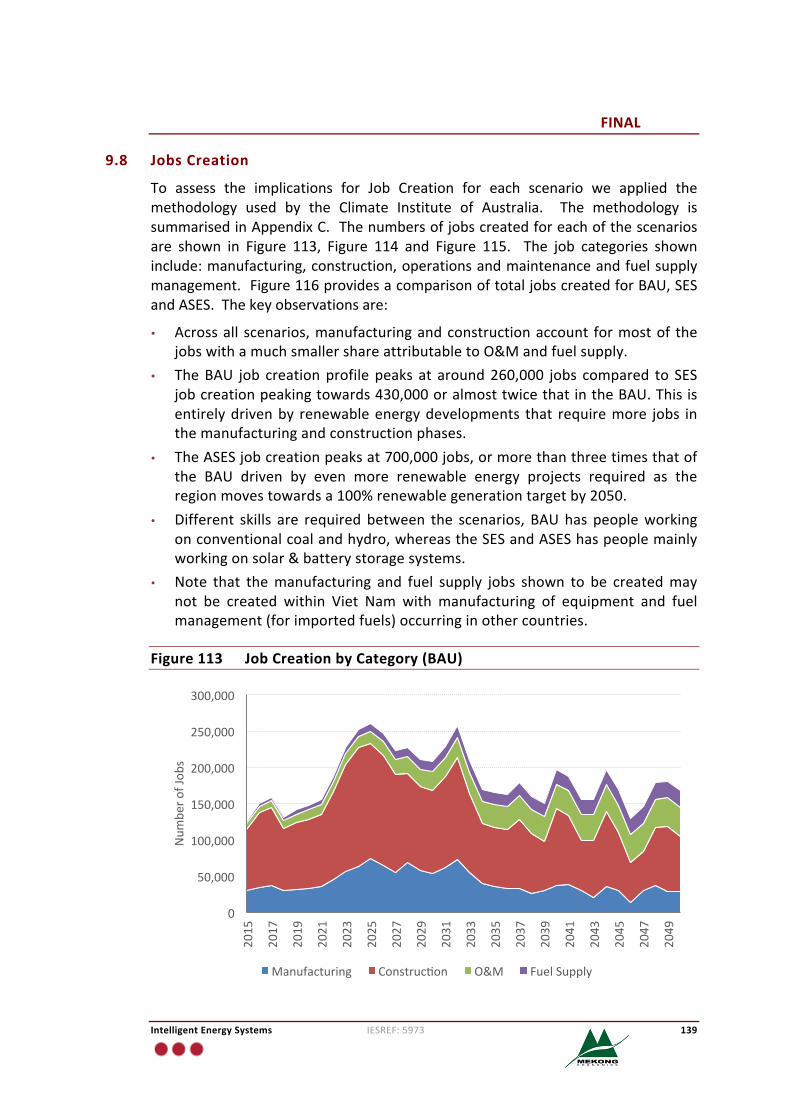
FINAL
IntelligentEnergySystems IESREF:5973 139
9.8 JobsCreation
To assess the implications for Job Creation for each scenario we applied themethodology used by the Climate Institute of Australia. The methodology issummarisedinAppendixC.Thenumbersofjobscreatedforeachofthescenariosare shown in Figure 113, Figure 114 and Figure 115. The job categories showninclude:manufacturing,construction,operationsandmaintenanceandfuelsupplymanagement.Figure116providesacomparisonoftotaljobscreatedforBAU,SESandASES.Thekeyobservationsare:
• Acrossall scenarios,manufacturingandconstructionaccount formostof thejobswithamuchsmallershareattributabletoO&Mandfuelsupply.
• TheBAU job creationprofilepeaks at around260,000 jobs compared to SESjobcreationpeakingtowards430,000oralmosttwicethatintheBAU.Thisisentirelydrivenby renewableenergydevelopments that requiremore jobs inthemanufacturingandconstructionphases.
• TheASESjobcreationpeaksat700,000jobs,ormorethanthreetimesthatofthe BAU driven by even more renewable energy projects required as theregionmovestowardsa100%renewablegenerationtargetby2050.
• Different skills are required between the scenarios, BAUhas peopleworkingonconventionalcoalandhydro,whereastheSESandASEShaspeoplemainlyworkingonsolar&batterystoragesystems.
• Note that themanufacturing and fuel supply jobs shown to be createdmaynot be created within Viet Nam with manufacturing of equipment and fuelmanagement(forimportedfuels)occurringinothercountries.
Figure113 JobCreationbyCategory(BAU)
0
50,000
100,000
150,000
200,000
250,000
300,000
2015
2017
2019
2021
2023
2025
2027
2029
2031
2033
2035
2037
2039
2041
2043
2045
2047
2049
Num
bero
fJob
s
Manufacturing Construc�on O&M FuelSupply
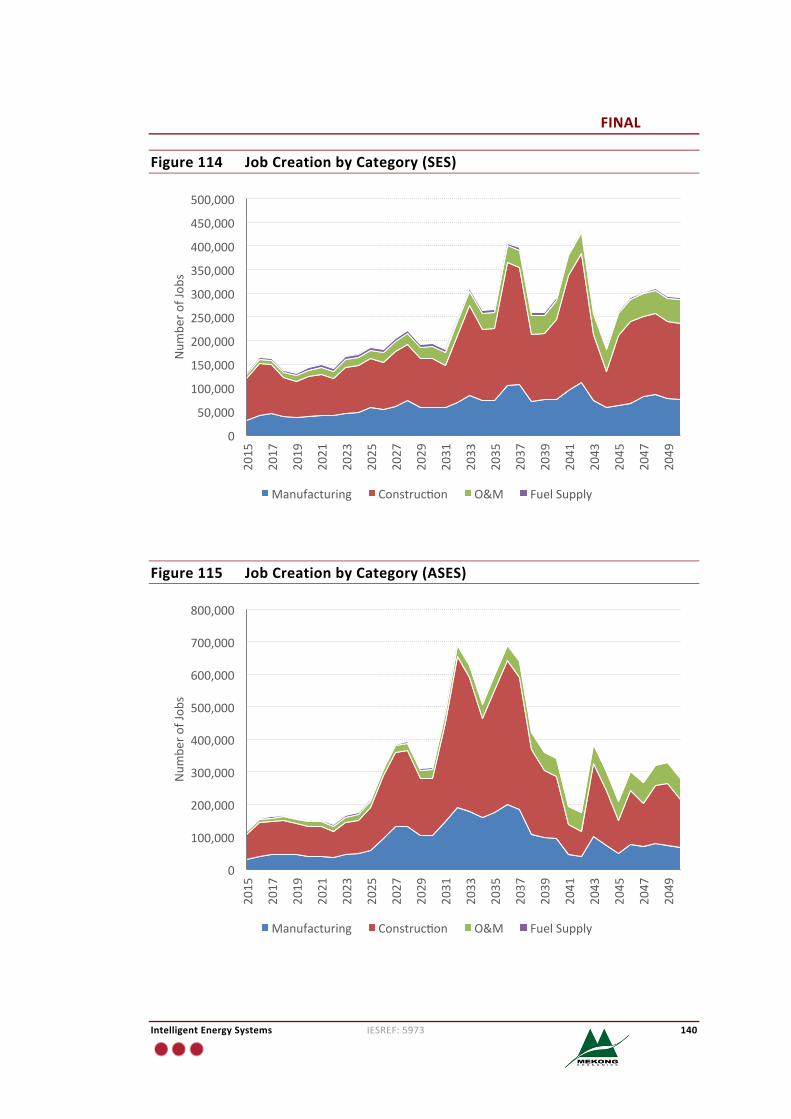
FINAL
IntelligentEnergySystems IESREF:5973 140
Figure114 JobCreationbyCategory(SES)
Figure115 JobCreationbyCategory(ASES)
0
50,000
100,000
150,000
200,000
250,000
300,000
350,000
400,000
450,000
500,000
2015
2017
2019
2021
2023
2025
2027
2029
2031
2033
2035
2037
2039
2041
2043
2045
2047
2049
Num
bero
fJob
s
Manufacturing Construc�on O&M FuelSupply
0
100,000
200,000
300,000
400,000
500,000
600,000
700,000
800,000
2015
2017
2019
2021
2023
2025
2027
2029
2031
2033
2035
2037
2039
2041
2043
2045
2047
2049
Num
bero
fJob
s
Manufacturing Construc�on O&M FuelSupply
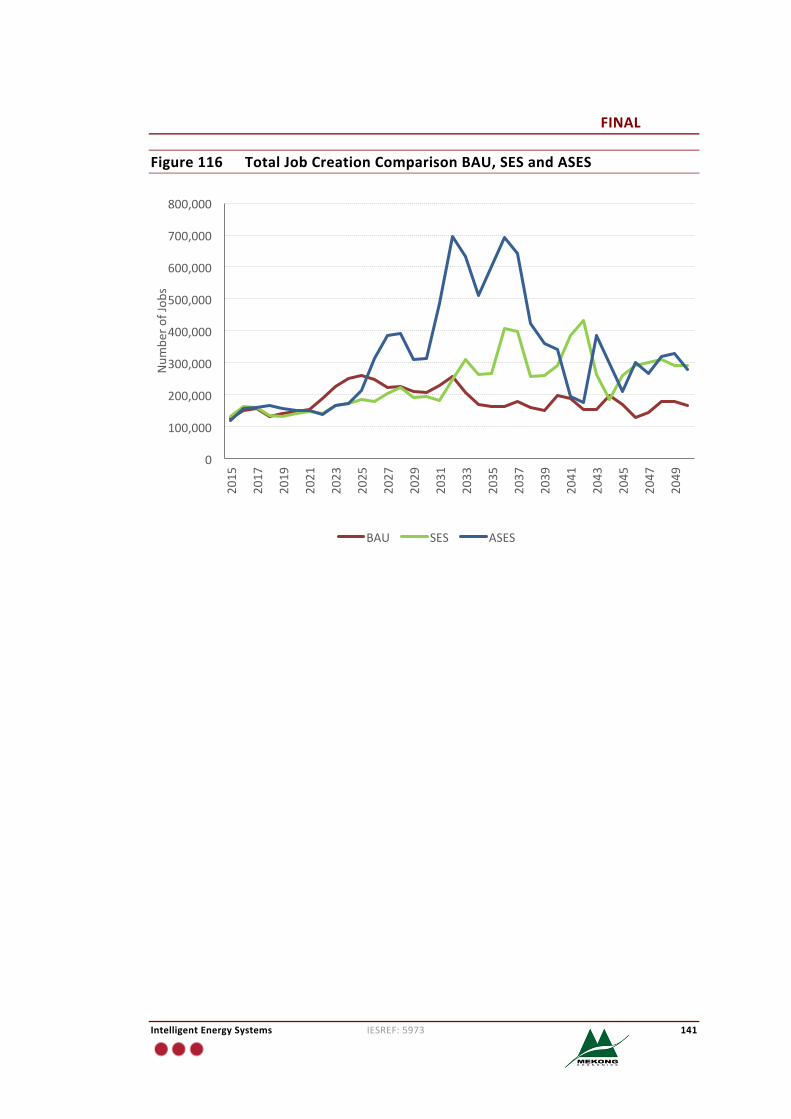
FINAL
IntelligentEnergySystems IESREF:5973 141
Figure116 TotalJobCreationComparisonBAU,SESandASES
0
100,000
200,000
300,000
400,000
500,000
600,000
700,000
800,000
2015
2017
2019
2021
2023
2025
2027
2029
2031
2033
2035
2037
2039
2041
2043
2045
2047
2049
Num
bero
fJob
s
BAU SES ASES
FINAL
IntelligentEnergySystems IESREF:5973 142
10 ConclusionsAs with a number of other countries in the region Viet Nam's economy hasexperienced high levels of growth which have been accompanied by very highelectricity demand growth rates. Even with a slight softening in the economicoutlookforthecountryinthelastyear,basicanalysisshowsthatelectricitydemandgrowthratesinthecountrywillberelativelyhighintotheneartermfuture.Thisismore so the case given long-term strategic plansby theGovernment to focusontransitioning the economy towards onewhere the industrial sector plays a largerrolethanatpresent.Accompanyingeconomicgrowthhasbeenanincreaseinthelivingstandards,whichhastranslatedintoincreasinglevelsofhouseholdelectricityconsumption, particularly in urban areas. These trends have put pressure on theexisting infrastructure including distribution networks, transmission networks andgeneration facilities to ensure a stable and reliable flow of electrical energy isprovidedtoendusers.
Viet Nam is endowed with a diverse set of primary energy resources, includingdomesticcoal,offshorenaturalgasreserves,biomass,biogas,solar,largeandsmall-scale hydro, onshore and offshore wind, geothermal, and marine-basedtechnologiessuchastidalandwave.Whileeachoftheseresourceshasitsownsetof challenges, they provide the basis for developing a range of possibledevelopmentpaths for the country's electricity industry. A summaryof themainresourcedevelopmentoptionsavailabletoVietNamisasfollows:
• Domesticcoal.Therearereservesofligniteandsub-bituminousgradesofcoalwithreservesthatcansupportdomesticgenerationprojects;
• Imported coal. Viet Nam has a coastline that spans some 3260 km whichprovidesanumberofsitesthatwouldallowforthedevelopmentofcoalimportandstorage facilities to supportcoalprojectsat locations thatareconvenientgiventhetransmissionnetworkstructureandlocationofloadcentres.
• NaturalgasandLNG.VietNamisestimatedtohavesome617Bcm(21.8Tcf)ofprovedreserves,oraround52%ofthetotalprovednaturalgasreservesoftheGMS.Thecountrycurrentlyproducesgasfromanumberofoffshorefieldsandthereareadditionaloffshoregas reserves that couldbe furtherexploited. InVietNam,therehasalsobeenconsiderablethoughtputintothedevelopmentofan LNG terminal to supportongoinggas inVietNam,although itpresentlyseemsunlikelythatanLNGimportfacilitieswouldbeinplacebefore2020.
• Nuclear Power. VietNamhas inplaceagreementswithRussiaand Japan tobuildnuclearpowerprojectsof2400MWand2000MWrespectively64;bothplanned to be constructed in the Ninh Thuan province. Nuclear power
64WorldNuclearAssociation,www.world-nuclear.org/info/Country-Profiles/Countries-T-Z/Vietnam,October2015.
FINAL
IntelligentEnergySystems IESREF:5973 143
features inVietNam’spowerdevelopmentplans, although thedatesof firstgenerationfromanuclearpowerareuncertain.
• Large Hydro. Viet Nam has largely exploited all of the large scale hydroconsideredtobeeconomically feasibleandsustainable; furtherdevelopmentbeyondwhathasbeenexploitedtodateandwhatisunderconstructionnowisnotconsideredanoption.
• Small, mini, and micro hydro. Viet Nam has untapped small scale hydropotentialanda further3000MWisestimatedtobedevelopedbeyondwhathas been exploited to date. However, concerns have been raised on smallhydro projects in the country based on considerations of the low levels ofefficiency achieved from some projects relative to the environmentalexternalities.
• Pumped storage hydro. Viet Nam does not presently have any pumpedstorage hydro plant in operation. However, feasibility studies have beencarriedoutandshowthatpumpedstoragepowerplantmaybefeasiblewiththe south and central regions offering the most favourable geographicalconditions.
• Onshore and offshore wind. Viet Nam is considered to have very goodonshoreandoffshorewindenergypotentialwithcoastalareas in thecentralandsouthregionsamongthebestlocationsinVietNamaswellasanumberoflocationsinthemountainousareasinthecentralregion.
• Solar Energy. Viet Nam is considered to have very high potential for thedevelopment of solar energy resources both in terms of flatbed solarphotovoltaic installationsaswell as concentrated solarpower (CSP)projects,inthecentralandsouthregions.
• Geothermal.Thecountryisrecognisedtohavealimitedamountofgeothermalpotentialwithsome300MWto400MWhavingbeenidentifiedtodate.
• Ocean. Viet Nam is considered to have significant ocean/marine energyresources with its high wave resource potential (40-411 kW/m) and longcoastline.
• Bio Generation (Biomass and biogas). Viet Nam has potential for powergenerationfrombiomassandbiogassourcesfromitsagriculturalresiduesandlivestockwithcurrentproductionlevelsequivalenttosupport30,000GWhofelectricityproduction.
• Power Imports. Power import projects fromneighbouring countries beyondthosealreadyinplacearepossibleandbeingexploredinVietNam.
Inthis reportwehavepresentedthefindingsofpowersystemmodellingofVietNam’spowersystemforBusinessasUsual(BAU),SustainableEnergySector(SES)andAdvancedSES(ASES)scenarios.TheBAUoutlookassumedthatfuturepowersectordevelopmentswouldbebasedoncontinuedlargescalehydrodevelopmentand coal. The SES and ASES have both taken measures to deploy a maximal
FINAL
IntelligentEnergySystems IESREF:5973 144
amountofrenewableenergyandenergyefficiencymeasures inordertoprovidesomealternativescenariosforthecountry.TheSESandASESbothalsoassumeamorerapidprogramofcross-borderinterconnectionintheGMS,whichallowstheregion to more fully exploit diversity in demand as well as geographicallydispersedareaswithhighrenewableenergypotential.
10.1 ComparisonofScenarios
The following are the key conclusions that have been drawn from the analysispresentedinthisreport:
• TheSESdeliversanenergyefficiencygainbeyondtheBAUcaseofabout32%comparedtotheBAU.TheASESdeliversefficiencygainsof34%afterdoublingtransportelectricitydemand;
• The SES is able to achieve a power system that delivers 81% of generationfrom renewable energy resources (including large-scale hydro) by 2050. Incontrast,24%of thegeneration in theBAU isprovidedby renewableenergyresources65;
• By 2050, the SES and ASES avoid around 383 and 461 million tons ofgreenhousegasemissionsper year compared to theBAU. TheSES intensitydeclines to0.15 t-CO2/MWhby2050vs.0.53 t-CO2/MWh for theBAUcase.TheBAUcaseachievesahigheremissionsintensitylevelbecauseofincreasedcoalgenerationreliancewhiletheSESdeliversalowemissionsintensityduetowidespread deployment of solar and wind technologies. The ASES reaches100%renewablegenerationby2050.
• Basedonsomesimplemeasuresforenergysecurity:- Under the ASES and SES, Viet Nam benefits from a more diverse mix of
technologiesandisnotasdependentonasinglesourceofprimaryenergyas the BAU; for example the BAU is highly dependent on imported coal,whiletheSESandASESdiversifysupplyacrossarangeofrenewableenergytechnologieswith no generation type accounting formore than 20% and25%ofthegenerationshare.;
- The ASES and SES have around 88% of their electricity being generatedfromdomesticallycontrolledandmanagedresources,whiletheBAUneedstoimportprimaryenergyresourcesintheformofgasandcoal,whichdrivedown the level of domestic control and management of primary energyresources–by2050this level reachesaround51% in theBAU.Under theASES and SES generation developments are optimised across the regionandVietNamimportsupto15%ofitsrequirementsby2050;and
- TheASESandSESachieveareliablepowersystemthroughcoordinationonboth the supply and demand side of the industry, with similar energyreserve margins as the BAU. Modelling has shown that the SES is
65Large-scalehydroisincluded
FINAL
IntelligentEnergySystems IESREF:5973 145
operationallyfeasible(evenwithlessdirectlydispatchableresourcesintheSEScompared to theBAU),but stress testingof theSESscenariosagainstmoresignificantthreatstotheoperationofthepowersystemwouldhelptounderstandanddevelopappropriatemitigationmeasuresifrequired.Akey condition for this scenario to be operationally feasible in practice isreal-time monitoring and control systems for all elements of the powersystem, near real-time and automated dispatch operations, and highqualityforecastingsystemsforsolarandwindenergy.
- TheASESisamoreambitiousscenariothatcontainsamorerapidtransitiontowards a power system that is based entirely on renewable energy by2050. While this isoperationally feasible in termsof supplyanddemandwehavenotanalysedindetailissuessuchasvoltageanddynamicstability.This scenario ismoredependentonhaving inplaceappropriate real-timemonitoringandcontrolsystems.
10.2 EconomicImplications
10.2.1 CostofElectricity
Based on the outcomes of modelling the BAU, SES and ASES scenarios, we alsoexamined the following issues in relation to electricity costs: (1) levelised cost ofelectricity, (2) investment requirements, (3) sensitivity of electricity prices to fuelpriceshocks,and(4)theimplicationsofapriceoncarbonequivalentemissionsforelectricityprices.Basedonthisanalysiswedrawthefollowingconclusions:
• The BAU requires lower levels of capital investment than the SES, and inrelation to generation costs, the SES and ASES across the modelling perioddeliversaloweroverallshort-runmarginalcostofelectricityandLCOEtoVietNam;
• UndertheSESandASESsignificantbenefitsaregainedintheformofavoidedfuel costsand this contributes toachievinga loweroverall costofelectricityforVietNam. Theobservation ismade that the compositionof LCOEundertheSESandASESislargelydrivenbyinvestmentcosts,henceexposuretofuelshocksissignificantlyreduce;and
• TheLCOEundertheSESandASESisalsolargelyinsensitivetoacarbonprice,as could be reasonably anticipated for a power system that is entirelydominatedbyrenewableenergy.
10.2.2 InvestmentImplications
From 2015 to 2050, the total cumulative investment in BAU, SES and ASES isrespectively: $341 billion, $415 billion, and $506 billion (Real 2014 USD). ThecompositionoftheinvestmentsbetweenBAUandtheSES/ASESarequitedifferent:
FINAL
IntelligentEnergySystems IESREF:5973 146
• 59%of thecumulative investments in theBAUaredirectedtocoal, followedby 12% nuclear, 6% coal, 4% gas and the rest being a combination ofrenewables;
• IntheSES/ASES,investmentsaremorediverse:- SEShas28%solarandbattery,22%CSP,11%wind,21%energyefficiency
and7%bioenergy;and- ASEShas31%solarandbattery,21%energyefficiency,13%wind,17%CSP,
and8%bioenergy.
10.2.3 JobsCreation
TheSESandASESscenariosbothresultinquitedifferenttechnologymixesforVietNamcomparedtotheBAU. TheSESandASEShavedifferent implications for theworkforce thatwouldneed tobedeveloped to support each scenario. Basedonestimatesofjobcreation,weestimatethat66:
• TheBAU from2015 to2050wouldbeaccompaniedby thecreationof some6.6mjobsyears67(17%manufacturing,45%construction,24%operationsandmaintenance,and14%fuelsupply);
• The SES would involve the creation of some 8.6 million job years (26% inmanufacturing,55% inconstruction,17% inoperationsandmaintenanceand1%infuelsupply);and
• The ASES would involve the creation of 11.6 million job years (25% inmanufacturing,52% inconstruction,23% inoperationsandmaintenanceandlessthan1%infuelsupply).
10.3 IdentifiedBarriersfortheSESandASES
TherearenumerousbarrierstodevelopmentofrenewableenergyinVietNam68:
• Policyandinstitutionalbarriersinclude:- absenceofclearlydefinednationalstrategiesandlegallyboundtargetsfor
renewable energy, lack of a uniform legal framework with high levellegislations such as a law or a degree to stipulate and mandate strongmechanismsfordevelopmentofrenewableenergy;
- alackofreliabledetailedstudiesorplanningatthenationalleveltoassesspotential and establish targets for different forms of renewable energy(this is being progressively addressed as national plans for biomass andwindpowerdevelopmentshouldbecarriedoutbytheMOIT);and
66BasedontheemploymentfactorspresentedinAppendixC.67Ajobyear isonejobforonepersonforoneyear. Weusethismeasuretomakecomparisonseasieracrosseachscenarioasthenumberofjobscreatedfluctuatesfromyeartoyear.68Thisinformationinthissectionisbasedonvariousreportsincluding:IEStudyonRenewableEnergyDevelopmentinVietNam(2009)andtheUSAID-sponsoredstudyonOff-GridOpportunitiesandChallengesinVietNam(2014).
FINAL
IntelligentEnergySystems IESREF:5973 147
- absenceofastate-levelfocalpointorganisationdedicatedtomanagingtherenewable energy area (currently the RE is overseen by a departmentwithintheGDEbuttherehavebeensuggestionsforestablishinganationalcommitteeforrenewableenergy69).
• Technicalbarriers:- overall knowledge on renewable energy technology in the country is
remainslimited;- absenceof trainingorganisationsand facility leading toa lackofqualified
expertsandskilledtechnicians;- Viet Nam does not have trade companies who can supply renewable
energy equipment and related services. Most of renewable energytechnologiesareimportedwithlimitedafterinstallationservice;
- absenceofadequateandreliabletechnicaldata/measurementsasregardsrenewableenergypotentials;and
- lackofdesignandoperationalandsafetystandards.• Economicandfinancialbarriers:
- lack of adequate incentive mechanisms for development of renewableenergysourcesandlackoffinancialsupportmechanismsinplaceforsomeformsofrenewableenergy:solarandgeothermalforexample;
- high investmentcostsandhighelectricityproductioncost,which ispartlydue to the limitations in access to appropriate technology and skilledmanpowerplustheeconomyofscalefactor;
- difficulty in accessing financial sources for renewables energy projectswhicharehighlycapitalintensive;and
- significant subsidies for conventional electricity discouraging investmentsintorenewableenergy.
• Barriersforspecificrenewableenergytechnologies- Small hydro power: for Off-grid generators: Cheap and low quality
technology imported fromChina is still dominating in theoff-grid remotemountainous areas in Viet Nam. This course of development is regardedunsustainable as the site installations usually lack of proper operatortraining, lack of manuals translated into Vietnamese and poorcommissioning procedures. There is limited spare part availability forreplacement and repairs and lack of knowledge on repair and/or spareparts can stop a whole system from working. Grid-connected plants:Investors in small hydro power projects have been expressing a concernrelatedtotheunpredictablemovements intheadministeredavoidedcosttariffpricesovertheeconomiclifeoftheproject.
69 http://nangluongvietnam.vn/news/vn/du-bao-kien-nghi/kien-nghi-thanh-lap-uy-ban-quoc-gia-ve-nang-luong-tai-tao-viet-nam.html
FINAL
IntelligentEnergySystems IESREF:5973 148
- Wind power: issues include: (1) lack of experience and technology thathave been tested under Viet Nam’s particular conditions (high risk oftyphoon, high humidity, etc.), (2) absence of management and businessmodels for successful O&M of a wind farm, even for small wind farmssuitable for application toVietNam’soffshore Islands (wherewind-dieselhybrids represent an important option to lower the costs of traditionaldiesel generation), (3) some of the provinces with good wind potentialssuchasBinhTuanandNinhThuanarealsorichinmineralswhichcreatesaconflictinlanduse(windparksvs.mines).
- Solar power: (1) a particular policy and legal framework to support solarpowerinstallationsisyettobedevelopedinVietNam,(2)localproducersof solar equipment and appliances have difficulties competing in qualitywithimportedpanelsandsideequipmentfromEuropeandChina,andtheequipmentfailurerateishigh,andthereforethetrustinlocalequipmentislow, (3) there are no standards reported for solar technologies;performance standards, equipment certification and codes of practice forquality controlneed tobedevelopedandaccepted; lackof incentives fortheestablishmentandadherencetosuchtechnicalstandards.
- Biomass:(1)Whilethereexistvariousprovenandhighlyefficientbiomasspowertechnologiesintheworldforgrid-connectedpowergeneration,theyare still not well known in Viet Nam and not many local companiessupplying biomass power technologies. Most of the technologies areimported without consulting and technical services for biomass powertechnologies,especiallymaintenanceandrepairservicesafter installation.(2) Locations of the residues are scattered throughout the country. Forexample, rice isnotalwaysprocessed inacentral, largescale, locationsotheresiduesarenormallyspreadoveralargeareaespeciallyintheremoteareas.Asa resultaREsystemneeds tobedevelopedwhere residuescanbeefficiently collectedand transported to - at a central power stationorprocessing location. This also makes contracting of the biomass sourcingdifficult.Transportfrominlandorremoteareastothecommuneorhamletcentre for decentralised production might be a financial barrier for thefarmers,andpotentiallyevenalogisticalbarrier(duetothebadroads).
- Biogas: Electricity production from biogas has faced very specifictechnology barriers, in particular, fragmented and artisan production ofsparepartsand instrumentswhichmeansthequalityandcompatibilityofthe equipment and spare parts replaced as the technology is notstandardised.Due to lackof spareparts to replace,manyprojects cannotoperateefficientlyatfullcapacity.
• Barriersrelatedtoenergyefficiencyinclude:- Information barrier: Energy users remain unaware of potential energy
savings and their financial benefit, and how to attain them. Many
FINAL
IntelligentEnergySystems IESREF:5973 149
consumers, especially in commercial or industrial establishments, actuallyhave little concrete idea of the potential for energy savings in theirbusinesses, and how much money could be saved through improvedmanagementormodestinvestment.
- Expertisebarrier:Appropriateexpertisetoadviseclientsonenergysavingsoptions and conduct energy audits is not readily available locally. Expertswith established track records in implementing projects are especiallyvaluable for providing advice derived from actual experience rather thantheoreticalcalculation.ExpandingandimprovingthequalificationsoflocalexpertsisanareathatrequiresmajoreffortsinVietNam.
- Energy Pricing Barrier: Higher and cost reflective energy prices are anexceptionallypowerfulforcetoattractattentiontoenergyefficiencyandtoincrease incentives foraction. InVietNam,pricespaid forenergyare lowrelative to those inmost other countries.Despite frequent increases, theactual level of electricity tariffs has not risen in real terms over the pastdecade. Domestic coal prices are well below levels in other countries.Although solid returns on a wide range of energy-efficiency investmentsstill exist, incentives and investment results could be sharply improved ifenergypricesbetterreflectedinternationallevels.
- Cost-consciousness barrier: Consumers are not always interested inreducing operating costs. In some state-owned enterprises, reducingoperatingcosts,suchasenergyorwaterutilitycosts,maynotbeaprioritytomanagers,evenifquiteprofitable.Inaddition,wheneconomicgrowthisrobust, commercial and industrial establishments may naturally placegreater emphasis on the expansion or introduction of new products toincreasemarket share, and investments for long-termpayoff inoperatingcostsavingsmaybeassignedlowerpriorityforthetimebeing.
• Other factors that impede the development of renewable energy andapplicationofenergyefficiencymeasuresinVietNammightinclude:- Lackofsocialacceptanceandsupportforcleanenergy.- Low awareness among customers and in wider communities about the
benefits from renewable energy and energy savings, and aboutenvironmentaldamagecostsresultedfromuseoffossilfuels;and
- Lackofeducationalandinformationstrategiesandplans.
10.4 Recommendations
Thefollowingarekeyrecommendationstoreducethebarriersand“enable”theSESandASES:• Formationofmore comprehensive energy policies to create an environment
that is appropriate for investment in renewable energy technologies andenergy efficiency measures. Investor confidence in renewable energyinvestment will be enhanced by having a transparent regulatory framework
FINAL
IntelligentEnergySystems IESREF:5973 150
that provides certainty to investors and appropriately considers theramificationsofhighlevelsofrenewableenergyinthegenerationmix.
• Formation of electricity pricing policies and mechanisms that encourageefficient behavior and investment in generation technologies, transmissionanddistributionequipmentandenduseenergyconsumption.
• Continueefforts toperformmoredetailedassessmentsof renewableenergypotential and make the results publicly available to enable prospectiveinvestors to understand the potential, identify the best opportunities andsubsequentlytakestepstoexploreinvestmentanddeployment.
• Knowledge transfer and capability building in the renewable energytechnologies and energy efficiency for policy makers, staff working in theenergyindustry,aswellaswithineducationinstitutionstoensurethehumancapacityisbeingdevelopedtosupportanationalpowersystemthathasahighshare of generation from renewable energy. Aswehave shown the SES andASESwill require a large number of skilledworkers to support a technologymixthatiscentredonrenewableenergy.
• Investments in ICTsystemstoenhancereal-timepowersystemoperationsofboth supplyanddemandsidesof the industry suchas smart-grid technologyand integration of renewable energy forecasting systems and tools intopresentsystemsforcentralizedreal-timesystemoperations. Thiswillenableefficientreal-timedispatchandcontrolofallresourcesinVietNam’snationalpower system and will create an environment more conducive for themanagement of high levels of renewable energy and flexible (dispatchable)demand.
• Takemeasures to encourage cross-border power trade in the region, as thisworks to the advantage of exploiting scattered renewable energy resourcepotentialsanddiversityinelectricitydemand.Inparticular:- Develop an overarching transmission plan that has been informed by
detailedassessmentsandplans to leveragerenewableenergypotential intheregionanddiversityindemandandhydrologicalconditions.IntheBAU,VietNam’spower sectorevolves tobealmostentirely self-sufficientwithonly a small dependency on power imports from neighbouring countries.IntheSESandASES,thesituationisquitedifferent:poweraround10%to15% of Viet Nam’s electricity consumption between 2030 to 2050 issatisfiedbypowerimportsandistheresultofVietNambeingmoretightlyintegratedintoaregionalpowernetworkandonethathasbeendevelopedtoleveragescatteredanddiverserenewableenergypotential.
- Enhance technical standards and transmission codes in each country toallowforbetterinteroperationofnationalpowersystems.
- Establish dispatch protocols to better coordinate real-time dispatch ofpowersystemsintheregiontomakethebestuseofreal-timeinformationandcontinuouslyupdateddemandandrenewablegenerationforecasts.
FINAL
IntelligentEnergySystems IESREF:5973 151
- Develop a framework to encourage energy trade in the region, and inparticulartowardsamodelthatcansupportmultilateralpowertradingviaaregionalpowermarketorexchange(forexample).
• Takemeasurestoimprovepowerplanningintheregionto:- Explicitlyaccountforprojectexternalitiesandrisks;- Evaluateamorediverserangeofscenariosincludingthosewithhighlevels
ofrenewableenergy;- Takeintoconsiderationenergyefficiencyplans;- Take into consideration overarching plans to have tighter power system
integrationwithintheregion;and- Carefullyevaluatetheeconomicsofoff-gridagainstgridconnectionwhere
thisisrelevant.
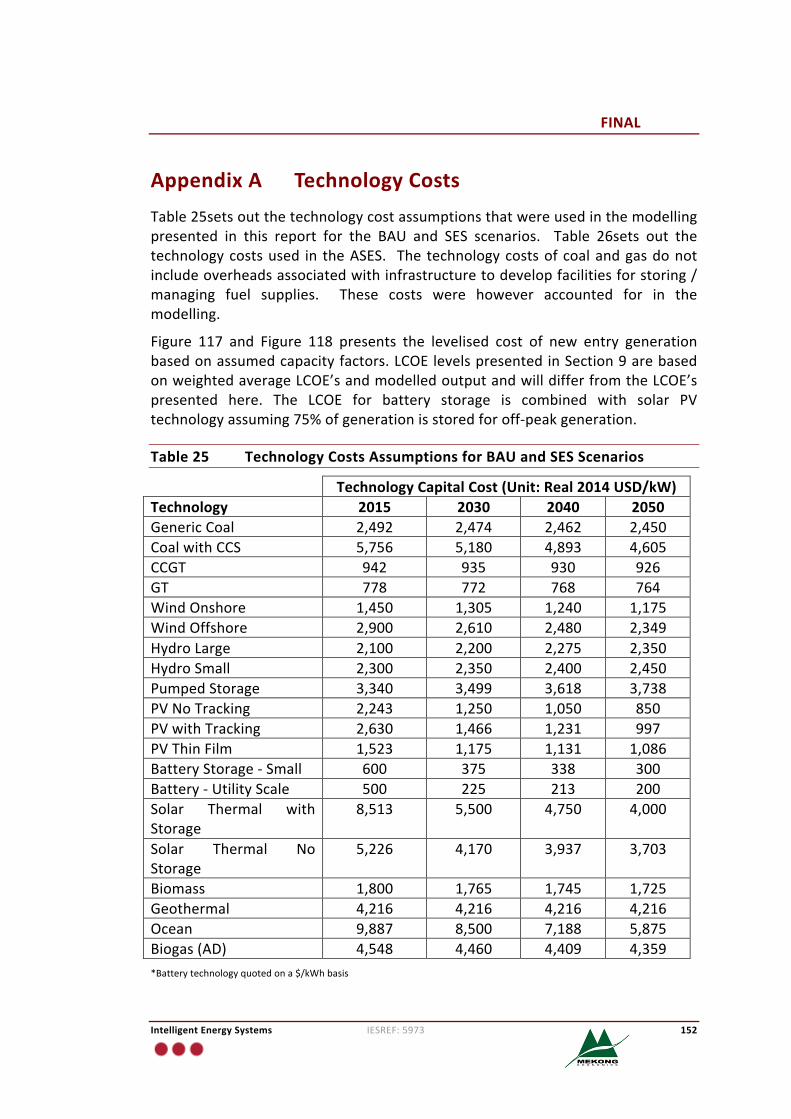
FINAL
IntelligentEnergySystems IESREF:5973 152
AppendixA TechnologyCostsTable25setsoutthetechnologycostassumptionsthatwereusedinthemodellingpresented in this report for the BAU and SES scenarios. Table 26sets out thetechnologycostsused in theASES. The technologycostsofcoalandgasdonotincludeoverheadsassociatedwithinfrastructuretodevelopfacilitiesforstoring/managing fuel supplies. These costs were however accounted for in themodelling.
Figure 117 and Figure 118 presents the levelised cost of new entry generationbasedonassumedcapacityfactors.LCOElevelspresentedinSection9arebasedonweightedaverageLCOE’sandmodelledoutputandwilldifferfromtheLCOE’spresented here. The LCOE for battery storage is combined with solar PVtechnologyassuming75%ofgenerationisstoredforoff-peakgeneration.
Table25 TechnologyCostsAssumptionsforBAUandSESScenarios
TechnologyCapitalCost(Unit:Real2014USD/kW)Technology 2015 2030 2040 2050GenericCoal 2,492 2,474 2,462 2,450CoalwithCCS 5,756 5,180 4,893 4,605CCGT 942 935 930 926GT 778 772 768 764WindOnshore 1,450 1,305 1,240 1,175WindOffshore 2,900 2,610 2,480 2,349HydroLarge 2,100 2,200 2,275 2,350HydroSmall 2,300 2,350 2,400 2,450PumpedStorage 3,340 3,499 3,618 3,738PVNoTracking 2,243 1,250 1,050 850PVwithTracking 2,630 1,466 1,231 997PVThinFilm 1,523 1,175 1,131 1,086BatteryStorage-Small 600 375 338 300Battery-UtilityScale 500 225 213 200Solar Thermal withStorage
8,513 5,500 4,750 4,000
Solar Thermal NoStorage
5,226 4,170 3,937 3,703
Biomass 1,800 1,765 1,745 1,725Geothermal 4,216 4,216 4,216 4,216Ocean 9,887 8,500 7,188 5,875Biogas(AD) 4,548 4,460 4,409 4,359*Batterytechnologyquotedona$/kWhbasis
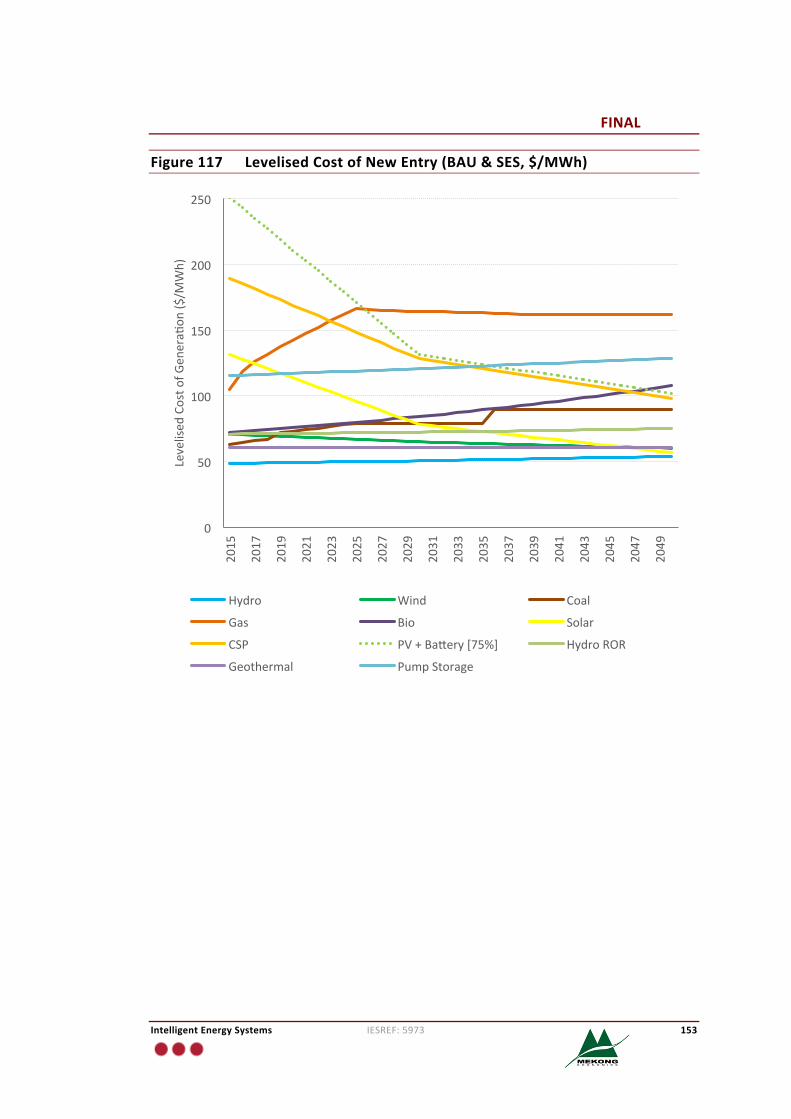
FINAL
IntelligentEnergySystems IESREF:5973 153
Figure117 LevelisedCostofNewEntry(BAU&SES,$/MWh)
0
50
100
150
200
250
2015
2017
2019
2021
2023
2025
2027
2029
2031
2033
2035
2037
2039
2041
2043
2045
2047
2049
Levelised
Costo
fGen
era�
on($
/MWh)
Hydro Wind Coal
Gas Bio Solar
CSP PV+Ba�ery[75%] HydroROR
Geothermal PumpStorage
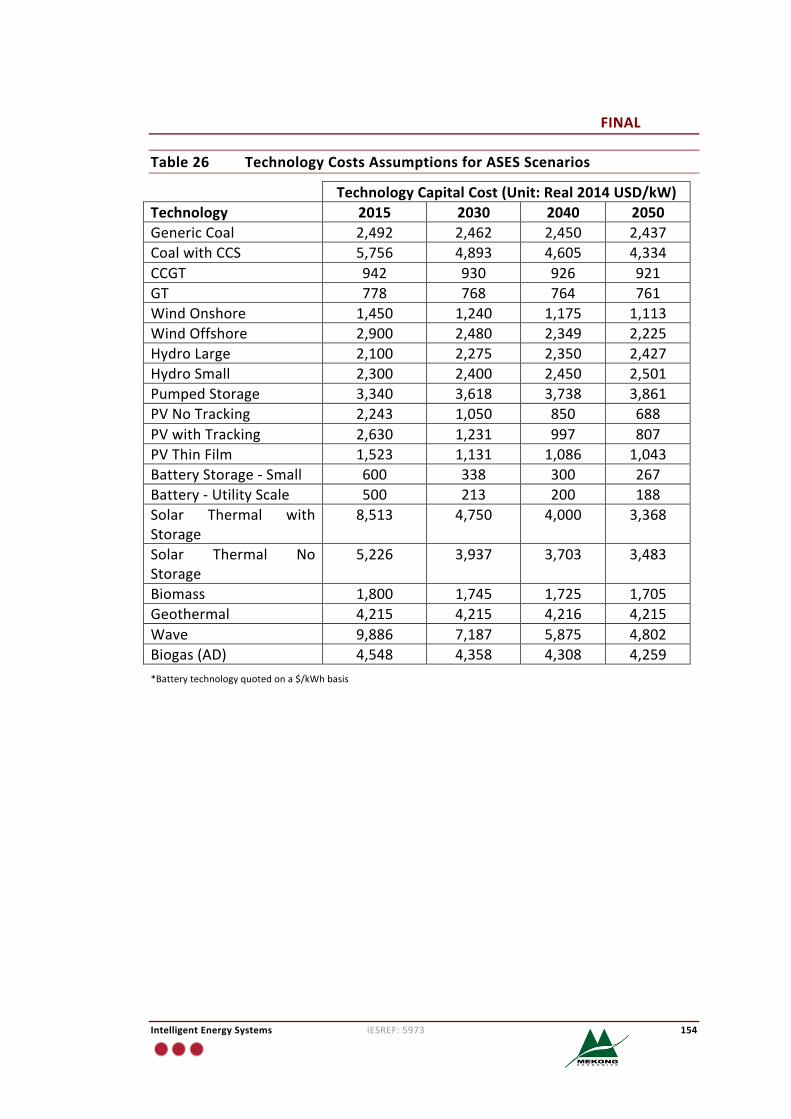
FINAL
IntelligentEnergySystems IESREF:5973 154
Table26 TechnologyCostsAssumptionsforASESScenarios
TechnologyCapitalCost(Unit:Real2014USD/kW)Technology 2015 2030 2040 2050GenericCoal 2,492 2,462 2,450 2,437CoalwithCCS 5,756 4,893 4,605 4,334CCGT 942 930 926 921GT 778 768 764 761WindOnshore 1,450 1,240 1,175 1,113WindOffshore 2,900 2,480 2,349 2,225HydroLarge 2,100 2,275 2,350 2,427HydroSmall 2,300 2,400 2,450 2,501PumpedStorage 3,340 3,618 3,738 3,861PVNoTracking 2,243 1,050 850 688PVwithTracking 2,630 1,231 997 807PVThinFilm 1,523 1,131 1,086 1,043BatteryStorage-Small 600 338 300 267Battery-UtilityScale 500 213 200 188Solar Thermal withStorage
8,513 4,750 4,000 3,368
Solar Thermal NoStorage
5,226 3,937 3,703 3,483
Biomass 1,800 1,745 1,725 1,705Geothermal 4,215 4,215 4,216 4,215Wave 9,886 7,187 5,875 4,802Biogas(AD) 4,548 4,358 4,308 4,259*Batterytechnologyquotedona$/kWhbasis
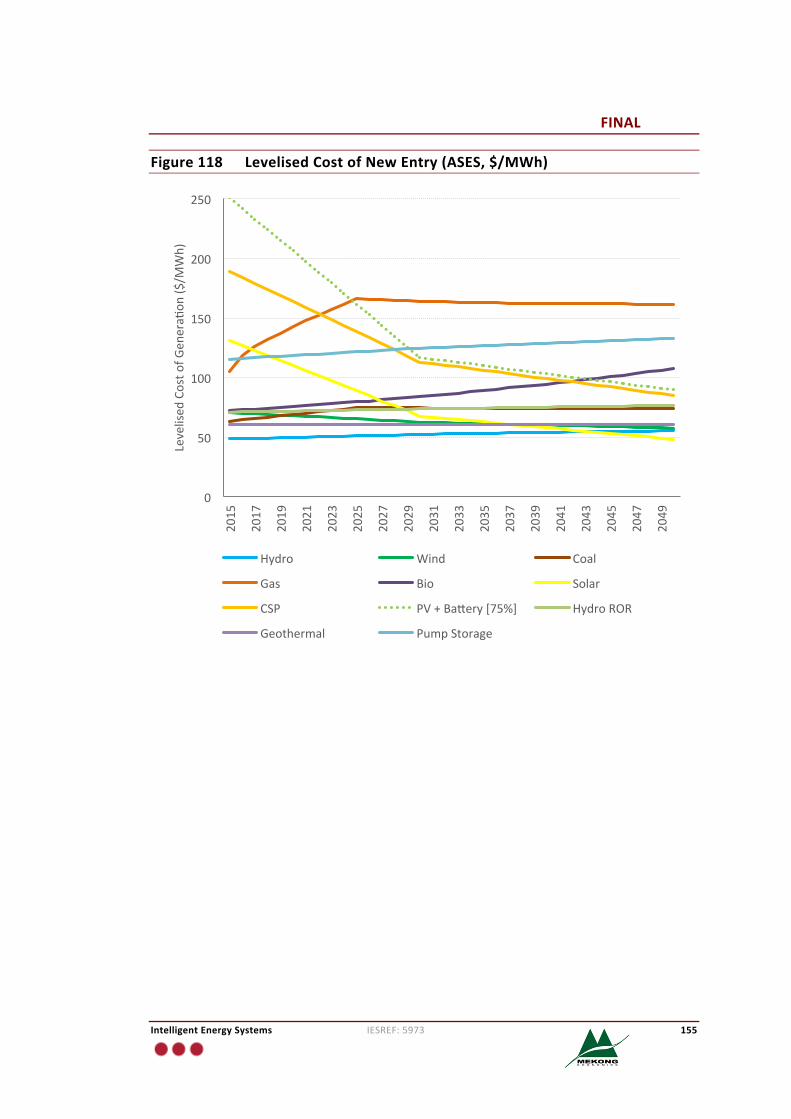
FINAL
IntelligentEnergySystems IESREF:5973 155
Figure118 LevelisedCostofNewEntry(ASES,$/MWh)
0
50
100
150
200
250
2015
2017
2019
2021
2023
2025
2027
2029
2031
2033
2035
2037
2039
2041
2043
2045
2047
2049
Levelised
Costo
fGen
era�
on($
/MWh)
Hydro Wind Coal
Gas Bio Solar
CSP PV+Ba�ery[75%] HydroROR
Geothermal PumpStorage
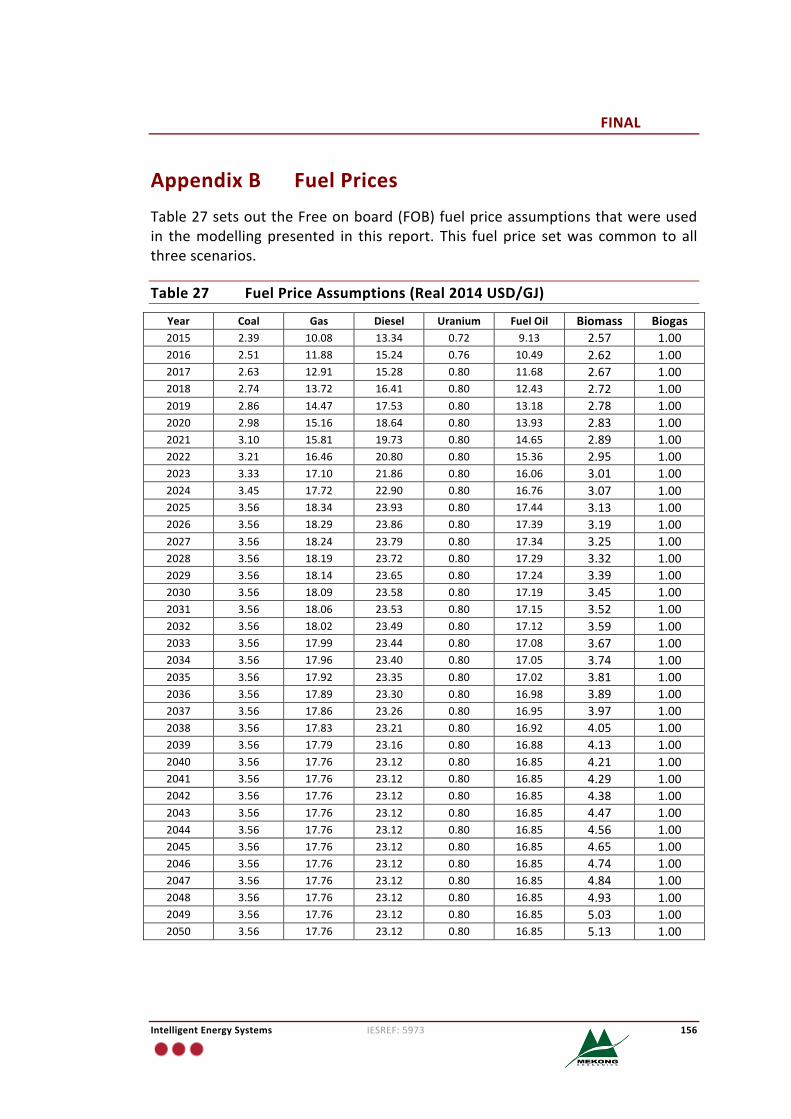
FINAL
IntelligentEnergySystems IESREF:5973 156
AppendixB FuelPricesTable27setsouttheFreeonboard(FOB)fuelpriceassumptionsthatwereusedin themodellingpresented in this report. This fuel price setwas common to allthreescenarios.
Table27 FuelPriceAssumptions(Real2014USD/GJ)
Year Coal Gas Diesel Uranium FuelOil Biomass Biogas2015 2.39 10.08 13.34 0.72 9.13 2.57 1.002016 2.51 11.88 15.24 0.76 10.49 2.62 1.002017 2.63 12.91 15.28 0.80 11.68 2.67 1.002018 2.74 13.72 16.41 0.80 12.43 2.72 1.002019 2.86 14.47 17.53 0.80 13.18 2.78 1.002020 2.98 15.16 18.64 0.80 13.93 2.83 1.002021 3.10 15.81 19.73 0.80 14.65 2.89 1.002022 3.21 16.46 20.80 0.80 15.36 2.95 1.002023 3.33 17.10 21.86 0.80 16.06 3.01 1.002024 3.45 17.72 22.90 0.80 16.76 3.07 1.002025 3.56 18.34 23.93 0.80 17.44 3.13 1.002026 3.56 18.29 23.86 0.80 17.39 3.19 1.002027 3.56 18.24 23.79 0.80 17.34 3.25 1.002028 3.56 18.19 23.72 0.80 17.29 3.32 1.002029 3.56 18.14 23.65 0.80 17.24 3.39 1.002030 3.56 18.09 23.58 0.80 17.19 3.45 1.002031 3.56 18.06 23.53 0.80 17.15 3.52 1.002032 3.56 18.02 23.49 0.80 17.12 3.59 1.002033 3.56 17.99 23.44 0.80 17.08 3.67 1.002034 3.56 17.96 23.40 0.80 17.05 3.74 1.002035 3.56 17.92 23.35 0.80 17.02 3.81 1.002036 3.56 17.89 23.30 0.80 16.98 3.89 1.002037 3.56 17.86 23.26 0.80 16.95 3.97 1.002038 3.56 17.83 23.21 0.80 16.92 4.05 1.002039 3.56 17.79 23.16 0.80 16.88 4.13 1.002040 3.56 17.76 23.12 0.80 16.85 4.21 1.002041 3.56 17.76 23.12 0.80 16.85 4.29 1.002042 3.56 17.76 23.12 0.80 16.85 4.38 1.002043 3.56 17.76 23.12 0.80 16.85 4.47 1.002044 3.56 17.76 23.12 0.80 16.85 4.56 1.002045 3.56 17.76 23.12 0.80 16.85 4.65 1.002046 3.56 17.76 23.12 0.80 16.85 4.74 1.002047 3.56 17.76 23.12 0.80 16.85 4.84 1.002048 3.56 17.76 23.12 0.80 16.85 4.93 1.002049 3.56 17.76 23.12 0.80 16.85 5.03 1.002050 3.56 17.76 23.12 0.80 16.85 5.13 1.00
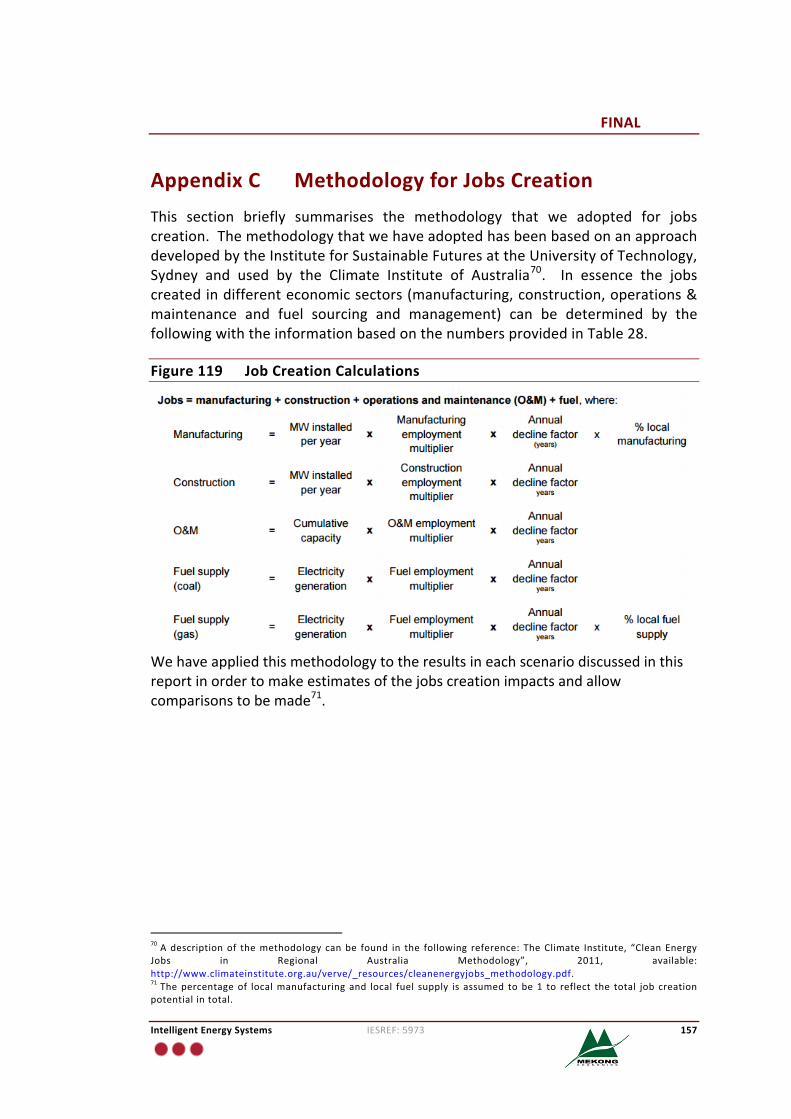
FINAL
IntelligentEnergySystems IESREF:5973 157
AppendixC MethodologyforJobsCreationThis section briefly summarises the methodology that we adopted for jobscreation.ThemethodologythatwehaveadoptedhasbeenbasedonanapproachdevelopedbytheInstituteforSustainableFuturesattheUniversityofTechnology,Sydney and used by the Climate Institute of Australia70. In essence the jobscreatedindifferenteconomicsectors(manufacturing,construction,operations&maintenance and fuel sourcing and management) can be determined by thefollowingwiththeinformationbasedonthenumbersprovidedinTable28.
Figure119 JobCreationCalculations
Wehaveappliedthismethodologytotheresultsineachscenariodiscussedinthisreportinordertomakeestimatesofthejobscreationimpactsandallowcomparisonstobemade71.
70Adescriptionof themethodology canbe found in the following reference: TheClimate Institute, “CleanEnergyJobs in Regional Australia Methodology”, 2011, available:http://www.climateinstitute.org.au/verve/_resources/cleanenergyjobs_methodology.pdf.71Thepercentageof localmanufacturingand local fuel supply is assumed tobe1 to reflect the total job creationpotentialintotal.
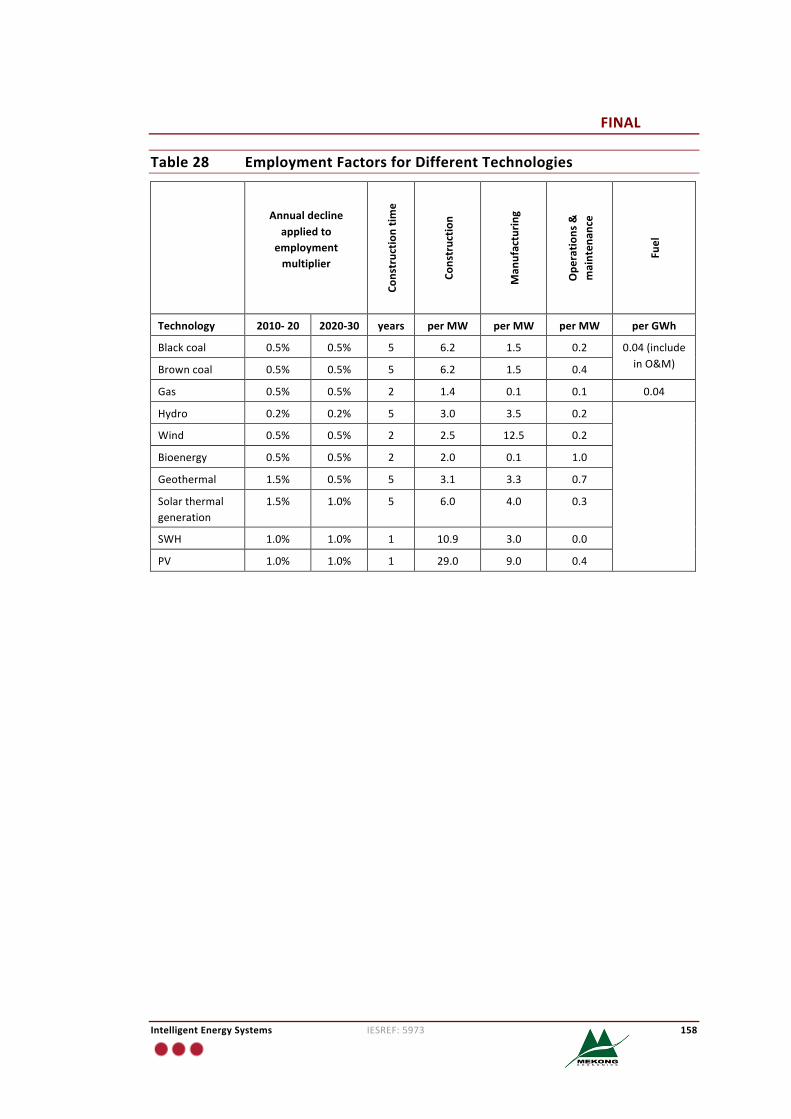
FINAL
IntelligentEnergySystems IESREF:5973 158
Table28 EmploymentFactorsforDifferentTechnologies
Annualdeclineappliedto
employmentmultiplier
Constructio
ntim
e
Constructio
n
Man
ufacturin
g
Ope
ratio
ns&
mainten
ance
Fuel
Technology 2010-20 2020-30 years perMW perMW perMW perGWh
Blackcoal 0.5% 0.5% 5 6.2 1.5 0.2 0.04(includeinO&M)Browncoal 0.5% 0.5% 5 6.2 1.5 0.4
Gas 0.5% 0.5% 2 1.4 0.1 0.1 0.04
Hydro 0.2% 0.2% 5 3.0 3.5 0.2
Wind 0.5% 0.5% 2 2.5 12.5 0.2
Bioenergy 0.5% 0.5% 2 2.0 0.1 1.0
Geothermal 1.5% 0.5% 5 3.1 3.3 0.7
Solarthermalgeneration
1.5% 1.0% 5 6.0 4.0 0.3
SWH 1.0% 1.0% 1 10.9 3.0 0.0
PV 1.0% 1.0% 1 29.0 9.0 0.4
FINAL
IntelligentEnergySystems IESREF:5973 159
AppendixD VietNamWindResourceMapsThis section provides a number of charts of VietNam’swind resource potentialwhich is provided by IRENA’s Global Atlas for Renewable Energy(http://irena.masdar.ac.ae/). These are intended to assist in gaining a betterappreciationofthediversityofwindpotentialacrossVietNam.
D.1 WindSpeedMaps
Figure 120 shows simulated wind speeds for the years 2003-10 at 100m aboveground level, measured inm/s, where features of the terrain are estimated andinferencesmadeonwind speeds. Figure 121 shows generalisedwind speeds foryears 2003-10 at 100m above ground level, where terrain features are left as is.ThedescriptionsofthechartsarefromIRENA’swebsiterespectivelyare:
• “Simulatedmeanwind speed covering the years 2003-2010 at 100m aboveground level (AGL),measured inmper second.Values reflectorographyandsurface roughness length as they are represented in themodel. These dataweredevelopedusingtheWeather,Research,andForecastingmodelata5kminterval. The originalmodellingworkwas performed byDTU. Themap is anun-validated, satellite-derived estimate. As part of phase II of the WBGinitiative, these maps will be validated through the use of groundmeasurementdata,anduntil thedatacollectionperiod is finishedshouldbeconsidered for policy use, rather than energy prospecting, following IRENA'sclassificationofrenewableenergydata.”;and
• “Generalizedmeanwind speed covering the years 2003-2010at 100mAGL,measured in m per second. These data introduce flat terrain and uniformroughnesslengthof10cmacrossthestudyarea.Thisgeneralizedmodelallowsforusers toplug in their ownmicroscaleorographyand roughness values incustomsimulations.ThesedataweredevelopedusingtheWeather,Research,and Forecasting model at a 5km interval. The original modelling work wasperformedbyDTU.Themapisanun-validated,satellite-derivedestimate.AspartofphaseIIoftheWBGinitiative,thesemapswillbevalidatedthroughtheuse of ground measurement data, and until the data collection period isfinishedshouldbeconsidered forpolicyuse, rather thanenergyprospecting,followingIRENA'sclassificationofrenewableenergydata.”
Figure 122 shows theDTUGlobalWindAtlas72onshore and 30 kmoffshorewindclimatedatasetwhichaccountsforhighresolutionterraineffectsfor100maboveground level. Accordingtothe IRENAglobalatlasdescription:“thiswasproducedusingmicroscalemodellingintheWindAtlasAnalysisandApplicationProgramandcapture small scale spatial variability of winds speeds due to high resolutionorography (terrain elevation), surface roughness and surface roughness change72See:http://globalwindatlas.com/.
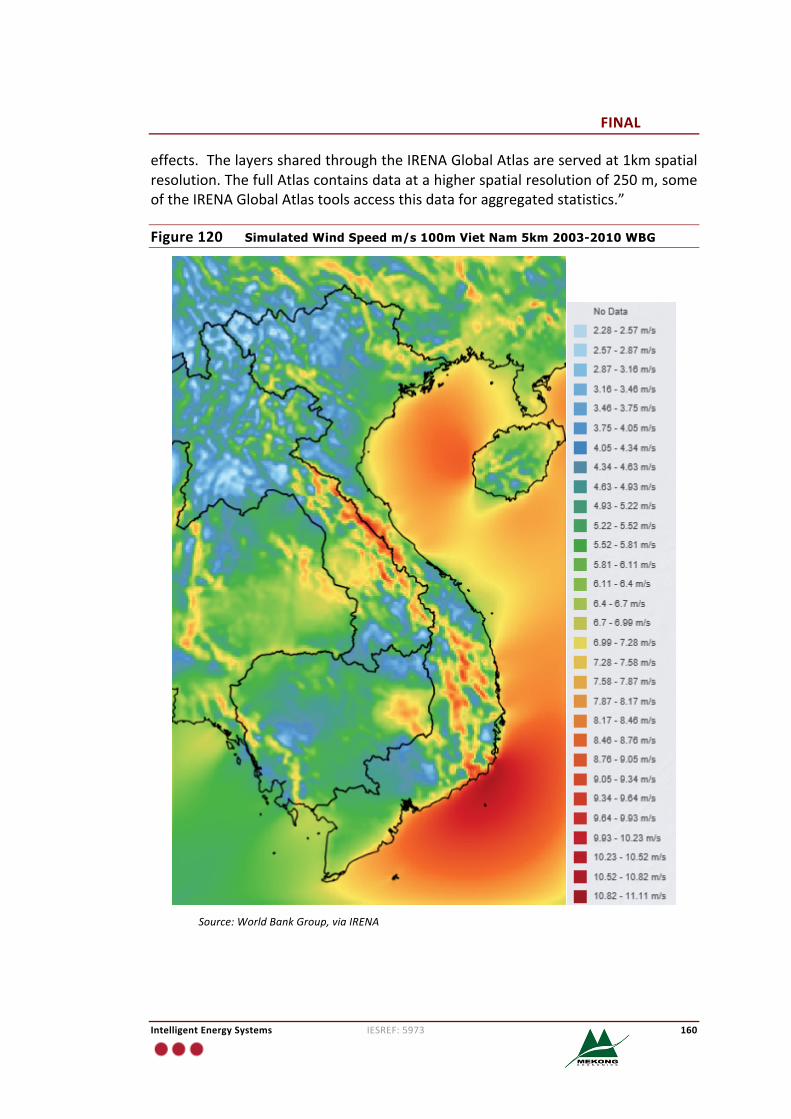
FINAL
IntelligentEnergySystems IESREF:5973 160
effects.ThelayerssharedthroughtheIRENAGlobalAtlasareservedat1kmspatialresolution.ThefullAtlascontainsdataatahigherspatialresolutionof250m,someoftheIRENAGlobalAtlastoolsaccessthisdataforaggregatedstatistics.”
Figure120 Simulated Wind Speed m/s 100m Viet Nam 5km 2003-2010 WBG
Source:WorldBankGroup,viaIRENA
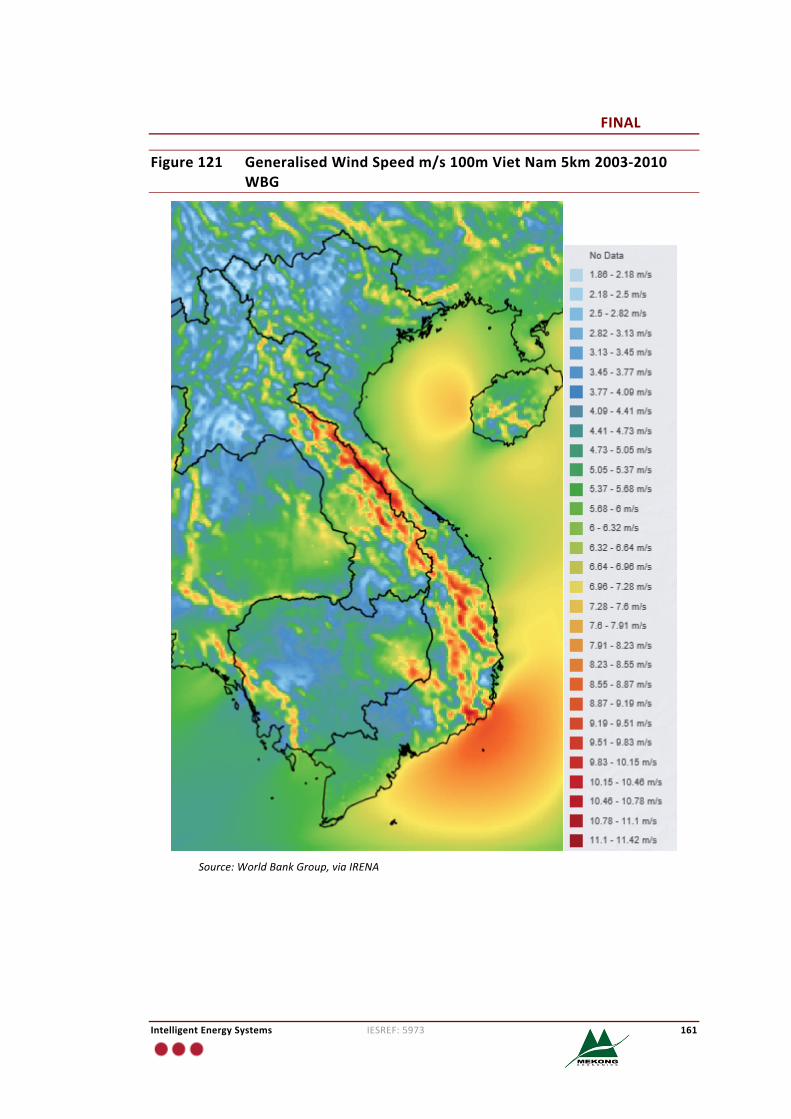
FINAL
IntelligentEnergySystems IESREF:5973 161
Figure121 GeneralisedWindSpeedm/s100mVietNam5km2003-2010WBG
Source:WorldBankGroup,viaIRENA
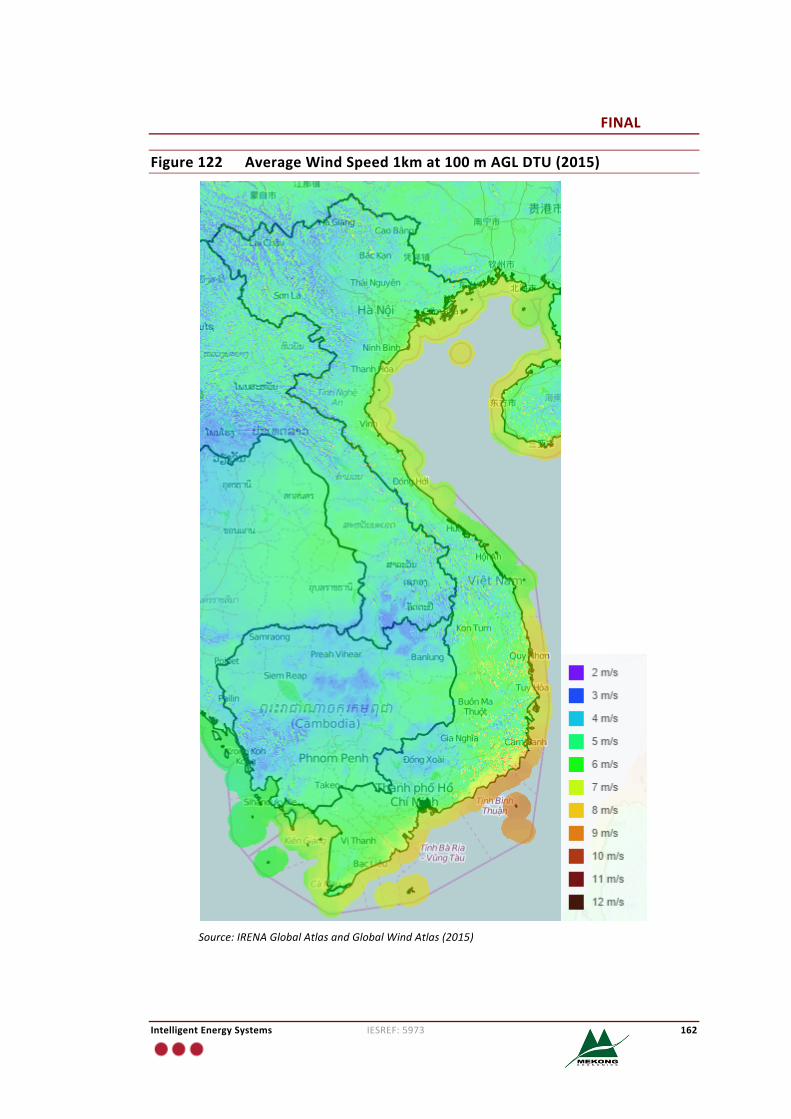
FINAL
IntelligentEnergySystems IESREF:5973 162
Figure122 AverageWindSpeed1kmat100mAGLDTU(2015)
Source:IRENAGlobalAtlasandGlobalWindAtlas(2015)
FINAL
IntelligentEnergySystems IESREF:5973 163
D.2 WindPowerDensityMaps
Figure123andFigure124respectivelyshowthewindpowerdensityinunitsofW/sbased on thewind speed charts presented earlier. The following information oneachchartisindicatedonIRENA’swebsite:
• “Based on the simulatedwind speed data at 100mAGL, power density datameasuresWperm2.Thesedataintroduceflatterrainanduniformroughnesslengthof10cmacrossthestudyarea.Thisgeneralizedmodelallowsforusersto plug in their own microscale orography and roughness values in customsimulations. These data were developed using the Weather, Research, andForecasting model at a 5km interval. The original modelling work wasperformedbyDTU.Themapisanun-validated,satellite-derivedestimate.AspartofphaseIIoftheWBGinitiative,thesemapswillbevalidatedthroughtheuse of ground measurement data, and until the data collection period isfinishedshouldbeconsidered forpolicyuse, rather thanenergyprospecting,followingIRENA'sclassificationofrenewableenergydata.”;and
• “Based on the simulatedwind speed data at 100mAGL, power density datameasuresWperm2.Valuesreflectorographyandsurfaceroughnesslengthasthey are represented in the model. These data were developed using theWeather, Research, and Forecasting model at a 5km interval. The originalmodellingworkwasperformedbyDTU.Themapisanun-validated,satellite-derivedestimate.AspartofphaseIIoftheWBGinitiative,thesemapswillbevalidated through the use of groundmeasurement data, and until the datacollectionperiod is finished shouldbe considered for policy use, rather thanenergy prospecting, following IRENA's classification of renewable energydata.”

FINAL
IntelligentEnergySystems IESREF:5973 164
Figure123 Simulated Wind Power Density 100m 2003-2010 WBG in W/s73
Source:WorldBankGroup,viaIRENA
73We understand the legend should be “W/s” not “m/s” based on the description of the charts on the IRENAwebsite.
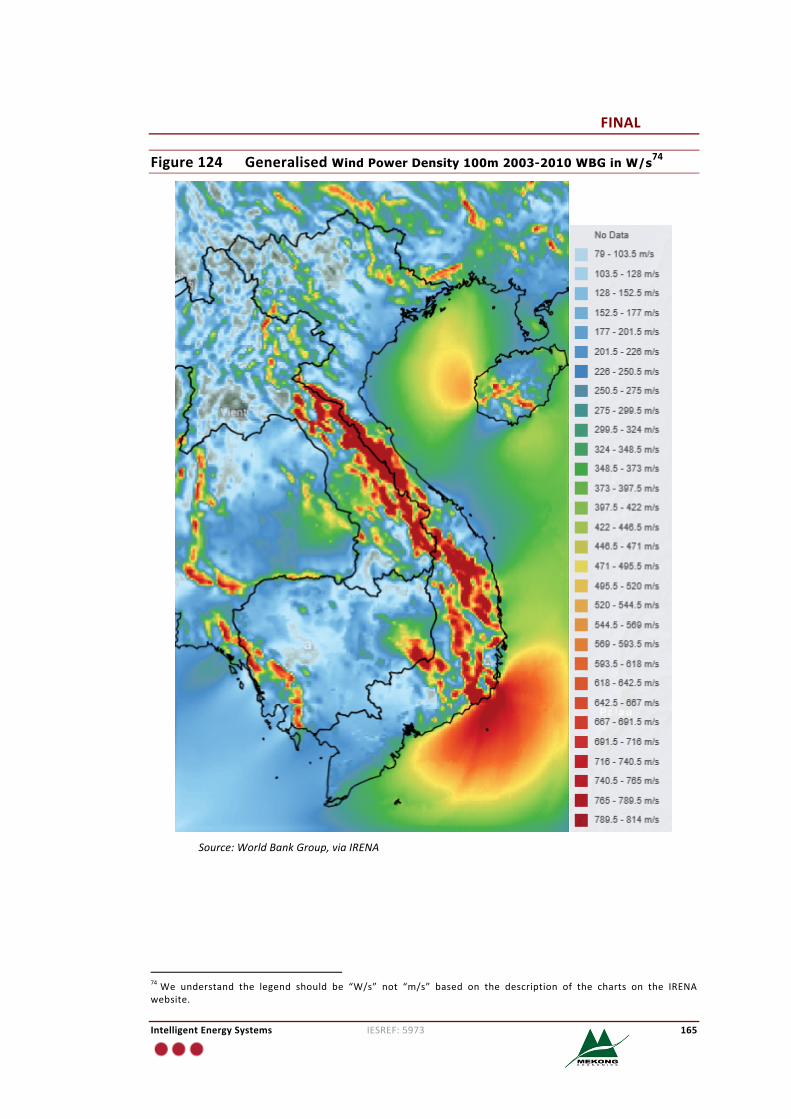
FINAL
IntelligentEnergySystems IESREF:5973 165
Figure124 GeneralisedWind Power Density 100m 2003-2010 WBG in W/s74
Source:WorldBankGroup,viaIRENA
74We understand the legend should be “W/s” not “m/s” based on the description of the charts on the IRENAwebsite.
FINAL
IntelligentEnergySystems IESREF:5973 166
AppendixE VietNamSolarResourceMapsThis sectionprovidesanumberof chartsofVietNam’s solar resourcepotential,thedataandmapsofwhichareaccessiblebyIRENA’sGlobalAtlasforRenewableEnergy(http://irena.masdar.ac.ae/).Thedatathemselvesarepulledfromvarioussources. The purpose is to illustrate geographical dispersion in solar potentialacrossVietNam.
E.1 GlobalHorizontalIrradianceandDirectNormalIrradiance
Figure 125 and Figure 126 respectively show annual maps of Global HorizontalIrradiance (GHI) kWh/m2 andDirectNormal Irradiance (DNI) kWh/m2 for 2003-2012(basedonWBGpublishedmeasurementsviatheIRENAAtlas).

FINAL
IntelligentEnergySystems IESREF:5973 167
Figure125 GlobalHorizontalIrradiance(GHI)kWh/m22003-12WBG
Source:WorldBankGroup,viaIRENA
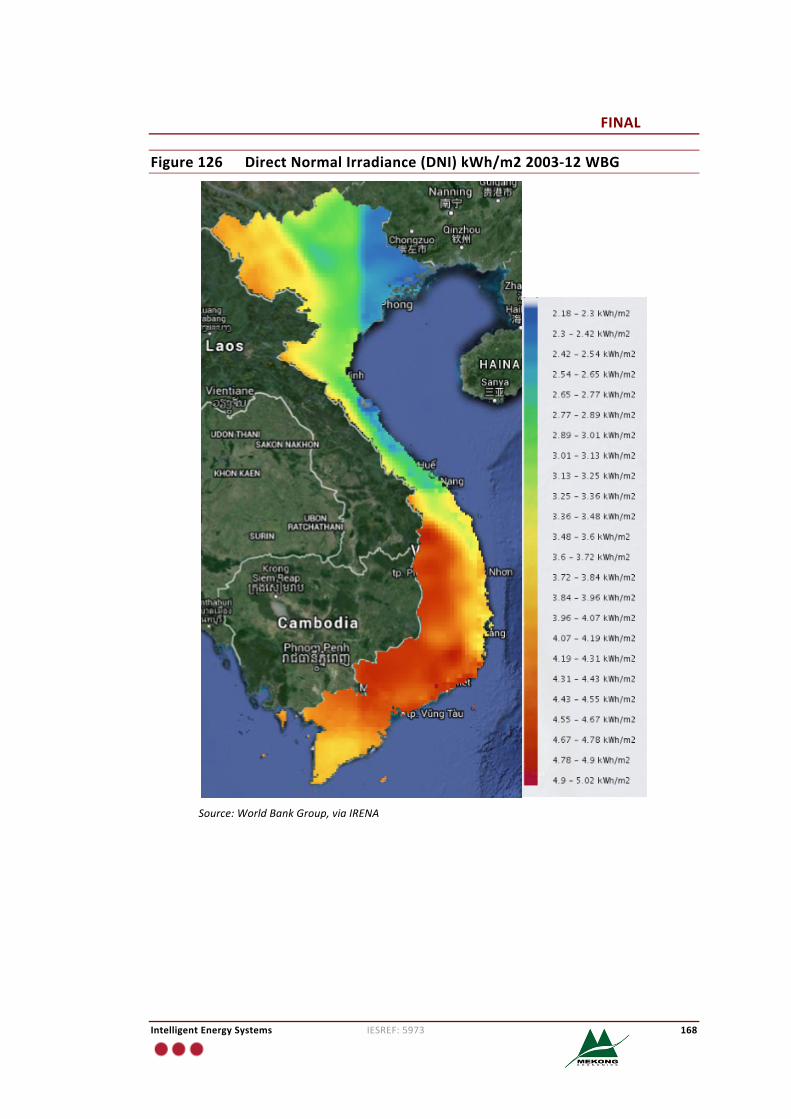
FINAL
IntelligentEnergySystems IESREF:5973 168
Figure126 DirectNormalIrradiance(DNI)kWh/m22003-12WBG
Source:WorldBankGroup,viaIRENA
FINAL
IntelligentEnergySystems IESREF:5973 169
E.2 ConcentratingSolarPower(CSP)Potential
Figure 127 and Figure 128 show respectively the theoretical and technicalpotentialsforCSP(GWh/year).TheformerisbasedonSolar potential for concentrated
solar power through parabolic troughs is estimated based on ANDASOL plant in the south of Spain75.
The plant is a 50 MWe solar plant with 6 hours of thermal energy storage76. The latter combine
theoretical potential with technical exclusion areas: slope < 3%, no water, roads, railroads, or
protected areas, minimum of 1500 kWh/m/day, and a minimum area of 2 km2 for plan construction.
75Source:DinterandGonzalez,http://www.peacelink.it/ecologia/docs/4978.pdf.76BasedontheSpanishConsortium’sstudybrieflydiscussedinsection3,createdbywascreatedbyCIEMAT,CENERandIDAE.
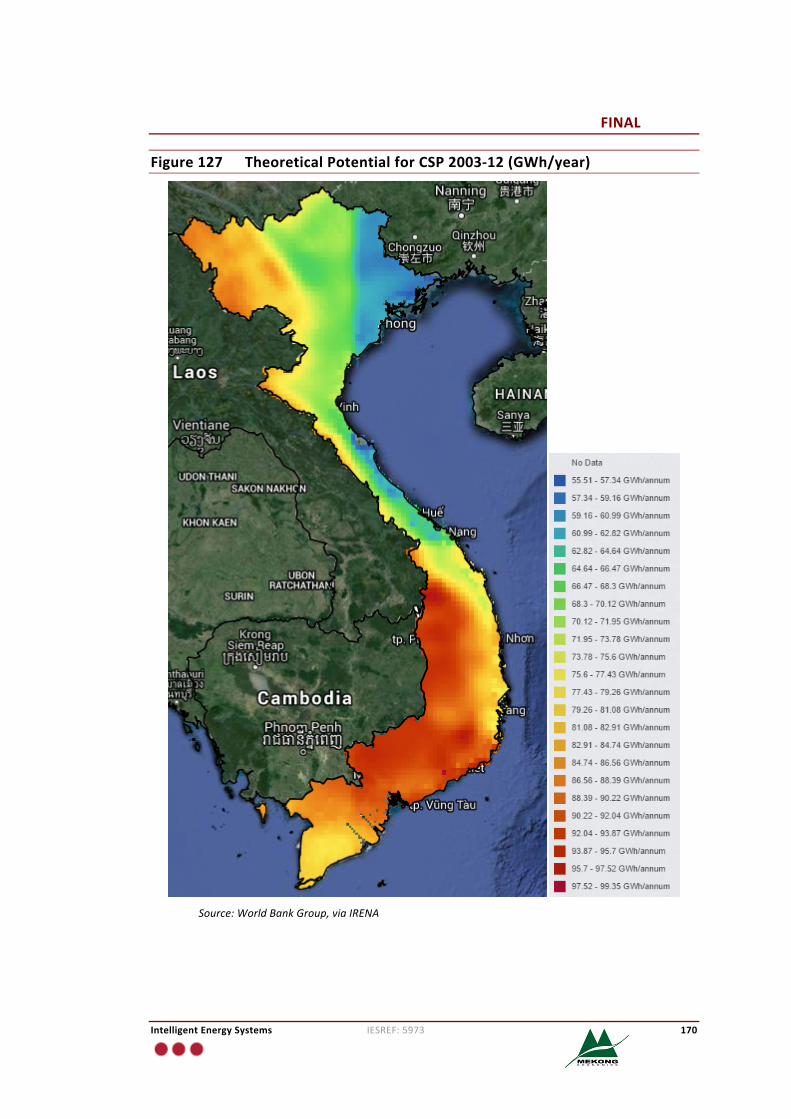
FINAL
IntelligentEnergySystems IESREF:5973 170
Figure127 TheoreticalPotentialforCSP2003-12(GWh/year)
Source:WorldBankGroup,viaIRENA
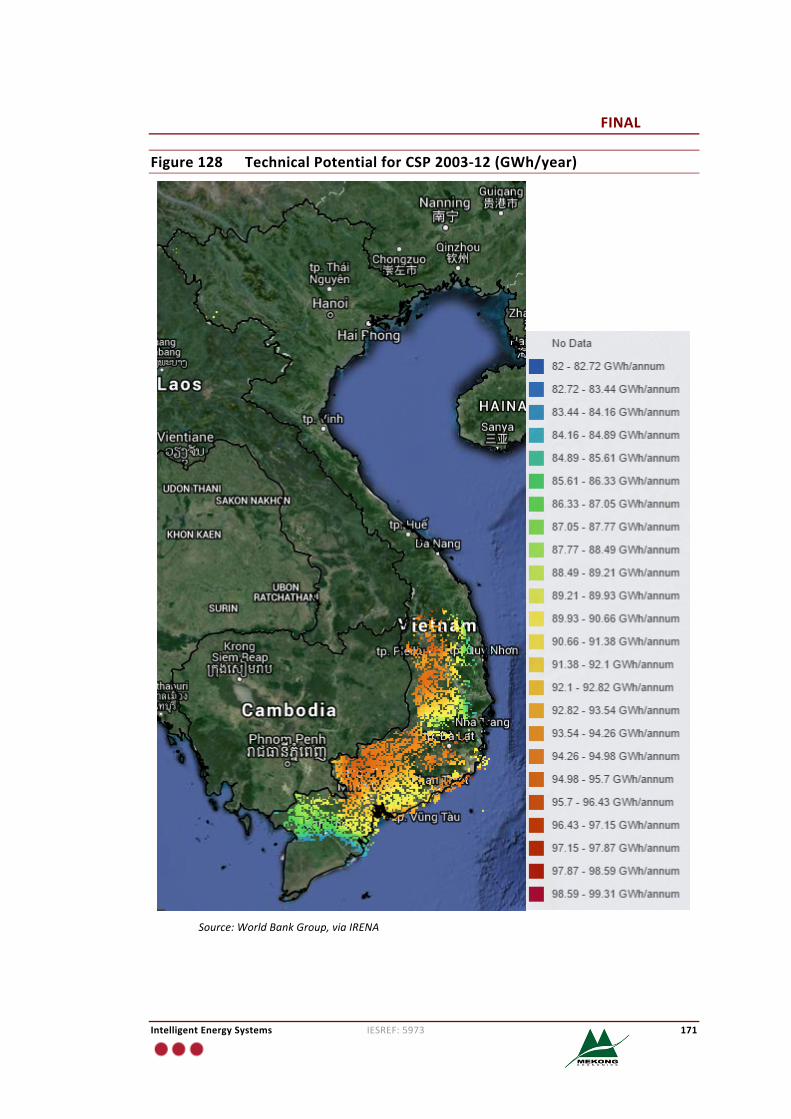
FINAL
IntelligentEnergySystems IESREF:5973 171
Figure128 TechnicalPotentialforCSP2003-12(GWh/year)
Source:WorldBankGroup,viaIRENA


