142
1 VIETNAM REAL ESTATE REPORT Q1/2018

1
VIETNAM REAL ESTATE REPORT Q1/2018

2
Executive summary 4 3.3.1 Real estate for rent 40
1. Business environment 7 3.3.2 Real estate for sale 67
1.1 Macroeconomic situation 7 3.4 Risks and challenges 77
1.2 Legal framework 11 3.4.1 Risks 78
1.3 Impact of trade agreements 18 3.4.2 Challenges 80
2. World Real Estate Market 21 3.4.3 SWOT 82
2.1 Real estate market in some countries in the world 21 3.5 Housing development planning 83
2.2 Real estate market in some countries in the region 27 3.6 Driving forces 85
3. Vietnam Real Estate Market 30 3.7 M&A trend 94
3.1 Industry concepts and characteristics 30 4. Enterprise analysis 97
3.2 The period of volatility of Vietnam Real Estate Market 34 5. Appendix 125
3.3 Movement of the real estate market 39 List of infrastructure projects for the period 2010-2030 126
Financial statements 130
Content

3
RS Real estate
MC Ministry of Construction
FIA Foreign Investment Agency
GSO General Statistics Office
VNAT Vietnam National Administration of Tourism
VNREA Vietnam Real Estate Association
VIRAC Vietnam Industry Research And Consultant JSC
Abbreviations

4
Vietnam after a long time developed the
"bubble" with the virtual price and then fall into
recession, house prices gradually return to real
value.
Vietnam is one of the most attractive
destinations for retailers in Southeast Asia due
to the booming economy.
The supply of office space for lease in Ho Chi
Minh City in Q4/2017 remained unchanged,
Executive summary
Content is intentionally removed for demo purpose

5
Executive summary
With an export-oriented economy, with
exports accounting for a significant portion of
80% of nominal GDP,
According to statistics at the end of Q3/2017,
only 750 foreigners are owning houses,
therefore, the demand for rental apartments is
relatively large.
The rate of GDP growth over the years and
policies to attract investment, as well as
tourists in recent years, is driving forces for the
hotel market in Vietnam.
The number of 5-star hotel rooms still accounts
for a large proportion of the market despite
the increase in supply from 3-star hotels.
Content is intentionally removed for demo purpose
6
Vietnam is seen as an attractive market
compared to other ASEAN countries,
2017 is the year witnessed many large M & A
transactions in the real estate market when
many big investors trust to pour money into
Vietnam.
Typical businesses with the largest real estate
revenue in 2016 show a clear orientation
In addition, the former when the retail market
of Vietnam with only three big men in the
industry such as Metro, Big C or Saigon Co.op,
has formed and developed with many big
names in the domestic retail industry
Executive summary
Content is intentionally removed for demo purpose
7
1. Business environment
1.1 Macroeconomic situation
1.2 Legal framework
1.3 Impact of trade agreements
Content
1. Business environment
1.1 Macroeconomic situation
8
Source: VIRAC, GSO
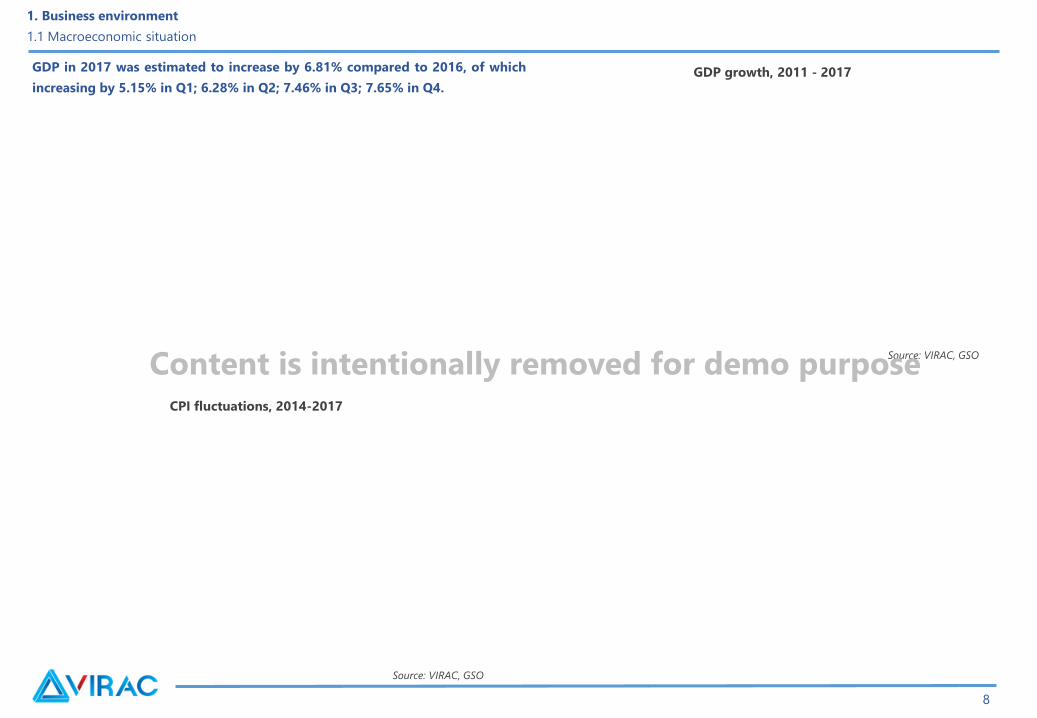
GDP in 2017 was estimated to increase by 6.81% compared to 2016, of which
increasing by 5.15% in Q1; 6.28% in Q2; 7.46% in Q3; 7.65% in Q4.
Source: VIRAC, GSO
CPI fluctuations, 2014-2017
GDP growth, 2011 - 2017
Content is intentionally removed for demo purpose
9
Source: VIRAC, GSO
1. Business environment
1.1 Macroeconomic situation
Source: VIRAC, GSO
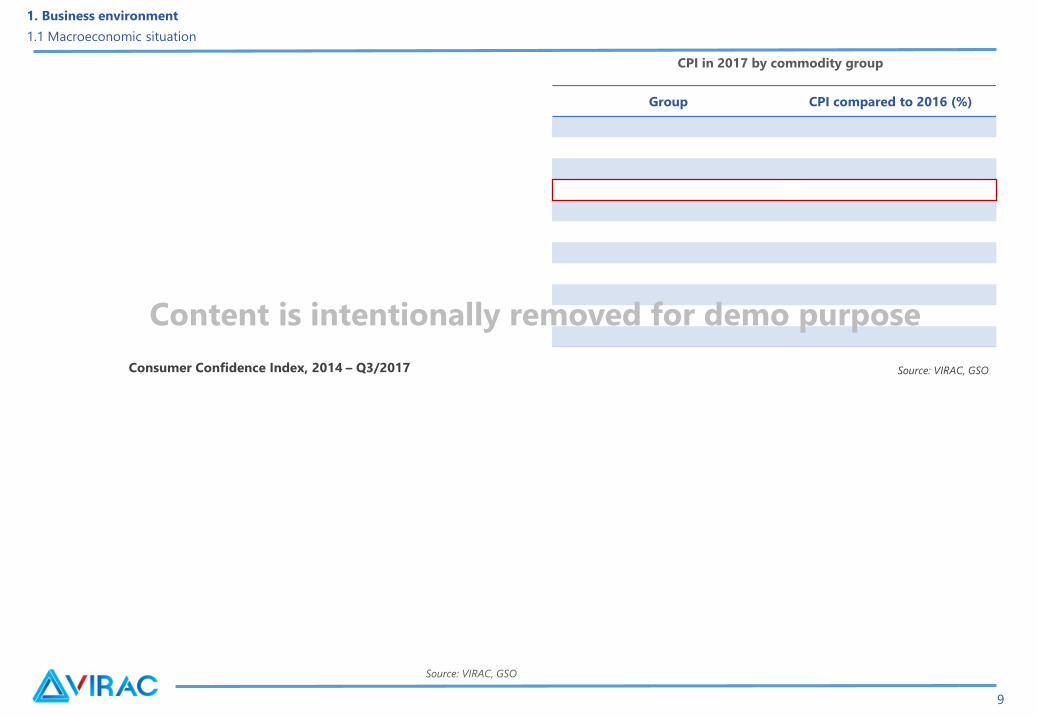
Group CPI compared to 2016 (%)
CPI in 2017 by commodity group
Consumer Confidence Index, 2014 – Q3/2017
Content is intentionally removed for demo purpose

10
In 2017, foreign investors have invested in 19 industries,
1. Business environment
1.1 Macroeconomic situation
Source: VIRAC, GSO
Source: VIRAC, FIA
FDI, 2015-2017USD billion
Average lending interest rate applied to USD, 2011 - 2017
Content is intentionally removed for demo purpose

11
1. Business environment
1.1 Macroeconomic situation
1.2 Legal framework
1.3 Impact of trade agreements
Content

12
1. Business environment
1.2 Legal framework
Content is intentionally removed for demo purpose
Real estate business law effective from 1 July 2015 has some notable changes as follows:
Sale or lease of houses to be formed in the future, investors must be guaranteed by credit institutions:
Real estate business must establish enterprise:
Investors of real estate projects are allowed to transfer all or part of the project
Disclaiming that all real estate transactions must be through a real estate trading platform:

13
1. Business environment
1.2 Legal framework
Content is intentionally removed for demo purpose
Handling the recovery of real estate projects:
The Vietnam Bank for Social Policies (VBSP) will mobilize capital and provide loans to implement social support policies:
Expanding the scope of real estate business activities of domestic organizations and individuals:

14
1. Business environment
1.2 Legal framework
Content is intentionally removed for demo purpose
The 2014 Revised Housing Law, effective July 1, 2015, has some noteworthy points:
Foreigners are allowed to buy and own houses in Vietnam:
Expanding the beneficiaries of social support policies :

15
1. Business environment
1.2 Legal framework
Content is intentionally removed for demo purpose

16
1. Business environment
1.2 Legal framework
Circular 06/2016 amending and supplementing some articles of Circular 36/2014/TT-NHNN
A detailed walk-through map is included in the flat area and the sections
are not included.
Source: VIRAC, Circular 03/2014/TT-BXD)
Content is intentionally removed for demo purpose

17
1. Business environment
1.2 Legal framework
On 12/15/2016, Circular No. 28/2016/TT-MC
Point e, Clause 1, Article 89, Construction Law 2014:
Content is intentionally removed for demo purpose
18
1. Business environment
1.2 Legal framework
The Ministry of Construction has issued two circulars effective from the beginning of February 1977 relating to apartment buildings and real estate
brokers:
Content is intentionally removed for demo purposeContent is intentionally removed for demo purpose

19
1. Business environment
1.1 Macroeconomic situation
1.2 Legal framework
1.3 Impact of trade agreements
Content
1. Business environment
1.3 Impact of trade agreements
20
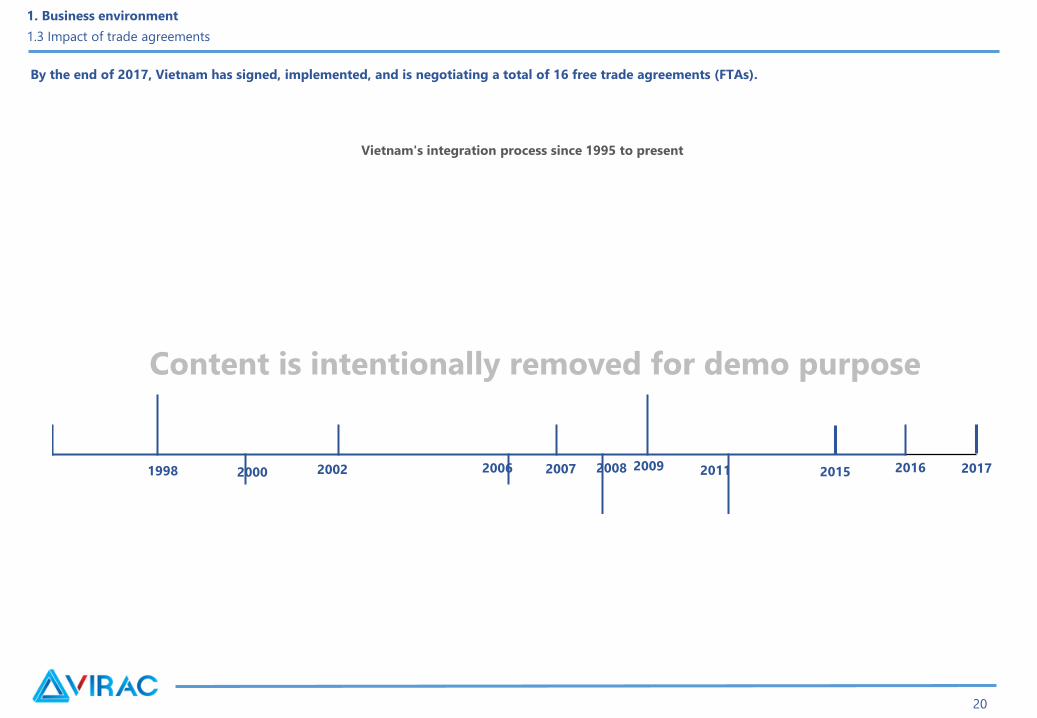
1998 2000 2002 2007 2008 2009 2011 2015
Vietnam's integration process since 1995 to present
By the end of 2017, Vietnam has signed, implemented, and is negotiating a total of 16 free trade agreements (FTAs).
2016 20172006
Content is intentionally removed for demo purpose

21
1. Business environment
1.3 Impact of trade agreements
Trans-Pacific Partnership Agreement - TPP:
Content is intentionally removed for demo purpose

22
2. World Real Estate Market
2.1 Real estate market in some countries in the world
2.2 Real estate market in some countries in the region
Content
23
US Real estates
Source: VIRAC, National Association of Realtors
USD
2. World Real Estate Market
2.1 Real estate market in some countries in the world
House price movement in the US, 5/2012 – 11/2017
Content is intentionally removed for demo purpose

24
2. World Real Estate Market
2.1 Real estate market in some countries in the world
Content is intentionally removed for demo purpose
In Europe:
Ireland’s real estate market:
UK’s real estate market :
25
2. World Real Estate Market
2.1 Real estate market in some countries in the world
Content is intentionally removed for demo purpose
Germany’s real estate market:
Russia’s real estate market :

26
2. World Real Estate Market
2.1 Real estate market in some countries in the world
Content is intentionally removed for demo purpose
In Asia and Oceania:
Australia’s real estate market:
New Zealand’s real estate market:
China’s real estate market:

27
In the Middle East housing market:
2. World Real Estate Market
2.1 Real estate market in some countries in the world
Content is intentionally removed for demo purpose
28
2. World Real Estate Market
2.1 Real estate market in some countries in the world
2.2 Real estate market in some countries in the region
Content
29
2. World Real Estate Market
2.1 Real estate market in some countries in the region
Content is intentionally removed for demo purpose
In ASEAN countries:
Myanmar’s real estate market:
.
Indonesia’s real estate market:

30
Source: VIRAC, numbeo.com
Home/income price indices in some 2016 countries
2. World Real Estate Market
2.1 Real estate market in some countries in the region
Content is intentionally removed for demo purpose
Malaysia’s real estate market:
Korea, Thailand

31
3. Vietnam Real Estate Market
3.1 Industry concepts and characteristics
3.2 The period of volatility of Vietnam Real Estate Market
3.3 Movement of the real estate market
3.4 Risks and challenges
3.5 Housing development planning
3.6 Driving forces
3.7 M&A trend
Content

32
3. Vietnam Real Estate Market
3.1 Industry concepts and characteristics
Overview of real estate market
Definition Content is intentionally removed for demo purpose
33
According to the Department of Housing Management - Ministry of Construction real estate is divided into three categories:
3. Vietnam Real Estate Market
3.1 Industry concepts and characteristics
Content is intentionally removed for demo purpose

34
Basic characteristics of real estate
Firstly,
Secondly,
Thirdly,
3. Vietnam Real Estate Market
3.1 Industry concepts and characteristics
Content is intentionally removed for demo purpose
35
Fourthly,
Characteristics of investment in real estate business in Vietnam
3. Vietnam Real Estate Market
3.1 Industry concepts and characteristics
Content is intentionally removed for demo purpose

36
3. Vietnam Real Estate Market
3.1 Industry concepts and characteristics
3.2 The period of volatility of Vietnam Real Estate Market
3.3 Movement of the real estate market
3.4 Risks and challenges
3.5 Housing development planning
3.6 Driving forces
3.7 M&A trend
Content
37
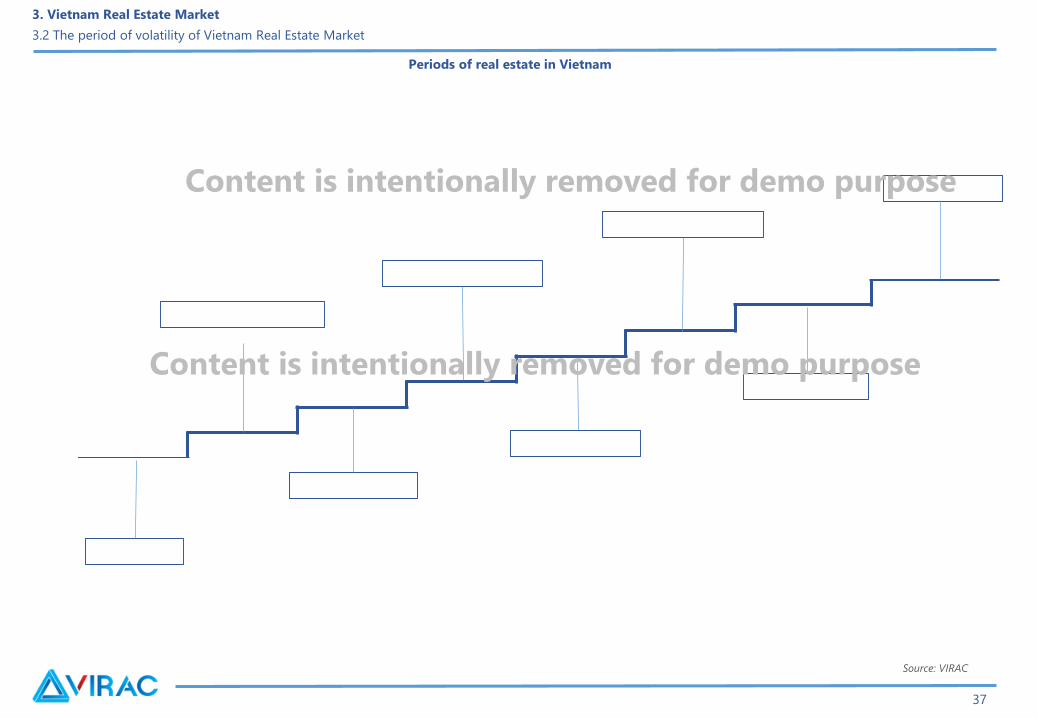
Periods of real estate in Vietnam
Source: VIRAC
3. Vietnam Real Estate Market
3.2 The period of volatility of Vietnam Real Estate Market
Content is intentionally removed for demo purpose
Content is intentionally removed for demo purpose
38
Before 1990:
The first real estate fever (1993-1994):
The first freeze (1995-1999):
The second real estate fever (2001-2002):
3. Vietnam Real Estate Market
3.2 The period of volatility of Vietnam Real Estate Market
Content is intentionally removed for demo purpose

39
The second freeze (2002-2006):
The third real estate fever (2007-2009):
The third freeze (2009-2013):
2014 – now:
3. Vietnam Real Estate Market
3.2 The period of volatility of Vietnam Real Estate Market
Content is intentionally removed for demo purpose

40
3. Vietnam Real Estate Market
3.1 Industry concepts and characteristics
3.2 The period of volatility of Vietnam Real Estate Market
3.3 Movement of the real estate market
3.4 Risks and challenges
3.5 Housing development planning
3.6 Driving forces
3.7 M&A trend
Content

41
Vietnam's economy is on a growth trajectory in terms of GDP and other economic indicators. Personal income and family expenses are gradually
improving which also has a positive impact on the retail real estate market.
Forecast:
3. Vietnam Real Estate Market
3.3 Movement of the real estate market - 3.3.1 Real estate for rent – Retail market
Retail market
Content is intentionally removed for demo purpose

42
Retail market – Hanoi
Source: VIRAC, VNREA
m²
Typical projects are scheduled for 2018-2020
Ongoing projectsArea
(m²)
Completion
timeLocation
Source: VIRAC, VNREA
3. Vietnam Real Estate Market
3.3 Movement of the real estate market - 3.3.1 Real estate for rent – Retail market
Total supply by category, Q4/2017
Content is intentionally removed for demo purpose
43
Source: VIRAC, VNREA
3. Vietnam Real Estate Market
3.3 Movement of the real estate market - 3.3.1 Real estate for rent – Retail market
Source: VIRAC, VNREA
Supply structure by region, Q4/2017
Vacancy rates and rental prices, Q4/2017
Content is intentionally removed for demo purpose

44
The area of supply for commercial centers always accounts for a large
proportion of over 90% of the retail supply area.
Source: VIRAC, VNREA
Source: VIRAC, VNREA
Thousand m²
USD/ m²/ month
3. Vietnam Real Estate Market
3.3 Movement of the real estate market - 3.3.1 Real estate for rent – Retail market
Rental supply of commercial center, 2010-2017e
Rental rates and vacancy rates of commercial center, 2010-2017e
Content is intentionally removed for demo purpose
45
m²
Source: VIRAC, VNREA
Source: VIRAC, VNREA
3. Vietnam Real Estate Market
3.3 Movement of the real estate market - 3.3.1 Real estate for rent – Retail market
Retail market – Ho Chi Minh city Total supply, Q4/2017
Retail supply structure by region, Q4/2017
Content is intentionally removed for demo purpose

46
Regarding rental prices, average rents in the CBD as well as out-of-
town areas remained unchanged in Q4.
Ongoing projects Area (m²)Completion
timeLocation
Typical projects are expected to be completed in 2018-2020
Source: VIRAC, VNREA
3. Vietnam Real Estate Market
3.3 Movement of the real estate market - 3.3.1 Real estate for rent – Retail market
Source: VIRAC, VNREA
VND/m²/monthVacancy rate and rental prices, Q4/2017
Content is intentionally removed for demo purpose

47
Source: VIRAC, VNREA
Source: VIRAC, VNREA
Thousand m²
USD/ m²/ month
3. Vietnam Real Estate Market
3.3 Movement of the real estate market - 3.3.1 Real estate for rent – Retail market
Supply of commercial center for lease, 2007-2017e
Rental price and vacancy rate of commercial centers, 2007-2017e
Content is intentionally removed for demo purpose

48
In addition to the economic recovery (low inflation rate, improved GDP, high consumption), Vietnam's joining the EU - Vietnam FTA has attracted a large
amount of foreign direct investment in the real estate, electronics, consultancy, finance, etc. The demand for office space has increased sharply as many
foreign businesses will come to Vietnam and set up their offices in Vietnam in the coming years.
Office market
3. Vietnam Real Estate Market
3.3 Movement of the real estate market - 3.3.1 Real estate for rent – Office market
Content is intentionally removed for demo purpose

49
Thousand m²
Source: VIRAC, VNREA
Source: VIRAC, VNREA
Thousand m²
3. Vietnam Real Estate Market
3.3 Movement of the real estate market - 3.3.1 Real estate for rent – Office market
Office market – Hanoi New supply and vacancy rate of grade A offices, 2010-2017e
Total supply by region, Q4/2017
Content is intentionally removed for demo purpose

50
Source: VIRAC, VNREA
Ongoing projects Area (m²) Completion time Location
USD/m²/month
Source: VIRAC, VNREA
USD/ m²/ month
Typical projects under construction, Q4/2017
Source: VIRAC, VNREA
3. Vietnam Real Estate Market
3.3 Movement of the real estate market - 3.3.1 Real estate for rent – Office market
Average rental price by area, Q4/2017
Office rental price, Q1/2015-Q4/2017
Content is intentionally removed for demo purpose

51
Office market – TP.HCM
Thousand m²
Source: VIRAC, VNREA
Source: VIRAC, VNREA
Thousand m²
3. Vietnam Real Estate Market
3.3 Movement of the real estate market - 3.3.1 Real estate for rent – Office market
USD
Office supply and vacancy rate, Q1/2015-Q4/2017
Total supply and rental price by category, Q4/2017
Content is intentionally removed for demo purpose

52
Ongoing projects Area (m²)Completion
timeLocation
Typical projects under construction
Source: VIRAC, VNREA
Source: VIRAC, VNREA
USD/ m²/ month
Ho Chi Minh City's office market continued to grow well in Q4/2017 with
rising offer rents in both segments.
3. Vietnam Real Estate Market
3.3 Movement of the real estate market - 3.3.1 Real estate for rent – Office market
Office rental price, Q1/2015-Q4/2017
Content is intentionally removed for demo purpose

53
Forecast:
3. Vietnam Real Estate Market
3.3 Movement of the real estate market - 3.3.1 Real estate for rent – Industrial zone market
Industrial zone market
Content is intentionally removed for demo purpose

54
Industrial zone market – Hanoi
Total supply of industrial parks in Hanoi remained stable compared to
the previous quarter and the same period last year due to the absence
of any new supply entering the market.
Ha
Source: VIRAC, VNREA
Source: VIRAC, VNREA
VND thousand/ m²/ lease term
3. Vietnam Real Estate Market
3.3 Movement of the real estate market - 3.3.1 Real estate for rent – Industrial zone market
Rental price by area, Q4/2017e
Total Supply by Region, Q4/2017e
Content is intentionally removed for demo purpose

55
Source: VIRAC, VNREA
Ongoing projects Area (ha) Location
Typical projects in the period 2018-2020
3. Vietnam Real Estate Market
3.3 Movement of the real estate market - 3.3.1 Real estate for rent – Industrial zone market
Content is intentionally removed for demo purpose

56
3. Vietnam Real Estate Market
3.3 Movement of the real estate market - 3.3.1 Real estate for rent – Industrial zone market
Ha
Source: VIRAC, VNREA
USD/ m²/ lease term USD/ m²/ month
Source: VIRAC, VNREA
Northern Industrial Zone
Average rental price for the Northern
Industrial Zone, Q4/2017
Total supply and vacancy rate of Northern Industrial
Zone, Q4/2017
Content is intentionally removed for demo purpose

57
Source: VIRAC, VNREA
Source: VIRAC, VNREA
VND thousand/ m²/ lease term
Ha
3. Vietnam Real Estate Market
3.3 Movement of the real estate market - 3.3.1 Real estate for rent – Industrial zone market
Industrial zone market – Ho Chi Minh cityTotal supply and vacancy rate, Q4/2017
Rental price by area, Q4/2017
Content is intentionally removed for demo purpose

58
Source: VIRAC, VNREA
Ongoing projects Area (ha) Location
Typical projects in the period 2018-2025
Source: VIRAC, VNREA
3. Vietnam Real Estate Market
3.3 Movement of the real estate market - 3.3.1 Real estate for rent – Industrial zone market
Vacancy rate, 2011-2017
Content is intentionally removed for demo purpose

59
There is a continuous increase in demand
Source: VIRAC, VNREA Source: VIRAC, VNREA
USD/m²/lease termUSD/m²/month
Rental price for land by area, 2011 – 2017
3. Vietnam Real Estate Market
3.3 Movement of the real estate market - 3.3.1 Real estate for rent – Industrial zone market
Rental price for factories available, 2011 - 2017
Content is intentionally removed for demo purpose

60
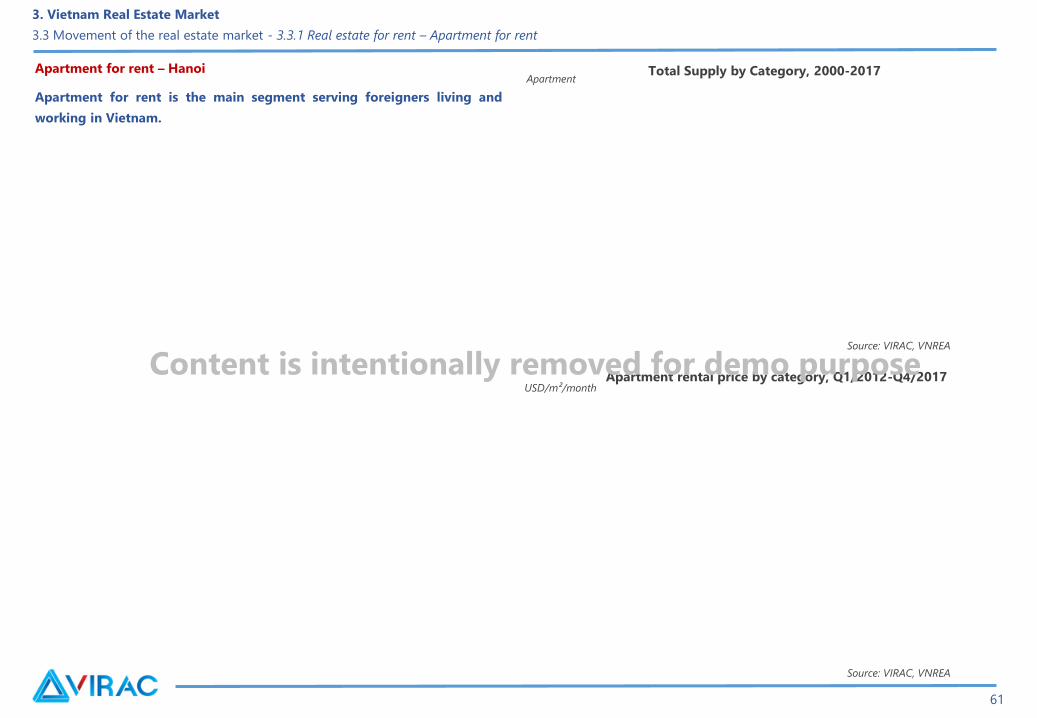
Apartment for rent is the main segment serving foreigners living and working in Vietnam.
Forecast:
3. Vietnam Real Estate Market
3.3 Movement of the real estate market - 3.3.1 Real estate for rent – Apartment for rent
Apartment for rent
Content is intentionally removed for demo purpose
61
Source: VIRAC, VNREA
Source: VIRAC, VNREA
Apartment
USD/m²/month
3. Vietnam Real Estate Market
3.3 Movement of the real estate market - 3.3.1 Real estate for rent – Apartment for rent
Apartment for rent – Hanoi
Apartment for rent is the main segment serving foreigners living and
working in Vietnam.
Total Supply by Category, 2000-2017
Apartment rental price by category, Q1/2012-Q4/2017Content is intentionally removed for demo purpose

62
Rental rates tended to decrease from 2014 and continued in
2016,
Source: VIRAC, VNREA
USD/ apartment/ month
Projects
Number of
apartment
s
LocationOccupancy
rateClass
Typical Serviced Apartments in Hanoi
Source: VIRAC
3. Vietnam Real Estate Market
3.3 Movement of the real estate market - 3.3.1 Real estate for rent – Apartment for rent
Apartment rental price and rental capacity, Q1/2014-Q4/2017
Content is intentionally removed for demo purpose

63
Apartment for rent – Ho Chi Minh city
Source: VIRAC, VNREA
Apartment
Source: VIRAC, VNREA
Ongoing projects Number of
apartmentsCompletion time Location
Typical projects under construction
3. Vietnam Real Estate Market
3.3 Movement of the real estate market - 3.3.1 Real estate for rent – Apartment for rent
Total supply of apartments for rent, Q1/2015-Q4/2017
Content is intentionally removed for demo purpose

64
Source: VIRAC, VNREA
USD/m²/month
3. Vietnam Real Estate Market
3.3 Movement of the real estate market - 3.3.1 Real estate for rent – Apartment for rent
Apartment rental prices by class, Q4/2016-Q4/2017
Content is intentionally removed for demo purpose

65
Forecast:
3. Vietnam Real Estate Market
3.3 Movement of the real estate market - 3.3.1 Real estate for rent – Hotel market
Hotel market
Content is intentionally removed for demo purpose
66
Source: VIRAC, VNREA
Source: VIRAC, VNREA
USD/room/night
Room
3. Vietnam Real Estate Market
3.3 Movement of the real estate market - 3.3.1 Real estate for rent – Hotel market
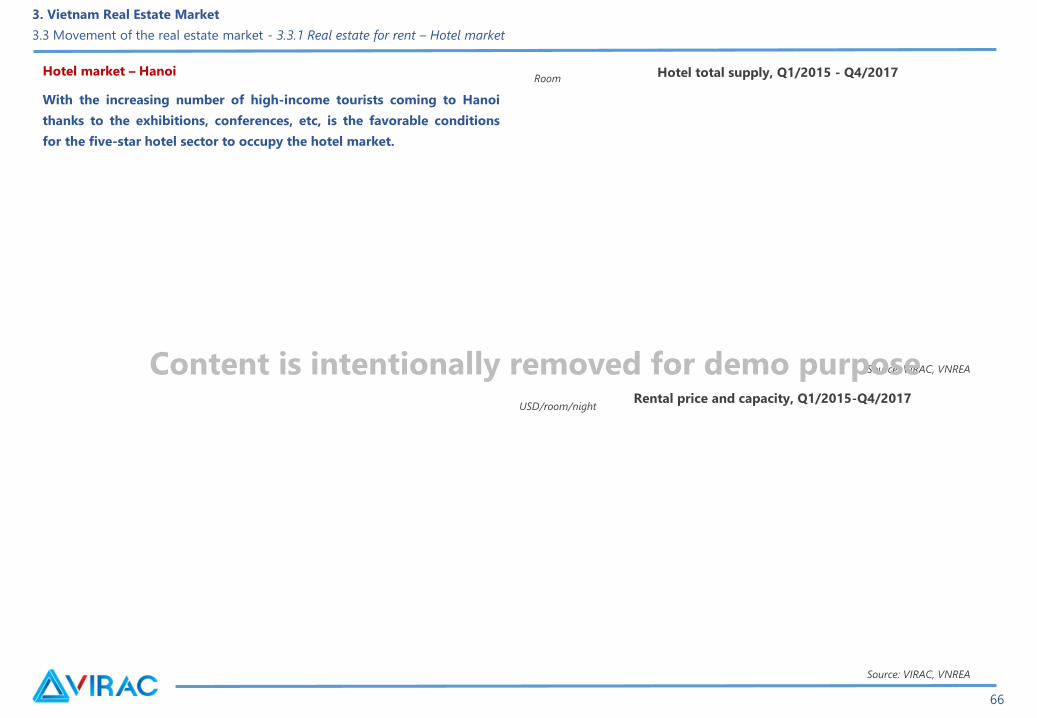
Hotel market – Hanoi
With the increasing number of high-income tourists coming to Hanoi
thanks to the exhibitions, conferences, etc, is the favorable conditions
for the five-star hotel sector to occupy the hotel market.
Hotel total supply, Q1/2015 - Q4/2017
Rental price and capacity, Q1/2015-Q4/2017
Content is intentionally removed for demo purpose

67
Rental price and capacity, Q4/2017
VND thousand/room/night
Source: VIRAC, VNREA
Source: VIRAC, VNREA
VND
thousand/room/night
3. Vietnam Real Estate Market
3.3 Movement of the real estate market - 3.3.1 Real estate for rent – Hotel market
Room
Hotel market – Ho Chi Minh city
Source: VIRAC, VNREA
Average rental price and capacity, Q1/2015-Q4/2017
Hotel total supply, Q1/2015 – Q4/2017
Content is intentionally removed for demo purpose

68
Forecast:
3. Vietnam Real Estate Market
3.3 Movement of the real estate market - 3.3.2 Real estate for sale – Apartment for sale
Apartment for sale
Content is intentionally removed for demo purpose
69
Thousand m²
Source: VIRAC, VNREA
3. Vietnam Real Estate Market
3.3 Movement of the real estate market - 3.3.2 Real estate for sale – Apartment for sale
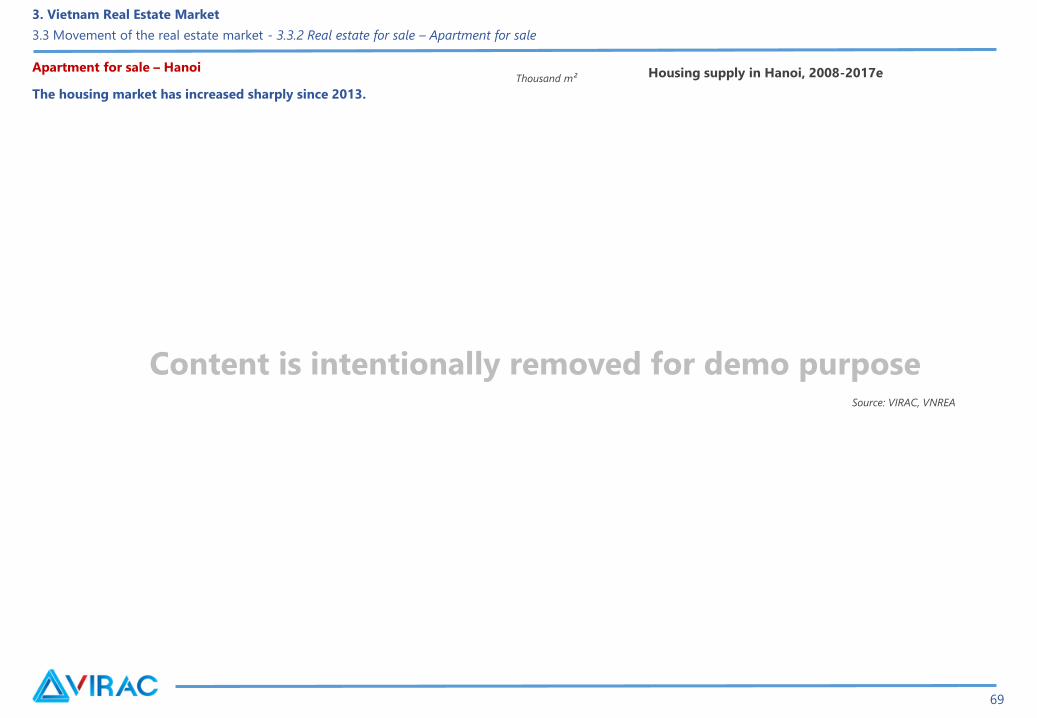
Apartment for sale – Hanoi
The housing market has increased sharply since 2013.
Housing supply in Hanoi, 2008-2017e
Content is intentionally removed for demo purpose
70
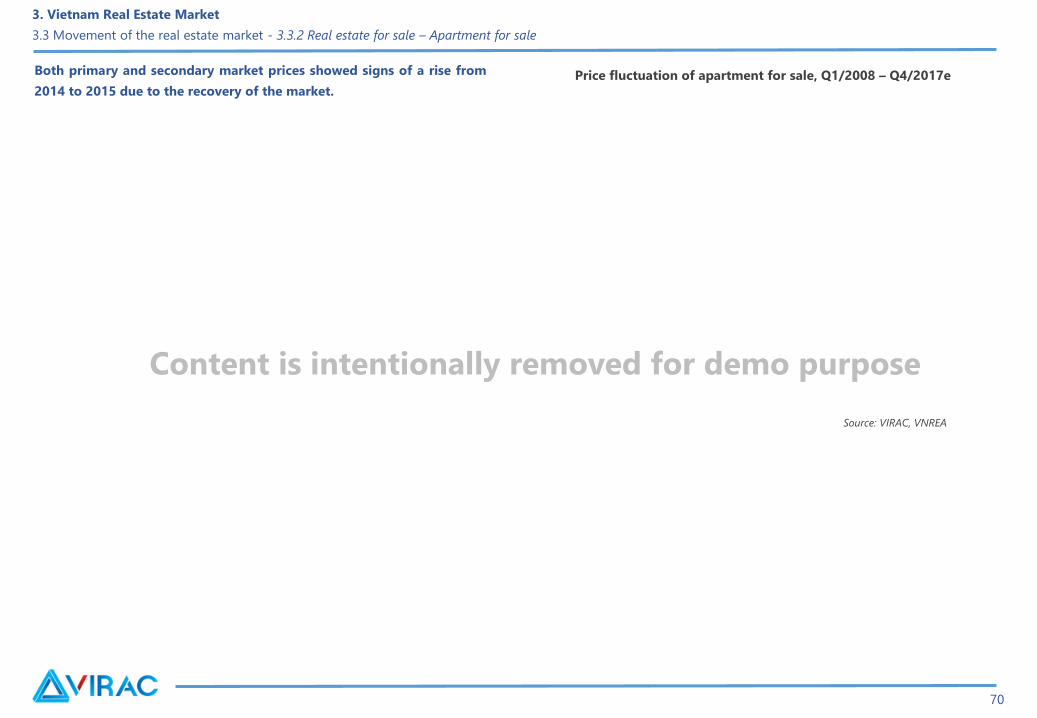
Both primary and secondary market prices showed signs of a rise from
2014 to 2015 due to the recovery of the market.
Source: VIRAC, VNREA
3. Vietnam Real Estate Market
3.3 Movement of the real estate market - 3.3.2 Real estate for sale – Apartment for sale
Price fluctuation of apartment for sale, Q1/2008 – Q4/2017e
Content is intentionally removed for demo purpose
In the coming years, positive macroeconomic
fundamentals will continue to drive the overall housing
market as well as the condominium market.
71
Source: VIRAC, VNREA
Typical projects are open for sale in the last 6 months of 2017
3. Vietnam Real Estate Market
3.3 Movement of the real estate market - 3.3.2 Real estate for sale – Apartment for sale
Project Investor LocationCompletion
time
Number of
Apartments
Selling price
(USD/m²)
* Selling price does not include taxes and discounts.
Content is intentionally removed for demo purpose
72
Source: VIRAC, VNREA
Apartment
3. Vietnam Real Estate Market
3.3 Movement of the real estate market - 3.3.2 Real estate for sale – Apartment for sale
Apartment for sale – Ho Chi Minh city New supply and number of apartments sold,
2010-2017e
Content is intentionally removed for demo purpose

73
USD/m²
Source: VIRAC, VNREA
USD/m²
3. Vietnam Real Estate Market
3.3 Movement of the real estate market - 3.3.2 Real estate for sale – Apartment for sale
Source: VIRAC, VNREA
High-end apartment segment's price, 2010-2017eOffer price for apartment in Ho Chi Minh City, Q1/2015 –
Q4/2017
Content is intentionally removed for demo purpose

74
Project Investor LocationCompletion
time
Number
of
apartme
nts
Selling
price
(USD/m²)
Source: VIRAC, VNREA
3. Vietnam Real Estate Market
3.3 Movement of the real estate market - 3.3.2 Real estate for sale – Apartment for sale
* Selling price does not include taxes and discounts.
Typical projects are open for sale in the last 6 months of 2017
Content is intentionally removed for demo purpose

75
Source: VIRAC
BankInterest
rate(*)
Maximum
loan(**)
Maximum
repayment period
(years)
Lending rates of commercial banks, 2017
*First year interest rate
** Borrowing ratio on assets
*** Per percentage of loan demand
If popular-segment customers mainly buy to stay, luxury-segment
customers still mainly have money to buy for investment or wait for selling
out. Not only in HCMC, here is the same situation in other provinces.
3. Vietnam Real Estate Market
3.3 Movement of the real estate market - 3.3.2 Real estate for sale – Apartment for sale
Source: VIRAC, VNREA
Structure of buying houses by purpose in HCM, 2016
Content is intentionally removed for demo purpose
76
Forecast:
3. Vietnam Real Estate Market
3.3 Movement of the real estate market - 3.3.2 Real estate for sale – Villa and townhouse market
Villa and townhouse market
Content is intentionally removed for demo purpose
77
Source: VIRAC, VNREA
Source: VIRAC, VNREA
3. Vietnam Real Estate Market
3.3 Movement of the real estate market - 3.3.2 Real estate for sale – Villa and townhouse market
Villa and townhouse market - HanoiApartment
Total villa/townhouse supply, Q1/2015-Q4/2017
Price fluctuation of villas and townhouses,
Q1/2014-Q4/2017
Content is intentionally removed for demo purpose
78
3. Vietnam Real Estate Market
3.3 Movement of the real estate market - 3.3.2 Real estate for sale – Villa and townhouse market
Project Investor Location Completion time Number of
apartments
Selling price
(USD/m² )
Typical projects are open for sale in the last 6 months of 2017
Source: VIRAC
* Selling price does not include taxes and discounts
Content is intentionally removed for demo purpose

79
Source: VIRAC, VNREA
3. Vietnam Real Estate Market
3.3 Movement of the real estate market - 3.3.2 Real estate for sale – Villa and townhouse market
Villa and townhouse market - Ho Chi Minh city
ApartmentTotal villa/townhouse supply, Q1/2014-Q4/2017
Content is intentionally removed for demo purpose
80
3. Vietnam Real Estate Market
3.3 Movement of the real estate market - 3.3.2 Real estate for sale – Villa and townhouse market
Project Investor Location Completion
time
Number of
apartments
Selling price
(USD/m² )
Typical projects are open for sale in 2017
Source: VIRAC* Selling price does not include taxes and discounts
Content is intentionally removed for demo purpose
81
3. Vietnam Real Estate Market
3.1 Industry concepts and characteristics
3.2 The period of volatility of Vietnam Real Estate Market
3.3 Movement of the real estate market
3.4 Risks and challenges
3.5 Housing development planning
3.6 Driving forces
3.7 M&A trend
Content
82
The subjective risks from the investor side
3. Vietnam Real Estate Market
3.4 Risks and challenges – 3.4.1 Risks
Content is intentionally removed for demo purpose
83
3. Vietnam Real Estate Market
3.4 Risks and challenges – 3.4.1 Risks
Objective risks from macro elements
Content is intentionally removed for demo purpose
84
Objective risks from macro elements
3. Vietnam Real Estate Market
3.4 Risks and challenges – 3.4.1 Risks
Content is intentionally removed for demo purpose

85
Source: VIRAC, numbeo.com
No. City, country
name
Country House price on
income (times)
20 cities with the highest average income per capita in 2016 in
the world
Source: VIRAC, numbeo.com
Time
House price on income in Vietnam, 2011 – 2016
3. Vietnam Real Estate Market
3.4 Risks and challenges – 3.4.2 Challenges
Content is intentionally removed for demo purpose

86
Source: VIRAC, MOC
VND trillion
3. Vietnam Real Estate Market
3.4 Risks and challenges – 3.4.2 Challenges
In the period 2010-2012, the real estate market after a period of hot
development has fallen into a "frozen" situation.
Stock value of real estate, 2013 – 12/2017
Content is intentionally removed for demo purpose

87
S W
O T
3. Vietnam Real Estate Market
3.4 Risks and challenges – 3.4.3 SWOT
Content is intentionally removed for demo purpose
88
3. Vietnam Real Estate Market
3.1 Industry concepts and characteristics
3.2 The period of volatility of Vietnam Real Estate Market
3.3 Movement of the real estate market
3.4 Risks and challenges
3.5 Housing development planning
3.6 Driving forces
3.7 M&A trend
Content

89
On 11/30/2011, the Prime Minister approved and approved Decision No. 2127/QD-TTg on national housing development strategy to 2020 and vision
to 2030:
3. Vietnam Real Estate Market
3.5 Planning
Content is intentionally removed for demo purpose

90
3. Vietnam Real Estate Market
3.1 Industry concepts and characteristics
3.2 The period of volatility of Vietnam Real Estate Market
3.3 Movement of the real estate market
3.4 Risks and challenges
3.5 Housing development planning
3.6 Driving forces
3.7 M&A trend
Content
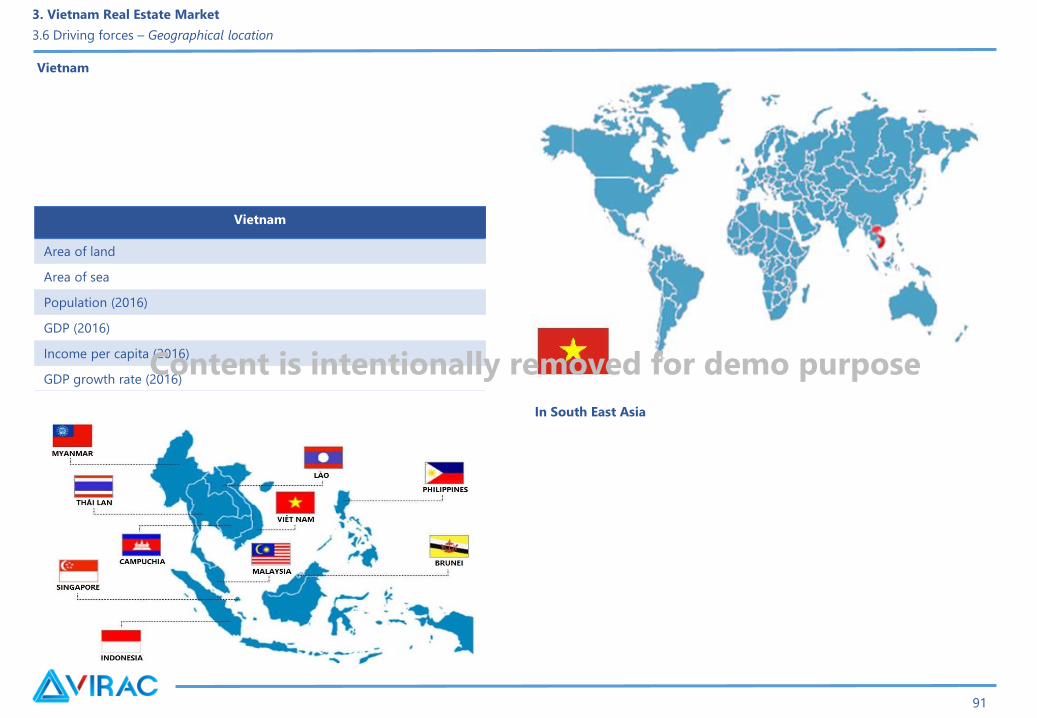
91
In South East Asia
Vietnam
Area of land
Area of sea
Population (2016)
GDP (2016)
Income per capita (2016)
GDP growth rate (2016)
Vietnam
3. Vietnam Real Estate Market
3.6 Driving forces – Geographical location
Content is intentionally removed for demo purpose

92
Population distribution in Vietnam
3. Vietnam Real Estate Market
3.6 Driving forces – Geographical location
Content is intentionally removed for demo purpose

93
The cost of capital investment for infrastructure development is raised
from public spending and foreign capital.
Structure of investment costs for infrastructure development in GDP, 1995 - 2013
Source: VIRAC, MOT
3. Vietnam Real Estate Market
3.6 Driving forces – Infrastructure
Content is intentionally removed for demo purpose

94
Largest urban areas of Vietnam
Estimated 2015
Rank City name Under
Population
(million
people)
Source: VIRAC
3. Vietnam Real Estate Market
3.6 Driving forces – Advantages of infrastructure and population
Content is intentionally removed for demo purpose
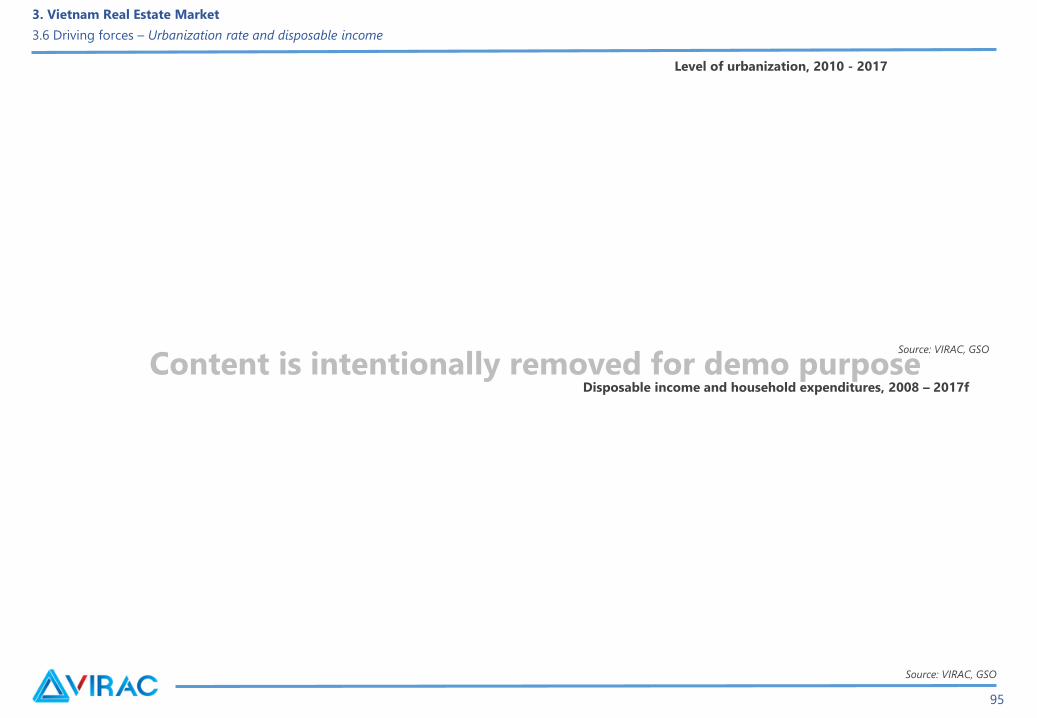
95
Level of urbanization, 2010 - 2017
Disposable income and household expenditures, 2008 – 2017f
Source: VIRAC, GSO
Source: VIRAC, GSO
3. Vietnam Real Estate Market
3.6 Driving forces – Urbanization rate and disposable income
Content is intentionally removed for demo purpose
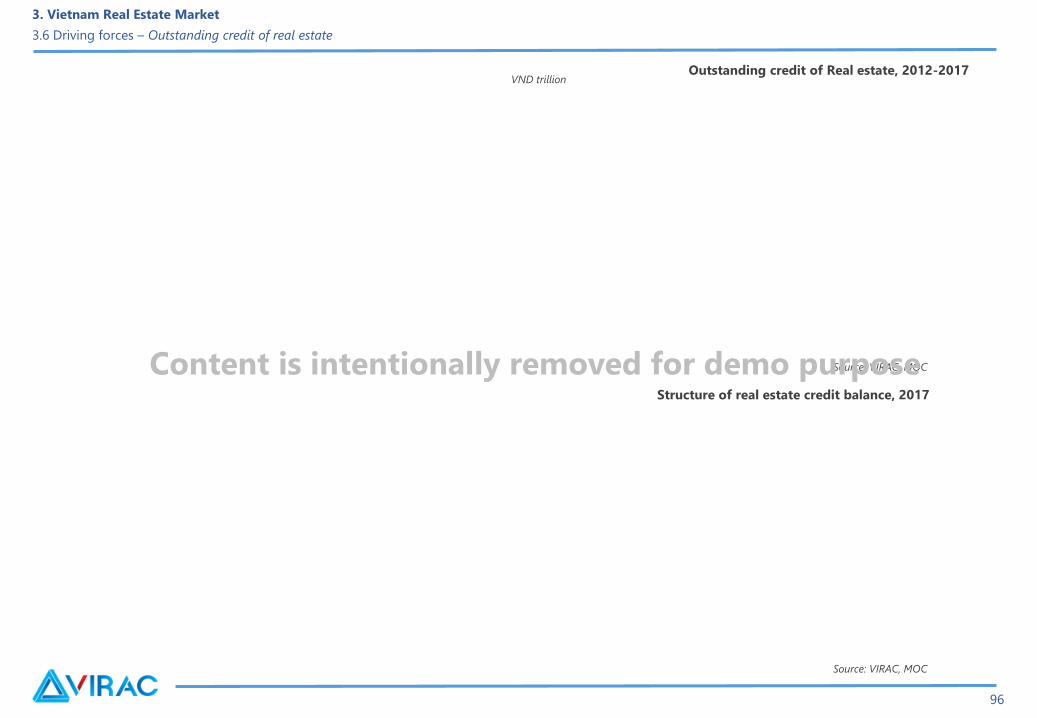
96
Source: VIRAC, MOC
VND trillion
Source: VIRAC, MOC
3. Vietnam Real Estate Market
3.6 Driving forces – Outstanding credit of real estate
Outstanding credit of Real estate, 2012-2017
Structure of real estate credit balance, 2017
Content is intentionally removed for demo purpose
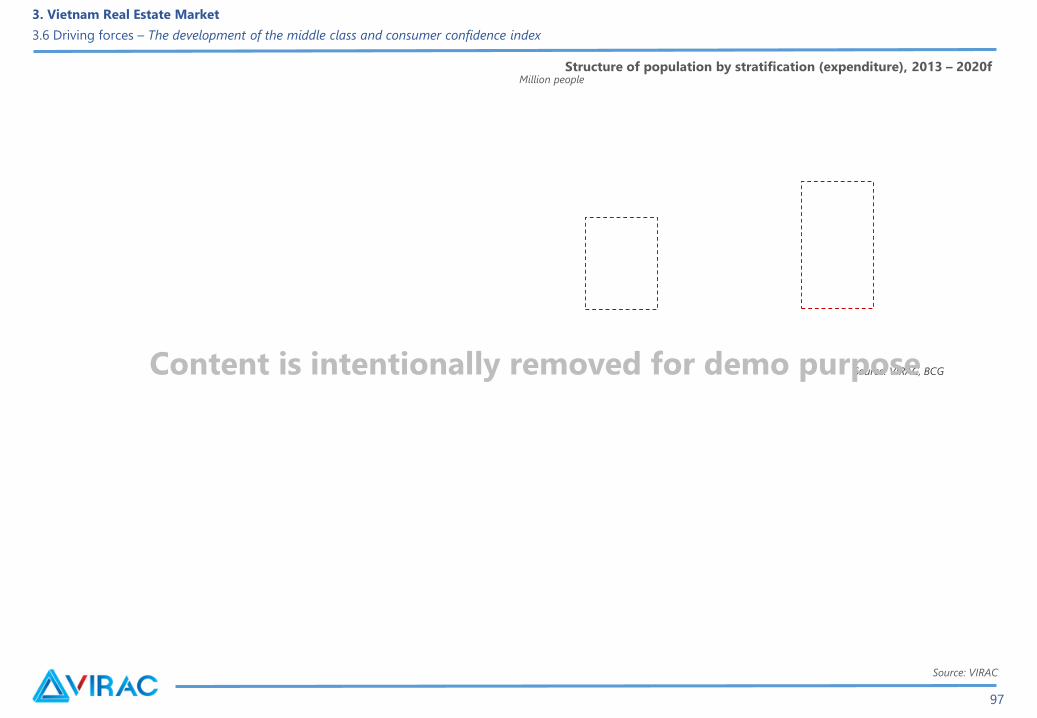
97
Structure of population by stratification (expenditure), 2013 – 2020f
Source: VIRAC, BCG
Million people
Source: VIRAC
3. Vietnam Real Estate Market
3.6 Driving forces – The development of the middle class and consumer confidence index
Content is intentionally removed for demo purpose
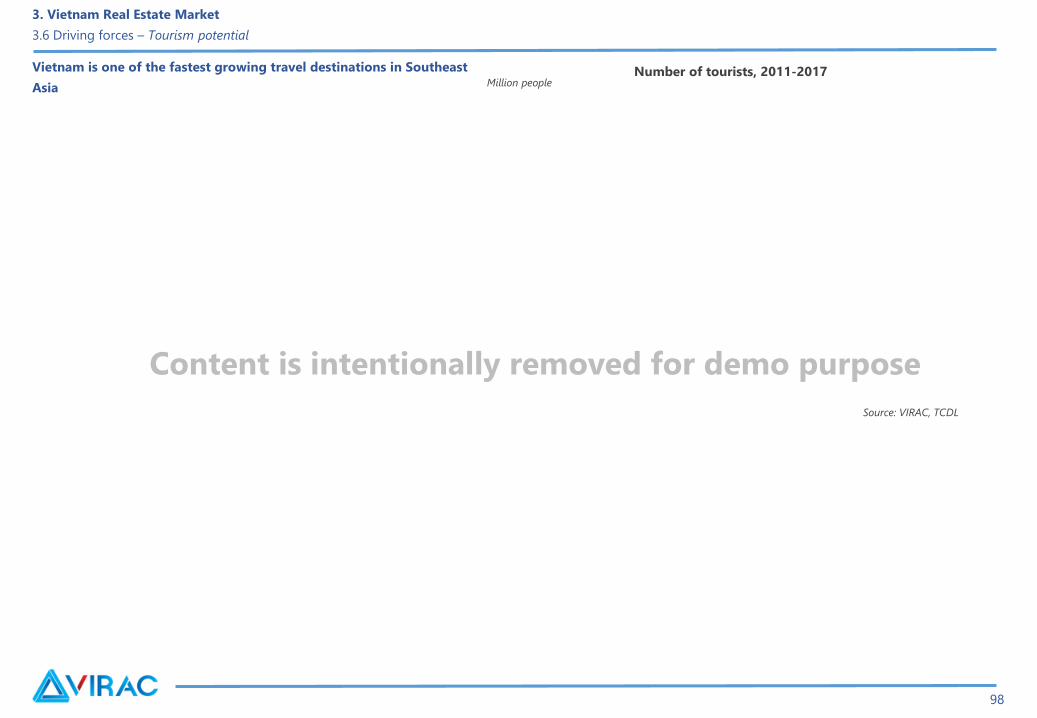
98
Vietnam is one of the fastest growing travel destinations in Southeast
Asia
Source: VIRAC, TCDL
Million people
3. Vietnam Real Estate Market
3.6 Driving forces – Tourism potential
Number of tourists, 2011-2017
Content is intentionally removed for demo purpose
99
3. Vietnam Real Estate Market
3.1 Industry concepts and characteristics
3.2 The period of volatility of Vietnam Real Estate Market
3.3 Movement of the real estate market
3.4 Risks and challenges
3.5 Housing development planning
3.6 Driving forces
3.7 M&A trend
Content

100
2017 is the year witnessed many large M&A transactions in the real estate market when many big investors believe to pour money into Vietnam.
According to consulting firm, JLL Vietnam, the total value of real estate M&A last year amounted to USD 1.5 billion. Of which, there are five typical M
& A deals:.
3. Vietnam Real Estate Market
3.7 M&A trend
Content is intentionally removed for demo purpose

101
3. Vietnam Real Estate Market
3.7 M&A trend
Content is intentionally removed for demo purpose

102
4. Enterprise analysis
Content

3. Types of real estate
Real estate enterprise analysis
Vingroup - JSC
Vinhomes Sky Lake, Pham Hung-Nam Tu Liem-Hanoi, Vingroup
100
Content is intentionally removed for demo purpose

104
Overview of FLC Group:
Five-star resort and golf complex Quy Nhon, Binh Dinh
3. Types of real estate
Real estate enterprise analysis
Content is intentionally removed for demo purpose

105
Kinh Bac City Development Corporation
3. Types of real estate
Real estate enterprise analysis
Que Vo Industrial Park, Que Vo District, Bac Ninh Province, KBC
Content is intentionally removed for demo purpose

106
Nova Real Estate Investment Corporation:
3. Types of real estate
Real estate enterprise analysis
Residential project in Richstar, Tan Phu, HCMC, Novaland
Content is intentionally removed for demo purpose

107
Khang Dien House Trading and Investment Joint Stock Company
3. Types of real estate
Real estate enterprise analysis
Lucasta Villa, District 9, Ho Chi Minh City
Content is intentionally removed for demo purpose

Nam Long Investment Corporation
108
3. Types of real estate
Real estate enterprise analysis
Camellia and Ehome, Nam Long
Content is intentionally removed for demo purpose

109
Phat Dat Real Estate Development Joint Stock Company
3. Types of real estate
Real estate enterprise analysis
Residential area of EverRich 2 (River City), District 7, HCMC, Phat Dat real
estate development
Content is intentionally removed for demo purpose
110
3. Types of real estate
Real estate enterprise analysis
Quoc Cuong Gia Lai Joint Stock Company
Quoc Cuong Gia Lai Residence
Content is intentionally removed for demo purpose

111
3. Types of real estate
Real estate enterprise analysis
Green Land Real Estate Group:
Sunview Town Residence – Dat Xanh Group
Content is intentionally removed for demo purpose
112
3. Types of real estate
Real estate enterprise analysis
Binh Duong Business and Development Joint Stock Company (TDC):
TDC Plaza apartment building in Binh Duong, Hoa Phu, Thu Dau Mot,
Binh Duong
Content is intentionally removed for demo purpose

Overview of AEON Group and AEON MALL Vietnam Co., Ltd Major shopping centers of AEON in Vietnam
Location Shopping center Floor square Total investment
3. Types of real estate
Real estate enterprise analysis
113
Content is intentionally removed for demo purpose

114
Overview of Lotte Group
3. Types of real estate
Real estate enterprise analysis
Hanoi
Hoàng Sa
Hồ Chí Minh
Trường SaCần Thơ
Phú Quốc
Vũng Tàu
Đà Nẵng
Content is intentionally removed for demo purpose

115
MEGA MARKET VIET NAM COMPANY LIMITED (formerly METRO Cash &
Carry VIETNAM)
3. Types of real estate
Real estate enterprise analysis
Content is intentionally removed for demo purpose
116
Overview of BIG C
3. Types of real estate
Real estate enterprise analysis
Content is intentionally removed for demo purpose
117
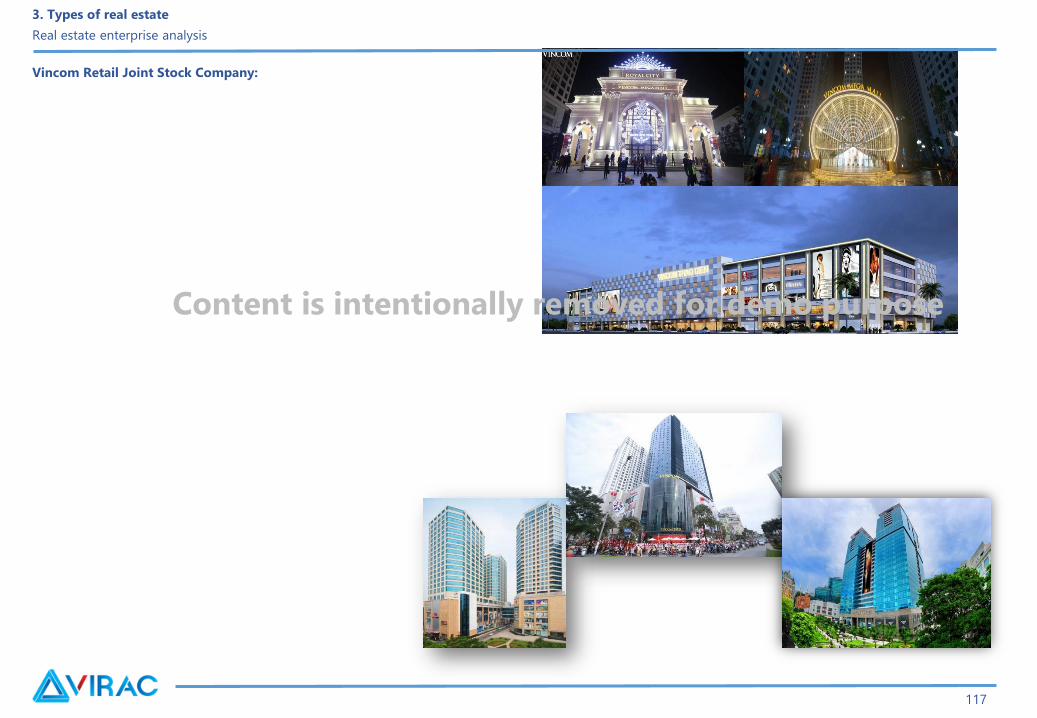
Vincom Retail Joint Stock Company:
3. Types of real estate
Real estate enterprise analysis
Content is intentionally removed for demo purpose

118
Vincom Plaza Shopping Center
3. Types of real estate
Real estate enterprise analysis
Content is intentionally removed for demo purpose
119
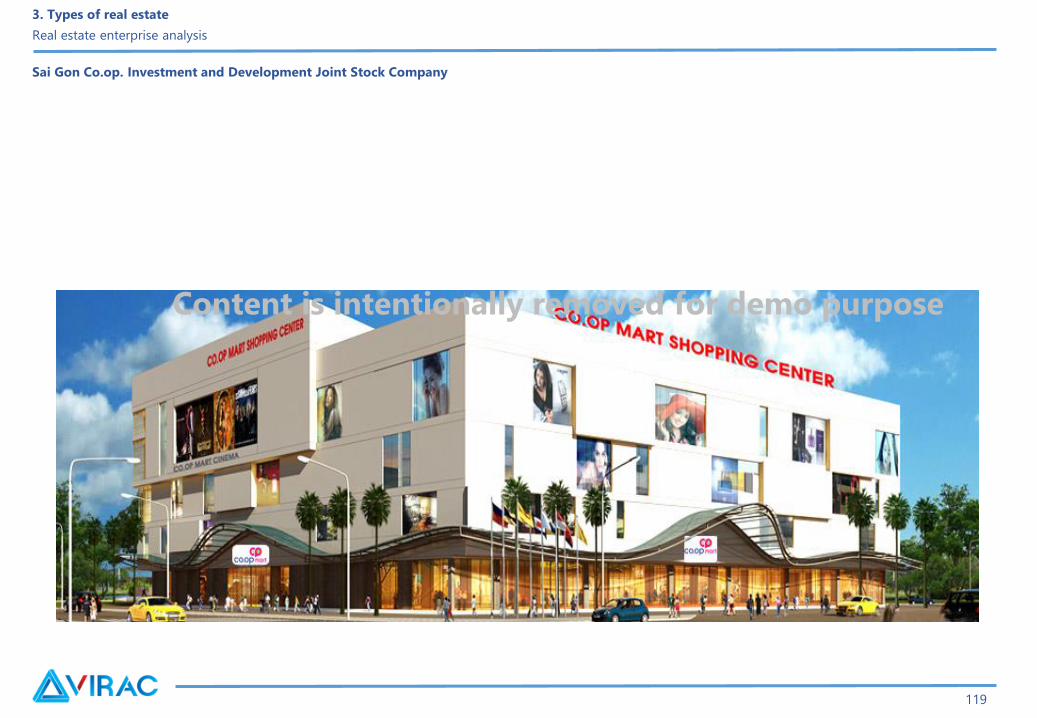
Sai Gon Co.op. Investment and Development Joint Stock Company
3. Types of real estate
Real estate enterprise analysis
Content is intentionally removed for demo purpose

120
3. Types of real estate
Real estate enterprise analysis
SOME OUTSTANDING FOREIGN INVESTORS INVESTING REAL ESTATE PROJECTS IN VIETNAM
Investor Project StatusTotal investment
(USD million)
In the North
In the South
Source: VIRAC
Content is intentionally removed for demo purpose

121
TOP REAL ESTATE ENTERPRISES WITH HIGHEST REVENUE 2016
Enterprise Location Tax code
Charter
capital
(VND
million)
Total assets
(VND
million)
Net revenue
(VND million)
3. Types of real estate
Real estate enterprise analysis
Content is intentionally removed for demo purpose
122
3. Real estate enterprise analysis
Target group of business results
VND million
Source: VIRAC
Net revenue growth, 2015 - 2016
Content is intentionally removed for demo purpose

123
3. Real estate enterprise analysis
Target group of business results
Source: VIRAC
VND
million
Gross profit growth, 2015 - 2016
Content is intentionally removed for demo purpose

124
3. Real estate enterprise analysis
Target group of business results
Source: VIRAC
SE/NR, 2015 - 2016
Content is intentionally removed for demo purpose

125
3. Real estate enterprise analysis
Target group of business results
Source: VIRAC
Source: VIRAC
G&AE/NR, 2015 - 2016
FE/NR, 2015 - 2016Content is intentionally removed for demo purpose

126
3. Real estate enterprise analysis
Financial indicators
Source: VIRAC
Account receivable turnover, 2015 - 2016
Content is intentionally removed for demo purpose
127
3. Real estate enterprise analysis
Financial indicators
VIC NVL FLC KDH NLG DXG KBC QCG PDR TDCIndustry
average
Current ratio
Quick ratio
Cash ratio
VIC NVL FLC KDH NLG DXG KBC QCG PDR TDC
Industry
average
Days in inventory
Total asset turnover
Fixed asset turnover
Source: VIRAC
Source: VIRAC
Content is intentionally removed for demo purpose
128
3. Real estate enterprise analysis
Targets of business results
VIC NVL FLC KDH NLG DXG KBC QCG PDR TDCIndustry
average
ROA (%)
ROE (%)
ROS (%)
Lợi nhuận sau thuế (tỷ đồng)
Tỷ số Nợ trên tổng tài sản (%)
Tỷ số nợ trên vốn chủ sở hữu (%)
Content is intentionally removed for demo purpose

129
3. Real estate enterprise analysis
Retail enterprises
Source: VIRAC
Source: VIRAC
Distribution of supermarkets in three regions in Vietnam, 2016
Retail market share in Vietnam in 2016
Content is intentionally removed for demo purpose

130
5. Appendix
Content

131
BALANCE SHEET
Unit: VND million 2015 2016
A. CURRENT ASSETS
I. Cash and cash equivalents
II. Short-term financial investments
III. Short-term receivables
1. Customer receivables
IV. Inventory
B. NON-CURRENT ASSETS
TOTAL ASSETS
A. LIABILITIES
I. Short-term debt
1. Short-term debt and loan
2. Taxes and amounts payable to the state
II. Long-term debt
1. Long-term debt and loan
2. Long-term provisions
B. EQUITY
TOTAL SOURCES
REPORT ON BUSINESS RESULTS
Unit: VND million 2015 2016
Net revenue
Cost of goods sold
Gross profit
Financial income
Financial expenses
Interest expenses
Selling expenses
General and administrative expenses
Net profit from business activities
Gross accounting profit before tax
Current corporate income tax expense
Deferred corporate income tax expenses
Profit after tax
STATEMENTS OF CASH FLOWS
Unit: VND million 2015 2016
I. Cash flow from business activities
Depreciation of fixed assets
Unrealized foreign exchange gain/loss
Net cash flows from operating activities
II. Cash flow from investment activities
Spending on procurement, construction of fixed assets and other
non-current assets
Net cash flows from investing activities
III. Cash flow from financial activities
Net cash flows from financing activities
Effect of exchange rate difference in foreign currency
Net cash flows during the year
Appendix
Financial statements
Vingroup
Content is intentionally removed for demo purpose

132
BALANCE SHEET
Unit: VND million 2015 2016
A. CURRENT ASSETS
I. Cash and cash equivalents
II. Short-term financial investments
III. Short-term receivables
1. Customer receivables
IV. Inventory
B. NON-CURRENT ASSETS
TOTAL ASSETS
A. LIABILITIES
I. Short-term debt
1. Short-term debt and loan
2. Taxes and amounts payable to the state
II. Long-term debt
1. Long-term debt and loan
2. Long-term provisions
B. EQUITY
TOTAL SOURCES
REPORT ON BUSINESS RESULTS
Unit: VND million 2015 2016
Net revenue
Cost of goods sold
Gross profit
Financial income
Financial expenses
Interest expenses
Selling expenses
General and administrative expenses
Net profit from business activities
Gross accounting profit before tax
Current corporate income tax expense
Deferred corporate income tax expenses
Profit after tax
STATEMENTS OF CASH FLOWS
Unit: VND million 2015 2016
I. Cash flow from business activities
Depreciation of fixed assets
Unrealized foreign exchange gain/loss
Net cash flows from operating activities
II. Cash flow from investment activities
Spending on procurement, construction of fixed assets and other
non-current assets
Net cash flows from investing activities
III. Cash flow from financial activities
Net cash flows from financing activities
Effect of exchange rate difference in foreign currency
Net cash flows during the year
No-Va Real Estate Investment Corporation
Appendix
Financial statements
Content is intentionally removed for demo purpose

133
BALANCE SHEET
Unit: VND million 2015 2016
A. CURRENT ASSETS
I. Cash and cash equivalents
II. Short-term financial investments
III. Short-term receivables
1. Customer receivables
IV. Inventory
B. NON-CURRENT ASSETS
TOTAL ASSETS
A. LIABILITIES
I. Short-term debt
1. Short-term debt and loan
2. Taxes and amounts payable to the state
II. Long-term debt
1. Long-term debt and loan
2. Long-term provisions
B. EQUITY
TOTAL SOURCES
REPORT ON BUSINESS RESULTS
Unit: VND million 2015 2016
Net revenue
Cost of goods sold
Gross profit
Financial income
Financial expenses
Interest expenses
Selling expenses
General and administrative expenses
Net profit from business activities
Gross accounting profit before tax
Current corporate income tax expense
Deferred corporate income tax expenses
Profit after tax
STATEMENTS OF CASH FLOWS
Unit: VND million 2015 2016
I. Cash flow from business activities
Depreciation of fixed assets
Unrealized foreign exchange gain/loss
Net cash flows from operating activities
II. Cash flow from investment activities
Spending on procurement, construction of fixed assets and other
non-current assets
Net cash flows from investing activities
III. Cash flow from financial activities
Net cash flows from financing activities
Effect of exchange rate difference in foreign currency
Net cash flows during the year
FLC Group
Appendix
Financial statements
Content is intentionally removed for demo purpose

134
BALANCE SHEET
Unit: VND million 2015 2016
A. CURRENT ASSETS
I. Cash and cash equivalents
II. Short-term financial investments
III. Short-term receivables
1. Customer receivables
IV. Inventory
B. NON-CURRENT ASSETS
TOTAL ASSETS
A. LIABILITIES
I. Short-term debt
1. Short-term debt and loan
2. Taxes and amounts payable to the state
II. Long-term debt
1. Long-term debt and loan
2. Long-term provisions
B. EQUITY
TOTAL SOURCES
REPORT ON BUSINESS RESULTS
Unit: VND million 2015 2016
Net revenue
Cost of goods sold
Gross profit
Financial income
Financial expenses
Interest expenses
Selling expenses
General and administrative expenses
Net profit from business activities
Gross accounting profit before tax
Current corporate income tax expense
Deferred corporate income tax expenses
Profit after tax
STATEMENTS OF CASH FLOWS
Unit: VND million 2015 2016
I. Cash flow from business activities
Depreciation of fixed assets
Unrealized foreign exchange gain/loss
Net cash flows from operating activities
II. Cash flow from investment activities
Spending on procurement, construction of fixed assets and other
non-current assets
Net cash flows from investing activities
III. Cash flow from financial activities
Net cash flows from financing activities
Effect of exchange rate difference in foreign currency
Net cash flows during the year
Khang Dien Housing Investment & Trading JSC
Appendix
Financial statements
Content is intentionally removed for demo purpose

135
BALANCE SHEET
Unit: VND million 2015 2016
A. CURRENT ASSETS
I. Cash and cash equivalents
II. Short-term financial investments
III. Short-term receivables
1. Customer receivables
IV. Inventory
B. NON-CURRENT ASSETS
TOTAL ASSETS
A. LIABILITIES
I. Short-term debt
1. Short-term debt and loan
2. Taxes and amounts payable to the state
II. Long-term debt
1. Long-term debt and loan
2. Long-term provisions
B. EQUITY
TOTAL SOURCES
REPORT ON BUSINESS RESULTS
Unit: VND million 2015 2016
Net revenue
Cost of goods sold
Gross profit
Financial income
Financial expenses
Interest expenses
Selling expenses
General and administrative expenses
Net profit from business activities
Gross accounting profit before tax
Current corporate income tax expense
Deferred corporate income tax expenses
Profit after tax
STATEMENTS OF CASH FLOWS
Unit: VND million 2015 2016
I. Cash flow from business activities
Depreciation of fixed assets
Unrealized foreign exchange gain/loss
Net cash flows from operating activities
II. Cash flow from investment activities
Spending on procurement, construction of fixed assets and other
non-current assets
Net cash flows from investing activities
III. Cash flow from financial activities
Net cash flows from financing activities
Effect of exchange rate difference in foreign currency
Net cash flows during the year
Nam Long Investment JSC
Appendix
Financial statements
Content is intentionally removed for demo purpose

136
BALANCE SHEET
Unit: VND million 2015 2016
A. CURRENT ASSETS
I. Cash and cash equivalents
II. Short-term financial investments
III. Short-term receivables
1. Customer receivables
IV. Inventory
B. NON-CURRENT ASSETS
TOTAL ASSETS
A. LIABILITIES
I. Short-term debt
1. Short-term debt and loan
2. Taxes and amounts payable to the state
II. Long-term debt
1. Long-term debt and loan
2. Long-term provisions
B. EQUITY
TOTAL SOURCES
REPORT ON BUSINESS RESULTS
Unit: VND million 2015 2016
Net revenue
Cost of goods sold
Gross profit
Financial income
Financial expenses
Interest expenses
Selling expenses
General and administrative expenses
Net profit from business activities
Gross accounting profit before tax
Current corporate income tax expense
Deferred corporate income tax expenses
Profit after tax
STATEMENTS OF CASH FLOWS
Unit: VND million 2015 2016
I. Cash flow from business activities
Depreciation of fixed assets
Unrealized foreign exchange gain/loss
Net cash flows from operating activities
II. Cash flow from investment activities
Spending on procurement, construction of fixed assets and other
non-current assets
Net cash flows from investing activities
III. Cash flow from financial activities
Net cash flows from financing activities
Effect of exchange rate difference in foreign currency
Net cash flows during the year
Dat Xanh Real Estate Service & Construction JSC
Appendix
Financial statements
Content is intentionally removed for demo purpose

137
BALANCE SHEET
Unit: VND million 2015 2016
A. CURRENT ASSETS
I. Cash and cash equivalents
II. Short-term financial investments
III. Short-term receivables
1. Customer receivables
IV. Inventory
B. NON-CURRENT ASSETS
TOTAL ASSETS
A. LIABILITIES
I. Short-term debt
1. Short-term debt and loan
2. Taxes and amounts payable to the state
II. Long-term debt
1. Long-term debt and loan
2. Long-term provisions
B. EQUITY
TOTAL SOURCES
REPORT ON BUSINESS RESULTS
Unit: VND million 2015 2016
Net revenue
Cost of goods sold
Gross profit
Financial income
Financial expenses
Interest expenses
Selling expenses
General and administrative expenses
Net profit from business activities
Gross accounting profit before tax
Current corporate income tax expense
Deferred corporate income tax expenses
Profit after tax
STATEMENTS OF CASH FLOWS
Unit: VND million 2015 2016
I. Cash flow from business activities
Depreciation of fixed assets
Unrealized foreign exchange gain/loss
Net cash flows from operating activities
II. Cash flow from investment activities
Spending on procurement, construction of fixed assets and other
non-current assets
Net cash flows from investing activities
III. Cash flow from financial activities
Net cash flows from financing activities
Effect of exchange rate difference in foreign currency
Net cash flows during the year
Kinh Bac City Development Share Holding Corporation
Appendix
Financial statements
Content is intentionally removed for demo purpose

138
BALANCE SHEET
Unit: VND million 2015 2016
A. CURRENT ASSETS
I. Cash and cash equivalents
II. Short-term financial investments
III. Short-term receivables
1. Customer receivables
IV. Inventory
B. NON-CURRENT ASSETS
TOTAL ASSETS
A. LIABILITIES
I. Short-term debt
1. Short-term debt and loan
2. Taxes and amounts payable to the state
II. Long-term debt
1. Long-term debt and loan
2. Long-term provisions
B. EQUITY
TOTAL SOURCES
REPORT ON BUSINESS RESULTS
Unit: VND million 2015 2016
Net revenue
Cost of goods sold
Gross profit
Financial income
Financial expenses
Interest expenses
Selling expenses
General and administrative expenses
Net profit from business activities
Gross accounting profit before tax
Current corporate income tax expense
Deferred corporate income tax expenses
Profit after tax
STATEMENTS OF CASH FLOWS
Unit: VND million 2015 2016
I. Cash flow from business activities
Depreciation of fixed assets
Unrealized foreign exchange gain/loss
Net cash flows from operating activities
II. Cash flow from investment activities
Spending on procurement, construction of fixed assets and other
non-current assets
Net cash flows from investing activities
III. Cash flow from financial activities
Net cash flows from financing activities
Effect of exchange rate difference in foreign currency
Net cash flows during the year
Quoc Cuong Gia Lai Joint Stock Company
Appendix
Financial statements
Content is intentionally removed for demo purpose
139
BALANCE SHEET
Unit: VND million 2015 2016
A. CURRENT ASSETS
I. Cash and cash equivalents
II. Short-term financial investments
III. Short-term receivables
1. Customer receivables
IV. Inventory
B. NON-CURRENT ASSETS
TOTAL ASSETS
A. LIABILITIES
I. Short-term debt
1. Short-term debt and loan
2. Taxes and amounts payable to the state
II. Long-term debt
1. Long-term debt and loan
2. Long-term provisions
B. EQUITY
TOTAL SOURCES
REPORT ON BUSINESS RESULTS
Unit: VND million 2015 2016
Net revenue
Cost of goods sold
Gross profit
Financial income
Financial expenses
Interest expenses
Selling expenses
General and administrative expenses
Net profit from business activities
Gross accounting profit before tax
Current corporate income tax expense
Deferred corporate income tax expenses
Profit after tax
STATEMENTS OF CASH FLOWS
Unit: VND million 2015 2016
I. Cash flow from business activities
Depreciation of fixed assets
Unrealized foreign exchange gain/loss
Net cash flows from operating activities
II. Cash flow from investment activities
Spending on procurement, construction of fixed assets and other
non-current assets
Net cash flows from investing activities
III. Cash flow from financial activities
Net cash flows from financing activities
Effect of exchange rate difference in foreign currency
Net cash flows during the year
Phat Dat Real Estate Development JSC
Appendix
Financial statements
Content is intentionally removed for demo purpose

140
BALANCE SHEET
Unit: VND million 2015 2016
A. CURRENT ASSETS
I. Cash and cash equivalents
II. Short-term financial investments
III. Short-term receivables
1. Customer receivables
IV. Inventory
B. NON-CURRENT ASSETS
TOTAL ASSETS
A. LIABILITIES
I. Short-term debt
1. Short-term debt and loan
2. Taxes and amounts payable to the state
II. Long-term debt
1. Long-term debt and loan
2. Long-term provisions
B. EQUITY
TOTAL SOURCES
REPORT ON BUSINESS RESULTS
Unit: VND million 2015 2016
Net revenue
Cost of goods sold
Gross profit
Financial income
Financial expenses
Interest expenses
Selling expenses
General and administrative expenses
Net profit from business activities
Gross accounting profit before tax
Current corporate income tax expense
Deferred corporate income tax expenses
Profit after tax
STATEMENTS OF CASH FLOWS
Unit: VND million 2015 2016
I. Cash flow from business activities
Depreciation of fixed assets
Unrealized foreign exchange gain/loss
Net cash flows from operating activities
II. Cash flow from investment activities
Spending on procurement, construction of fixed assets and other
non-current assets
Net cash flows from investing activities
III. Cash flow from financial activities
Net cash flows from financing activities
Effect of exchange rate difference in foreign currency
Net cash flows during the year
Binh Duong Construction and Development JSC
Appendix
Financial statements
Content is intentionally removed for demo purpose
REPORT DISCLAIMER
REPORT DISCLAIMER
This document has been prepared in good faith on the basis of information available at the date of publication without any
independent verification. VIRAC has produced this report for private circulation to professional clients only. All information and
statistical data herein have been obtained from sources we believe to be reliable and made to ensure the accuracy of the contents of
the pages of the report at the time of preparation. Such information has not been independently verified and VIRAC makes no
representation or warranty, whether express or implied, of any kind with respect to the document and its contents, information and
materials. The content found in this report is proprietary to VIRAC and is provided solely for your personal and non-commercial use.
You agree that you will not use this report for any purpose that is unlawful and that you will not reproduce the report or redistribute it
outside your organisation, or place it on a website for public access without the express written permission of VIRAC.
SHOULD YOU NEED ANY ASSISTANCE, PLEASE CONTACT US:
VIETNAM INDUSTRY RESEARCH AND CONSULTANCY (VIRAC JSC.,)
6th Floor, Anh Minh Building, 36 Hoang Cau, O Cho Dua, Dong Da, Hanoi, Vietnam
Website: http://virac.com.vn/
Email: [email protected] | Tel: +84 463289520

Thank you !


