16


°
Hydrogen and Primary Productivity 115115
1.0 INTRODUCTION
Yellowstone National Park is a remarkable place to any visitor. The macro biota of flora and fauna are visible and ubiquitous. Even more amazing is the microbial world, with a wide diversity of life throughout Yellowstone’s extreme temperature gradient. In recent years, several new developments in microbial ecology, many developed from studies of Yellowstone hot springs, have allowed us to view the microbial world in an entirely new fashion. Traditional, culture-based techniques have been supplemented by new molecular techniques that allow for a better assessment of the nature of microbial communities in Yellowstone hot springs. In turn, these techniques have allowed us to ask and answer new questions. Important questions, for exam-ple, relate to the kinds of energy metabolisms that fuel these microbial communities; how the local geochemistry influences the make-up of microbial communities and vice versa; and how primary productivity—the conversion of carbon dioxide into biomass—occurs at high temperature, where photosynthesis is absent.
These questions also are essential in the consideration of what sparked life on early Earth, or potentially elsewhere in the universe. For life to thrive, basic, energetically favor-able metabolisms had to evolve based on the conditions that existed at the time. Early Earth’s hot, reducing condi-tion—with no oxygen and quantities of hydrogen—had to provide the energy needed for life to establish. Indeed, with new knowledge of volcanic activities spread across our solar system, the astrobiological implications for what kinds of chemistries and life are found in terrestrial hot springs has relevance to the search for life elsewhere. With a molecular approach, we examined several Yellowstone hot springs for the energetic basis that allows life to thrive above 70°C—the limit of photosynthesis, the mechanism responsible for most of Earth’s current primary productivity. This chap-ter explains how microbial community analysis can point to new understandings of the chemistry that underpins an ecosystem. By a molecular analysis in the Yellowstone geothermal ecosystem, with interpretation likely to other geo-hydrothermal ecosystems, we find that hydrogen is probably the dominant energy source.
2.0 YELLOWSTONE MICROBIAL ECOLOGY
Yellowstone’s geothermal springs, with their associated microbiotic complexity, are analogs of similar environments that occur worldwide. Yellowstone geothermal hot springs present the opportunity to observe different kinds of inter-faces between anoxic hydrothermal fluids and the oxic sur-face (Ball et al. 1998a, 1998b). Yellowstone geothermal ecosystems, like those of the Mid-Ocean Ridge, are poten-tial modern-day analogs of the oldest ecosystems on Earth, where primitive life may have arisen to form an ecosystem in high temperature environments.
Microbial communities associated with volcanic hot springs have attracted broad interest because of the unique ther-mophilic (heat-loving) properties of the organisms therein. Little attention has been given, however, to hot spring set-tings as whole microbial ecosystems. One fundamental consideration for any ecosystem is the energy budget—the contribution of different energy sources that fuel primary productivity. Most of Earth’s biomass is the product of pho-tosynthetic energy, but at temperatures higher than ~70°C photosynthesis is not known to occur. Nonetheless, robust microbial communities develop in some of the earth’s hot springs to 110–120°C (Brock 1967, 1978; Jannasch 1985; Jannasch and Mottl 1985; Madigan et al. 2003). Con-sequently, high-temperature primary productivity must derive from chemolithotrophy—the production of biomass with the use of reduced inorganic energy sources such as sulfide, reduced metals, and molecular hydrogen (H2)—or organic sources such as light hydrocarbons (methane and others). Many microorganisms with various chemolithotro-phic metabolisms have been cultured from hot spring com-munities using hydrogen and sulfide as an electron donor, but the relative contributions of different potential energy sources to particular ecosystems have not been systemati-cally addressed (Huber et al. 1989, 1992, 1995, 1998; Rey-senbach et al. 2000a, 2000b; Norris et al. 2002).
We propose that one way to gain insight into the relative contributions of potential energy sources available to micro-bial habitats is by assessment of the relative abundances of the organisms that comprise the communities. Microorgan-

116 GEOTHERMAL BIOLOGY AND GEOCHEMISTRY IN YELLOWSTONE NATIONAL PARK
isms that engage in primary productivity would presumably be the most abundant in any ecosystem, as is the case with large organisms in terrestrial ecosystems (Begon et al. 1996). If the relative abundances of particular physiological types reflect the relative amounts of different energy sources used for primary productivity, then a census of the physiologies that comprise a microbial community would correspond to a biological assessment of the energy demands of the par-ticular ecosystem. Such a census cannot be achieved with culture-based methods because most naturally occurring microbes resist cultivation by standard techniques (Amann et al. 1995). With the advent of molecular techniques for the phylogenetic identification of organisms without the resort to culture, the relative abundances of microbial com-munity constituents can now be determined.
In the most commonly employed molecular analysis of microbial community composition without culture, small subunit ribosomal RNA (SSU rRNA) genes are amplified by polymerase chain reaction (PCR) from natural com-munity DNA using universally conserved sequences as priming sites, then cloned and sequenced for phylogenetic identifications. The collection of rRNA gene sequences approximates a census of the local phylogenetic types of organisms—the “phylotypes”—that comprise the com-munity. If the phylotypes fall into relatedness groups with predictable forms of energy metabolism based on cultured representatives, the probable energy sources for the envi-ronmental organisms can be inferred.
Microbial communities associated with high-temperature hot springs in Yellowstone National Park and elsewhere have been analyzed using culture-independent methods. One unexpected finding of all studies has been the abun-dant occurrence of microorganisms of the Aquificales bacterial phylogenetic division (Reysenbach et al. 1994; Huber et al. 1998; Hugenholtz et al. 1998a; Skirnisdottir et al. 2000; Blank et al. 2002). Although sulfur metabo-lism is commonly cited as a main source of energy in these environments, all known representatives of Aquificales mainly utilize H2 as an energy source. This dominance of Aquificales representatives suggests that H2 may be the main energy source for primary productivity in these hot spring ecosystems.
Hydrogen had not been measured previously in the Yellowstone geothermal system, however, and only a few hot spring communities have been phylogenetically analyzed, with limited variation in the chemical composition of the settings. To further assess the energetic fuels that support Yellowstone hot spring communities, we have conducted extensive further phylogenetic analyses of Yellowstone com-munities in different chemical settings (Spear et al. 2005). In parallel, we determined the chemical compositions of the hot springs, including the first widespread measurements of molecular hydrogen in the Yellowstone hydrothermal sys-tem. We then used thermodynamic modeling based on the chemistries to evaluate the bioenergetic underpinnings of the hot spring communities.
3.0 MATERIALS AND METHODS
3.1 Sample Collection and DNA Extraction
The analysis of microbial communities using molecular phylogenetic methods begins with sampling and storage. It is critical that samples be frozen or otherwise preserved (e.g. formaldehyde, ethanol immersion) to prevent alterations in community structure due to deterioration and selec-tive growth of some organisms. For our studies, samples for DNA extraction were collected from individual source springs by several methods, dependent on the nature of the spring. In some springs, sediments were collected and fro-zen in cryovials on liquid nitrogen in the field and stored at -80°C in the lab. In others, glass growth slides (plain micro-scope slides) were hung in a spring for periods of time rang-ing from days to months. Biofilms can then be scraped from the slides in the field, collected in cryovials, and frozen on liquid nitrogen. For this study, samples for analyses were collected in different seasons from 1999 to 2003.
Total community DNA can typically be obtained and pre-pared from ~1 g of the frozen samples as described (Dojka et al. 1998). Extraction of DNA from the thawed environ-mental sample is accomplished by some combination of physical and/or chemical disruption of the cells, such as mechanical beating with zirconium (glass) beads to dis-integrate tough communities embedded in a soil or rock matrix. The homogenized sample is then usually subjected to extraction with phenol chloroform followed by precipi-
Hydrogen and Primary Productivity 117117
tation with alcohol in the presence of high salt. The DNA can be further purified to remove salts and any compounds that may inhibit PCR, such as humic compounds that com-monly co-purify with DNA from, for example, soil (Barns et al. 1994). Extracted DNA is then run down a 1% agarose gel to check for both positive extraction and purity.
3.2 PCR Amplification of rDNA
This environmental DNA is used as a template for PCR amplification of SSU rRNA genes (16S for bacteria and archaea, 18S rRNA genes for many eucarya). The choice of PCR primer pairs determines the specificity of any search for diversity. If universally conserved primers are used, genes belonging to organisms from all three domains of life are amplified. Generally, researchers choose either universal primer pairs, or primer pairs tailored to amplify sequences of specific microbial domains, divisions, or taxa. For this study, initial PCR amplifications of environmental DNAs were done with the universal SSU rRNA degenerate primers 515F—5ʹGTGCCAGCMGCCGCGGTAA3ʹ and 1391R—5ʹGACGGGCGGTGWGTRCA3ʹ (Lane 1991). Full-length bacterial rRNA gene sequences were obtained with the PCR primers 8F (27F)—5ʹAGAGTTT-GATCCTGGCTCAG3ʹ and 1492R—5ʹGGTTACCTT-GTTACGACTT3ʹ (Lane 1991). Archaeal libraries were constructed from the use of the PCR priming pairs 4Fa—5ʹTCCGGTTGATCCTGCCRG3ʹ or 333Fa—5ʹTCCAGGCCCTACGGG with 1391R (Lane 1991).
To maximize the representation of environmental rDNA sequences amplified in PCR, an annealing temperature gradient was used to find an optimal annealing temper-ature—one that gives a strong PCR product visualized with gel electrophoresis—which was ~55oC for most primer pair combinations. All PCR reactions using these primer pairs were incubated in an Eppendorf gradient thermocycler at 94oC for 2 min, followed by 29 cycles at 94oC for 30 sec, 55.5oC for 1 min, and 72oC for 1.5 min, followed by a 72oC step for 12 minutes. Each 25-μL reac-tion contained 30 mM Tris (pH 8.4), 50 mM KCl, 1.5 mM MgCl2, 0.05% BSA (Sigma), 1M betaine, 0.2 mM of each dNTP, 50 ng of each oligonucleotide primer, 0.5 units of Taq Polymerase, and approximately 600 ng of environmental DNA template.
3.3 Cloning and Sequence Analysis
PCR reactions were analyzed on a 1% agarose gel to check for amplification. Positive PCR reactions were gel-puri-fied using a Qiagen Gel Extraction Kit (Qiagen Inc.) as per kit instructions. Before cloning, 30 μL of gel-puri-fied PCR product was incubated with 2 μL of dNTPs for 20 min at 72oC in 1X buffer with 1.5 mM MgCl2. Reac-tions were cloned with the TOPO TA Cloning Kit for Sequencing (Invitrogen) as per kit instructions. Unique recombinant clones were determined using the restriction fragment length polymorphism (RFLP) analysis (Dojka et al. 1998). PCR products were cut with HinP1 and Msp1 restriction endonucleases for a minimum of three hours, moist, at 37oC. Sequencing reactions were prepared with the DYEnamic ET Terminator Cycle Sequencing Kit (Amersham Biosciences) and sequenced on a Mega-BACETM 1000 DNA Sequencing System (Amersham Biosciences) in 96-well format. Unique sequences were assembled and put through the Basic Local Alignment Search Tool (BLAST) algorithm (Altschul et al. 1997) at the NCBI BLAST website (http://www.ncbi.nlm.nih.gov/blast) to determine approximate phylogenetic posi-tion, using XplorSeq 2.0, an in-house software package developed by Dr. Daniel Frank.
3.4 Phylogenetic Analysis
Chimeric sequences were identified using secondary-structure analyses and the CHECK_CHIMERA soft-ware program of the Ribosomal Database Project (Maidak et al. 2001). Sequences that showed ≥99% identity to com-mon contaminants of rRNA-based molecular surveys were excluded from further analyses (Tanner et al. 1998). The remaining environmental rRNA gene sequences were then aligned to other known SSU rRNA sequences using the ARB database of more than 25,000 SSU rRNAs in the ARB software package (http://arb-home.de) followed by phylogenetic analysis with version 4.0b8 of PAUP* (Swofford 2001). Sequence alignments used in phyloge-netic analysis were minimized/masked using the Lane mask that cuts off hypervariable regions of the SSU rRNA alignment from the analysis. A total of 1334 homolo-gous nucleotide positions were included in the alignments for phylogenetic analyses (Lane 1991). Phylogenetic
118 GEOTHERMAL BIOLOGY AND GEOCHEMISTRY IN YELLOWSTONE NATIONAL PARK
relationships were tested using reference taxa from the cur-rently described taxa in the literature. Heuristic searches were performed using evolutionary distance, maxi-mum-parsimony (nreps = 100 or 200) and maximum- likelihood (nreps = 1 or 10) analyses on the alignments to find the best tree possible as previously described (Barns et al. 1994). Distance and maximum-parsimony analyses were conducted by PAUP*.
3.5 Molecular Methodology Notes
The molecular assessment of microbial communities is sus-ceptible to errors at several steps in the process, which can result in skewed community descriptions. For instance, DNA from different organisms may be differentially extracted. Microbes in spore stages or ensheathed in polysaccharides may not be extracted as readily as free-living vegetative cells. PCR primer bias is always a concern and steps can be taken to reduce this source of bias (Polz and Cavanaugh 1998). The choice of primer pairs, the reaction conditions (Mg2+ concentration, annealing temperature), and additives (aceti-mide, betaine, bovine serum albumen) all may influence the composition of the reaction products. Steps to reduce bias prior to cloning include varying the reaction conditions in multiple replicate reactions and keeping the PCR cycle-number low. PCR products generated under different con-ditions can be pooled prior to cloning. The type of cloning vector may select particular products preferentially, and the use of several different vectors is advisable. Despite these potential sources of error, there is generally good agreement between the distribution of organisms in clone libraries and their abundance in the environment where it is possible to assess them (Pace 1997). In any case, analysis of phylo-type libraries remains far and away the most comprehensive method available for community analysis.
For applied examples of these molecular methodologies in various environments consider the following refer-ences (Barton et al. 2001; Blank et al. 2002; Dawson and Pace 2002; de la Torre et al. 2003; DeLong 1992; Dojka et al. 1998; Frank et al. 2003; Hugenholtz and Pace 1996; Hugenholtz et al. 1997, 1998a, 1998b; Pace 1997, 1999, 2001; Reysenbach and Cady 2001; Reysenbach et al. 1992, 1994, 1998, 2000a, 2000b; Spear et al 2002, 2003, 2005; Ward et al. 1990a, 1990b, 1997).
3.6 Hydrogen and Water Chemistry
For this study we measured the distribution of aqueous H2 concentrations in Yellowstone waters (hot springs, streams, geothermal vents, and a well; Spear 2002) with a modified bubble-stripping method (Chapelle et al. 1997). In this method, water is pumped through a chamber that contains an introduced atmospheric gas bubble. The gases dissolved in the water equilibrate with the gas bubble, and the bubble is removed for analysis. Source waters were pumped through insulated H2-impermeable tubings for 20 minutes at a flow rate of 200 mL/min with a 12-V powered Masterflex peri-staltic pump (Cole-Parmer) through a 250 mL glass bot-tle bubble stripping device (Chapelle et al. 1997). A 20 mL atmospheric air bubble was introduced into the bottle after filling completely with the source water to be measured. The temperature of the bubble was measured by a thermis-tor attached to a digital thermometer (Cole-Parmer). Bub-bles were collected with an airtight syringe and transferred to nitrogen charged H2-impermeable glass septum vials and sent to Microseeps Inc. (http://www.microseeps.com) for analysis of H2, CH4, CO2, and light hydrocarbons on a Trace Analytical RGA3 reduction gas analyzer (Chapelle et al. 1997).
Henry’s Law describes the ratio of the aqueous-phase con-centration of a gas to its equilibrium partial pressure in the gas phase alone. The temperature effect on Henry’s constant is relatively small for most gases. However, for hydrogen, Henry’s constant decreases by 28% from 0oC to 100oC. To adjust for equilibrium partial pressure at ele-vated temperature, and thus consider actual aqueous H2 concentrations in hot springs, we used Henry’s Law:
CW = CGHC (1)
where CW is the concentration of the gas in the water, CG is the concentration (partial pressure) of the gas in the bubble, and HC is Henry’s constant for that gas, which is the solu-bility of a gas at a given temperature. Henry’s constant is typically measured, but can also be estimated. There were no values of HC available for H2 at the high temperature of the hot springs, so we estimated HC with Ostwald’s expression:
HC = PH2 /RTCW (2)

Hydrogen and Primary Productivity 119119
where PH2 is 1.22 x 10⁻⁵ atm, R is the gas constant (0.0821 L atm mol-1 K-1), T is the measured bubble temperature in Kelvin, and CW is 1x10⁻⁸ mol/L. Values reported in this study reflect this temperature correction.
Sulfide measurements were conducted at each location with a CHEMetrics colorimetric assay (CHEMetrics Inc.). Samples for water chemistry were collected by pump-ing water out of each spring, filtered by syringe through a 0.2 μm filter, and acidified with ultra pure nitric acid (Sigma). Samples were held at 4oC until analysis. Anions, cations, and elemental analyses were conducted in the Laboratory for Environmental and Geological Studies of the Geology Department at CU-Boulder on a Dionex Series 4500I Ion Chromataograph, ARL 3410+ Induc-tively Coupled Plasma Atomic Emission Spectrometer, and a Varian Inductively Coupled Plasma Mass Spectrom-eter as per standard methods.
3.7 Thermodynamic Modeling
The amounts of chemical energy available from litho-autotrophic reactions were quantified using the equation:
ΔGR = ΔGRo + RT ln Qo (3)
where ΔGR is the Gibbs energy of the metabolic reaction, ΔGR
o is the standard Gibbs energy of the reaction, and Q is the activity quotient of compounds involved in the reac-tion. Values of ΔGR
o were calculated with the computer program SUPCRT92 and thermodynamic data contained therein ( Johnson et al. 1992). Values of Q were deter-mined with the measured composition of hot spring flu-ids. Because these are dilute solutions, activity coefficients were assumed equal to one for all dissolved compounds. Distributions of dissolved CO2 and sulfide were calculated from the measured concentrations of these compounds, together with appropriate dissociation constants and the measured pH, assuming the species were in equilibrium.
4.0 RESULTS AND DISCUSSION
4.1 Microbial Diversity of Yellowstone Hot Springs
Despite the often daunting complexity and diversity of micro-bial communities, their composition presumably reflects the energy sources available. In the case of the Yellowstone hot
springs, at temperatures >70oC, above the photosynthetic limit, the composition of the microbial communities led to a fundamental insight about the principal driver of hot spring ecosystems at the anoxic-oxic boundary. Popular attention had focused on the oxidation of sulfur compounds (e.g. sulfide) as a main source of energy for these commu-nities. Therefore it was a surprise when a few phylogenetic analyses of microbes in Yellowstone and other hot springs above 70oC indicated that molecular hydrogen, not sulfur, may be the primary source of energy in these hot spring environments. The importance of hydrogen in this ecosys-tem follows from observations that the dominant masses of organisms in >70oC Yellowstone hot spring communities are representatives of the bacterial divisions Aquificales and Thermotogales (Reysenbach et al. 1994; Hugenholtz et al. 1998a, 1998b; Blank et al. 2002). Cultivated representatives of Aquificales, e.g., Thermocrinis ruber, isolated from Octo-pus Spring mainly thrive by microaerophilic oxidation of H2 at high temperatures (Huber et al. 1995, 1998). In Octopus Spring, >80% of the rRNA gene sequences obtained were associated phylogenetically with Aquificales. In Obsidian Pool, 30% of the gene sequences were representatives of this phylogeny. Most of the cloned rRNA gene sequences from other sites examined also grouped phylogenetically with Aquificales.
To expand the survey of the organisms that comprise the Yellowstone hot spring communities, we undertook a molecular phylogenetic analysis of several Yellowstone hot springs that had not been characterized (Spear et al. 2005). We looked at hot springs with a spectrum of sul-fide concentrations—from very high, >200 μM (Wash-burn Spring area) to very low, near zero (a West Thumb area spring). We also conducted analyses of hot springs with high (>300 nM) and low (<15 nM) H2 concentra-tions. Figure 1 (next page) shows results from two loca-tions with associated phylogenetic and relevant chemical analyses. Lower Washburn Spring, Figure 1A, is a loca-tion with some of the highest measured concentrations of sulfide in the Park. Figure 1B shows an unnamed pool in the West Thumb Region that has no detectable aqueous sulfide, and approximately the same H2 concentration as Lower Washburn Spring. Clone libraries from both pools are dominated by phylotypes of the kinds that thrive on

120 GEOTHERMAL BIOLOGY AND GEOCHEMISTRY IN YELLOWSTONE NATIONAL PARK
the oxidation of molecular hydrogen. Thus, hydrogen as
a dominant energy source is indicated by the kinds of
microbiota detected (Spear et al. 2005).
The total phylogenetic distribution of rRNA genes ampli-
fied with the use of universal PCR primers from five hot
springs in Yellowstone are shown in Figure 2A. The figure
provides some perspective on the overall microbial organ-
ismic composition of the Yellowstone geothermal ecosys-
tem. Each of the hot spring communities was dominated
by bacteria, which typically comprised >95% of the rRNA
genes obtained from community DNA. Archaea are pop-ularly considered to be particularly conspicuous in geo-thermal and other “extreme” environments, but these and all previous rRNA gene surveys indicate that such organ-isms are, in fact, generally not more abundant than bacteria (Hugenholtz et al. 1998b). Most of the archaeal sequences encountered were related to environmental crenarchaeote sequences previously observed in Obsidian Pool (Barns et al. 1994, 1996a, 1996b), none with a specific relationship, (i.e., >97% similarity) to a cultured organism (Spear et al. 2005, Figure 2B).
Figure 1B. Unnamed Pool, West Thumb Region. Pool is: 88ºC; pH = 5.5; 16 nM in H2 ; non-detectable in H2S; 16.8 μM in arsenic. Pie chart results are from an examination of 96 clones of PCR priming pair 8F and 1492R.
92%
8%
Aquificales; EM-17 Thermotogales; EM-3
Aquificales; EM-17 Thermotogales; EM-3
Results are from an examination of 192 Clonesof PCR Priming Pair 8F & 1492R
76%
3%
12%
3% 3% 3%
Aquificales; HydrogenothermusAquificales; Hydrogenobacter; T. ruber sp.Thermodesulfobacteria; GeothermobacteriumThermotogales; EM-3OD-1Delta-Proteobacteria; Syntrophobacter
Figure 1A. Lower Washburn Spring, Canyon Region. Pool is: 86°C; pH = 6.2; 19 nM in H2; 167 μM in H2S. Pie chart results are from an examination of 192 clones of PCR priming pair 8F and 1492R.
Aquificales; HydrogenothermusAquificales; Hydrogenobacter; T.ruber sp.Thermodesulfobacteria; GeothermobacteriumThermotogales; EM-3OD-1Delta-Proteobacteria; Syntrophobacter

Hydrogen and Primary Productivity 121121
4.2 Hydrogen in Yellowstone Hot
Springs
Molecular hydrogen is a highly versatile energy source. It is the most abundant ele-ment in the universe and also has the high-est electron donation potential. Indeed, earliest life likely utilized H2 as a primary energy source (Morita 1999). Organisms in general that can gain energy by the use of hydrogen as an electron donor include photolithoautotrophs, photolithohetero-trophs, chemolithoautotrophs, and chemo-lithoheterotrophs. The electron acceptors for metabolism can be oxygen, nitrate, sulfate, and carbon dioxide. In addition, various ele-ments such as sulfur, manganese, and iron, can all serve as electron acceptors in hydro-gen oxidation. Hydrogen, however, is not the sole electron donor in the Yellowstone geothermal ecosystem. Hydrogen sulfide, popularly considered the dominant elec-tron donor, is certainly present in several hot springs, and sulfur-oxidizing organisms are readily cultured from hot springs. None-theless, in clone libraries from >70oC hot springs, rRNA sequences from organisms of the kinds that metabolize hydrogen sul-fide, thiosulfate, or elemental sulfur are not numerically conspicuous and, when found, are spring-dependent, i.e., geochemically dependent (Skirnisdottir et al. 2001; Norris et al. 2002; Figure 1A-B). In the Yellowstone geothermal waters above 70oC that we tested, the springs with the most micro-bial biomass have relatively low sulfide con-centrations. Conversely, hot springs with abundant sulfide tend to have relatively low biomass (Barns et al. 1994, 1996a, 1996b; Hugenholtz et al. 1998a, 1998b).
What is the source of the hydrogen in hot springs? Apps and van de Kamp (1993) have reviewed the nature of hydrogen and
Thermus/Deinococcus 5%
Thermodesulfobacter 2%
Thermotogales; EM-3 2%
Bacteria; Novel Group 5%
Delta-Proteobacteria 2% Alpha-Proteobacteria 2%
Archaea 2%
Hydrogenothermus 2%Hydrogenobaculum 1%
Aquificales;Hydrogenobacter
77%
Figure 2A. Pooled Universal Libraries
Euryarchaeota; SAGMEG-14%
Crenarchaeota;Novel Group
10%
Crenarchaeota;Novel Group(OPA-Like)
11%
Crenarchaeota; C1c 12% Crenarchaeota; OPA-2 15%
Euryarchaeota;Archaeoglobus 6%
Euryarchaeota; FCG-1 1%
Crenarchaeota; C2 17%
Euryarchaeota; Thermoplasma 7%
Korarchaeota 5%Crenarchaeota;
Thermoproteales2%
Crenarchaeota;OPA-4 10%
Figure 2B. Pooled Archaeal Libraries
Figure 2. Cumulative rRNA gene analyses. A. Distribution of sequences by phylogenetic group as identified with ARB and PAUP. Universal PCR Primers (515F and 1391R) were used with environmental DNA templates from five hot springs and resultant sequences were compiled for the assemblage. 5% of the sequences are from one potentially new candidate bacterial division encountered in this study. B. Distribution of archaeal sequences in three hot springs with two archaeal-specific PCR primer pairs. The majority, 77% of the sequences, are identified as crenarchaeotes. 18% fall within Euryarchaeota, and 5% within Korarchaeota. Abbreviations: OPA-2, OPA-4 and OPA-like represent environmental DNA sequences from a previous study of Obsidian Pool (Barns et al. 1996); FCG-1 represent sequences from marine/hydrothermal vent benthic archaea; and SEGMEG-1 represent sequences from deep South African mines. )From Spear et al. 2005.)
122 GEOTHERMAL BIOLOGY AND GEOCHEMISTRY IN YELLOWSTONE NATIONAL PARK
methane from subsurface environments and list several potential processes for the generation of H2. Although subject to debate, Stevens and McKinley proposed that water reacts with iron-rich Columbia River basalt (CRB) to produce molecular hydrogen at concentrations as high as 60 μM (Stevens and McKinley 1995, 1996; Lovley and Chapelle 1996; Madsen 1996; Anderson et al. 1998). Later work in the CRB has showed that hydrogen pro-duction can average 5 nmol of H2 (m
2 of basalt)-1day-1—sufficient to support observed concentrations of methane produced by microbes in the CRB (Stevens and McKinley 2000). In the case of Obsidian Pool, the sediment is rich in reduced iron (at >15 g/kg) that could react with the water
to produce abiogenic hydrogen (Hugenholtz et al. 1998b).
In the case of geothermal waters with low iron content
such as Octopus Spring, the specific chemical source of H2
is in the subsurface and not known. Regardless of source,
and in the presence of a strong metabolic electron accep-
tor like oxygen, bulk aqueous phase H2 is likely to serve as
the main electron donor for naturally occurring microbial
communities in geothermal springs >70oC.
Hydrogen concentrations had not been measured exten-
sively in Yellowstone hot springs primarily because
hydrogen concentrations in water are difficult to assess.
Hydrogen has a solubility of 1.69 mL/100 mL of water
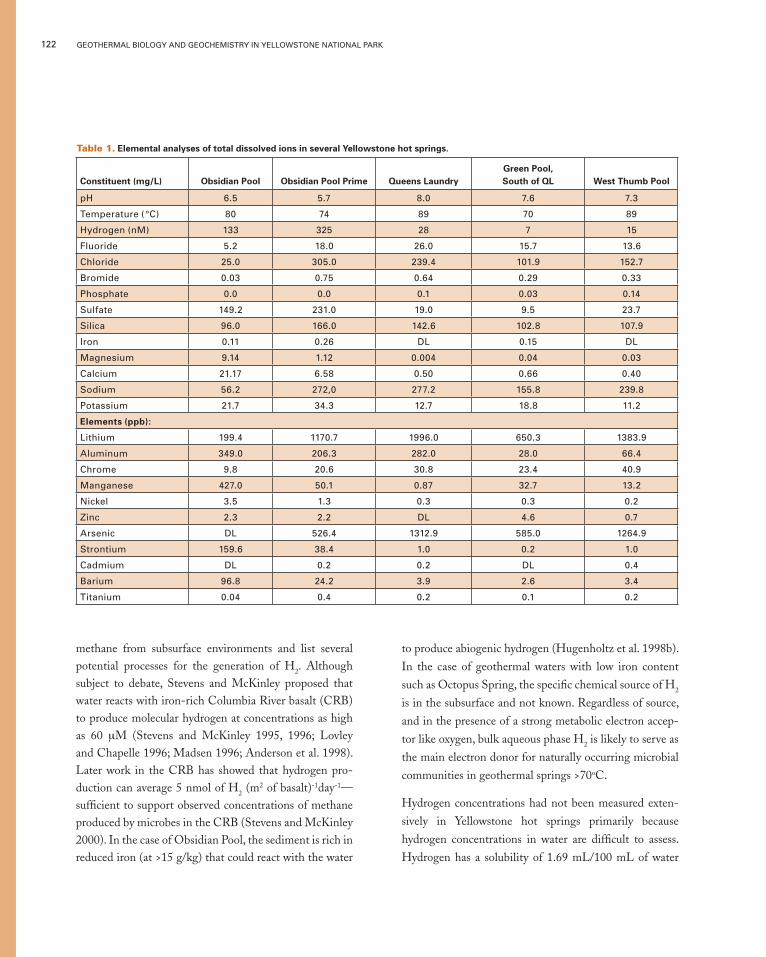
Table 1. Elemental analyses of total dissolved ions in several Yellowstone hot springs.
Constituent (mg/L) Obsidian Pool Obsidian Pool Prime Queens LaundryGreen Pool,South of QL West Thumb Pool
pH 6.5 5.7 8.0 7.6 7.3
Temperature ( °C) 80 74 89 70 89
Hydrogen (nM) 133 325 28 7 15
Fluoride 5.2 18.0 26.0 15.7 13.6
Chloride 25.0 305.0 239.4 101.9 152.7
Bromide 0.03 0.75 0.64 0.29 0.33
Phosphate 0.0 0.0 0.1 0.03 0.14
Sulfate 149.2 231.0 19.0 9.5 23.7
Silica 96.0 166.0 142.6 102.8 107.9
Iron 0.11 0.26 DL 0.15 DL
Magnesium 9.14 1.12 0.004 0.04 0.03
Calcium 21.17 6.58 0.50 0.66 0.40
Sodium 56.2 272,0 277.2 155.8 239.8
Potassium 21.7 34.3 12.7 18.8 11.2
Elements (ppb):
Lithium 199.4 1170.7 1996.0 650.3 1383.9
Aluminum 349.0 206.3 282.0 28.0 66.4
Chrome 9.8 20.6 30.8 23.4 40.9
Manganese 427.0 50.1 0.87 32.7 13.2
Nickel 3.5 1.3 0.3 0.3 0.2
Zinc 2.3 2.2 DL 4.6 0.7
Arsenic DL 526.4 1312.9 585.0 1264.9
Strontium 159.6 38.4 1.0 0.2 1.0
Cadmium DL 0.2 0.2 DL 0.4
Barium 96.8 24.2 3.9 2.6 3.4
Titanium 0.04 0.4 0.2 0.1 0.2

Hydrogen and Primary Productivity 123123
at 27oC, can react with several metals, and can molecu-larly diffuse through many materials. In ambient seawa-ter, hydrogen concentrations range from 0.2-1.5 nM at the surface to 0.2-0.4 nM in deep water (Winn et al. 1995). Measurements of hydrogen in Yellowstone hot springs indicate, however, the general presence of hydrogen in rel-atively high concentrations, from 10 to >300 nM (Spear et al. 2005). Along with hydrogen, anion, cation, and elemen-tal analyses are shown for a few Yellowstone hot springs in Table 1. For life to utilize H2, others have shown with both in situ sediments and cultured mesophilic, hydroge-notrophic methanogens, that approximately 4 nM con-centrations of H2 are sufficient to sustain growth (Lovley and Klug 1982; Lovley et al. 1982; Lovley 1985). Rates of growth per mole of H2 have been shown for some anaer-obes to be –5 to –6 kJ/mol H2 for cultivated homoaceto-gens and –9 to –12 kJ/mol H2 for methanogens (Conrad and Wetter 1990). Zinder (1993) notes that methanogens, and possibly most organisms, are energetically adapted to utilize the low nM levels of H2 in natural habitats.
4.3 Thermodynamic Modeling
We used thermodynamic models to test the efficacy of the potential energy sources available to the microbial commu-nities that we analyzed both phylogenetically and chemi-cally (Spear et al. 2005). Our thermodynamic calculations are based on the concentrations of dissolved constituents in the hot springs and the calculated free energies of reac-tion (kJ/mole electron or oxygen). Models show that dis-solved sulfide, methane, and H2 are the principal potential energy sources available to these communities through the processes of sulfide oxidation, methanotrophy, hydrogen oxidation, methanogenesis, and sulfate reduction. Based on the chemical compositions of the hot springs, relative potential energy yields of the available different chemical energy sources can be estimated. Based on complete oxi-dation of the available reduced compounds in the hydro-thermal fluids, sulfide, where available, would constitute the largest source of chemical energy, followed by meth-ane (where available) and hydrogen (data not shown). Although this might seem inconsistent at first with the apparent dominance of putative hydrogen-metabolizing
organisms, the most abundant potential energy source is not necessarily preferentially utilized.
Energetic comparisons for the complete oxidation of reduced compounds presume that sufficient O2 is available to consume all H2S, H2, and CH4 introduced into a hot spring. However, hot springs typically are low in O2 con-centration due to the highly reduced nature of the spring source waters and the poor solubility of atmospheric O2 in hot water (Ball et al. 1998a, 1998b). Diffusion of atmo-spheric O2 into a hot spring, therefore, is slow and unlikely to saturate all reductants simultaneously. Competition for O2 would limit consumption of reduced compounds, particularly in those parts of the springs that are in close proximity to the source of the reduced compounds. Con-sequently, in the case of hot springs it is more appropriate to compare the amount of metabolic energy available from oxygen-consuming reactions on the basis of the energy that can be obtained per mole of O2. In all hot springs ana-
OP8
Termite
groupI
ArchaeaAquificalesThe
rmodesu
lfobacte
rium
Thermotogale
sCoprothe
rmobacter
DictyoglomusOP9 ?
OP5
Green non-sulfur ?
Actinobacteria
WS1
OD1
OP10?
PlanctomycetesOP3
Chlam
ydiaVerrucom
icrobia
Nitrospira
OS-K Acidobacterium
Synergistes
Flexistipes
Cyanobacteria
LowG+
C gram
positiv
e
FibrobacterSR1
Marine group A
Green sulfur
CytophagalesThermus/Deinococcus
SpirochetesTM6
WS6TM
7
OP11
Fusobacteria
Proteobacteria
0.10
Figure 3.Bacteria, 2004
Known HydrogenOxidation
Changes per base
Figure 3. A graphical representation of the domain Bacteria. Thirty-eight bacterial divisions are represented of the at least 50 known. Width of wedges represent how many known sequences there are per division. Filled wedges have at least one known cultivar with known kinds of metabolisms/chemistries. Hollow wedges are known only by their phylotype, or environmental DNA sequence. Wedges in red depict bacterial divisions with known capability to oxidize molecular hydrogen.

124 GEOTHERMAL BIOLOGY AND GEOCHEMISTRY IN YELLOWSTONE NATIONAL PARK
lyzed, more energy is available from each mole of O2 for oxidation of H2 than for oxidation of sulfide or methane (Spear et al. 2005). Thus hydrogen oxidizers are expected to out-compete sulfide oxidizers and methanotrophs for available O2 under oxygen limiting conditions.
The occurrence of H2 at relatively high concentrations in high temperature Yellowstone hot springs supports the indication from the molecular phylogenetic work that molecular hydrogen is the driving energy source for most microbial life in these ecosystems. Hydrogen is ubiqui-tous in anoxic environments and is likely to be a utilizable energy source by many if not most microbes. Yet, remark-ably little is known about the distribution of hydrogen metabolism among all microbiota. Figure 3 is a phyloge-netic diagram of known bacterial diversity. As shown, only a handful of the fifty or more known phylogenetic divi-sions of Bacteria are known to metabolize hydrogen. How-ever, it is likely that representatives of most or all of these groups are capable of hydrogen metabolism. Laboratory experimentation with hydrogen-metabolizing organisms is technically a challenge and, therefore, has received rela-tively little attention. In Obsidian Pool, where the bulk of the biomass (dominant rRNA genes) appears to be com-posed of known hydrogen oxidizers, other organisms such as representatives of the Green nonsulfur bacterial division also are abundant (Hugenholtz et al. 1998b). The question is, are such organisms engaged in hydrogen oxidation?
4.4 Hydrogen in Other Environments
Gold (1992) has speculated about a “deep hot biosphere” on Earth, suggesting that hydrogen and/or light hydrocar-bons could serve as a source of energy in the subsurface. Gold maintains that H2 and CH4 should be chemically stable in the earth’s upper mantle, and that migration in the crust occurs continuously. In addition, it is known that thermodynamic control of hydrogen concentrations is exerted in anoxic sediments by pH, temperature, and the individual and combined effects of various terminal electron acceptors such as nitrate, sulfate, carbon dioxide, iron, and manganese. These can have order-of-magnitude effects on hydrogen concentrations in environmental set-tings, including the whole of the earth’s crust (Hoehler et al. 1998). There are, of course, many potential biogenic
sources of H2 in both oxic and anoxic environments that can be utilized by hydrogen metabolizers (for review see Nandi and Sengupta 1998).
Microbial mats are another ecosystem in which hydro-gen metabolism is emerging as a conspicuous theme, and some results may be applicable to geo-hydrothermal set-tings. Microbial mats are finely layered, highly structured, complex ecosystems that occur globally. They accommo-date a wide range of physiological types of organisms from oxygenic photosynthesizers to obligate anaerobes, all in close proximity. Complex community structure and spa-tial distribution are prevalent throughout examined mats. The specific microbes involved in the mats and the energy metabolisms that support them are relatively little under-stood and probably vary according to the local geochemical setting. Even in the case of photosynthetic microbial mats, hydrogen produced by metabolic processes that accompa-nies primary productivity influences individual microbial metabolisms and system-level biogeochemistry (Ward et al. 1998; Hoehler et al. 2001). Metabolic hydrogen is then available for hydrogen-based metabolisms of associated organisms that are supported only indirectly by photosyn-thesis. This hydrogen metabolism, in turn, strongly influ-ences the thermodynamics of the mat microenvironment and plays a major role to determine the kinds of organisms that can thrive in the community; for instance, anaerobic sulfate-reducing bacteria, archaeal methanogens, and bac-terial Green nonsulfur and Nitrospira members.
Other contributions in this symposium also demonstrate the importance of H2 in varied Yellowstone geochemical settings. These include acid-sulfate springs in the Norris Geyser Basin (Inskeep and McDermott, this volume) and alkaline siliceous springs in the Calcite Springs area (Rey-senbach et al., this volume).
5.0 CONCLUSIONS
This study of Yellowstone hot springs is a clear case in which inferences from phylogeny can drive hypotheses about the importance of specific sources of energy in an ecosystem (Spear et al. 2005). We used three lines of evi-dence to infer the main energetic basis for life in high
Hydrogen and Primary Productivity
temperature geothermal springs. The thermodynamic modeling links the phylogenetic and geochemical results to suggest that H2 is a dominant energetic theme in hot springs above the temperature limit for photosynthesis. In the phylogenetic surveys we conducted of five high-temperature Yellowstone hot springs, in both low and high-sulfide settings, the high number of Aquificales rep-resentatives was informative because all cultured members of the group have a very restricted physiology. Eventually entire environmental genomes will be available, and the presence or absence of metabolic genes will inform the physiological capacity of an entire community. As micro-bial ecology progresses, new revelations will emerge about the nature of life and the chemistries that fuel life.
ACKNOWLEDGMENTS
We thank the Yellowstone Center for Resources for years of continued access into the Yellowstone geothermal ecosystem. Support for this work has come from an NSF LExEn grant to N.P., an NSF Microbial Biology Postdoctoral Fellowship to J.S., and an Agouron Institute Postdoctoral Fellowship to J.S. Thanks to Montana State University and the Thermal Biology Institute for hosting the Geothermal Biology and Geochemistry in Yellowstone workshop.
REFERENCES
Altschul, S.F., T.L. Madden, et al. 1997. Gapped BLAST and PSI-BLAST: a new generation of protein database search programs. Nucl Acids Res 25:3389–3402.
Amann, R.I., W. Ludwig, et al. 1995. Phylogenetic identification and in situ detection of individual microbial cells without cultivation. Microbiol Rev 59:143–69.
Anderson, R.T., F.H. Chapelle, et al. 1998. Evidence against hydrogen-based microbial ecosystems in basalt aquifers. Science 281:976–7.
Apps, J.A., and P.C. van de Kamp. 1993. Energy gases of abiogenic origin in the Earth’s crust. The Future of Energy Gases. U.S. Geological Survey.
Ball, J.W., D.K. Nordstrom, K.M. Cunningham, M.A.A. Schoonen, Y. Xu, and J.M. Demonge. 1998a. Water-Chemistry and On-
Site Sulfur Speciation Data for Selected Springs in Yellowstone
National Park, Wyoming, 1994–1995. Boulder, CO: U.S. Geological Survey.
Ball, J.W., D.K. Nordstrom, E.A. Jenne, and D.V. Vivit. 1998b. Chemical Analyses of Hot Springs, Pools, Geysers, and Surface
Waters from Yellowstone National Park, Wyoming, and Vicinity,
1974–1975. Boulder, CO: U.S. Geological Survey.Barns, S.M., C.F. Delwiche, et al. 1996a. Phylogenetic perspective
on microbial life in hydrothermal ecosystems, past and present. Ciba Found Symp 202:24–32; discussion 32–9.
Barns, S.M., C.F. Delwiche, et al. 1996b. Perspectives on archaeal diversity, thermophily and monophyly from environmental rRNA sequences. Proc Natl Acad Sci 93:9188–93.
Barns, S.M., R.E. Fundyga, et al. 1994. Remarkable archaeal diversity detected in a Yellowstone National Park hot spring environment. Proc Natl Acad Sci 91:1609–13.
Barton, H.A., J.R. Spear, and N.R. Pace. 2001. Microbial life in the underworld: biogenicity, in secondary mineral formations. Geomicrobiol J 18:359–68.
Begon, M., J.L. Harper, et al. 1996. Ecology: Individuals, Populations
and Communities. Malden, MA: Blackwell Science Ltd.Blank, C.E., S.L. Cady, et al. 2002. Microbial composition of near-
boiling silica-depositing thermal springs throughout Yellowstone National Park. Appl Environ Microbiol 68:5123–35.
Brock, T.D. 1967. Life at high temperatures. Science 158:1012–19.Brock, T.D. 1978. Thermophilic Microorganisms and Life at High
Temperatures. New York: Springer-Verlag.Chapelle, F.H., D.A. Vroblesky, J.C. Woodward, and D.R. Lovley.
1997. Practical considerations for measuring hydrogen concen-trations in groundwater. Environ Sci Technol 31:2873–7.
Conrad, R., and B. Wetter. 1990. Influence of temperature on ener-getics of hydrogen metabolism in homoacetogenic, methano-genic, and other anaerobic bacteria. Arch Microbiol 155:94–8.
125

126 GEOTHERMAL BIOLOGY AND GEOCHEMISTRY IN YELLOWSTONE NATIONAL PARK
Dawson, S.C., and N.R. Pace. 2002. Novel kingdom-level eukaryotic diversity in anoxic environments. Proc Natl Acad Sci 99:8324–9.
de la Torre, J.R., B.M. Goebel, et al. 2003. Microbial diversity of cryptoendolithic communities from the McMurdo Dry Val-leys, Antarctica. Appl Environ Microbiol 69:3858–67.
DeLong, E. F. 1992. Archaea in coastal marine environments. Proc Natl Acad Sci 89:5685–9.
Dojka, M.A., P. Hugenholtz, et al. 1998. Microbial diversity in a hydrocarbon- and chlorinated-solvent- contaminated aquifer undergoing intrinsic bioremediation. Appl Environ Microbiol 64:3869–77.
Frank, D.N., G.B. Spiegelman, et al. 2003. Culture-independent molecular analysis of microbial constituents of the healthy human outer ear. J Clin Microbiol 41:295–303.
Gold, T. 1992. The deep hot biosphere. Proc Natl Acad Sci 89:6045–9.Hoehler, T.M., B.M. Bebout, et al. 2001. The role of microbial mats
in the production of reduced gases on the early Earth. Nature 412:324–7.
Hoehler, T.M., et al. 1998. Thermodynamic control on hydrogen concentrations in anoxic sediments. Geochim Cosmochim Acta 62:1745–56.
Huber, R., S. Burggraf, et al. 1995. Isolation of a hyperthermophilic archaeum predicted by in situ RNA analysis. Nature 376:57–8.
Huber, R., W. Eder, et al. 1998. Thermocrinis ruber gen. nov., sp. nov., A pink-filament-forming hyperthermophilic bacterium iso-lated from Yellowstone National Park. Appl Environ Microbiol 64:3576–83.
Huber, R., T. Wilharm, et al. 1992. Aquifex pyrophilus gen. nov. sp. nov., represents a novel group of marine hyperthermophilic hydrogen-oxidizing bacteria. Syst Appl Microbiol 15:340–51.
Huber, R., C.R. Woese, et al. 1989. Thermosipho africanus gen. nov., represents a new genus of thermophilic eubacteria within the “Thermotogales”. Syst Appl Microbiol 12:32–7.
Hugenholtz, P., B.M. Goebel, et al. 1998a. Impact of culture-inde-pendent studies on the emerging phylogenetic view of bacterial diversity. J Bacteriol 180:4765–74.
Hugenholtz, P., K.L. Hershberger, et al. 1997. Widespread distribu-tion of a novel phylum-depth bacterial lineage in nature; abstract N-23. Abstracts of the 97th General Meeting, Ameri-can Society for Microbiology, Miami Beach.
Hugenholtz, P., and N.R. Pace. 1996. Identifying microbial diversity in the natural environment: a molecular phylogenetic approach. Trends Biotechnol 14:190–7.
Hugenholtz, P., C. Pitulle, et al. 1998b. Novel division level bacterial diversity in a Yellowstone hot spring. J Bacteriol 180:366–76.
Jannasch, H.W. 1985. The chemosynthetic support of life and the microbial diversity at deep-sea hydrothermal vents. Proc Roy Soc London B225:277–97.
Jannasch, H.W., and M.J. Mottl. 1985. Geomicrobiology of deep-sea hydrothermal vents. Science 229:717–25.
Johnson, J.W., E.H. Oelkers, et al. 1992. SUPCRT92: A software package for calculating the standard molal thermodynamic properties of minerals, gases, aqueous species, and reactions from 1 to 5000 bar and 0 to 1000C. Comp Geosci 18:899–947.
Lane, D.J. 1991. 16S/23S rRNA sequencing. In Nucleic acid techniques in bacterial systematics, ed. E. Stackebrandt and M. Goodfellow, 115–75. New York: John Wiley and Sons.
Lovley, D.R. 1985. Minimum threshold for hydrogen metabolism in methanogenic bacteria. Appl Environ Microbiol 49:1530–1.
Lovley, D.R., and F.H. Chapelle. 1996. Hydrogen-based microbial ecosystems in the Earth. Science 272:896.
Lovley, D.R., and M.J. Klug. 1982. Intermediary metabolism of organic matter in the sediments of a eutrophic lake. Appl Envi-ron Microbiol 43:552–60.
Lovley, D.R., D.F. Dwyer, and M.J. Klug. 1982. Kinetic analysis of competition between sulfate reducers and methanogens for hydrogen in sediments. Appl Environ Microbiol 43:1373–9.
Madigan, M.T., J.M. Martinko, et al. 2003. Brock Biology of Microor-ganisms. Upper Saddle River, NJ: Prentice Hall.
Madsen, E.L. 1996. Hydrogen-based microbial ecosystems in the Earth. Science 272:896.
Maidak, B.L., J.R. Cole, et al. 2001. The RDP-II (Ribosomal Data-base Project). Nucl Acids Res 29:173–4.
Morita, R.Y. 1999. Is H(2) the Universal Energy Source for Long-Term Survival? Microbiol Ecol 38:307–20.
Nandi, R., and S. Sengupta. 1998. Microbial production of hydrogen: an overview. Crit Rev Microbiol 24:61–84.
Norris, T.B., J.M. Wraith, et al. 2002. Soil microbial community structure across a thermal gradient following a geothermal heating event. Appl Environ Microbiol 68:6300–9.
Pace, N.R. 1997. A molecular view of microbial diversity and the biosphere. Science 276:734–40.
Pace, N.R. 1999. Microbial ecology & diversity. ASM News 65:328–33.
Pace, N.R. 2001. The universal nature of biochemistry. Proc Natl Acad Sci 98:805–8.
Polz, M.F., and C.M. Cavanaugh. 1998. Bias in template-to-prod-uct ratios in multitemplate PCR. Appl Environ Microbiol 64:3724–30.
Reysenbach, A.-L., L.J. Giver, et al. 1992. Differential amplification of rRNA genes by polymerase chain reaction. Appl Environ Microbiol 58:3417–18.
Reysenbach, A.-L., G.S. Wickham, et al. 1994. Phylogenetic analysis of the hyperthermophilic pink filament community in Octopus Spring, Yellowstone National Park. Appl Environ Microbiol 60:2113–19.

Hydrogen and Primary Productivity 127
Reysenbach, A.-L., A.B. Banta, et al. 2000a. Microbial essentials at hydrothermal vents. Nature 404:835.
Reysenbach, A.-L., and S.L. Cady. 2001. Microbiology of ancient and modern hydrothermal systems. Trends Microbiol 9:79–86.
Reysenbach, A.-L., M. Ehringer, et al. 2000b. Microbial diversity at 83 degrees C in Calcite Springs, Yellowstone National Park: another environment where the Aquificales and “Korarchaeota” coexist. Extremophiles 4:61–7.
Reysenbach, A.-L., K. Longnecker, et al. 2000c. Novel bacterial and archaeal lineages from an in situ growth chamber deployed at a Mid-Atlantic Ridge hydrothermal vent. Appl Environ Microbiol 66:3798–806.
Skirnisdottir, S., G.O. Hreggvidsson, et al. 2000. Influence of sulfide and temperature on species composition and community structure of hot spring microbial mats. Appl Environ Microbiol 66:2835–41.
Skirnisdottir, S., G.O. Hreggvidsson, O. Holst, and J.K. Kristjans-son. 2001. A new ecological adaptation to high sulfide by a Hyrogenobacter sp. growing on sulfur compounds but not on hydrogen. Microbiol Res 156:41–7.
Spear, J.R., J.J. Walker, and N.R. Pace. 2002. A search for life in Yellowstone’s Well Y-7: portal to the subsurface. Yellowstone Science 10:15–21.
Spear, J.R., R.E. Ley, et al. 2003. Complexity in natural micro-bial ecosystems: the Guerrero Negro experience. Biol Bull 204:168–73.
Spear, J.R., J.J. Walker, et al. 2005. Hydrogen and bioenergetics in the Yellowstone geothermal ecosystem. Proc Natl Acad Sci 102:2555–60.
Stevens, T.O., and J.P. McKinley. 1995. Lithotrophic microbial ecosystems in deep basalt aquifers. Science 270:450–4.
Stevens, T.O., and J.P McKinley. 1996. Hydrogen-based microbial ecosystems in the Earth. Science 272:896–7.
Stevens, T.O., and J.P. McKinley. 2000. Abiotic Controls on H2 production from basalt—water reactions and implications for aquifer biogeochemistry. Environ Sci Technol 34:826–31.
Swofford, D.L. 2001. PAUP* Phylogenetic Analysis Using Parsimony (*and other methods). Sunderland, MA: Sinauer Assoc.
Tanner, M., B.M. Goebel, et al. 1998. Specific rDNA sequences from diverse environmental settings correlate with experimen-tal contaminants. Appl Environ Microbiol 4:3110–13.
Ward, D.M., M.J. Ferris, et al. 1998. A natural view of microbial biodiversity within hot spring cyanobacterial mat communities. Microbiol Mol Biol Rev 62:1353–70.
Ward, D.M., C.M. Santegoeds, et al. 1997. Biodiversity within hot spring microbial mat communities: molecular monitoring of enrichment cultures. Antonie Van Leeuwenhoek 71:143–50.
Ward, D.M., R. Weller, et al. 1990a. 16S rRNA sequences reveal numerous uncultured microorganisms in a natural community. Nature 345:63–5.
Ward, D.M., R. Weller, et al. 1990b. 16S rRNA sequences reveal uncultured inhabitants of a well-studied thermal community. FEMS Microbiol Rev 75:105–16.
Winn, C.D., J.P. Cowen, and D.M. Karl. 1995. Microbes in deep-sea hydrothermal plumes. In The Microbiology of Deep-Sea Hydrothermal Vents, ed. D.M. Karl, 255–74. Boca Raton, FL: CRC Press.
Zinder, S.H. 1993. Physiological Ecology of Methanogens. In Methanogenesis: Ecology, Physiology, Biochemistry & Genetics, ed. J.G. Ferry, 128–206. New York: Chapman & Hall.

128 GEOTHERMAL BIOLOGY AND GEOCHEMISTRY IN YELLOWSTONE NATIONAL PARK


![CCCC----19119919 &É Û%Ê'22 /õ 5 %Ê'2 B Ý Ì i&É Û%Ê'22 /õ … · ] ' ] ] ' ' ] 'CCCC----19119919 &É Û%Ê'22 /õ 5 %Ê'2 B Ý Ì i&É Û%Ê'22 /õ 5 %Ê'2 B Ý Ì i ¹](https://static.documents.pub/doc/80x56/5b0d917f7f8b9a952f8db035/cccc-19119919-22-5-2-b-i-22-cccc-19119919-22-5.jpg)


![ç U ã è i u ¨ ê 8 7 y ¼...2018/04/05 · ® Ü d ã è i v o O q | ã è i ê 8 ç v u # ê ` f ^ s W ] Á É \ q O d } ª ê 8 y 2 Ç ê 8 Î < . Ç ê 8 ã è i è Q j v C](https://static.documents.pub/doc/80x56/5f72faa75824c37aaa3df21c/-u-i-u-8-7-y-20180405-oe-d-i-v-o-o-q-.jpg)

![Ê V>`i ÞÊ-Ì>Ìi v Ì i -V i ViÊ viÀi Vi€ V> Ê V>`i ÞÊ vÊ"ÀÌ Ì ÃÌÃÊ> `Ê*À ÃÌ iÌ ÃÌÃÊNÊxÓÈÊ }Ê-Ì]Ê-ÌiÊÓä£ÊNÊ iÝ> `À >]Ê6 ÊÓÓΣ{ÊNÜÜÜ°](https://static.documents.pub/doc/80x56/5b0a3a9d7f8b9ae61b8bc4b8/vi-i-v-i-v-i-vi-vii-vi-v-vi-v-i-nx-in-i-6-n-.jpg)


![*À Vi`i V >Ê`iÊ ÃÊà iÝÊÀiVÕ«iÀ>` ÃÊi Ê*À> i> ÌâÊ Ê iL>]Ê ... · doi: 10.21630/mmaas.2017.1.14 Õ LiÊ }À>« Ã°Ê Ì À « }ÞÊ> `Ê ÀV >i }ÞÊ-iÀ iÃÊUÊ£ÊÓä£Ç®ÊUÊÎ](https://static.documents.pub/doc/80x56/5f0843d37e708231d42126f4/-vii-v-i-ff-iivi-fi-i-oe.jpg)


