Stationary Source GHG Emissions from Petroleum Refinery Operations: Implications for Higher Level Ethanol Blends February 17, 2016 National Ethanol Conference New Orleans, LA Dr. Vincent Kwasniewski President Confluence Consulting LLC
Transcript
Stationary Source GHG Emissions from Petroleum Refinery Operations:
Implications for Higher Level Ethanol Blends
February 17, 2016 National Ethanol Conference
New Orleans, LA
Dr. Vincent Kwasniewski President
Confluence Consulting LLC
Objective
2
Moving to higher level ethanol blends: what would be the impact on stationary source emissions of greenhouse gases from oil refineries?
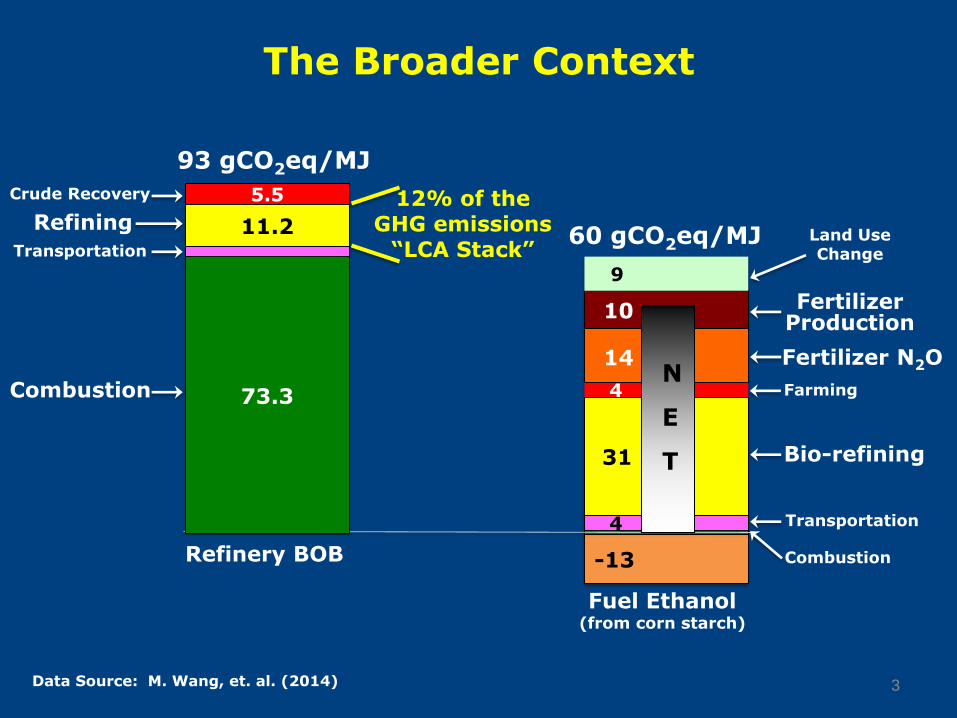
The Broader Context
3 Data Source: M. Wang, et. al. (2014)
12% of the GHG emissions
“LCA Stack”
-13
4
31
4
14
10
9
Bio-refining
Transportation
Transportation
Combustion
Farming
Fertilizer N2O
Fertilizer Production
Land Use Change
60 gCO2eq/MJ
73.3
11.2
5.5
Combustion
Refining
Crude Recovery
Transportation
93 gCO2eq/MJ
Refinery BOB
Fuel Ethanol (from corn starch)
N
E
T
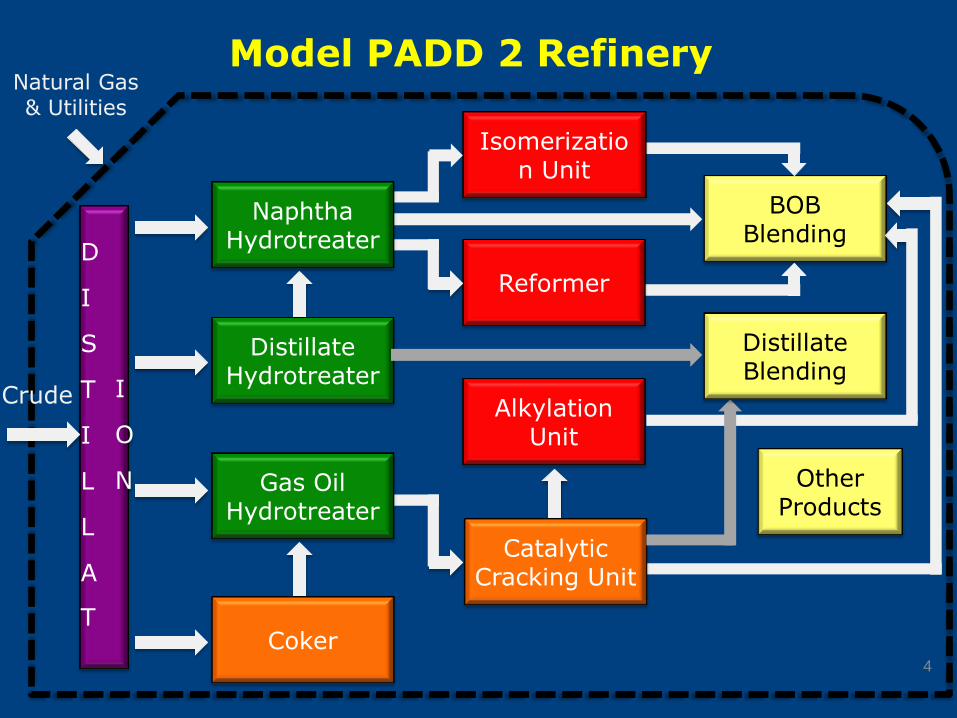
Natural Gas & Utilities
Reformer
Isomerization Unit
Alkylation Unit
BOB Blending
Catalytic Cracking Unit
Model PADD 2 Refinery
4
D
I
S
T
I
L
L
A
T
I
O
N
Crude
Distillate Hydrotreater
Gas Oil Hydrotreater
Coker
Naphtha Hydrotreater
Distillate Blending
Other Products
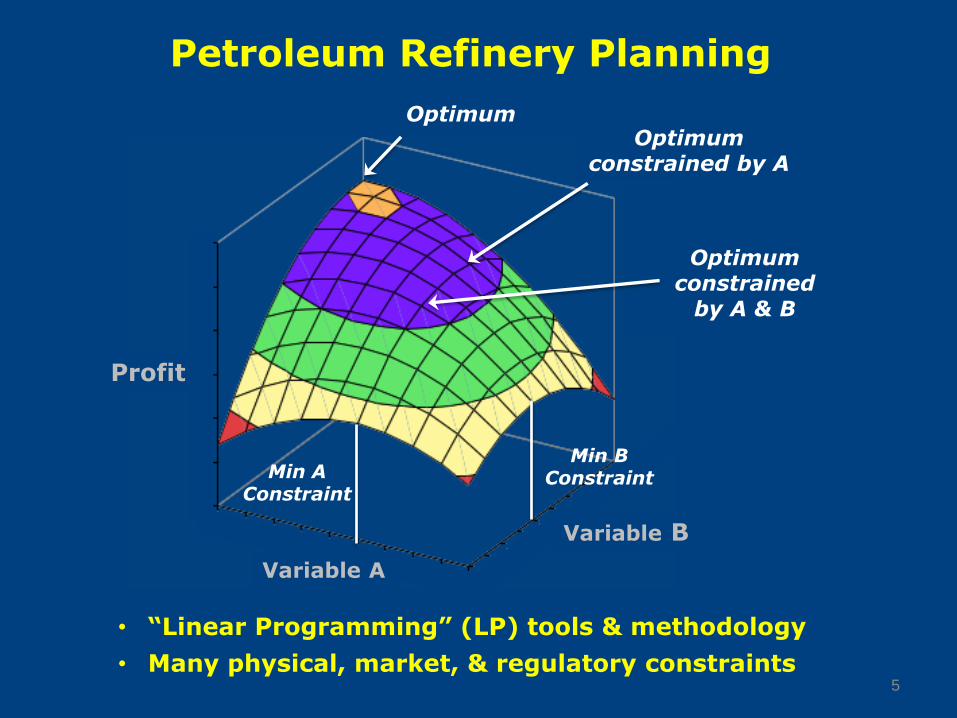
Petroleum Refinery Planning
5
Profit
Variable B
Variable A
Optimum
• “Linear Programming” (LP) tools & methodology
• Many physical, market, & regulatory constraints
Optimum constrained by A
Min A Constraint
Optimum constrained
by A & B
Min B Constraint
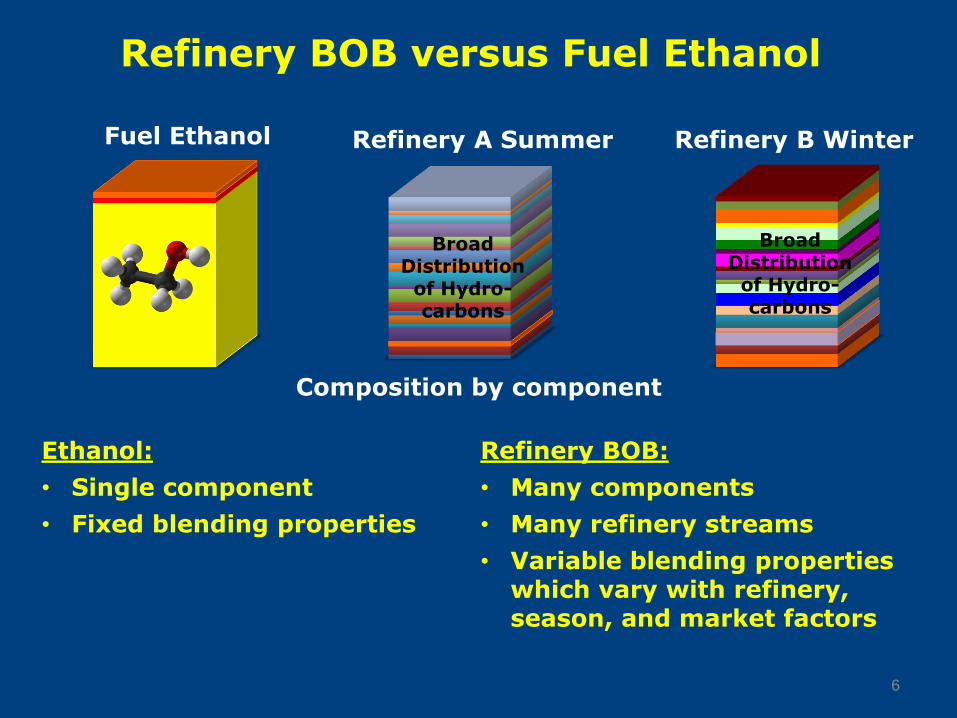
Refinery BOB versus Fuel Ethanol
6
Ethanol:
• Single component
• Fixed blending properties
Refinery BOB:
• Many components
• Many refinery streams
• Variable blending properties which vary with refinery, season, and market factors
Composition by component
Fuel Ethanol Refinery A Summer Refinery B Winter
Broad Distribution of Hydro-carbons
Broad Distribution of Hydro-carbons
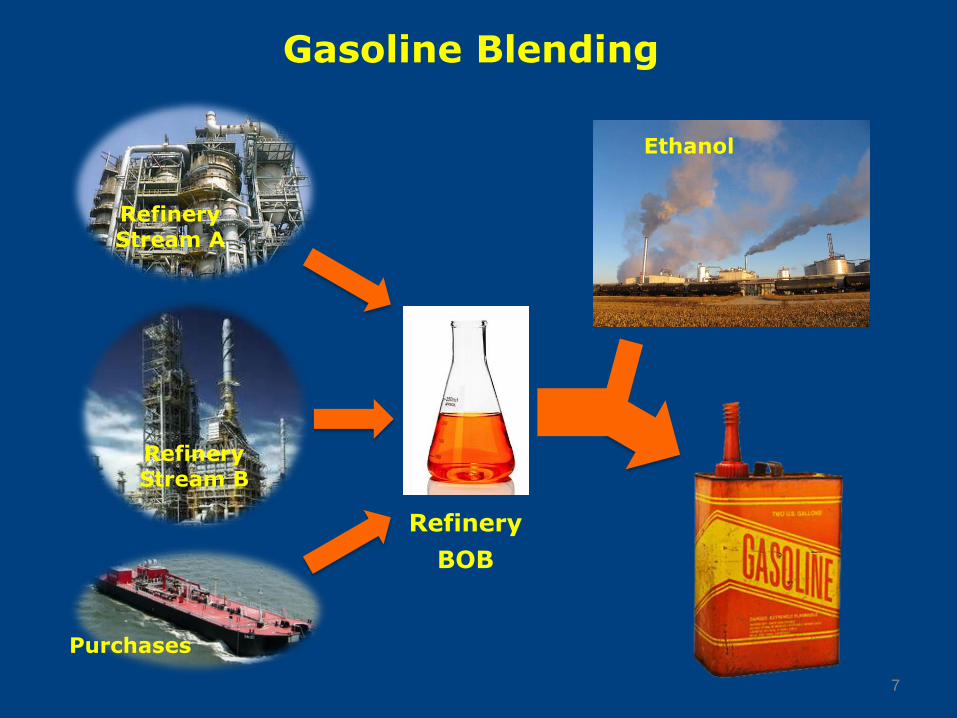
Gasoline Blending
7
Refinery
BOB
Ethanol
Refinery Stream A
Refinery Stream B
Purchases
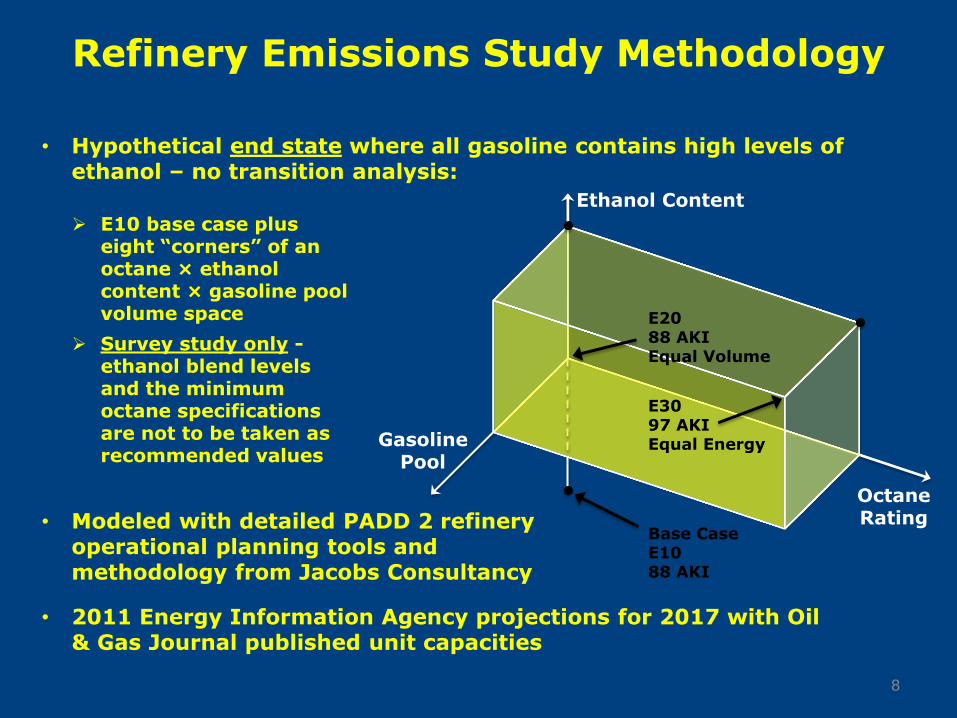
Refinery Emissions Study Methodology
• Hypothetical end state where all gasoline contains high levels of ethanol – no transition analysis:
8
E10 base case plus eight “corners” of an octane × ethanol content × gasoline pool volume space
Survey study only - ethanol blend levels and the minimum octane specifications are not to be taken as recommended values
Ethanol Content
Octane Rating
Gasoline Pool
E20 88 AKI Equal Volume
E30 97 AKI Equal Energy
Base Case E10 88 AKI
• 2011 Energy Information Agency projections for 2017 with Oil & Gas Journal published unit capacities
• Modeled with detailed PADD 2 refinery operational planning tools and methodology from Jacobs Consultancy
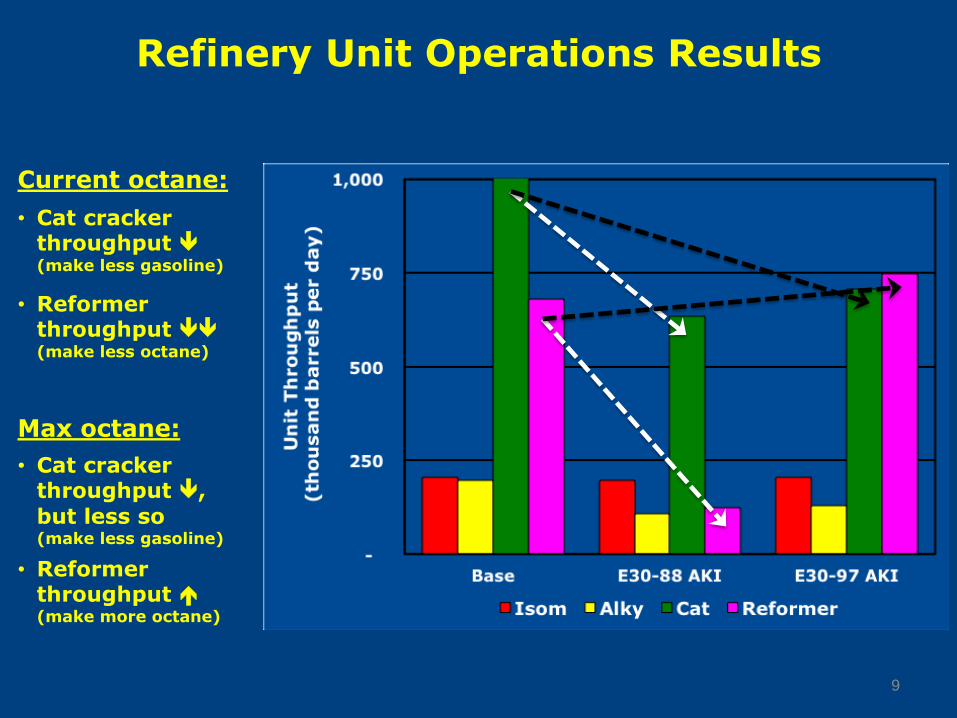
Refinery Unit Operations Results
• Cat cracker throughput (make less gasoline)
• Reformer throughput (make less octane)
9
Max octane:
Current octane:
• Cat cracker throughput ,
but less so (make less gasoline)
• Reformer throughput (make more octane)
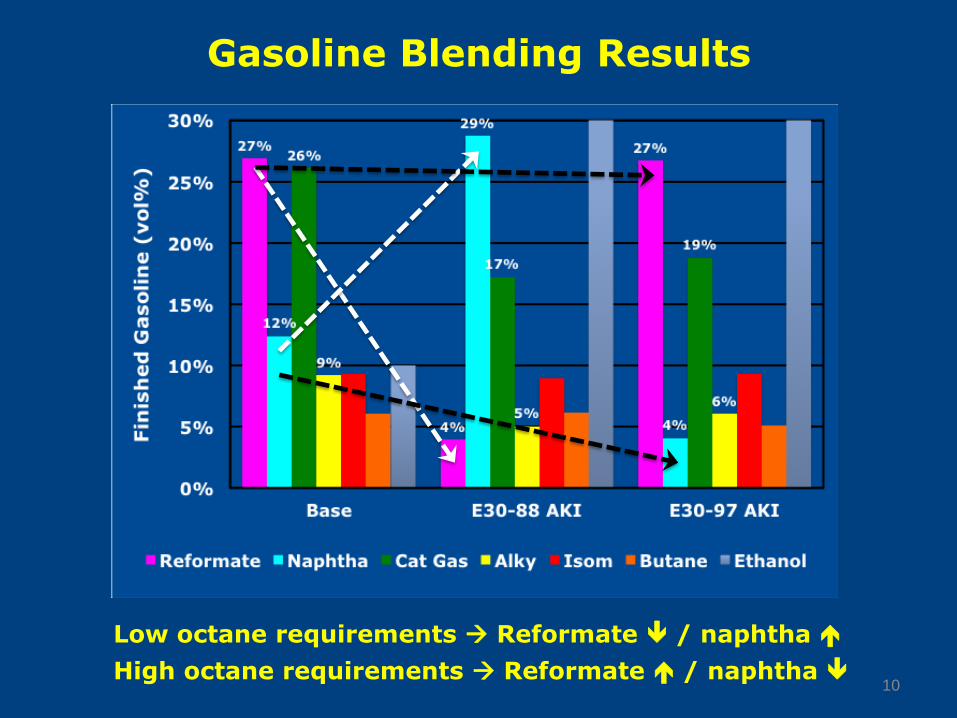
Gasoline Blending Results
Low octane requirements Reformate / naphtha
High octane requirements Reformate / naphtha 10
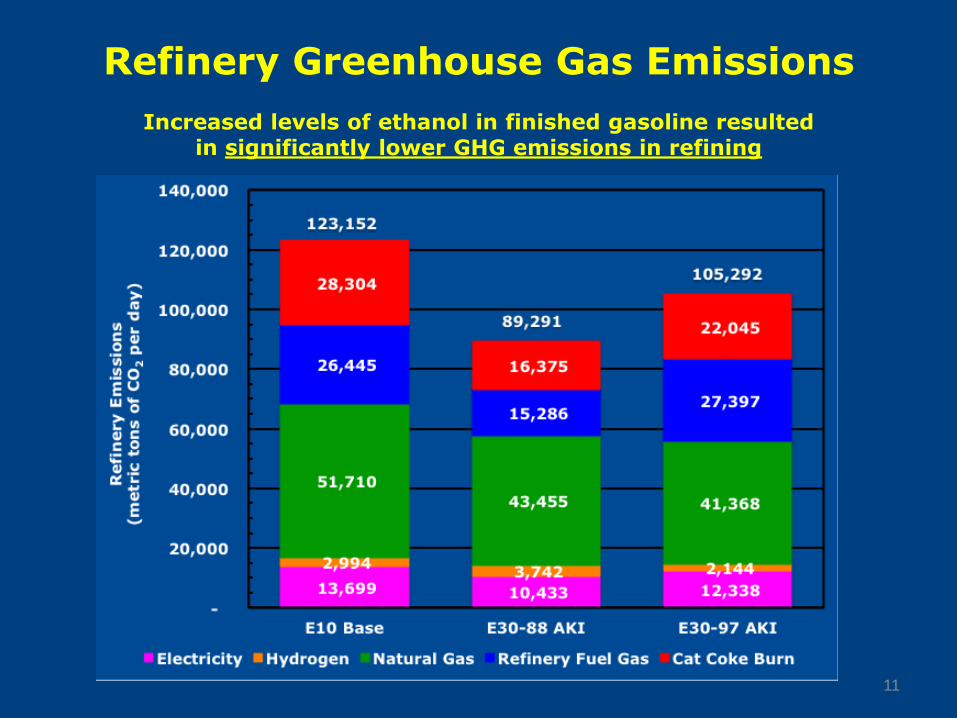
Refinery Greenhouse Gas Emissions
Increased levels of ethanol in finished gasoline resulted in significantly lower GHG emissions in refining
11
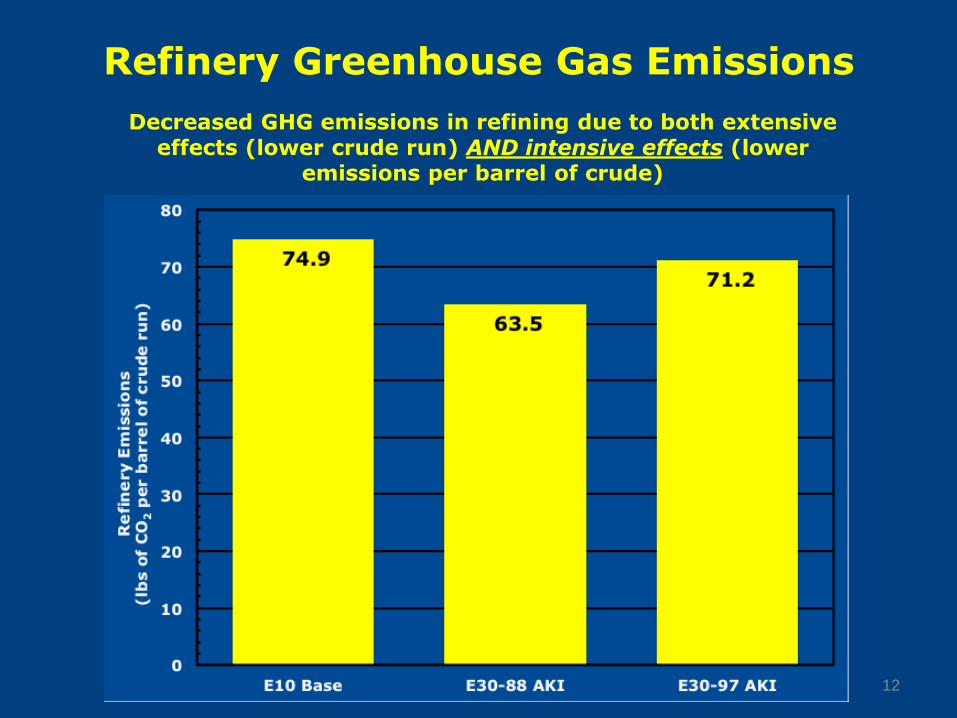
Refinery Greenhouse Gas Emissions
12
Decreased GHG emissions in refining due to both extensive effects (lower crude run) AND intensive effects (lower
emissions per barrel of crude)
Conclusions and Implications
• GHG emissions caused by the refining process vary significantly with ethanol content and minimum octane specifications in finished gasoline
• Using a fixed GHG emissions intensity for BOB is incorrect ethanol content and minimum octane specifications should also be factors in determining the lifecycle GHG emissions associated with higher level blends of ethanol
• Changes in refinery operations could also have implications for other environmental policies:
• CAFE standards compliance
• Tier 3 compliance (sulfur)
• regulation of stationary source and vehicular toxic air emissions
• possible future stationary source GHG emissions regulations
13
Thank You!
Key references on refinery greenhouse gas emissions:
• Kwasniewski, V., Blieszner, J. and Nelson, R. (2015), Petroleum refinery greenhouse gas emission variations related to higher ethanol blends at different gasoline octane rating and pool volume levels. Biofuels, Bioprod. Bioref.. doi: 10.1002/bbb.1612
• Han, Jeongwoo, Elgowainy, Amgad, Michael Wang and Vincent Divita (2015), Well-to-Wheels Greenhouse Gas Emissions Analysis of High-Octane Fuels with Various Market Shares and Ethanol Blend Levels. United States. doi:10.2172/1212715. http://www.osti.gov/scitech/servlets/purl/1212715
• Hirshfeld, D.S., Kobl, J.A., Anderson, J.E., Studzinski, W. and Frusti, J. (2014), Refining Economics of U.S. Gasoline: Octane Ratings and Ethanol Content. Environmental Science & Technology 48, 11064-11071. doi: 10.1021/es5021668
• Speth, R.L., Chow, E.W., Malina, R., Barrett, S.R.H., Heywood, J.B., Green, W.H. (2014), Economic and Environmental Benefits of Higher-Octane Gasoline. Environmental Science & Technology 48, 6561-6568. doi: 10.1021/es405557p