62
1 Virginia Criminal Sentencing Commission Dr. Rick Kern, Director
| Date post: | 27-Mar-2018 |
| Category: |
Documents |
| Upload: | nguyenkhuong |
| View: | 222 times |
| Download: | 0 times |

1
Virginia Criminal Sentencing Commission
Dr. Rick Kern, Director
Virginia Criminal Sentencing Commission
House of Delegates Appointments
The Honorable Linda D. Curtis, HamptonDelegate C. Todd Gilbert, WoodstockEsther Windmueller, Richmond
Governor's Appointments
Debbie Smith, RichmondRobert C. Hagan, Jr., DalevilleMarsha Garst, HarrisonburgHarvey Bryant, Virginia Beach
Appointed by the Chief Justice of the Supreme Court and Confirmed by the General AssemblyJudge F. Bruce Bach, Chairman, Fairfax County
Appointments by the Chief Justice of the Supreme Court
Judge Robert J. Humphreys, Vice Chair, Virginia BeachJudge Joanne F. Alper, ArlingtonJudge Junius P. Fulton, NorfolkJudge Lee A. Harris, Jr., HenricoJudge Dennis L. Hupp, WoodstockJudge Larry B. Kirksey, Bristol
Attorney General
The Honorable Kenneth T. Cuccinelli, II
Senate Appointments
The Honorable Eric J. Finkbeiner, RichmondSenator Henry L. Marsh, III, Richmond
2

FY2010Number of Cases = 24,014
Compliance79.6
Mitigation
9.2%Aggravation
11.3%
Mitigation
55.1%Aggravation44.9%
Sentencing Guidelines Compliance
Overall Compliance Directions of Departures
Sentencing Guidelines C
ompliance
3
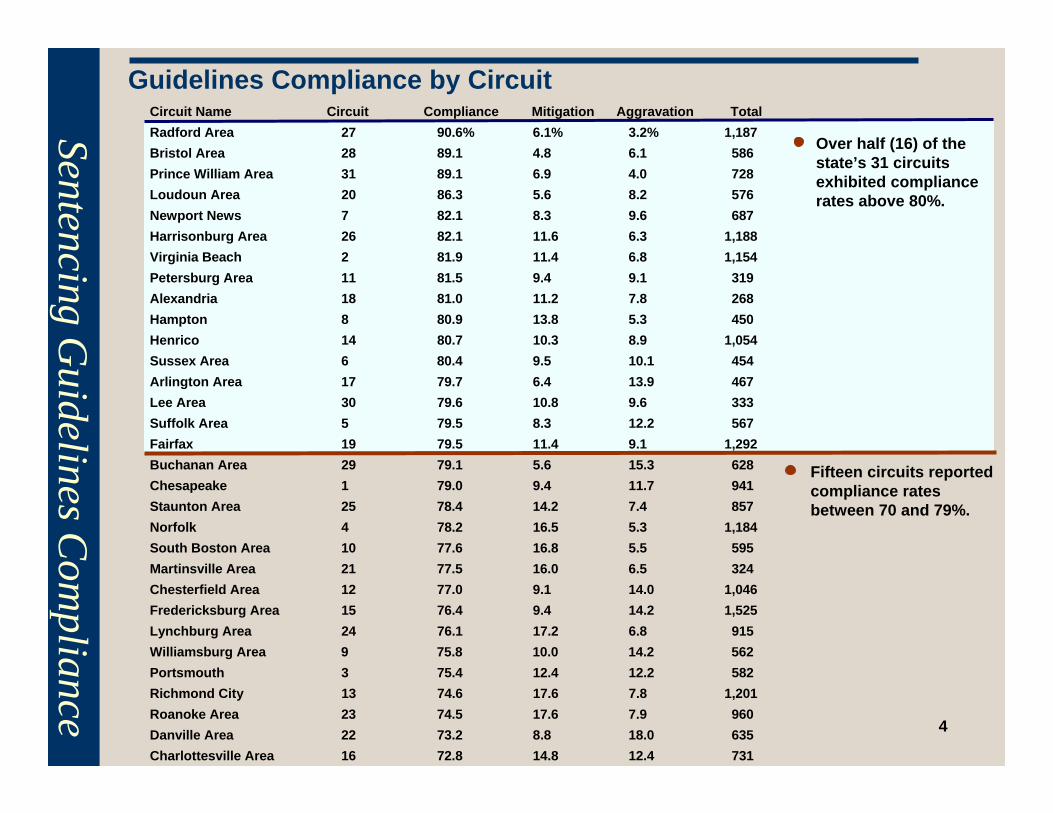
Guidelines Compliance by Circuit
Sentencing Guidelines C
ompliance
Circuit Name Circuit Compliance Mitigation Aggravation TotalRadford Area 27 90.6% 6.1% 3.2% 1,187Bristol Area 28 89.1 4.8 6.1 586Prince William Area 31 89.1 6.9 4.0 728Loudoun Area 20 86.3 5.6 8.2 576Newport News 7 82.1 8.3 9.6 687Harrisonburg Area 26 82.1 11.6 6.3 1,188Virginia Beach 2 81.9 11.4 6.8 1,154Petersburg Area 11 81.5 9.4 9.1 319Alexandria 18 81.0 11.2 7.8 268Hampton 8 80.9 13.8 5.3 450Henrico 14 80.7 10.3 8.9 1,054Sussex Area 6 80.4 9.5 10.1 454Arlington Area 17 79.7 6.4 13.9 467Lee Area 30 79.6 10.8 9.6 333Suffolk Area 5 79.5 8.3 12.2 567Fairfax 19 79.5 11.4 9.1 1,292Buchanan Area 29 79.1 5.6 15.3 628Chesapeake 1 79.0 9.4 11.7 941Staunton Area 25 78.4 14.2 7.4 857Norfolk 4 78.2 16.5 5.3 1,184South Boston Area 10 77.6 16.8 5.5 595Martinsville Area 21 77.5 16.0 6.5 324Chesterfield Area 12 77.0 9.1 14.0 1,046Fredericksburg Area 15 76.4 9.4 14.2 1,525Lynchburg Area 24 76.1 17.2 6.8 915Williamsburg Area 9 75.8 10.0 14.2 562Portsmouth 3 75.4 12.4 12.2 582Richmond City 13 74.6 17.6 7.8 1,201Roanoke Area 23 74.5 17.6 7.9 960Danville Area 22 73.2 8.8 18.0 635Charlottesville Area 16 72.8 14.8 12.4 731
Fifteen circuits reported compliance rates between 70 and 79%.
Over half (16) of the state’s 31 circuits exhibited compliance rates above 80%.
4

FY1986 – FY2010
Percent of Felony Convictions Adjudicated by Juries Parole v. Truth-in-Sentencing SystemSentencing G
uidelines Com
pliance
Parole System Truth-in-Sentencing
6.4 6.3 6.55.8 5.2 5.1 4.7 4.2 4.2 3.9
'86 '87 '88 '89 '90 '91 '92 '93 '94 '95
1.42.2 2.7 2.2 2.1 1.7 1.6 1.7 1.8 1.7
'95 '96 '97 '98 '99 '00 '01 '02 '03 '04
1.6
'05
5
1.4
'06
1.5
'07
1.3
'08
1.5
'09
1.7
‘10
FY2010Number of Cases = 24,014
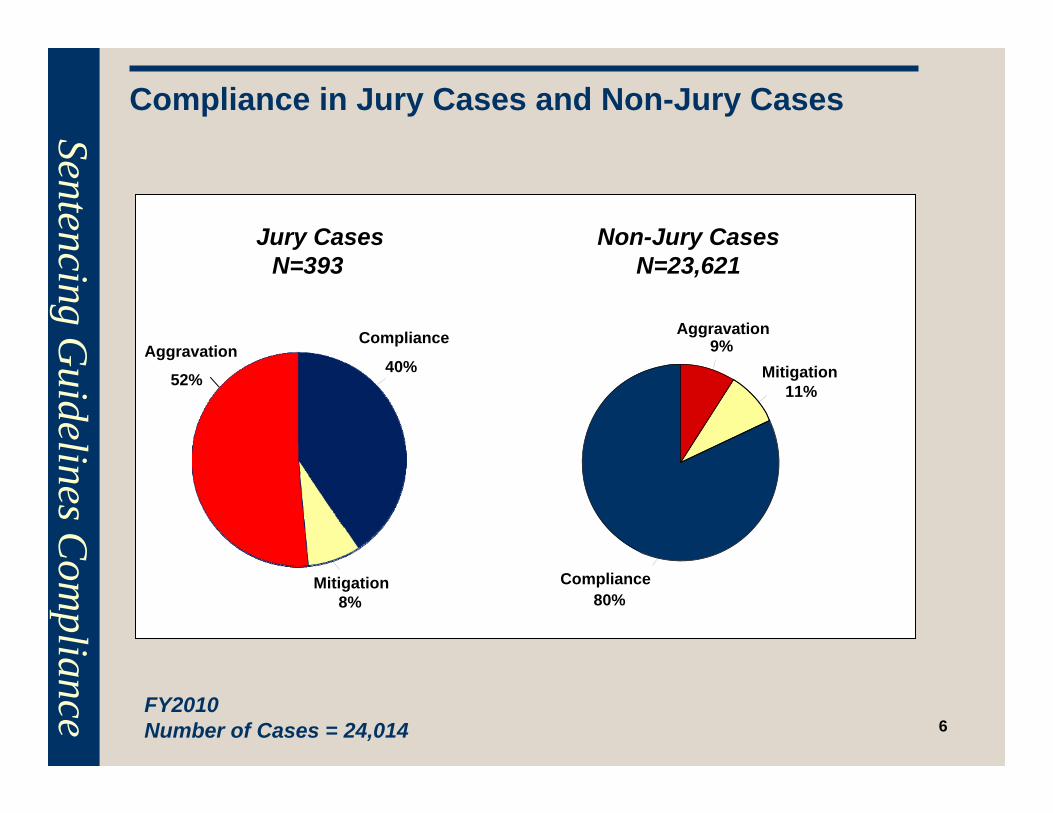
Compliance in Jury Cases and Non-Jury Cases
Sentencing Guidelines C
ompliance
Mitigation8%
Aggravation40%
Compliance
52% Mitigation11%
Aggravation9%
Compliance80%
Jury CasesN=393
Non-Jury CasesN=23,621
6

FY2010Number of Cases = 24,014
Percentage of Sentencing Guidelines Violent Offender Enhancement Cases(as defined by § 17.1-805)Sentencing G
uidelines Com
pliance
Cases withViolent Offender
Enhancement22.8%
Cases without Violent Offender
Enhancement77.2%
7
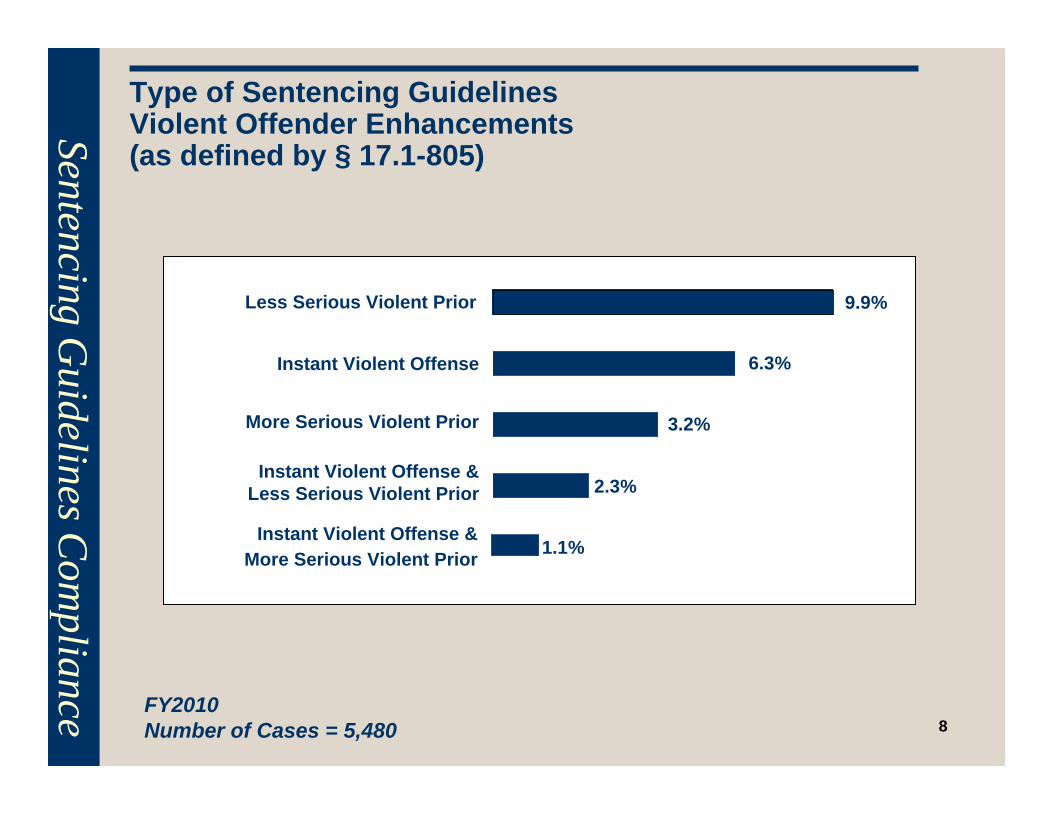
FY2010Number of Cases = 5,480
Type of Sentencing Guidelines Violent Offender Enhancements(as defined by § 17.1-805)
Sentencing Guidelines C
ompliance
8
Instant Violent Offense
Less Serious Violent Prior
Instant Violent Offense & Less Serious Violent Prior
More Serious Violent Prior
Instant Violent Offense & More Serious Violent Prior
6.3%
3.2%
2.3%
9.9%
1.1%
9
Integration of OffenderRecidivism RiskAssessment into Virginia SentencingGuidelines
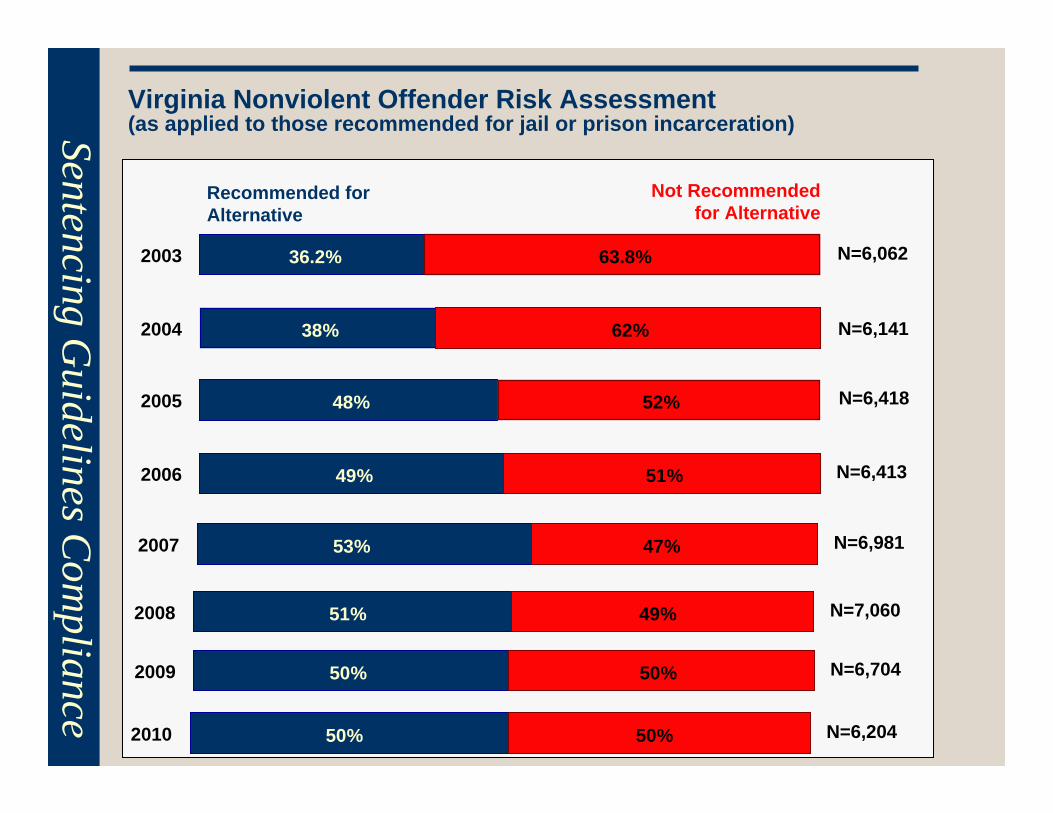
Virginia Nonviolent Offender Risk Assessment(as applied to those recommended for jail or prison incarceration)Sentencing G
uidelines Com
pliance
36.2%
38%
48%
49%
63.8%
62%
52%
51%
2003
2004
2005
2006
Recommended for Alternative
Not Recommended for Alternative
N=6,062
N=6,141
N=6,418
N=6,413
53% 47%2007 N=6,981
51% 49%2008 N=7,060
50% 50%2009 N=6,704
50% 50%2010 N=6,204
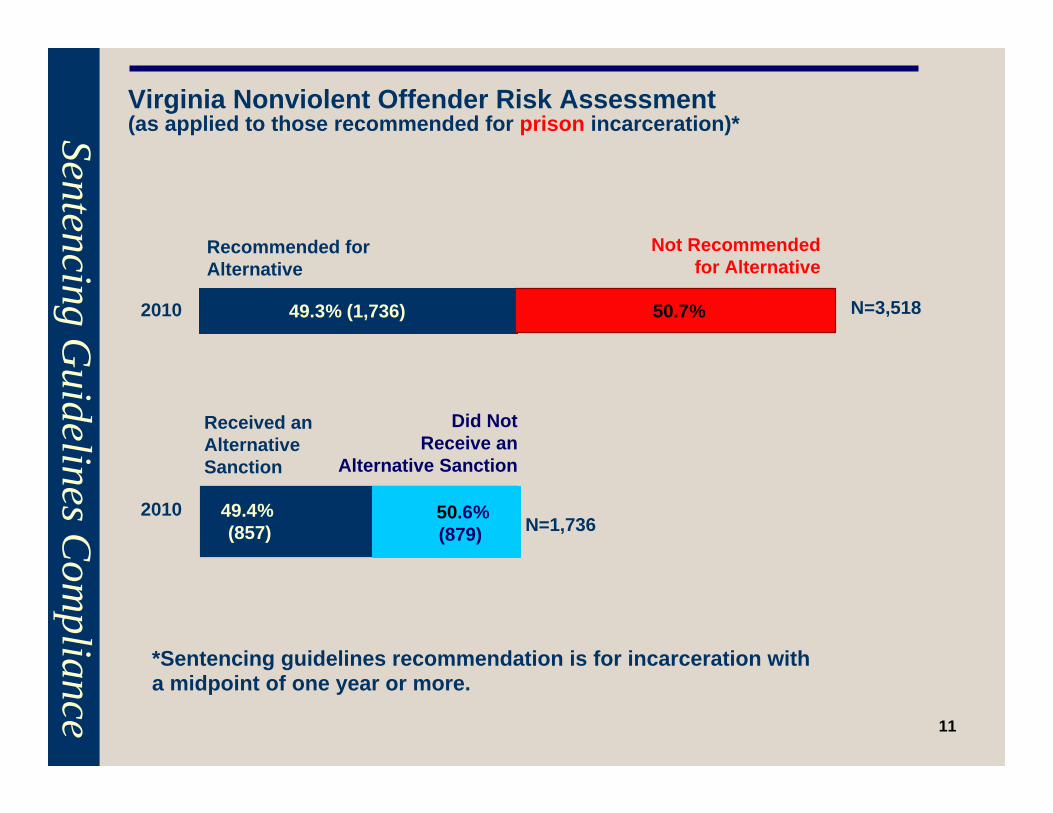
Virginia Nonviolent Offender Risk Assessment(as applied to those recommended for prison incarceration)*
49.3% (1,736)
49.4% (857)
50.7% 2010
2010
Recommended for Alternative
Not Recommended for Alternative
N=3,518
N=1,736
Received an Alternative Sanction
Did Not Receive an
Alternative Sanction
*Sentencing guidelines recommendation is for incarceration with a midpoint of one year or more.
Sentencing Guidelines C
ompliance
11
50.6% (879)
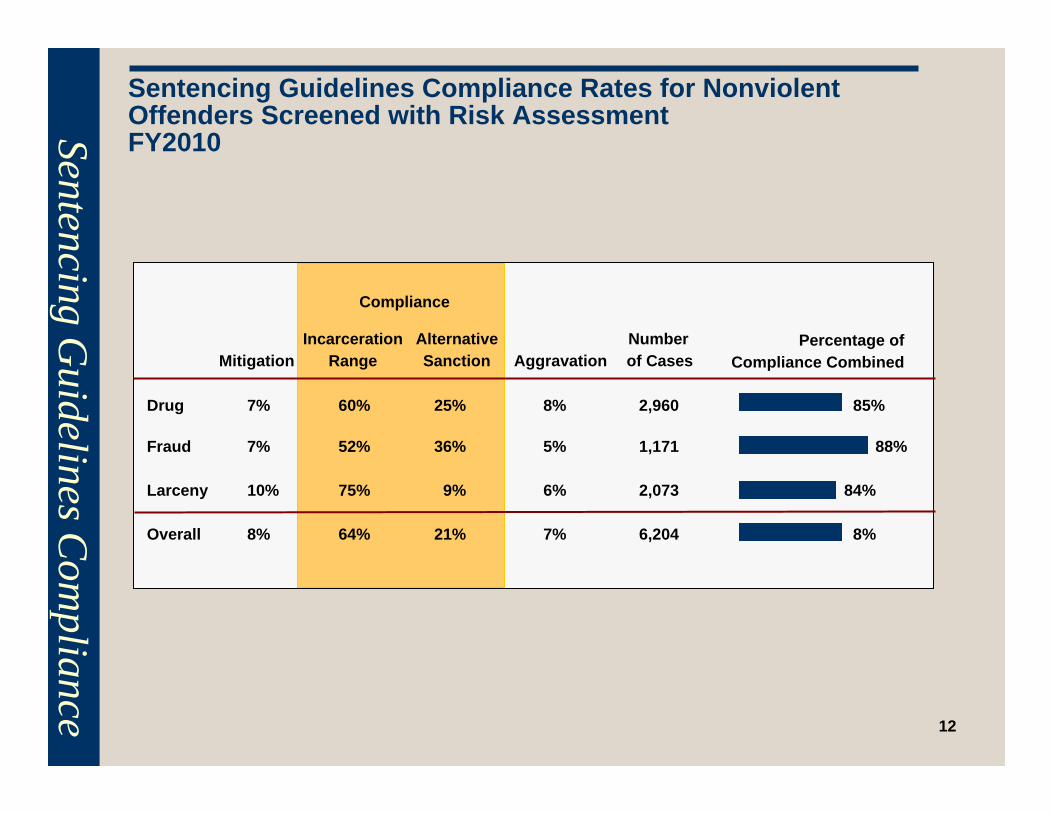
Sentencing Guidelines Compliance Rates for Nonviolent Offenders Screened with Risk Assessment FY2010Sentencing G
uidelines Com
pliance
12
Drug 7% 60% 25% 8% 2,960 85%
Fraud 7% 52% 36% 5% 1,171 88%
Larceny 10% 75% 9% 6% 2,073 84%
Overall 8% 64% 21% 7% 6,204 8%
Compliance
Mitigation AggravationNumber of Cases
AlternativeSanction
IncarcerationRange
Percentage of Compliance Combined
13
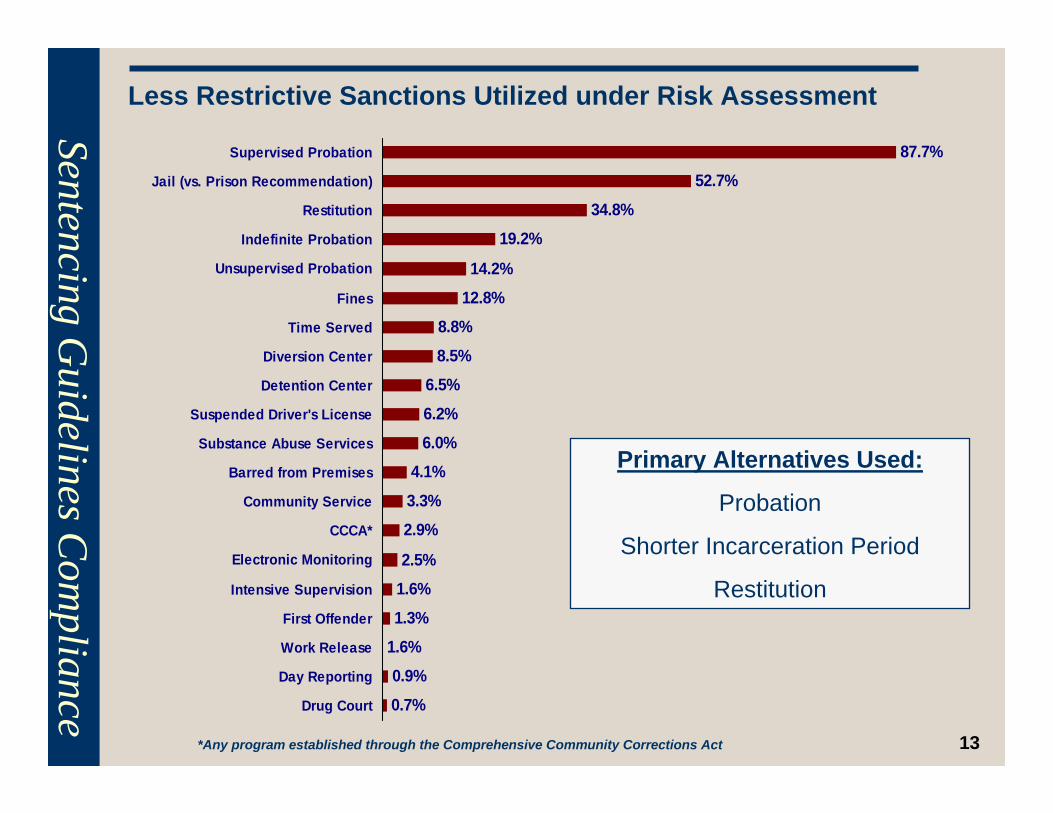
Primary Alternatives Used:
Probation
Shorter Incarceration Period
Restitution
Sentencing Guidelines C
ompliance
Less Restrictive Sanctions Utilized under Risk Assessment
87.7%52.7%
34.8%19.2%
14.2%
12.8%8.8%
8.5%6.5%
6.2%
4.1%
3.3%2.9%
2.5%1.6%
1.3%
0.7%
6.0%
0.9%1.6%
Supervised Probation
Jail (vs. Prison Recommendation)
Restitution
Indefinite Probation
Unsupervised Probation
Fines
Time Served
Diversion Center
Detention Center
Suspended Driver's License
Substance Abuse Services
Barred from Premises
Community Service
CCCA*
Electronic Monitoring
Intensive Supervision
First Offender
Work Release
Day Reporting
Drug Court
*Any program established through the Comprehensive Community Corrections Act

14
National Center for State Courts Evaluation of Virginia’s risk assessment instrument
Concluded that our risk assessment component accurately distinguished nonviolent felons less likely to recidivate from those more likely
“Virginia's risk assessment instrument provides an objective, reliable, transparent, and more accurate alternative to assessing an offender’s potential for recidivism than the traditional reliance on judicial intuition or perceptual short hand”
“This is a workable tool for managing prison populations. It allows states the flexibility to determine how many offenders they would like to divert while balancing concerns of public safety”
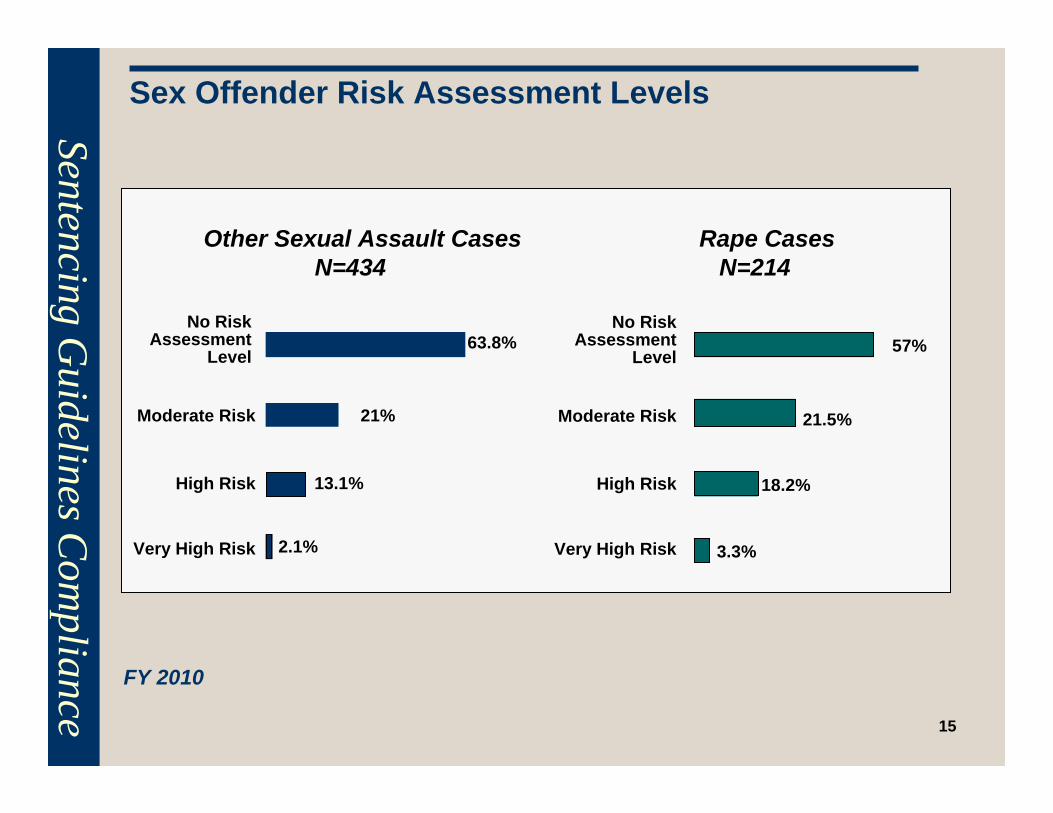
FY 2010
Sex Offender Risk Assessment Levels
Sentencing Guidelines C
ompliance
Other Sexual Assault CasesN=434
Rape CasesN=214
No Risk Assessment
Level
2.1%
Moderate Risk
High Risk
Very High Risk 3.3%
18.2%13.1%
21% 21.5%
63.8% 57%
15
No Risk Assessment
Level
Moderate Risk
High Risk
Very High Risk
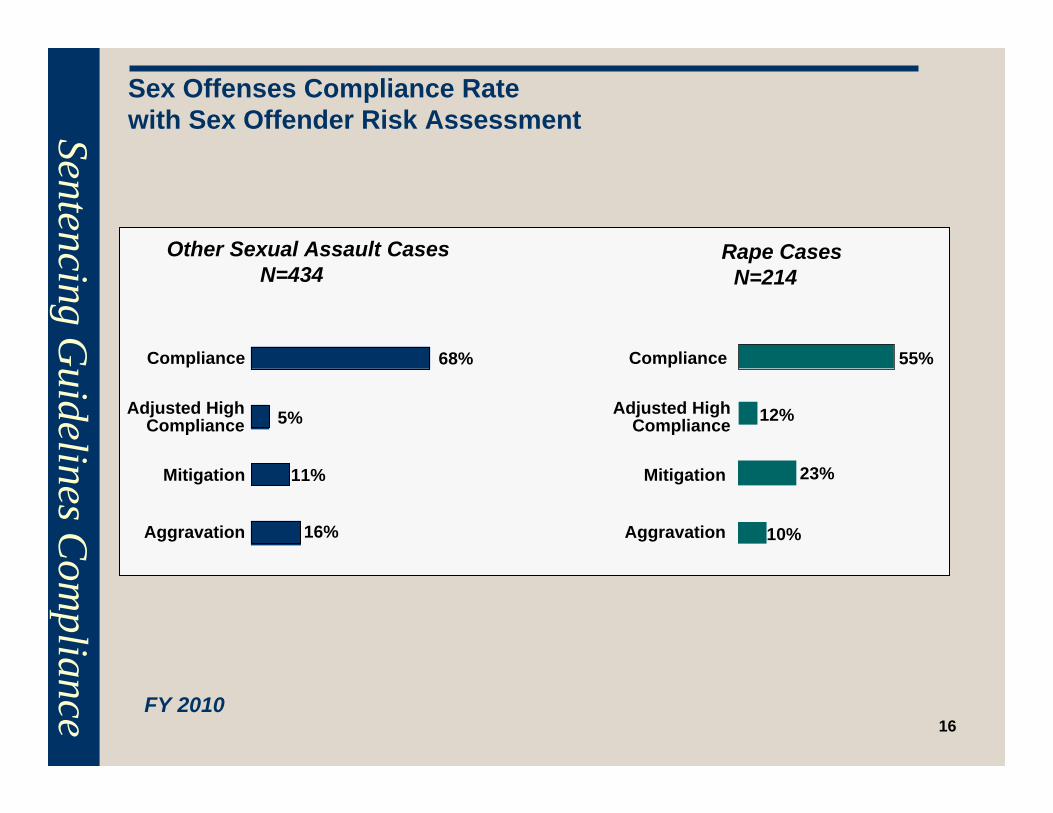
FY 2010
Sex Offenses Compliance Rate with Sex Offender Risk AssessmentSentencing G
uidelines Com
pliance
Other Sexual Assault CasesN=434
Rape CasesN=214
Compliance
16%
Mitigation
Adjusted High Compliance
Aggravation 10%
12%5%
11% 23%
68% 55%Compliance
Mitigation
Adjusted High Compliance
Aggravation
16

17
Impact of Truth-in-Sentencing
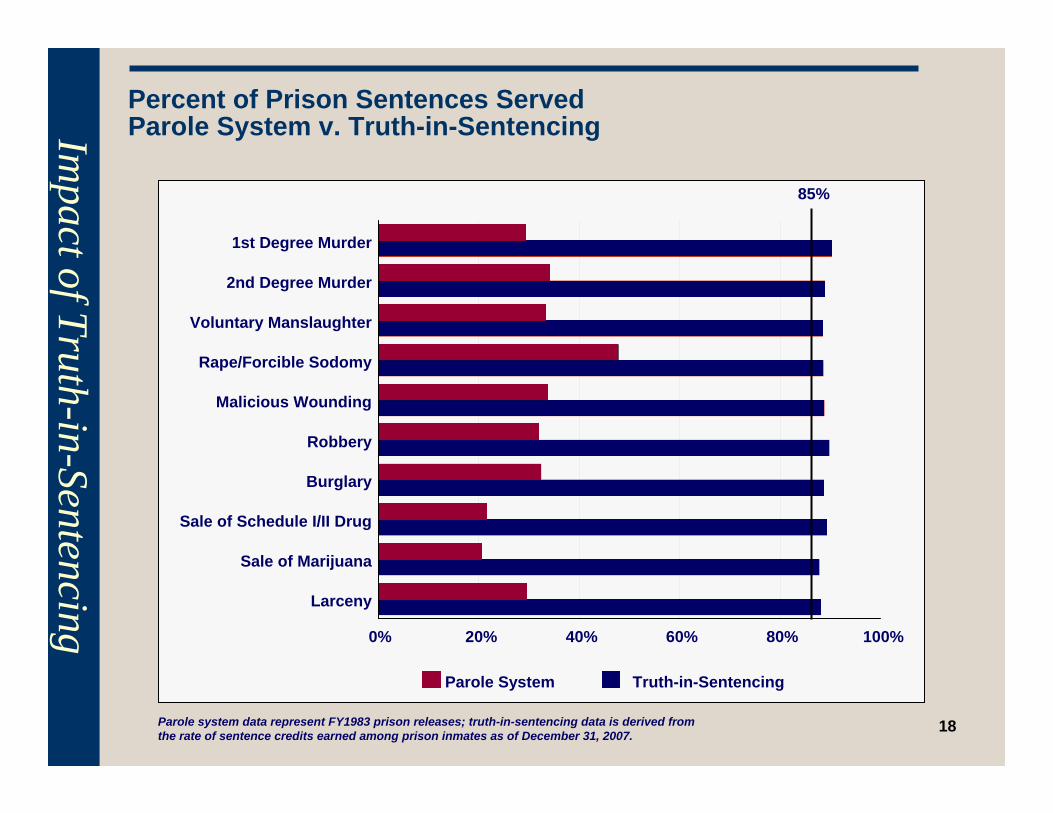
Percent of Prison Sentences ServedParole System v. Truth-in-SentencingIm
pact of Truth-in-Sentencing
1st Degree Murder
2nd Degree Murder
Voluntary Manslaughter
Rape/Forcible Sodomy
Malicious Wounding
Robbery
Burglary
Sale of Schedule I/II Drug
Sale of Marijuana
Larceny
0% 20% 40% 60% 80% 100%
Truth-in-SentencingParole System
85%
Parole system data represent FY1983 prison releases; truth-in-sentencing data is derived from the rate of sentence credits earned among prison inmates as of December 31, 2007.
18
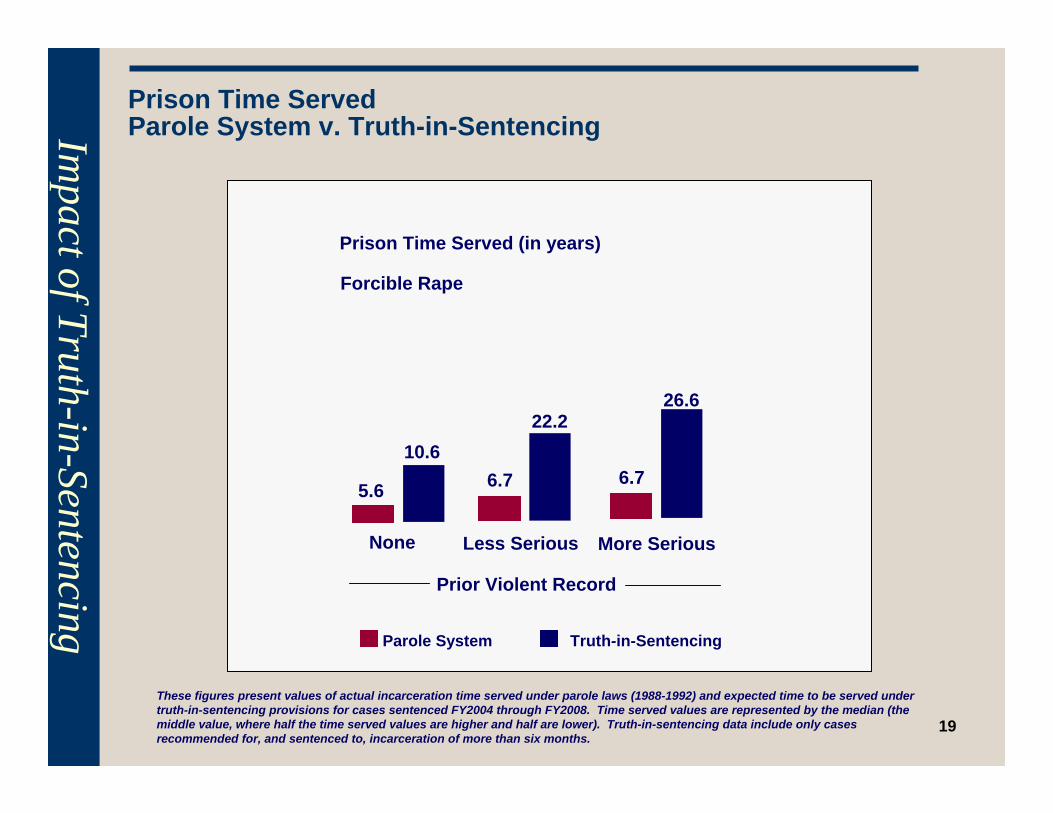
Prison Time ServedParole System v. Truth-in-SentencingIm
pact of Truth-in-Sentencing
Truth-in-SentencingParole System
These figures present values of actual incarceration time served under parole laws (1988-1992) and expected time to be served under truth-in-sentencing provisions for cases sentenced FY2004 through FY2008. Time served values are represented by the median (the middle value, where half the time served values are higher and half are lower). Truth-in-sentencing data include only cases recommended for, and sentenced to, incarceration of more than six months.
Forcible Rape
Prison Time Served (in years)
6.7
26.6
None Less Serious More Serious
Prior Violent Record
6.7
22.2
5.6
10.6
19
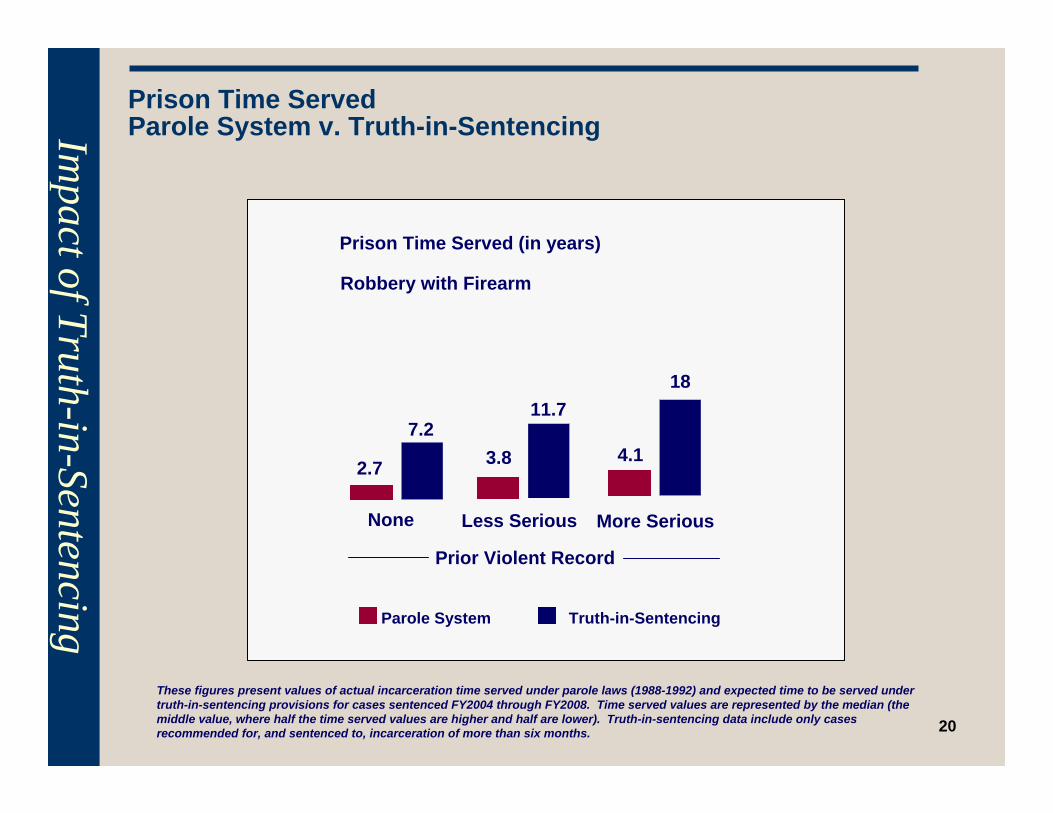
Prison Time ServedParole System v. Truth-in-SentencingIm
pact of Truth-in-Sentencing Truth-in-SentencingParole System
These figures present values of actual incarceration time served under parole laws (1988-1992) and expected time to be served under truth-in-sentencing provisions for cases sentenced FY2004 through FY2008. Time served values are represented by the median (the middle value, where half the time served values are higher and half are lower). Truth-in-sentencing data include only cases recommended for, and sentenced to, incarceration of more than six months.
Robbery with Firearm
Prison Time Served (in years)
4.1
18
None Less Serious More Serious
Prior Violent Record
3.8
11.7
2.7
7.2
20

Prison Time ServedParole System v. Truth-in-SentencingIm
pact of Truth-in-Sentencing Truth-in-SentencingParole System
These figures present values of actual incarceration time served under parole laws (1988-1992) and expected time to be served under truth-in-sentencing provisions for cases sentenced FY2004 through FY2008. Time served values are represented by the median (the middle value, where half the time served values are higher and half are lower). Truth-in-sentencing data include only cases recommended for, and sentenced to, incarceration of more than six months.
Sale of a Schedule I/II Drug
Prison Time Served (in years)
1.6
4.5
None Less Serious More Serious
Prior Violent Record
1.5
3.1
1 .9
21

Profile of Offenders (Violent vs. Nonviolent as defined in § 17.1-805) in Virginia’s Prison System2007
Impact of Truth-in-Sentencing
Sources: Virginia Department of Corrections' FAST and CORIS data systems, the Pre/Post-Sentence Investigation (PSI) reporting system, and the Virginia Criminal Sentencing Commission’s Sentencing Guidelines (SG) database.
79.1%
20.9%
Violent Offenders
Nonviolent Offenders
22
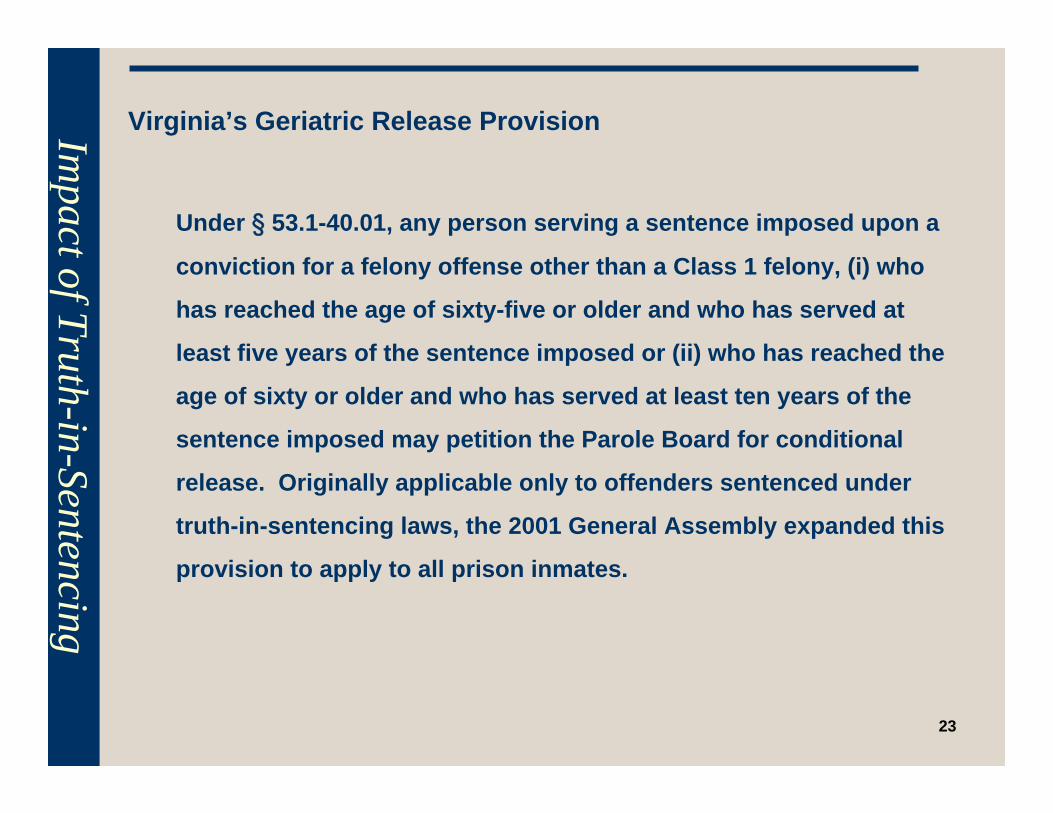
Virginia’s Geriatric Release ProvisionImpact of Truth-in-Sentencing
Under § 53.1-40.01, any person serving a sentence imposed upon a
conviction for a felony offense other than a Class 1 felony, (i) who
has reached the age of sixty-five or older and who has served at
least five years of the sentence imposed or (ii) who has reached the
age of sixty or older and who has served at least ten years of the
sentence imposed may petition the Parole Board for conditional
release. Originally applicable only to offenders sentenced under
truth-in-sentencing laws, the 2001 General Assembly expanded this
provision to apply to all prison inmates.
23

Virginia’s Geriatric Release ProvisionImpact of Truth-in-Sentencing
Prison Inmates Eligible for Geriatric Release
Parole System Inmateseligible for geriatric release
Truth-in-Sentencing Inmateseligible for geriatric release
Total Number of Inmateseligible for geriatric release
24
247359
476
669
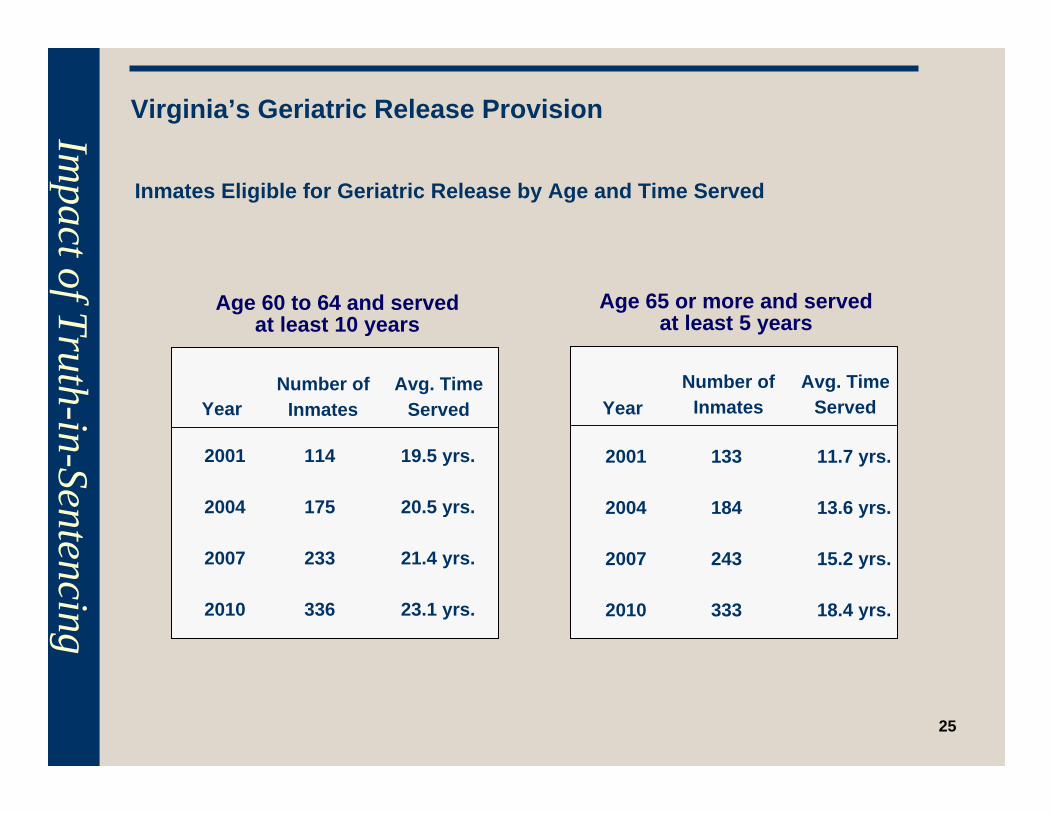
Virginia’s Geriatric Release ProvisionImpact of Truth-in-Sentencing
Inmates Eligible for Geriatric Release by Age and Time Served
Age 60 to 64 and served at least 10 years
Age 65 or more and served at least 5 years
Number ofInmates
Avg. TimeServed
Number ofInmates
Avg. TimeServed
2001
2004
2007
2010
114
175
233
336
19.5 yrs.
20.5 yrs.
21.4 yrs.
23.1 yrs.
2001
2004
2007
2010
133
184
243
333
11.7 yrs.
13.6 yrs.
15.2 yrs.
18.4 yrs.
YearYear
25
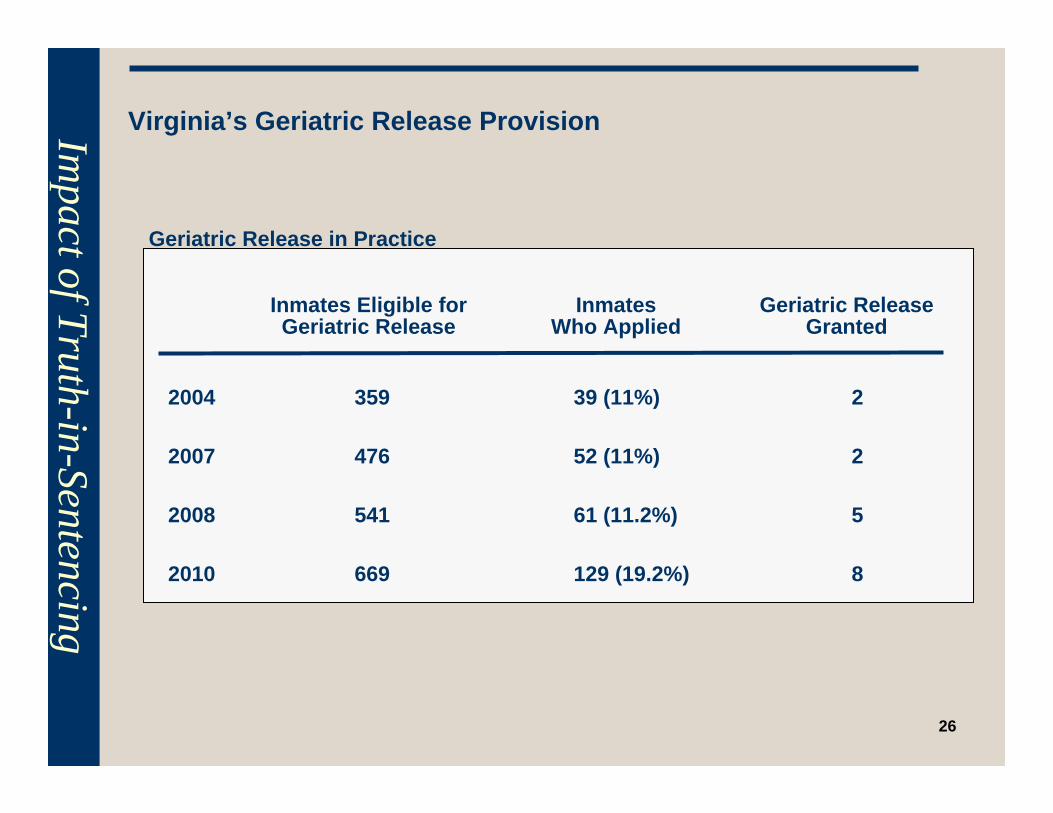
Virginia’s Geriatric Release ProvisionImpact of Truth-in-Sentencing
Geriatric Release in Practice
Inmates Eligible for Geriatric Release
Inmates Who Applied
2004
2007
2008
2010
359
476
541
669
39 (11%)
52 (11%)
61 (11.2%)
129 (19.2%)
Geriatric Release Granted
2
2
5
8
26
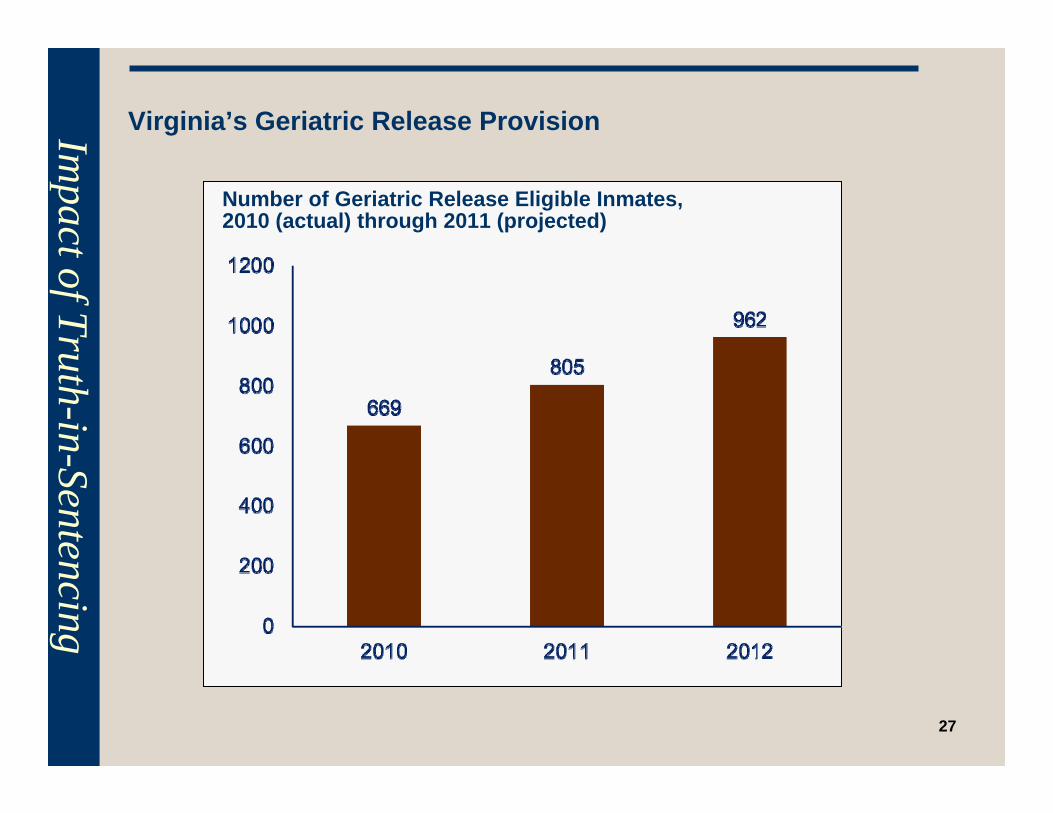
Virginia’s Geriatric Release ProvisionImpact of Truth-in-Sentencing
Number of Geriatric Release Eligible Inmates, 2010 (actual) through 2011 (projected)
27
28
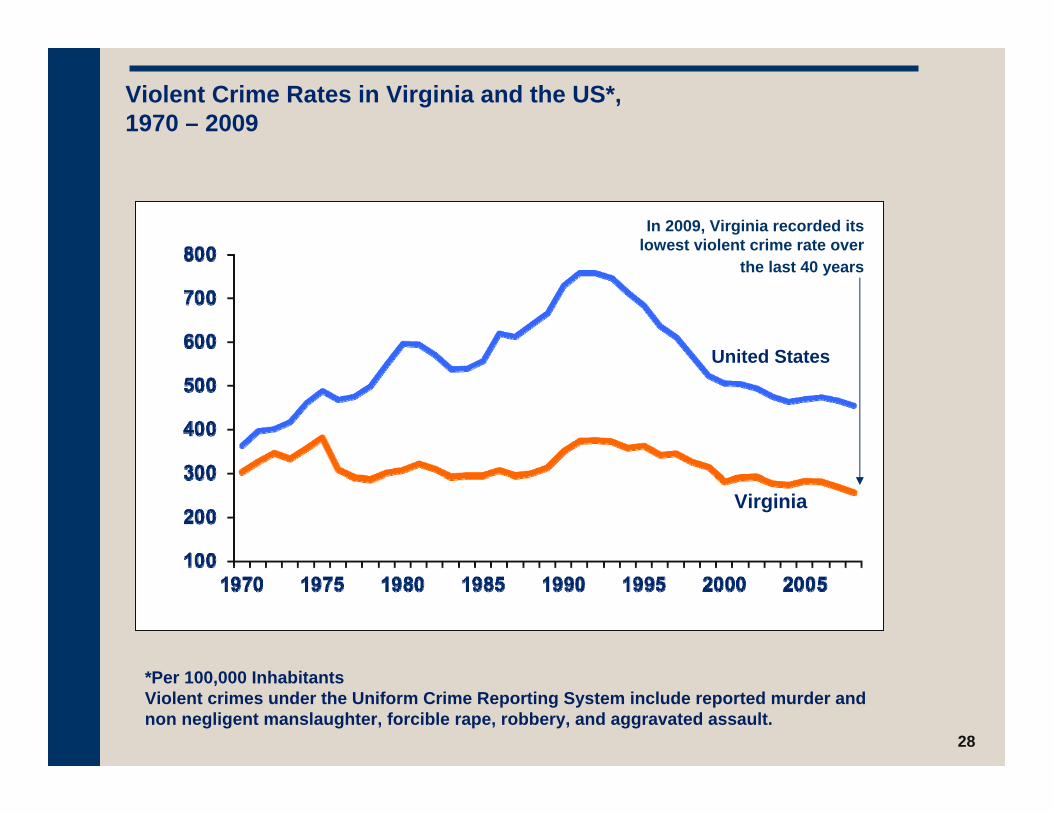
Violent Crime Rates in Virginia and the US*, 1970 – 2009
United States
Virginia
*Per 100,000 InhabitantsViolent crimes under the Uniform Crime Reporting System include reported murder and non negligent manslaughter, forcible rape, robbery, and aggravated assault.
In 2009, Virginia recorded its lowest violent crime rate over
the last 40 years

29
Property Index Crime Rates in Virginia and the US, 1970 – 2009
United States
Virginia
*Per 100,000 InhabitantsProperty crimes include burglary, larceny-theft, and motor vehicle theft.
In 2009, Virginia recorded its lowest property crime rate over
the last 40 years
30
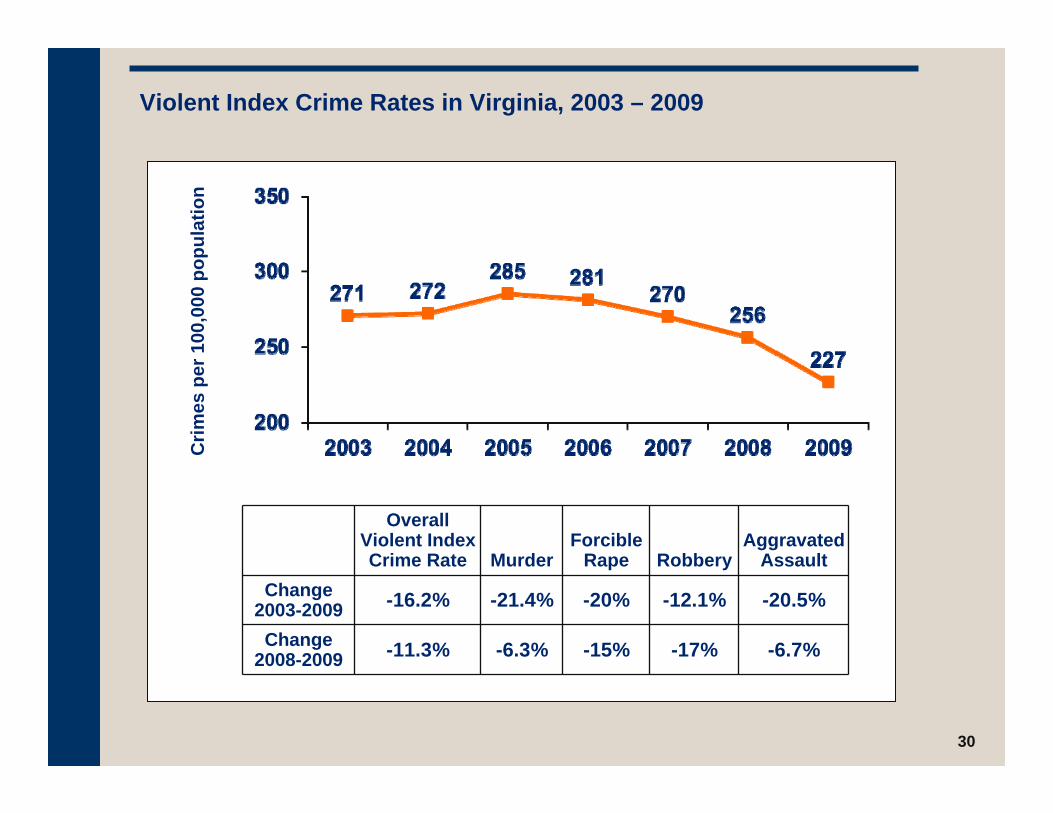
Violent Index Crime Rates in Virginia, 2003 – 2009
Crim
es p
er 1
00,0
00 p
opul
atio
n
Overall Violent Index Crime Rate Murder
Forcible Rape Robbery
Aggravated Assault
Change 2003-2009 -16.2% -21.4% -20% -12.1% -20.5%
Change2008-2009 -11.3% -6.3% -15% -17% -6.7%

31
Property Index Crime Rates in Virginia, 2003 – 2009
Crim
es p
er 1
00,0
00 p
opul
atio
n
Overall Property Index
Crime Rate Burglary Larceny
Motor Vehicle Theft
Change 2003-2009 -8.4% +2.3% -9.01% -40.2%
Change2008-2009 -3.3% -2.7% -2.7% -15.1%
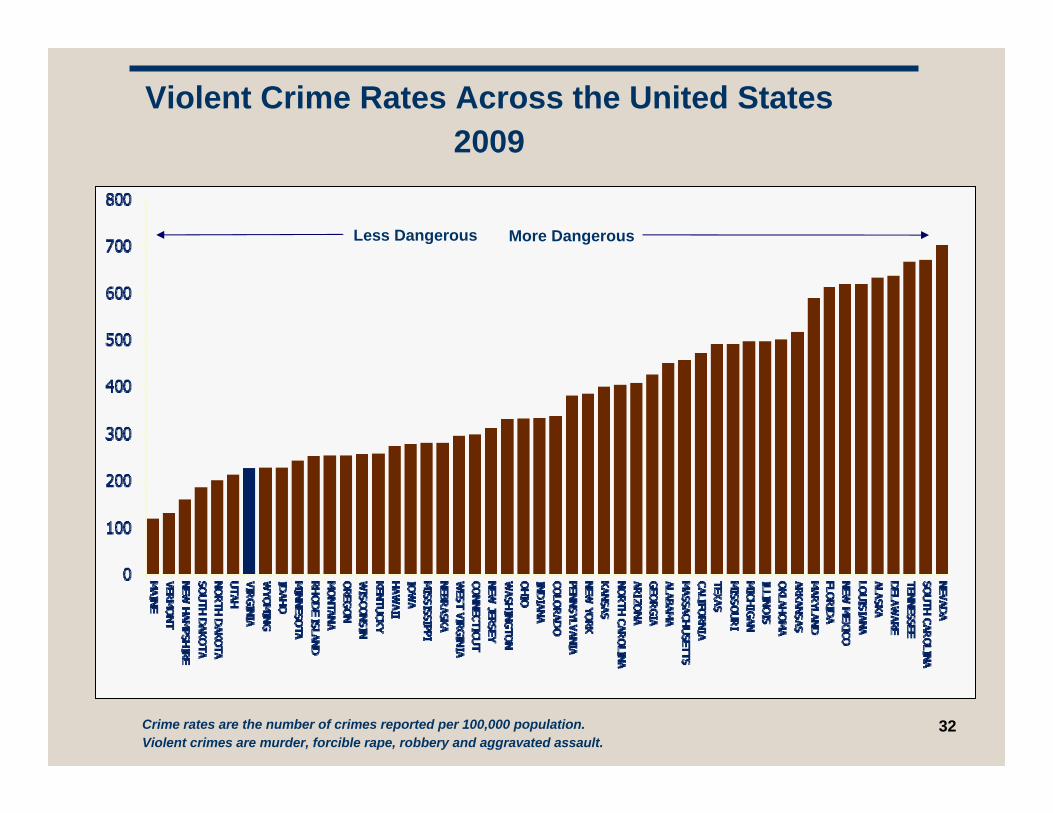
Violent Crime Rates Across the United States2009
More DangerousLess Dangerous
Crime rates are the number of crimes reported per 100,000 population. Violent crimes are murder, forcible rape, robbery and aggravated assault.
32

Property Crime Rates Across the United States2009
More DangerousLess Dangerous
Crime rates are the number of crimes reported per 100,000 population. Property crimes are burglary, larceny-theft, and motor vehicle theft.
33

34
Three Year Re-Imprisonment Rates
Among the 38 states that report felon recidivism as re-imprisonment within three years of release, Virginia ranks in a tie for the fifth lowest recidivism rate.
42.4
%
25.4
%25
.7%
26.4
%27
.9%
28.3
%28
.3%
28.7
%28
.9%
29.2
%
32.7
%34
.4%
36.2
%
37.8
%
38.9
%38
.7%
39%
40%
41%
42.2
%
43.9
%45
%
46.3
%47
.5%
49.4
%49
.8%
51.1
%51
.8%
53.4
% 60.5
%64
% 66%
Ariz
ona
Neb
rask
aFl
orid
aW
est V
irgin
iaA
laba
ma
Virg
inia
Texa
sO
klah
oma
Was
hing
ton
Nev
ada
Sout
h C
arol
ina
Nor
th D
akot
aN
orth
Car
olin
a
Indi
ana
New
Yor
kO
hio
Mas
sach
uset
tsM
inne
sota
Tenn
esse
eLo
uisi
ana
New
Ham
pshi
reM
onta
na
Penn
sylv
ania
Del
awar
e
Ark
ansa
sC
olor
ado
Mis
sour
iIll
inoi
sC
alifo
rnia
Kan
sas
Uta
hA
lask
a
0%
10%
20%
30%
40%
50%
60%
70%
32%
Idah
o
40.8
%M
ichi
gan
45.3
%W
yom
ing
45.8
%N
ew M
exic
o
37%
Geo
rgia
48.8
%W
isco
nsin

Crimes Committed in the Presence of Children

36
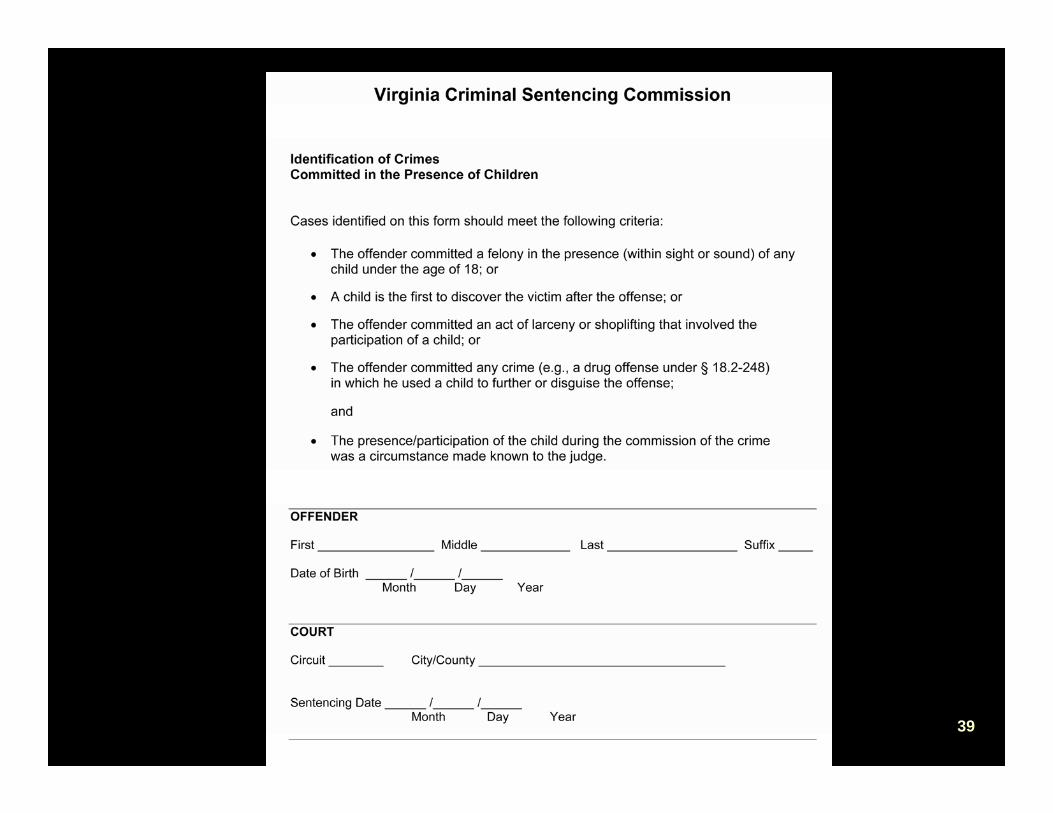
Crimes Committed in the Presence of Children
• Witnessing crimes can have a profound effect on the health and welfare of children
• The Sentencing Commission voted to conduct a comprehensive study of crimes committed in the presence of children

37
Study Objectives
• To identify crimes witnessed by children
• To describe the nature of such crimes
• To determine how courts respond to and utilize information concerning the presence of children during the commission of a crime
• To review the criminal code of other states and identify provisions relating to children as witnesses
Crimes Committed in the Presence of Children

38
• The Sentencing Commission will work cooperatively with the Commonwealth’s Attorneys to identify appropriate cases and gather the necessary information on cases where the crime was committed in the presence of children
Crimes Committed in the Presence of Children
3939
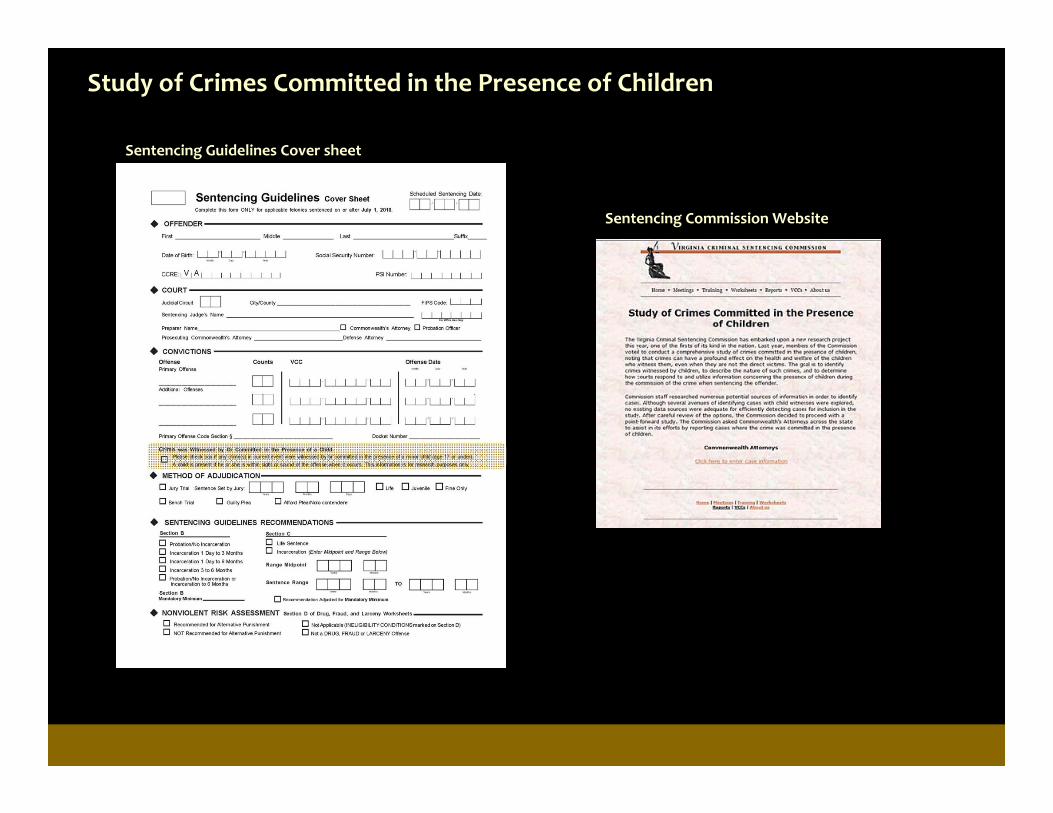
Study of Crimes Committed in the Presence of Children
Sentencing Guidelines Cover sheet
Sentencing Commission Website
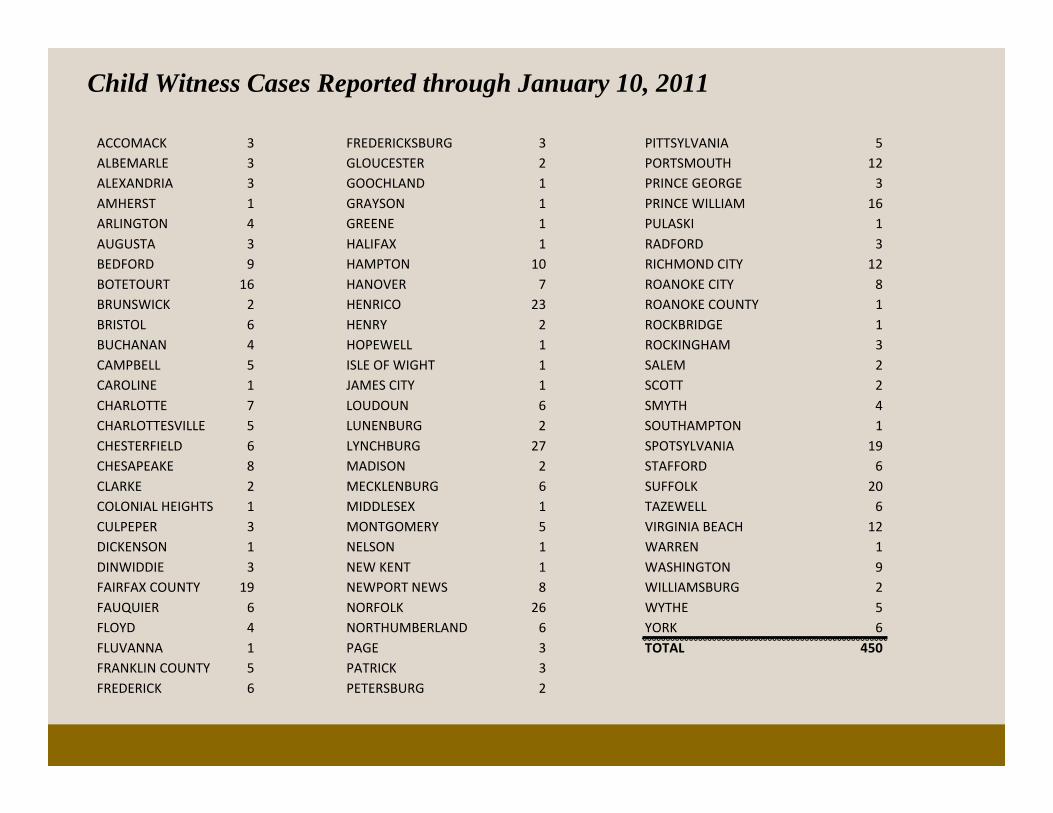
Child Witness Cases Reported through January 10, 2011
ACCOMACK 3 FREDERICKSBURG 3 PITTSYLVANIA 5ALBEMARLE 3 GLOUCESTER 2 PORTSMOUTH 12ALEXANDRIA 3 GOOCHLAND 1 PRINCE GEORGE 3AMHERST 1 GRAYSON 1 PRINCE WILLIAM 16ARLINGTON 4 GREENE 1 PULASKI 1AUGUSTA 3 HALIFAX 1 RADFORD 3BEDFORD 9 HAMPTON 10 RICHMOND CITY 12BOTETOURT 16 HANOVER 7 ROANOKE CITY 8BRUNSWICK 2 HENRICO 23 ROANOKE COUNTY 1BRISTOL 6 HENRY 2 ROCKBRIDGE 1BUCHANAN 4 HOPEWELL 1 ROCKINGHAM 3CAMPBELL 5 ISLE OF WIGHT 1 SALEM 2CAROLINE 1 JAMES CITY 1 SCOTT 2CHARLOTTE 7 LOUDOUN 6 SMYTH 4CHARLOTTESVILLE 5 LUNENBURG 2 SOUTHAMPTON 1CHESTERFIELD 6 LYNCHBURG 27 SPOTSYLVANIA 19CHESAPEAKE 8 MADISON 2 STAFFORD 6CLARKE 2 MECKLENBURG 6 SUFFOLK 20COLONIAL HEIGHTS 1 MIDDLESEX 1 TAZEWELL 6CULPEPER 3 MONTGOMERY 5 VIRGINIA BEACH 12DICKENSON 1 NELSON 1 WARREN 1DINWIDDIE 3 NEW KENT 1 WASHINGTON 9FAIRFAX COUNTY 19 NEWPORT NEWS 8 WILLIAMSBURG 2FAUQUIER 6 NORFOLK 26 WYTHE 5FLOYD 4 NORTHUMBERLAND 6 YORK 6FLUVANNA 1 PAGE 3 TOTAL 450FRANKLIN COUNTY 5 PATRICK 3FREDERICK 6 PETERSBURG 2

WASHINGTON, DC – Last night, the Senate passed H.R. 6412, the “Access to Criminal History Records for State Sentencing Commissions Act of 2010,” by unanimous consent, readying the bill to be signed into law by the President. This bill, introduced by Congressman Robert C. “Bobby” Scott, was passed by the House of Representatives on December 9, 2010 and will make an important change to the law to allow state sentencing commissions direct access to the national database of criminal history record information maintained by the U.S. Department of Justice. State commissions will receive the same type of access to this information already afforded to the United States Sentencing Commission.
Sentencing commissions need the criminal history records maintained at the national level, which includes records of federal offenses and offenses committed in other states. If a state commission has access only to the records of offenses committed in its own state, it lacks the information about offenders it needs to make important policy recommendations and to evaluate the recidivism of offenders who may commit crimes out of state. Providing state sentencing commissions with direct access to national criminal record systems will improve the administration of justice by:
•Enhancing the effectiveness of sentencing decisions and program placements for individual offenders, based on complete and accurate criminal history information; and •Improving evaluation research on sentencing outcomes and program effectiveness, based on large numbers of offenders, in order to better inform policy makers. After Senate passage of H.R. 6412, Congressman Scott stated, “This bill will allow state sentencing commissions access to information they need to develop more accurate and effective sentencing policies. I applaud the cooperation of colleagues on both sides of the aisle which made quick enactment of this important legislation possible.”
Richard Kern, Ph.D., Director of the Virginia Criminal Sentencing Commission stated, “Congressman Scott’s leadership in the passage of H.R. 6412 is greatly applauded by the many sentencing commissions across the nation. In Virginia, the research work of our sentencing commission has been severely constricted due to a lack of legal access to out-of-state criminal history information. Virginia is bordered by five states and the District of Columbia and, as such, this increases the likelihood that offenders may have criminal records outside of Virginia. Consequently, Virginia judges, legislators, and other policy makers may make major decisions based on inaccurate/incomplete information on the convicted felon population. This groundbreaking legislation championed by Congressman Scott will make the important work of all sentencing commissions more accurate and, in turn, make all of our citizens safer.”
12.21.10 | Scott Statement on Final Passage of Access to Criminal History Records for State Sentencing Commissions Act
Proposed Recommendations for Guidelines Revisions
2010 Annual Report
44
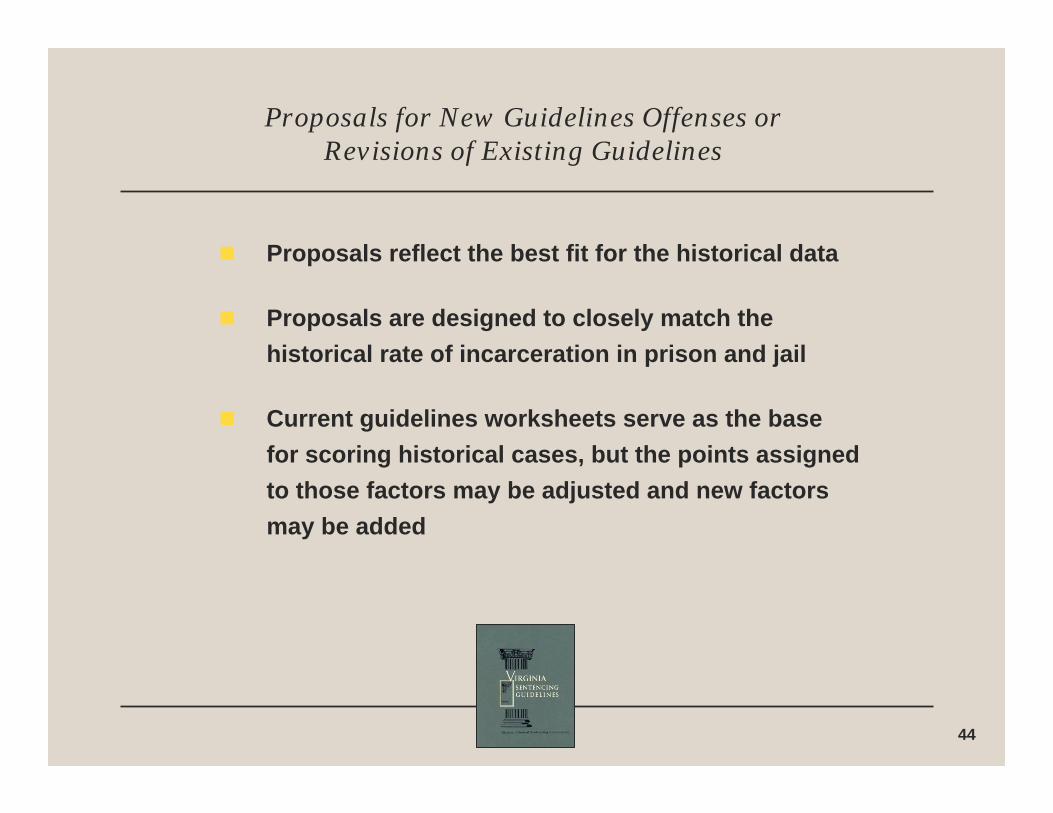
Proposals for New Guidelines Offenses or Revisions of Existing Guidelines
Proposals reflect the best fit for the historical data
Proposals are designed to closely match the historical rate of incarceration in prison and jail
Current guidelines worksheets serve as the base for scoring historical cases, but the points assigned to those factors may be adjusted and new factors may be added
Proposed Recommendation 1:
Modify the Guidelines Instructions to Recommend
Mandatory Minimum Sentences Be Run Consecutively

46
Currently, there are 109 felony and 46 non-felony mandatory minimum sentences defined in the Code of Virginia
Many mandatory minimum penalty statutes specify that a sentence under that particular provision must be run consecutively to the sentences for all other charges; however, not all statutes clearly state this
Mandatory Minimum Sentences in the Code of Virginia
47
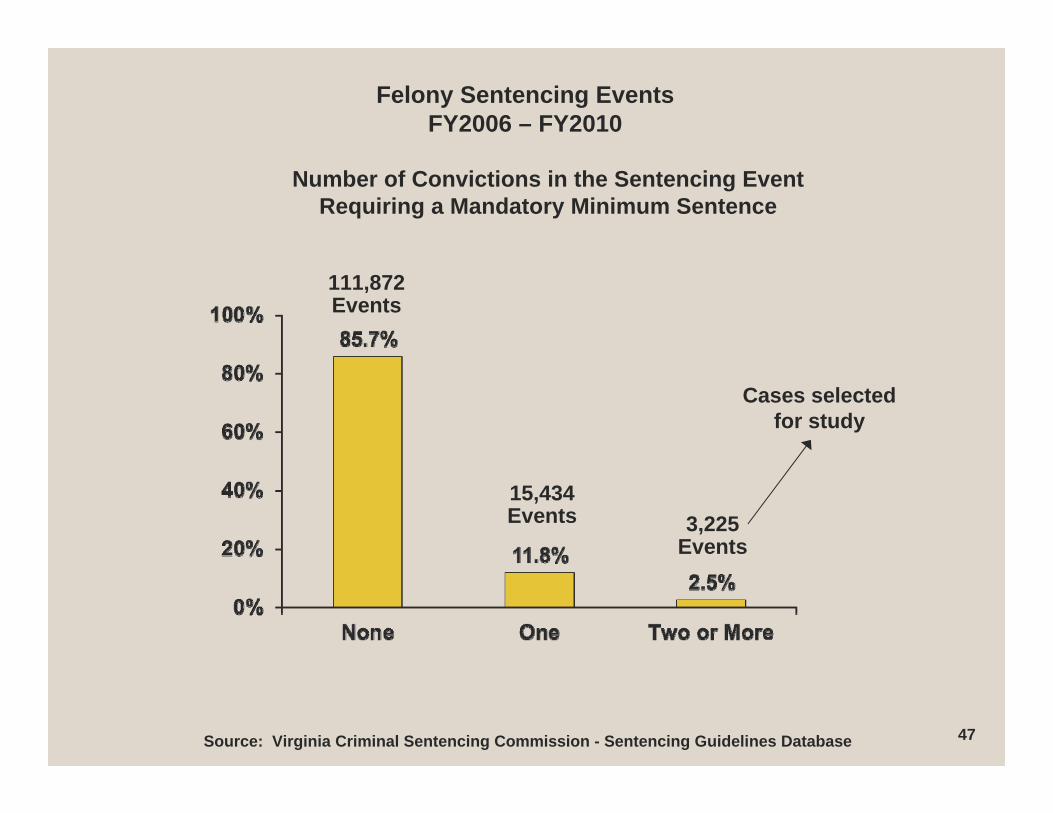
Felony Sentencing EventsFY2006 – FY2010
Number of Convictions in the Sentencing Event Requiring a Mandatory Minimum Sentence
Source: Virginia Criminal Sentencing Commission - Sentencing Guidelines Database
111,872 Events
15,434 Events 3,225
Events
Cases selected for study
48
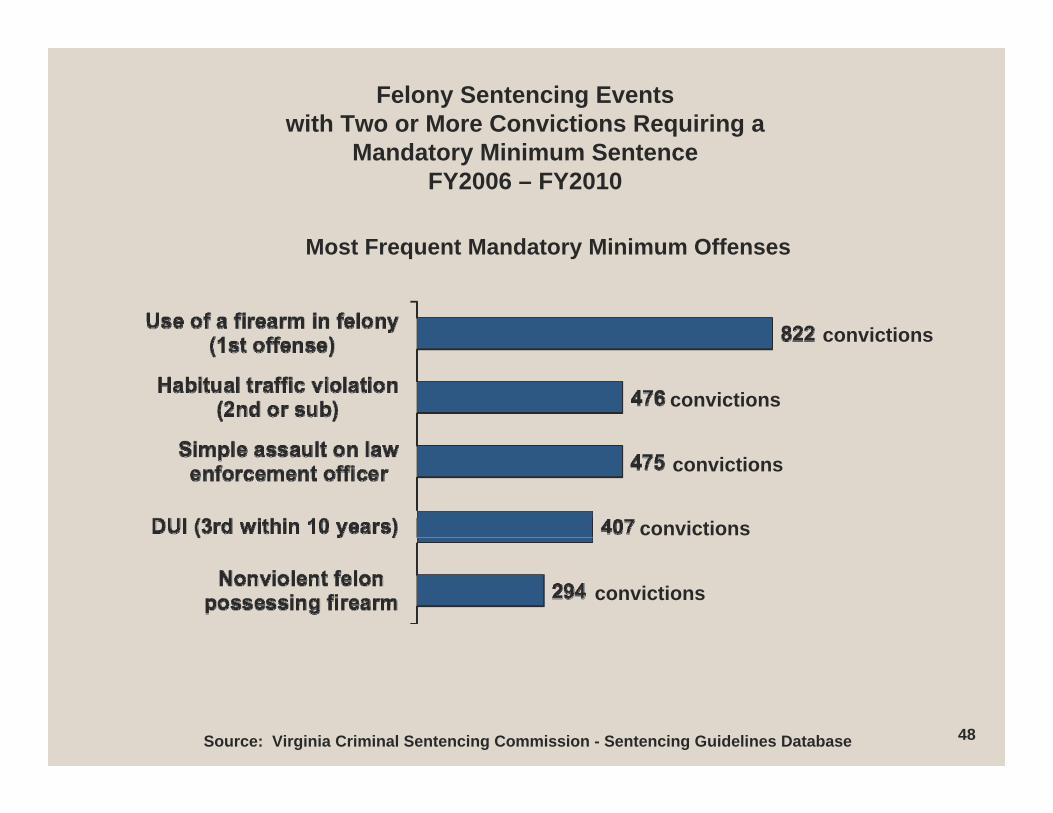
Felony Sentencing Eventswith Two or More Convictions Requiring a
Mandatory Minimum SentenceFY2006 – FY2010
Source: Virginia Criminal Sentencing Commission - Sentencing Guidelines Database
Most Frequent Mandatory Minimum Offenses
convictions
convictions
convictions
convictions
convictions
49
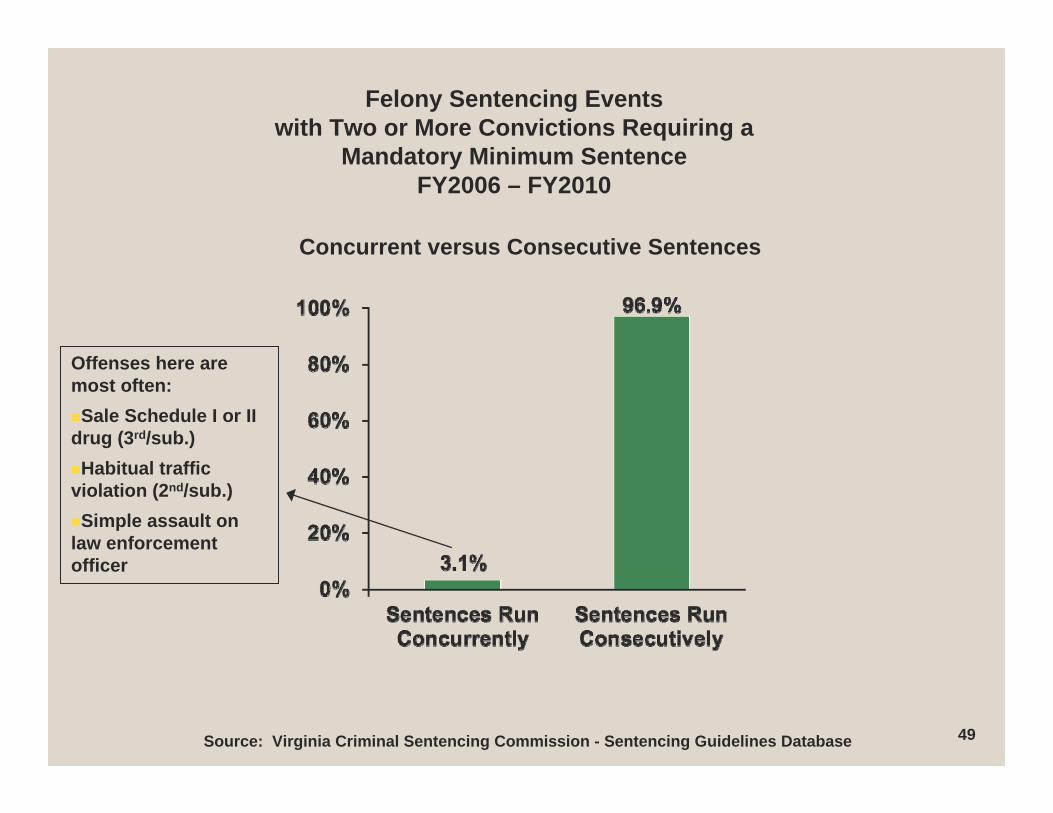
Felony Sentencing Eventswith Two or More Convictions Requiring a
Mandatory Minimum SentenceFY2006 – FY2010
Source: Virginia Criminal Sentencing Commission - Sentencing Guidelines Database
Concurrent versus Consecutive Sentences
Offenses here are most often: Sale Schedule I or II drug (3rd/sub.)Habitual traffic violation (2nd/sub.)Simple assault on law enforcement officer
50
Revise the sentencing guidelines manual to instruct preparers to adjust any part of the guidelines
recommendation that falls below the sentence needed to run all mandatory minimum sentences consecutively
The low, midpoint, and high recommendation must be at least equal to the sentence needed to run the mandatory
sentences consecutively
Proposed Recommendation 1
Proposed Recommendation 2:
Add Sex Offender Registry Violations (§ 18.2-472.1)
to the Miscellaneous Guidelines
52
Currently, Sex Offender Registry violations are not covered by the sentencing guidelines
There are more felony convictions for Sex Offender Registry violations than for any other felony not currently covered by the guidelines
Sex Offender Registry Violations (§ 18.2-472.1)
The General Assembly has revisited Chapter 9 of Title 9.1 (Sex Offender and Crimes Against Minors Registry Act) several times in recent years
In 2006, the General Assembly added to the list of offenses requiring registration and increased the penalties for second Registry violations
In addition, the Code was changed to allow Juvenile and Domestic Relations courts to require a juvenile who has been adjudicated delinquent for a Registry offense to register
Background
53

During the 2007 session, the information required of registrants was expanded and the list of crimes requiring registration was expanded and reorganized
In the 2008 session, the crimes requiring registration were restructured
Background
54

55
Disposition Percent Median Sentence
No Incarceration 34% NA
Incarceration Up to 6 Months 39% 4 Months
Incarceration More than 6 Months 27% 1 Year
Sex Offender Registry Violations (§ 18.2-472.1) FY2008 – FY2009
646 Cases
Note: Data reflect cases in which this offense was the primary (or most serious) offense at sentencing
Source: Supreme Court of Virginia, Circuit Court AutomatedInformation System (CAIS)
56
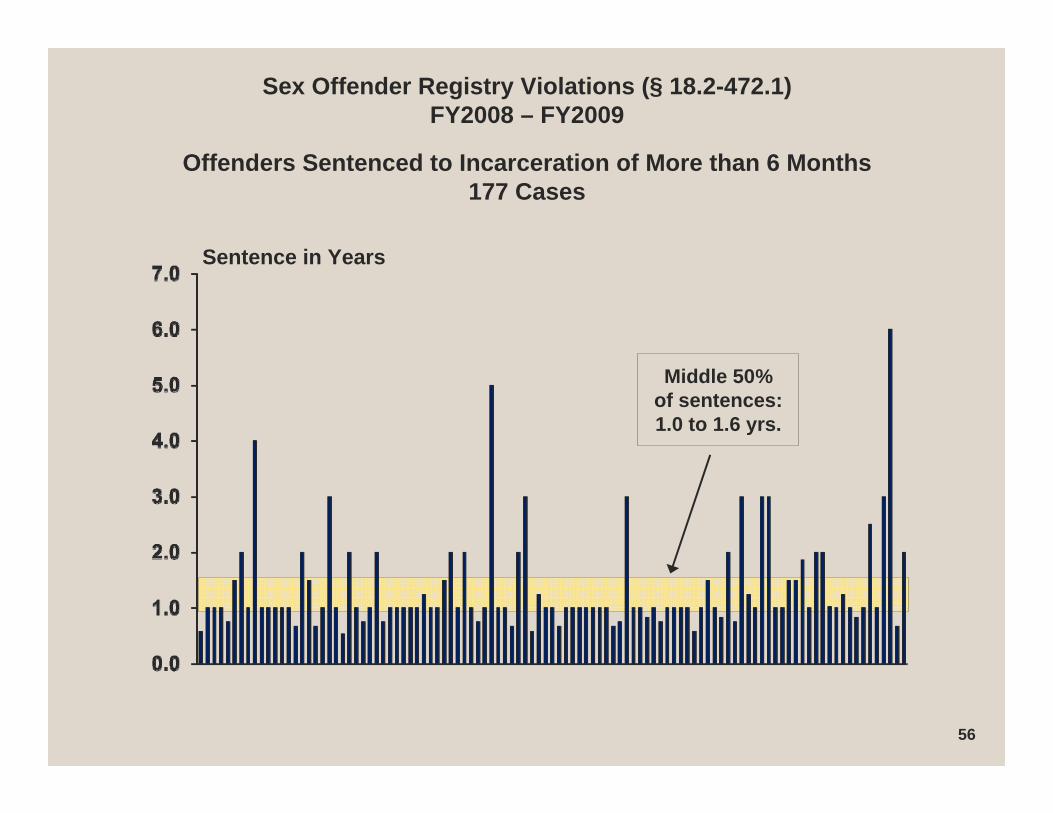
Middle 50% of sentences: 1.0 to 1.6 yrs.
Sex Offender Registry Violations (§ 18.2-472.1)FY2008 – FY2009
Offenders Sentenced to Incarceration of More than 6 Months177 Cases
Sentence in Years

Proposed Recommendation 3:
Revise the sentencing guidelines manual to state that the
amount or value in embezzlement cases is to be scored
based on the amount determined by the trial court.
58
Judges have written to express their concern over the scoring of the embezzlement factor when the indictment is written in a general way (i.e., the amount is greater than $200):
When there is a guilty plea, “there is often a stipulation as to the facts and [scoring the embezzlement factor] is not an issue”
In a jury trial, however, “the jury does not define a specific amount, as their general verdict only indicates whether they make a finding of guilt or innocence”
Factor for Embezzlement Amount

59
According to the judges, “there can be a legitimate dispute between the Commonwealth and the defendant regarding what the amount is for scoring”
“Ironically restitution can be determined by a separate hearing and only requires proof beyond a preponderance of the evidence. But the [guidelines] instructions say that the embezzlement amount is scored based on the amount for which the defendant was convicted, suggesting it has to be the amount for which he was found guilty beyond a reasonable doubt”
Factor for Embezzlement Amount
Proposed Recommendation 4:
Split the Miscellaneous Sentencing Guidelines
into Two Offense Groups

61
Splitting the miscellaneous guidelines into two offense groups will allow for more refined analysis in the future, which could result in improvements to the guidelines for particular offenses
The current proposal does not modify the guidelines scores and will not change the sentence recommendation for any offender
Miscellaneous Sentencing Guidelines
62
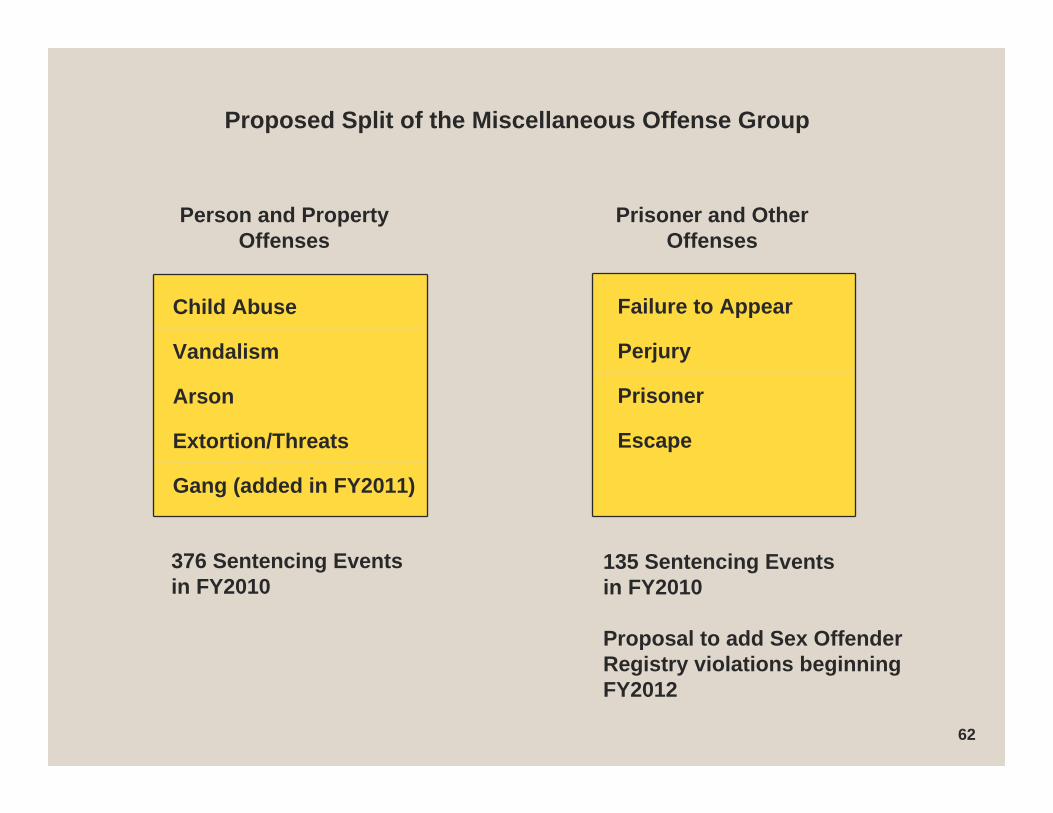
Child Abuse
Vandalism
Arson
Extortion/Threats
Gang (added in FY2011)
Proposed Split of the Miscellaneous Offense Group
Failure to Appear
Perjury
Prisoner
Escape
Person and PropertyOffenses
376 Sentencing Events in FY2010
135 Sentencing Events in FY2010
Proposal to add Sex Offender Registry violations beginning FY2012
Prisoner and OtherOffenses


