26
Virginia Home Sales Report

Virginia Home Sales Report

1
CAAR Home Sales Report
Second Quarter 2021
Charlottesville Area Association of REALTORS®
Market Report Key Takeaways
Economic Conditions In the second quarter of 2021, economic growth continued to expand both statewide and in the
Charlottesville region. The unemployment rate is still falling, though the pace of job growth slowed a bit in May.
Consumer confidence is up strongly in the second quarter, reflecting optimism about the economy and pent-up consumer demand.
Mortgage rates have settled back to around 3% and likely will remain below 3.5% for the rest of the year.
Housing Market Conditions There were 1,533 homes sold in the CAAR footprint during the second quarter, a 30% spike in
activity compared to last year.
Home prices continue to rise in the CAAR area. The second quarter median sales price was $376,000, which is 13% higher than a year ago, a gain of $44,500.
Inventory continues to shrink in the region. There were 621 active listings across the CAAR
footprint at the end of the second quarter, 48% fewer listings than this time last year.
2
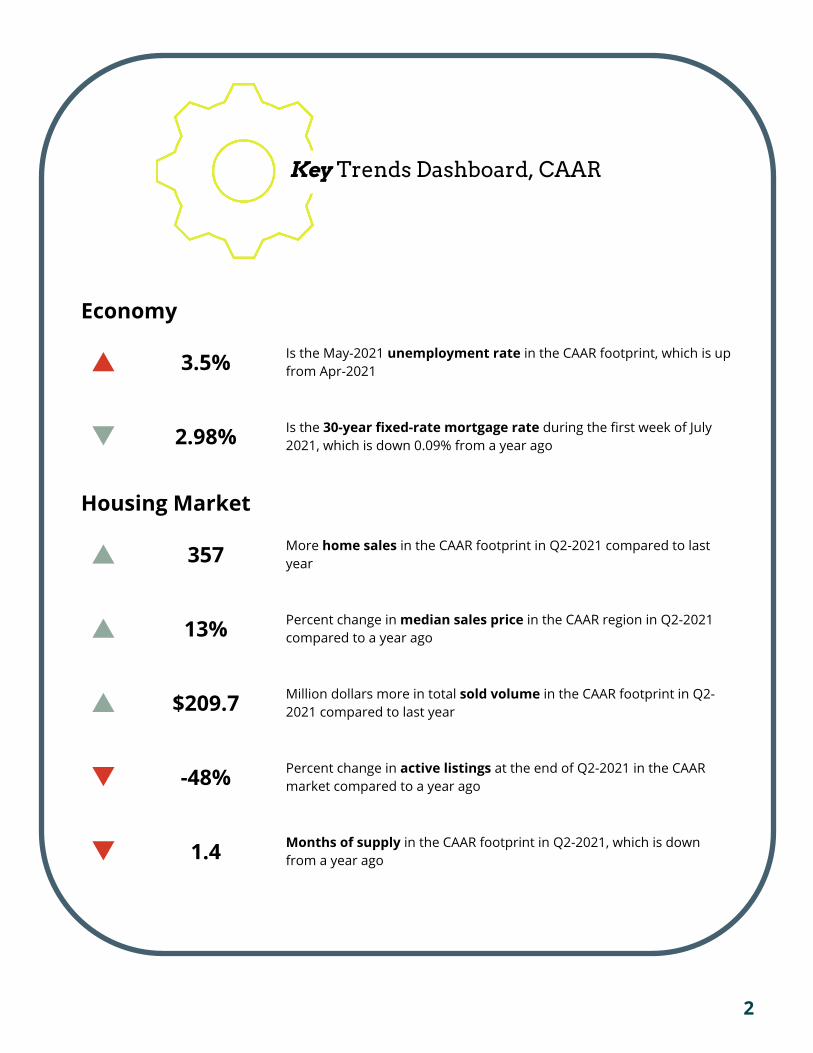
Economy
3.5% Is the May-2021 unemployment rate in the CAAR footprint, which is up from Apr-2021
2.98% Is the 30-year fixed-rate mortgage rate during the first week of July 2021, which is down 0.09% from a year ago
Housing Market
357 More home sales in the CAAR footprint in Q2-2021 compared to last year
13% Percent change in median sales price in the CAAR region in Q2-2021 compared to a year ago
$209.7 Million dollars more in total sold volume in the CAAR footprint in Q2-2021 compared to last year
-48% Percent change in active listings at the end of Q2-2021 in the CAAR market compared to a year ago
1.4 Months of supply in the CAAR footprint in Q2-2021, which is down from a year ago
Key Trends Dashboard, CAAR

3
Economic Overview
Virginia’s economy is opening back up as vaccination rates climb and restrictions have been lifted. There have been job gains across most sectors of the economy. In addition, there is significant pent-up consumer demand in the market, which is a good sign for strong economic growth this year. Even as signs are positive, there remains uncertainty about how COVID-19 will impact the economy over the long-term.
In May 2021, which is the latest data available, there was a total of 3.89 million jobs in Virginia. After several months of job gains, the number of jobs in the state declined slightly between April and May. This slowdown indicates the uncertainty that remains in the economy, although the overall employment picture remains positive in the commonwealth.
The statewide unemployment rate was 4.1% in May 2021. The unemployment rate has fallen significantly from its peak last spring, although it remains higher than pre-pandemic levels. The unemployment rate in the Charlottesville region was 3.5% in May 2021, up slightly from 3.3% in April 2021, but down significantly from the peak of 10%. Like the rest of the state, the region’s economy should continue to improve in 2021 and unemployment likely will fall in the months ahead.
-500
-400
-300
-200
-100
0
100
Figure 1 Virginia Month-to-Month Change in Jobs
Source: U.S. Bureau of Labor Statistics, Seasonally Adjusted
In Thousands

4
New residential construction activity is much higher in the first five months of 2021 than it was in 2020. Between January and May 2021, there was a total of 552 permits issued for the construction of new homes in the Charlottesville metro area, including 400 single-family homes and 152 housing units in multifamily buildings (including duplexes). Compared to the first five months of 2020, housing construction in the region is up 65%, with an increase of 45% in permits for new single-family homes and an increase of 158% in permits for units in multifamily buildings.
The development of new housing in the Charlottesville metro area has shifted slightly to more multifamily housing. Last year, in the first five months of 2020, about 82% of new residential construction permits issued were for single-family homes. In 2021, the single-family share has declined to 72%.
0.0%
2.0%
4.0%
6.0%
8.0%
10.0%
12.0%
14.0%
16.0%
Figure 2Unemployment Rate
May 2021
5.5%4.1%
U.S.VA
CAAR3.5%
Source: U.S. Bureau of Labor Statistics, Local Area Unemployment Statistics

5
Consumer confidence continues to improve into the summer. In June 2021, the measure of confidence in the present economic situation was 161.7, up from 155.6 in May. The measure of consumers’ confidence in future economic conditions rose to 107.2 in June, an increase from May, though below earlier springtime levels. A consumer confidence index above 100 indicates people are feeling more optimistic about economic conditions.
Mortgage rates hit rock bottom levels at the end of last year and into early 2021. Despite a brief uptick in rates in late March and early April, the average 30-year fixed-rate mortgage rate has settled back down to around 3% at the beginning of July. Mortgage rates will rise slightly over the course of the next several months, but it is likely that rates will remain below 3.5% throughout the year.
0
20
40
60
80
100
120
140
2017 2018 2019 2020 2021
Uni
ts
Figure 3Monthly Permits for New Residential Construction
Charlottesville Metropolitan Area*
Single-Family Duplex/Multifamily
Source: U.S. Census Bueau*Charlottesville Metropolitan Area includes Charlottesville City, Albemarle County, Buckingham County, Fluvanna County, Greene County, and Nelson County

6
0.001.002.003.004.005.006.007.008.009.00
Jul-0
1
Jul-0
2
Jul-0
3
Jul-0
4
Jul-0
5
Jul-0
6
Jul-0
7
Jul-0
8
Jul-0
9
Jul-1
0
Jul-1
1
Jul-1
2
Jul-1
3
Jul-1
4
Jul-1
5
Jul-1
6
Jul-1
7
Jul-1
8
Jul-1
9
Jul-2
0
Jul-2
1
Figure 5Mortgage Interest Rates
Weekly Rates, Not Seasonally Adjusted
30-Yr Fixed 15-Yr Fixed 5/1-Yr AdjSource: Federal Reserve Bank of St. Louis
%
0.0
50.0
100.0
150.0
200.0
Figure 4Consumer Confidence
South Atlantic Region
Source: The Conference Board
Present Situation
Expectations

7
Housing Market Overview
It was a very busy spring in the CAAR regional housing market. Sales activity is surging, and home prices continue to rise throughout the footprint, which drove up the sold dollar volume in the region significantly compared to a year ago. Homes are selling much faster compared to last year, and the inventory of active listings is about half the level it was a year ago, though more new listings are being added to the market which should provide more options for buyers. While these quarterly trends continue to point towards market growth, there were some early signs last month that moderation in the market could be on the horizon such as a slowdown in pending sales activity in June.
Sales
There were 1,533 sales across the CAAR footprint in the second quarter of 2021, which is 357 more sales than a year ago, representing a 30% surge. Sales activity increased all three months of the quarter (April through June) compared to last year. It is not surprising that sales this quarter exceeded last year’s second quarter totals when the onset of the pandemic caused a significant market slowdown. Sales activity this quarter in the region is also above pre-pandemic levels; the total number of sales were about 10% higher than the second quarter of 2019. Statewide, the number of home sales in the second quarter was up 30% compared to last year and is 16% higher than second quarter 2019 sales totals.
1,349 1,427 1,3991,176
1,533
0
500
1,000
1,500
2,000
2017 - Q2 2018 - Q2 2019 - Q2 2020 - Q2 2021 - Q2
Sale
s
Figure 6Second Quarter Home Sales, CAAR
2017-2021
+6%-2%
Source: Virginia REALTORS®, data accessed July 15, 2021
+30% -16%

8
Jurisdiction 2020 - Q2 2021 - Q2 % Change
Albemarle County 497 674 36%
Charlottesville 163 197 21%
Fluvanna County 137 167 22%
Greene County 93 91 -2%
Louisa County 214 271 27%
Nelson County 72 133 85%
Source: Virginia REALTORS®, data accessed July 15, 2021
Figure 7 Change in Sales by Jurisdiction
CAAR Second Quarter 2020 to Second Quarter 2021
+22%
+27%
+36%
+85%
-2%
+21%
9
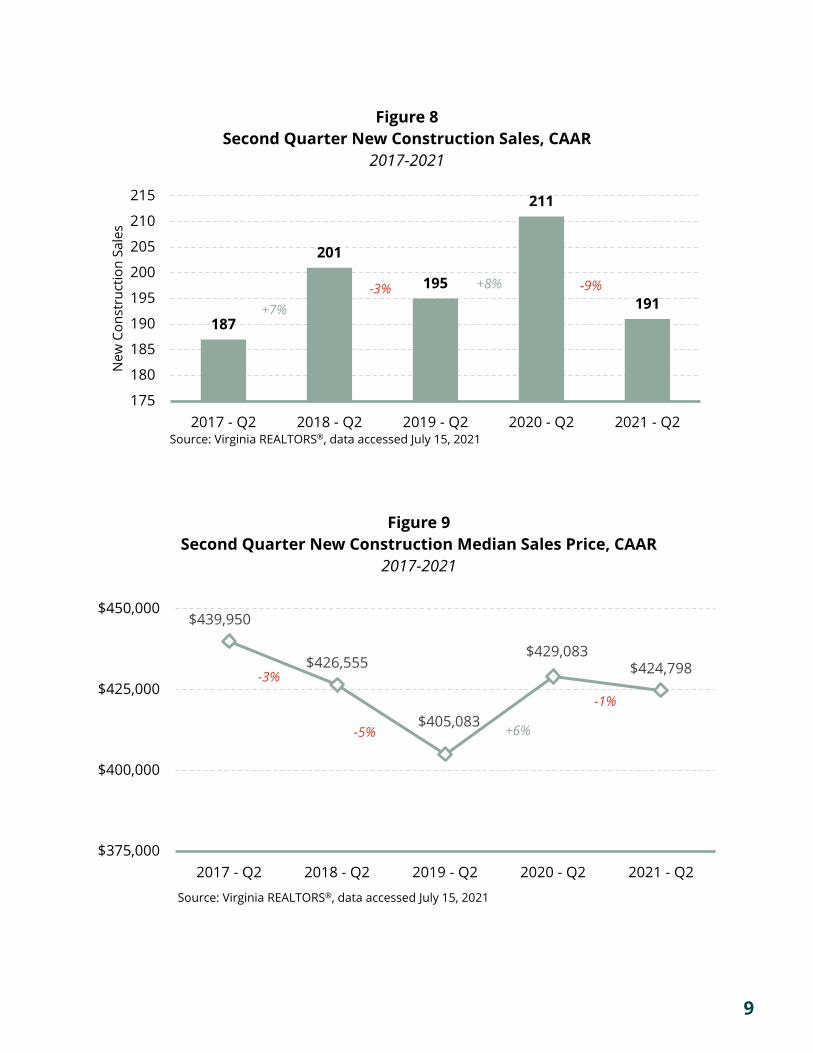
187
201
195
211
191
175
180
185
190
195
200
205
210
215
2017 - Q2 2018 - Q2 2019 - Q2 2020 - Q2 2021 - Q2
New
Con
stru
ctio
n Sa
les
Figure 8Second Quarter New Construction Sales, CAAR
2017-2021
-9%+8%
+7%-3%
$439,950
$426,555
$405,083
$429,083$424,798
$375,000
$400,000
$425,000
$450,000
2017 - Q2 2018 - Q2 2019 - Q2 2020 - Q2 2021 - Q2
Figure 9Second Quarter New Construction Median Sales Price, CAAR
2017-2021
+6%
-1%
Source: Virginia REALTORS®, data accessed July 15, 2021
-5%
-3%
Source: Virginia REALTORS®, data accessed July 15, 2021

10
Sales Prices
Home prices in the CAAR region continue to rise. The second quarter median sales price in the area was $376,000, which is 13% higher than last year, a gain of $44,500. Upward pressure on prices driven by low inventory and active buyers has been consistent in the CAAR market for many years. The second quarter median sales price is now more than $89,000 higher than it was at this time five years ago. In the second quarter, the median sales price statewide was $365,000, up 16% compared to a year ago.
$295,500 $301,000
$318,000$331,500
$376,000
$250,000
$275,000
$300,000
$325,000
$350,000
$375,000
$400,000
$425,000
2017 - Q2 2018 - Q2 2019 - Q2 2020 - Q2 2021 - Q2
Figure 10Second Quarter Median Sales Price, CAAR
2017-2021
+13%
+2%
+4%
+6%
Source: Virginia REALTORS®, data accessed July 15, 2021

11
Jurisdiction 2020 - Q2 2021 - Q2 % Change
Albemarle County $397,750 $432,500 9%
Charlottesville $369,000 $420,000 14%
Fluvanna County $257,500 $285,695 11%
Greene County $301,500 $360,000 19%
Louisa County $260,000 $320,000 23%
Nelson County $260,000 $285,000 10%
Source: Virginia REALTORS®, data accessed July 15, 2021
Figure 11 Change in Median Sales Price by Jurisdiction
CAAR Second Quarter 2020 to Second Quarter 2021
+23%
+10%
+19%
+9%
+14%
+11%

12
17
124
342
307
149
237
22
112
333
391
251
423
0
50
100
150
200
250
300
350
400
450
Sale
sFigure 12
Second Quarter Sales Price Range Distribution - CAAR2020 - Q2 2021 - Q2
7664
46 4756
9484
21 16 20 19
58
0
30
60
90
120
Day
s
Figure 13Second Quarter Average DOM by Sales Price Range - CAAR
2020 - Q2 2021 - Q2
Source: Virginia REALTORS®, data accessed July 15, 2021
Source: Virginia REALTORS®, data accessed July 15, 2021

13
Sold Volume
Climbing prices and surging sales activity pushed up the sold dollar volume significantly this quarter. There was approximately $689.2 million of sold volume in the CAAR housing market during the second quarter, a 44% jump from last year, which is an additional $209.7 million of sold volume. The sold volume has increased in the region’s housing market seven of the last eight quarters. The increase in sold volume this quarter is partially due to the slowdown last spring; however, the sold volume is also 27% above pre-pandemic levels from the second quarter of 2019.
$501.4$532.2 $543.6
$479.5
$689.2
$0
$100
$200
$300
$400
$500
$600
$700
$800
2017 - Q2 2018 - Q2 2019 - Q2 2020 - Q2 2021 - Q2
Mill
ions
($)
Figure 14Second Quarter Sold Dollar Volume (Millions), CAAR
2017-2021
+2%+6%+44%
-12%
Source: Virginia REALTORS®, data accessed July 15, 2021

14
$21.7
$68.0
$29.8
$37.9
$80.9
$241.1
$48.0
$105.9
$31.7
$52.7
$93.2
$357.6
$0 $50 $100 $150 $200 $250 $300 $350 $400
Nelson County
Louisa County
Greene County
Fluvanna County
Charlottesville
Albemarle County
Millions ($)
Figure 15Second Quarter Sold Dollar Volume, CAAR Jurisdictions
2020 and 2021
2021 - Q2
2020 - Q2
Source: Virginia REALTORS®, data accessed July 15, 2021

15
Days on Market
Homes in the CAAR market continue to sell much faster than last year. Homes that sold in the second quarter in the region were on the market about a month on average (29 days), which is about a month faster than a year ago (-29 days). The shrinking supply of homes listed for sale in the area continues to lead to more competition among active buyers in the market, which is causing homes to sell faster, a trend that has been consistent for much of the past several years but has accelerated in recent months. Statewide, homes sold in an average of 22 days in the second quarter, down from 40 days a year ago.
62
52 5558
29
0
15
30
45
60
75
90
2017 - Q2 2018 - Q2 2019 - Q2 2020 - Q2 2021 - Q2
Day
s
Figure 16Second Quarter Average Days on Market, CAAR
2017-2021
Source: Virginia REALTORS®, data accessed July 15, 2021

16
153
61
48
46
35
56
50
20
29
22
12
35
0 20 40 60 80 100 120 140 160 180
Nelson County
Louisa County
Greene County
Fluvanna County
Charlottesville
Albemarle County
Days
Figure 17Second Quarter Average Days on Market, CAAR Jurisdictions
2020 and 2021
2021 - Q2
2020 - Q2
Source: Virginia REALTORS®, data accessed July 15, 2021

17
Inventory
Inventory continues to shrink in the CAAR footprint. There were 621 active listings in the region at the end of the second quarter, about half the number of listings that were available last year (-48%), which is a reduction of 577 listings. The shrinking supply of homes available in the CAAR market continues to be a factor for both buyers and sellers. Some potential buyers, particularly first-time homebuyers, have trouble competing with other buyers due to rising prices and limited options. In addition, would-be sellers also are impacted by the low supply because there are fewer options of homes to move into after they sell, which is causing many to remain in their current homes. These trends are occurring both locally and all throughout the commonwealth. At the end of the second quarter, there was a total of 19,346 active listings on the market statewide, down 18% from a year ago.
There was about 1.4 months of supply at the end of the second quarter in the CAAR footprint, down from 3.3 months a year ago. The months of supply metric is calculated by taking the average monthly sales over the preceding 12-month period and dividing it by the inventory of active listings.
5.75.1
4.9
3.3
1.4
0.0
1.0
2.0
3.0
4.0
5.0
6.0
2017 - Q2 2018 - Q2 2019 - Q2 2020 - Q2 2021 - Q2
Mon
ths
of S
uppl
y
Figure 18End of Second Quarter Months Supply, CAAR
2017-2021
Source: Virginia REALTORS®, data accessed July 15, 2021

18
164
183
78
91
100
582
65
113
56
49
57
281
0 100 200 300 400 500 600 700
Nelson County
Louisa County
Greene County
Fluvanna County
Charlottesville
Albemarle County
Active Listings
Figure 19End of Second Quarter Active Listings, CAAR Jurisdictions
2020 and 2021
2021 - Q2
2020 - Q2
Source: Virginia REALTORS®, data accessed July 15, 2021

19
Sales: There were 674 sales in Albemarle County in the second quarter, 177 more sales than last year, which is a 36% spike. It is not surprising that sales activity this quarter far exceeds last year, when the market slowed down with the onset of the pandemic. Sales activity in the county’s housing market is now slightly above pre-pandemic levels; there were 3% more sales than the second quarter of 2019.
Median Sales Price: At $432,500, the second quarter median sales price in Albemarle County was $34,750 higher than this time last year, representing a 9% gain. Home prices have increased in the county’s housing market for six consecutive quarters.
Sold Volume: There was approximately $357.6 million of sold volume in Albemarle County during the second quarter, a 48% surge from last year, which is an influx of $116.5 million. While the large spike this quarter is partially attributable to the slowdown last spring, the sold volume is also 16% above pre-pandemic levels in the second quarter of 2019.
Days on Market: It took about 35 days on average to sell a home in Albemarle County in the second quarter, which is three weeks faster than this time last year (-21 days).
Inventory: There were 281 active listings at the end of the second quarter in Albemarle County, less than half the supply that was available a year ago (-52%), which is a reduction of 301 listings.
Local Snapshot – Albemarle County

20
Sales: There were 197 sales in Charlottesville during the second quarter, which is 21% more sales than last year, an increase of 34 sales. Similar to other local markets, the large spike in sales activity this quarter compared to last year is partly due to the market slowdown that occurred at the beginning of the pandemic last spring.
Median Sales Price: The second quarter median sales price in Charlottesville was $420,000, jumping up $51,000 from a year ago, which is a 14% gain. Home prices in the city have been surging in recent quarters as buyers remain active in the market and supply is shrinking.
Sold Volume: There was about $93.2 million of sold volume in Charlottesville during the second quarter, rising up 15% from a year ago, which is an increase of about $12.3 million.
Days on Market: The average days on market in Charlottesville in the second quarter was 12 days, which is more than three weeks faster than last year (-23 days). This is the largest drop in this metric in the city since the spring of 2017.
Inventory: There were just 57 active listings in Charlottesville at the end of the second quarter, 43 fewer listings than last year, representing a 43% supply drop.
Local Snapshot – Charlottesville

21
Sales: There were 167 sales in the Fluvanna County housing market in the second quarter, 30 more sales than a year ago, representing a 22% increase. Sales activity has been trending up in the county seven of the last eight quarters, evidence of strong demand in the market.
Median Sales Price: Home prices continue to climb in Fluvanna County. At $285,695, the second quarter median sales price rose 11% from last year, a gain of more than $28,000.
Sold Volume: There was approximately $52.7 million of sold volume in Fluvanna County in the second quarter, a 39% surge in volume, which is an additional $14.8 million over the total this time last year.
Days on Market: Homes continue to sell much faster in Fluvanna County. The average days on market in the second quarter was 22 days, which is 24 days faster than last year.
Inventory: There were 49 active listings in Fluvanna County at the end of the second quarter, 42 fewer listings than a year ago, which is a 46% decline.
Local Snapshot – Fluvanna County

22
Sales: Sales activity continues to be sluggish in Greene County. There were 91 sales in the county in the second quarter, two fewer sales than a year ago, inching down 2%. Sales have been slower than the previous year four out of the last five quarters in the county.
Median Sales Price: At $360,000, the second quarter median sales price jumped up 19% from a year ago, which is a gain of $58,500. This is the largest median price increase the county’s housing market has had of any quarter in more than five years.
Sold Volume: While there were fewer sales than last year, surging home prices led to an increase in the total sold dollar volume this quarter in Greene County. There was about $31.7 million of sold volume in the county in the second quarter, a 6% increase from last year, which is an additional $1.9 million.
Days on Market: Homes that sold in Greene County during the second quarter were on the market about a month on average (29 days), which is about three weeks faster than last year (-19 days).
Inventory: At the end of the second quarter there were 56 homes listed for sale in Greene County, a 28% inventory drop from a year ago, which is a reduction of 22 active listings.
Local Snapshot – Greene County

23
Sales: There were 271 sales in Louisa County during the second quarter, a 27% increase from a year ago, which is 57 more sales. Sales activity has been trending up in the county for a year and a half.
Median Sales Price: The second quarter median sales price in Louisa County was $320,000, a $60,000 surge from last year, representing a 23% price gain. Home prices have been rising rapidly in the county and the median sales price is now $100,000 higher than it was in the second quarter five years ago.
Sold Volume: Surging home prices and more sales drove up the sold dollar volume in the county. There was about $105.9 million of sold volume in Louisa County in the second quarter, 56% more volume than this time last year, which is an increase of $37.9 million.
Days on Market: Homes continue to sell faster in the Louisa County market. At 20 days, the average days on market in the county during the second quarter was 41 days faster than last year.
Inventory: At the end of the second quarter there were 113 active listings on the market in Louisa County, which is 70 fewer listings than last year, a 38% inventory decline.
Local Snapshot – Louisa County

24
Sales: There were 133 sales in Nelson County during the second quarter, an 85% surge in activity from last year, which is an additional 61 sales. It is expected that sales would be much higher than last spring when the beginning of the pandemic triggered a slowdown in the county’s housing market; however, sales activity in the county is also far outpacing pre-pandemic levels, rising 62% above total sales in the second quarter of 2019.
Median Sales Price: The second quarter median sales price in Nelson County was $285,000, a 10% increase from last year, which is a $25,000 price gain. Home prices have been trending up in the county consistently since the beginning of last year.
Sold Volume: Rising prices and the influx of sales led to a huge increase in the sold dollar volume this quarter in Nelson County. There was approximately $48.0 million of sold volume in the county during the second quarter, more than double the volume a year ago (+121%), which is an additional $26.3 million.
Days on Market: It took about 50 days on average to sell a home in Nelson County during the second quarter, which is 103 days faster than last year. This is by far the largest drop in this metric in the county in more than five years and reflects a competitive market for buyers.
Inventory: There were just 65 active listings in Nelson County at the end of the second quarter, 99 fewer listings than last year at this time, which is a 60% supply reduction.
Local Snapshot – Nelson County
25


