Almond Board of California - 1 - 2008 - 2009 Final Research Report Virus Detection for Honey Bees: the IVDS Rosetta Stone Project Project No.: 08-POLL9-Wick Project Leader: David Wick President/CEO BVS, Inc. 1620 Rodgers St., Suite 2 Missoula, MT 59870 (406) 369-4214 e-mail: [email protected]website: www.bvs-inc.us Project Cooperators and Personnel: Dr. Michael Stanford Deputy Team Leader Point Detection Team ECBC AMSRD-ECBC-RT-DD BLDG E3160 5183 Blackhawk Road APG, MD 21010-5424 (410) 436-6887 e-mail: [email protected]Joseph DeRisi Investigator, Howard Hughes Medical Institute Tomkins Chair Department of Biochemistry and Biophysics UC - San Francisco Phone: 415-514-4497 E-mail:[email protected]website: http://derisilab.ucsf.edu Dr. Jeffery Pettis USDA - ARS 10300 Baltimore Avenue Bldg. 476 BARC-EAST Beltsville, MD 20705-0000 (301) 504-7299 e-mail: [email protected]
Transcript
Almond Board of California - 1 - 2008 - 2009 Final Research Report
Virus Detection for Honey Bees: the IVDS Rosetta Stone Project
Project No.: 08-POLL9-Wick Project Leader: David Wick President/CEO BVS, Inc. 1620 Rodgers St., Suite 2 Missoula, MT 59870 (406) 369-4214 e-mail: [email protected] website: www.bvs-inc.us
Project Cooperators and Personnel:
Dr. Michael Stanford Deputy Team Leader Point Detection Team ECBC AMSRD-ECBC-RT-DD BLDG E3160 5183 Blackhawk Road APG, MD 21010-5424 (410) 436-6887 e-mail: [email protected]
Joseph DeRisi Investigator, Howard Hughes Medical Institute Tomkins Chair Department of Biochemistry and Biophysics UC - San Francisco Phone: 415-514-4497 E-mail:[email protected] website: http://derisilab.ucsf.edu
Dr. Jeffery Pettis USDA - ARS 10300 Baltimore Avenue Bldg. 476 BARC-EAST Beltsville, MD 20705-0000 (301) 504-7299 e-mail: [email protected]
Almond Board of California - 2 - 2008 - 2009 Final Research Report
Objectives: BVS, Inc. proposed to develop the translation of Integrated Virus Detection System (IVDS) peak detections that are based on the virus size to a correlation with data outputs from PCD, Virochip and MS/Proteomics to establish virus names to specific peaks in IVDS data. While the IVDS technology is rapid in detection there is no reliable comparison of size to actual associated names of the viruses. All the existing work is generalized to a range of sizes for each virus. The nature of the IVDS instrument brings a very precise sizing for each virus by the virus’ inherent physical properties and the mass charge ratios of IVDS. By working with Bee Alert, The University of San Francisco (DeRisi Lab), Edgewood Chemical and Biological Center (ECBC), and the USDA-ARS lab, BVS will collaborate with the beekeeping industry and with key researchers to provide a translation of the IVDS data to a common terminology that is understood by all. The objectives are to identify specific peaks that are detected by IVDS (Integrated Virus Detection System), and to reliably name these peaks.
Beekeeper samples will be processed at BVS for IVDS virus detections. Samples will be selected for a single common virus in a sample set. Bees rarely contain a single virus; BVS has processes nearly 1500 samples at this date and is seeing that is fairly common to see two to six detections in a single sample. Selected samples that meet the single common virus in the sample set will then be sent to the DeRisi and ECBC labs for identification of all viruses with the expected common virus being identified. This would give a name to a peak. The USDA samples as controls that have named virus loads can then be selected for the confirmations and initial peak matching
Samples with known virus loads are available from the USDA - ARS lab and will be used as one of the control sources of infected bees.
Bees from beekeepers will be processed looking for IVDS peak detections that can be used as isolates for identifications.
Samples will be initially processed at the BVS lab for detections. The samples that are processed at BVS will then be sent to the DeRisi Lab for confirmation using the genomic resources at their lab. A duplicate sample set will be sent to ECBC for confirmation using the IVDS instrument and the proteomic methods and resources at ECBC.
This elimination and identification process can be duplicated for each peak, starting with the most common detections.
Interpretive Summary: BVS has been successful in the assignment of six names to six peaks in the IVDS data. The duplicate and follow on portions of the objectives has not yet been accomplished. Data is still outstanding, but is in progress, but should be completed soon.
Almond Board of California - 3 - 2008 - 2009 Final Research Report
What we have accomplished is significant and has provided groundwork for comparative data from differing technologies. The combination of technologies has provided a means to establish names on the IVDS Peaks. The viruses that we found and associated with peaks are the Deformed Wing Virus (DWV), Kashmir Bee Virus (KBV), Acute Bee Paralysis Virus (ABPV), Black Queen Cell Virus (BQCV), Israeli Acute Paralysis Virus (IAPV), and Sac Brood Virus (SBV). The interpretation of this data has led to a new technology scoring system that should be able to be automated for use with IVDS and to be used on comparative values of virus titers in the same sample and putting IVDS as an analytical/front end tool for PCR and MS/Proteomics. Methods:
Bees were collected by BVS in cooperation of Bee Alert Technologies and beekeepers which were then delivered to BVS, ECBC (Army lab), and the DeRisi lab for processing (The DeRisi samples were sent from the Army to DeRisi).
The bee samples from the USDA were from their own sources.
For IVDS: (standard protocol) 6 grams of bees for each sample, if sample did not have enough bees the whole
sample is processed. Each sample is blended with 100ml of Reverse Osmosis (RO) water and coarse-filtered through single layer cheesecloth.
30ml of the sample is centrifuged for 60 minutes at 20,000 X g. The supernatant is recovered and ultra-filtered through a 300,000 Dalton hollow
fiber filtration system and a 300ml RO wash and reduced to ~ 3ml. The solution is prepped for IVDS by a 1:10 and 1:100 dilutions with Ammonium
Acetate (AA). IVDS scans are a 5 scan average and saved in the IVDS database. Charts and tables are created from the exported data from IVDS.
Samples processed at the USDA, ECBC, and DeRisi labs using polymerase chain reaction (PCR), mass spectrometry (MS)/Proteomics, and Virochip technologies followed existing standard protocols at each of these labs. At least one, typically three technologies on the same sample set were compiled
for IVDS comparison. Samples from different sources were compared for virus detection and
consistency of data interpretation.
Data was compiled and cross-referenced at BVS with the IVDS data for analysis. Each set of data was standardized to format for virus detections. IVDS detections were standardized for a uniform comparison to the detection
data from the other technologies.
Almond Board of California - 4 - 2008 - 2009 Final Research Report
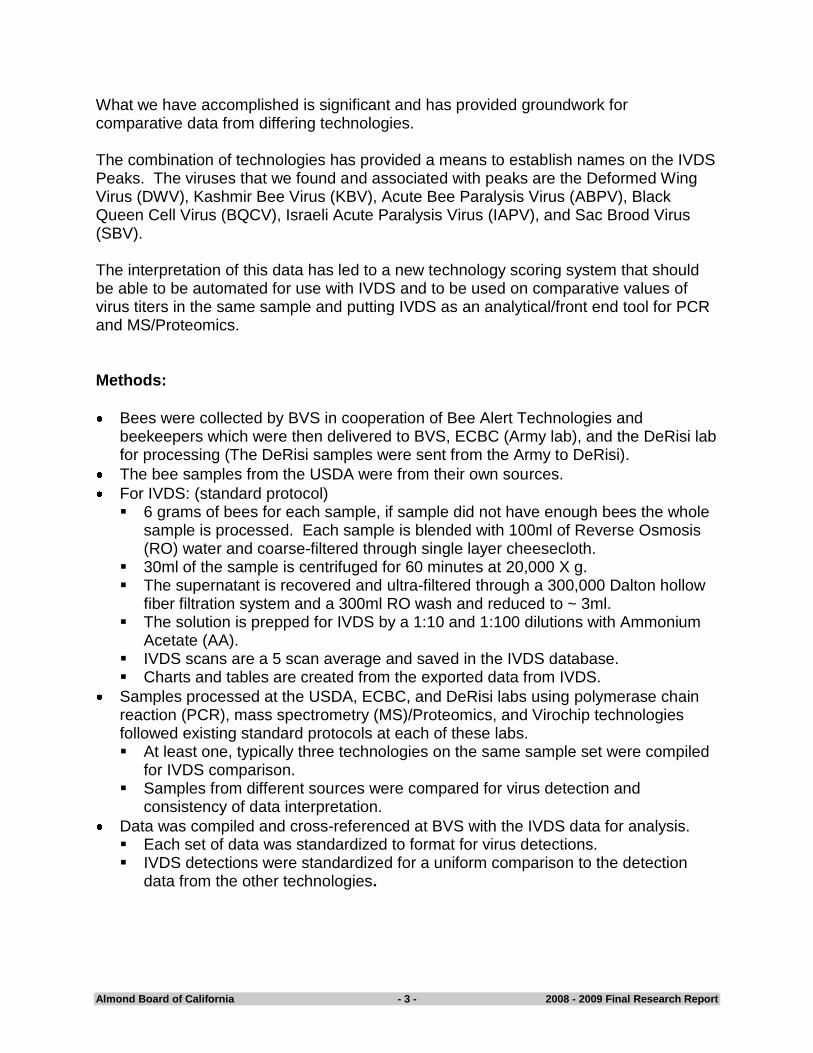
Discussion: The comparison of data from highly technical methodologies and using methods that are novel and new in application on these viruses has proven to be difficult, but we have results that are promising and show correlations between virus size and virus names. The work on honey bee viruses has been documented by Bailey and others in many publications and I will refer to some of these works in analysis of data in this project. The viruses that were common in the technologies used were: Deformed Wing Virus (DWV), Figure 7; Kashmir Bee Virus (KBV), Figure 8; Acute Bee Paralysis Virus (ABPV), Figure 9; Israeli Acute Paralysis Virus (IAPV), Figure 10; Black Queen Cell Virus (BQCV), Figure 11; and Sac Brood Virus (SBV). Others will be mentioned and noted in the data and our observations regarding them. These bee viruses are very closely related in their genetic makeup, in their protein expressions and in their size. The genetic relationship between these viruses is clearly shown by Judy Chen USDA (Journal of Invertebrate Pathology 87, 2004, 84-93) and their differences are slight.
This is the phylogenetic tree developed by J Chen et al. (Journal of Invertebrate Pathology 87, 2004,
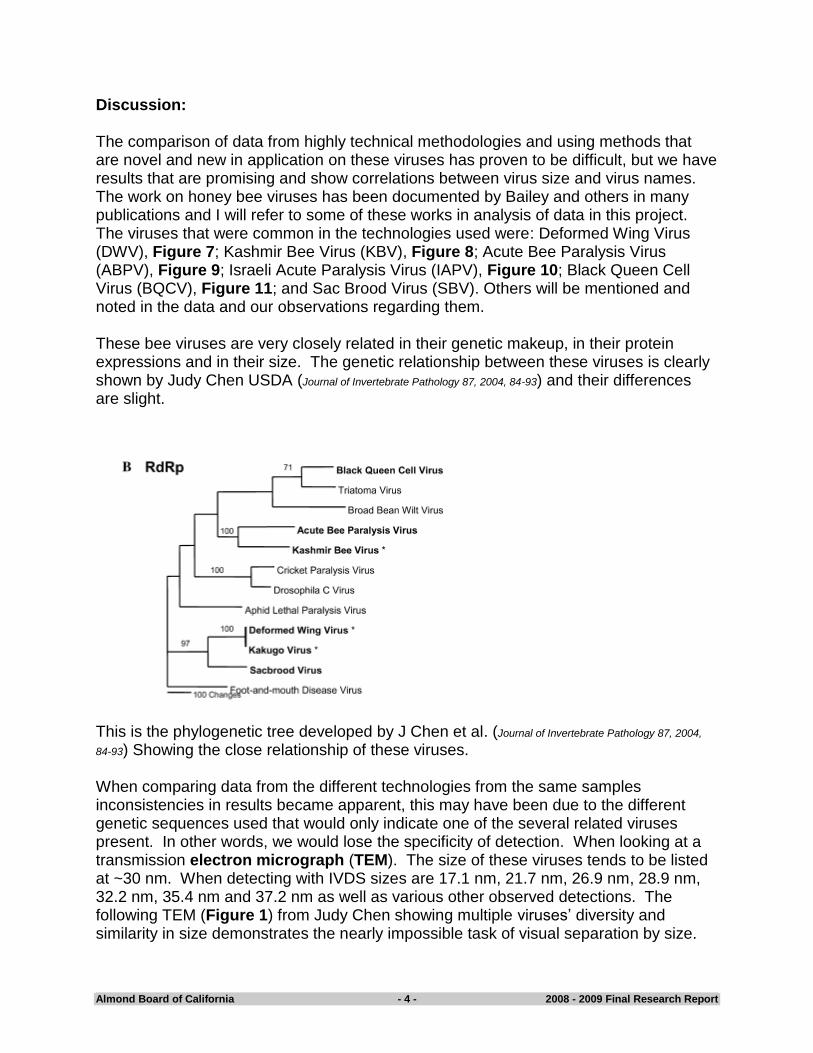
84-93) Showing the close relationship of these viruses. When comparing data from the different technologies from the same samples inconsistencies in results became apparent, this may have been due to the different genetic sequences used that would only indicate one of the several related viruses present. In other words, we would lose the specificity of detection. When looking at a transmission electron micrograph (TEM). The size of these viruses tends to be listed at ~30 nm. When detecting with IVDS sizes are 17.1 nm, 21.7 nm, 26.9 nm, 28.9 nm, 32.2 nm, 35.4 nm and 37.2 nm as well as various other observed detections. The following TEM (Figure 1) from Judy Chen showing multiple viruses’ diversity and similarity in size demonstrates the nearly impossible task of visual separation by size.
Almond Board of California - 5 - 2008 - 2009 Final Research Report
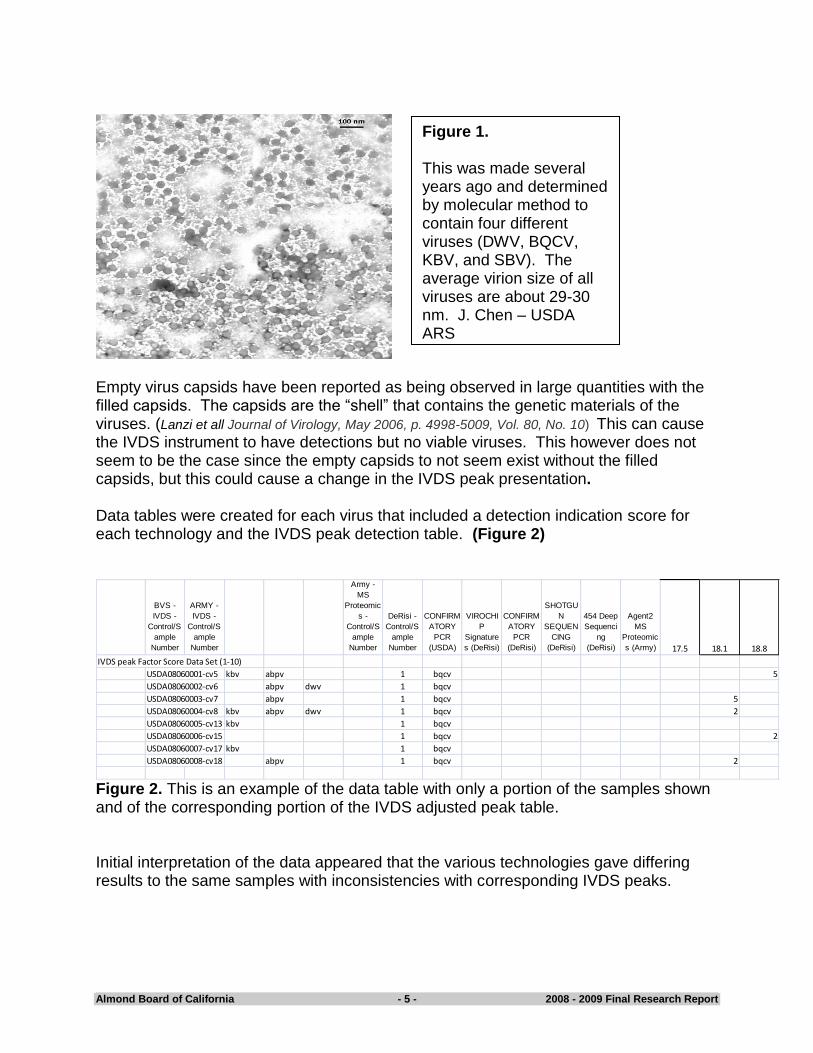
Empty virus capsids have been reported as being observed in large quantities with the filled capsids. The capsids are the “shell” that contains the genetic materials of the viruses. (Lanzi et all Journal of Virology, May 2006, p. 4998-5009, Vol. 80, No. 10) This can cause the IVDS instrument to have detections but no viable viruses. This however does not seem to be the case since the empty capsids to not seem exist without the filled capsids, but this could cause a change in the IVDS peak presentation. Data tables were created for each virus that included a detection indication score for each technology and the IVDS peak detection table. (Figure 2)
BVS -
IVDS -
Control/S
ample
Number
ARMY -
IVDS -
Control/S
ample
Number
Army -
MS
Proteomic
s -
Control/S
ample
Number
DeRisi -
Control/S
ample
Number
CONFIRM
ATORY
PCR
(USDA)
VIROCHI
P
Signature
s (DeRisi)
CONFIRM
ATORY
PCR
(DeRisi)
SHOTGU
N
SEQUEN
CING
(DeRisi)
454 Deep
Sequenci
ng
(DeRisi)
Agent2
MS
Proteomic
s (Army) 17.5 18.1 18.8
IVDS peak Factor Score Data Set (1-10)
USDA08060001-cv5 kbv abpv 1 bqcv 5
USDA08060002-cv6 abpv dwv 1 bqcv
USDA08060003-cv7 abpv 1 bqcv 5
USDA08060004-cv8 kbv abpv dwv 1 bqcv 2
USDA08060005-cv13 kbv 1 bqcv
USDA08060006-cv15 1 bqcv 2
USDA08060007-cv17 kbv 1 bqcv
USDA08060008-cv18 abpv 1 bqcv 2
Figure 2. This is an example of the data table with only a portion of the samples shown and of the corresponding portion of the IVDS adjusted peak table. Initial interpretation of the data appeared that the various technologies gave differing results to the same samples with inconsistencies with corresponding IVDS peaks.
Figure 1. This was made several years ago and determined by molecular method to contain four different viruses (DWV, BQCV, KBV, and SBV). The average virion size of all viruses are about 29-30 nm. J. Chen – USDA ARS
Almond Board of California - 6 - 2008 - 2009 Final Research Report
To understand this discrepancy an understanding of the basis of the technologies had to be understood and that multiple samples, single peaks and symptomatic bees showing a definitive virus relationship are all needed to analyze the data.
Genetic methods work with sequenced amino acid alignments (primers); this is part of the issue with detection of multiple viruses and conflicting results. The primers may not be the same, resulting in no detection or a non- specific detection that only lists the species of virus instead the specific strain.
Proteomic methods are based on the peptide sequence information generated from LC-ESI MS/MS analysis of protein digest. A major advantage of the proteomics method is that no prior knowledge is required of the sample; although, it is obvious that taxa under-represented in the database will not provide a sufficiently high resolution to accurately classify the unknown sample to the strain level. (Dworzanski,
J.P., et all , Journal of Proteome Research, (2006), vol 5, number 1, pp 76-87.)
Both of these technologies are strong and specific, but dependent on factors of the sequencing being known or the sequences being in the data base used.
Either of these or related technologies can only tell if the sequence is there or not. If the virus has broken up or has been incorporated into the bee genetics from exposure to a virus, they will not know if the physical virus is indeed present they will only report the sequence detection. This is useful and documented. The combination with IVDS gives a greater confidence in an actual detection.
IVDS is detecting the presence of the intact virion in the bee based on size of the virion. The limits are the closeness in size of a virion and experience with a know virus. The strength is that IVDS will pick up the detection as a particle of a specific size experience with the viruses will connect the sizes and names such as we have worked on in this project.
Results: Each peak and detection were scored according to confidence of the detection provided by a PCR score or probability score from Proteomics, a score was assigned to IVDS peaks for strength above the salt curve, and a score was assigned to the observed expressed symptoms of a viral infection if known. Since there were multiple viruses in most of the samples I started with a sample that had a known infection of DWV and a single strong peak at 20.9 nm. (Figure 3)
Almond Board of California - 7 - 2008 - 2009 Final Research Report
Bee Test 22A
27.9
20.9
16.3
12.6
0.0
100.0
200.0
300.0
400.0
500.0
600.0
700.0
800.0
900.0
1000.0
1100.0
1200.0
1300.0
1400.0
0 10 20 30 40 50 60 70 80 90 100
Channel Particle Midpoint (nm)
Co
un
ts
Deformed wing virus sample, 4/16/2007, Mitchell
Blender - ~10 bees (1 g) + 100 ml AA, 30-40 s, 2 times
Pre-filter by gravity
Centrifuge in 50 ml tubes at 20,000 rpm/60 min (~40,000 x g)
300K Da UF wash, 60 ml washed w/400 ml DI, 2.5 ml retained
Dilute 1:10 for IVDS
Average of 10 scans
Figure 3. This is one of the first samples we took that had an observed DWV infection and symptoms.
The confirmation by MS/Proteomics showed a peptide sequence for KBV (Figure 4) which is closely related to DWV, and that the sequence in the MS/Proteomics detection was not complete. 2007-08-16-06.2533.2533.2 gi|18640132|ref|NP_570206.1| SPV046 putative NPH-II RNA helicase [Swinepox vi 991.54587 2 K.IDFIINEK.P 2.635
2007-08-16-06.1145.1145.2 gi|55770808|ref|YP_138520.1| major nucleoprotein [Sudan ebolavirus] 988.50580 2 K.EALEKENR.Y 2.634
2007-08-16-06.1945.1945.2 gi|66530257|ref|XP_396670.2| PREDICTED: similar to Lamin CG6944-PA, partial [A 1305.66449 2 R.EVQTTQETITR.E 2.594
2007-08-16-06.1175.1175.2 gi|66512737|ref|XP_396252.2| PREDICTED: similar to Moesin CG10701-PD, isoform 986.56292 2 R.AKLEQEIR.A 2.589
2007-08-16-06.2501.2501.2 gi|48142692|ref|XP_393605.1| PREDICTED: similar to Glyceraldehyde-3-phosphate 833.46281 2 K.IGINGFGR.I 2.589
2007-08-16-06.889.889.2 gi|66505007|ref|XP_623199.1| PREDICTED: similar to Hsc70Cb CG6603-PA, isoform 892.46354 2 R.RVEFEGR.G 2.588
2007-08-16-06.2568.2568.2 gi|110764115|ref|XP_392107.2| PREDICTED: similar to centrosomin CG4832-PA, is 1825.83850 2 K.EMLKNGDYADTIGNER.R 2.585
2007-08-16-06.3182.3182.2 gi|66549815|ref|XP_392869.2| PREDICTED: similar to Larval serum protein 2 CG68 1248.60816 2 K.FYGMYDILAR.D 2.585 Figure 4.
Almond Board of California - 8 - 2008 - 2009 Final Research Report
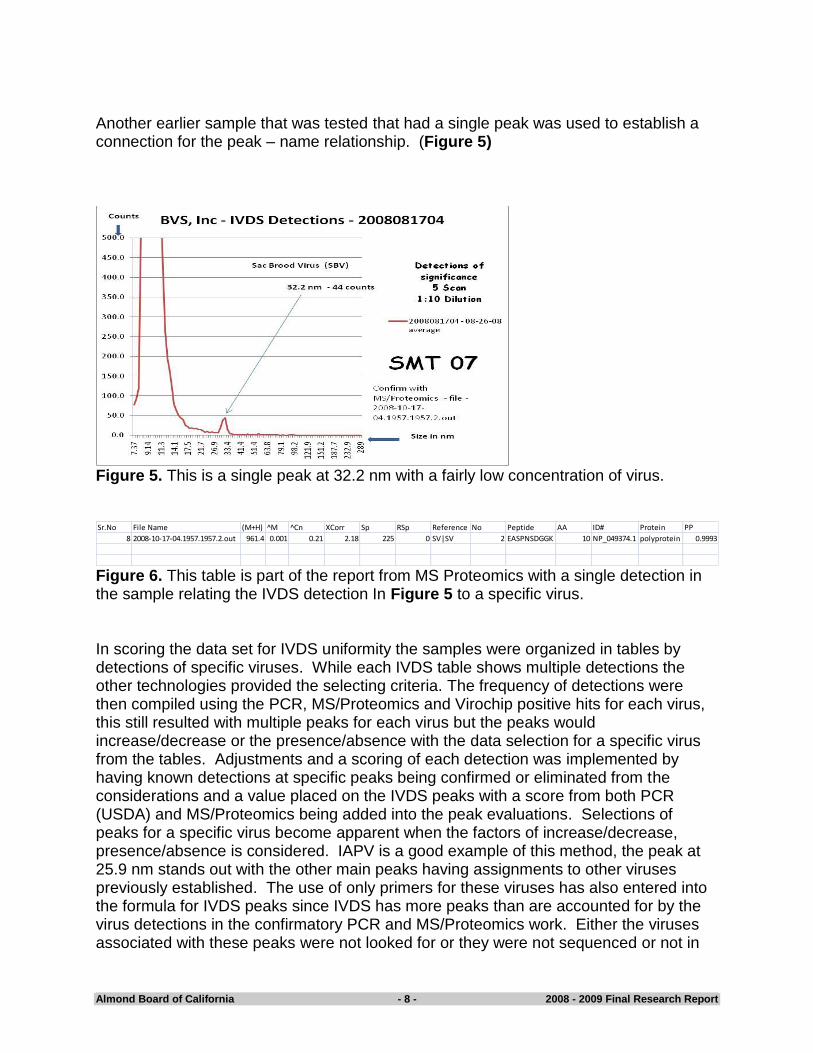
Another earlier sample that was tested that had a single peak was used to establish a connection for the peak – name relationship. (Figure 5)
Figure 5. This is a single peak at 32.2 nm with a fairly low concentration of virus. Sr.No File Name (M+H) ^M ^Cn XCorr Sp RSp Reference No Peptide AA ID# Protein PP
Figure 6. This table is part of the report from MS Proteomics with a single detection in the sample relating the IVDS detection In Figure 5 to a specific virus. In scoring the data set for IVDS uniformity the samples were organized in tables by detections of specific viruses. While each IVDS table shows multiple detections the other technologies provided the selecting criteria. The frequency of detections were then compiled using the PCR, MS/Proteomics and Virochip positive hits for each virus, this still resulted with multiple peaks for each virus but the peaks would increase/decrease or the presence/absence with the data selection for a specific virus from the tables. Adjustments and a scoring of each detection was implemented by having known detections at specific peaks being confirmed or eliminated from the considerations and a value placed on the IVDS peaks with a score from both PCR (USDA) and MS/Proteomics being added into the peak evaluations. Selections of peaks for a specific virus become apparent when the factors of increase/decrease, presence/absence is considered. IAPV is a good example of this method, the peak at 25.9 nm stands out with the other main peaks having assignments to other viruses previously established. The use of only primers for these viruses has also entered into the formula for IVDS peaks since IVDS has more peaks than are accounted for by the virus detections in the confirmatory PCR and MS/Proteomics work. Either the viruses associated with these peaks were not looked for or they were not sequenced or not in
Almond Board of California - 9 - 2008 - 2009 Final Research Report
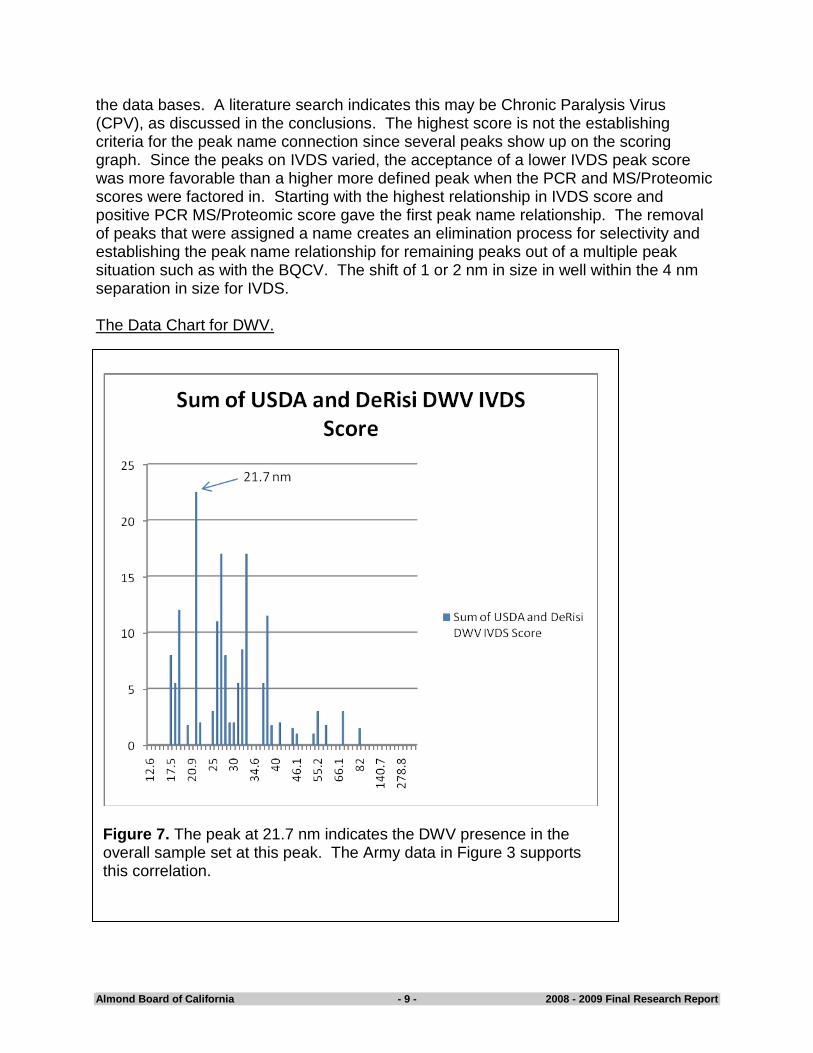
the data bases. A literature search indicates this may be Chronic Paralysis Virus (CPV), as discussed in the conclusions. The highest score is not the establishing criteria for the peak name connection since several peaks show up on the scoring graph. Since the peaks on IVDS varied, the acceptance of a lower IVDS peak score was more favorable than a higher more defined peak when the PCR and MS/Proteomic scores were factored in. Starting with the highest relationship in IVDS score and positive PCR MS/Proteomic score gave the first peak name relationship. The removal of peaks that were assigned a name creates an elimination process for selectivity and establishing the peak name relationship for remaining peaks out of a multiple peak situation such as with the BQCV. The shift of 1 or 2 nm in size in well within the 4 nm separation in size for IVDS. The Data Chart for DWV.
Figure 7. The peak at 21.7 nm indicates the DWV presence in the overall sample set at this peak. The Army data in Figure 3 supports this correlation.
Almond Board of California - 10 - 2008 - 2009 Final Research Report
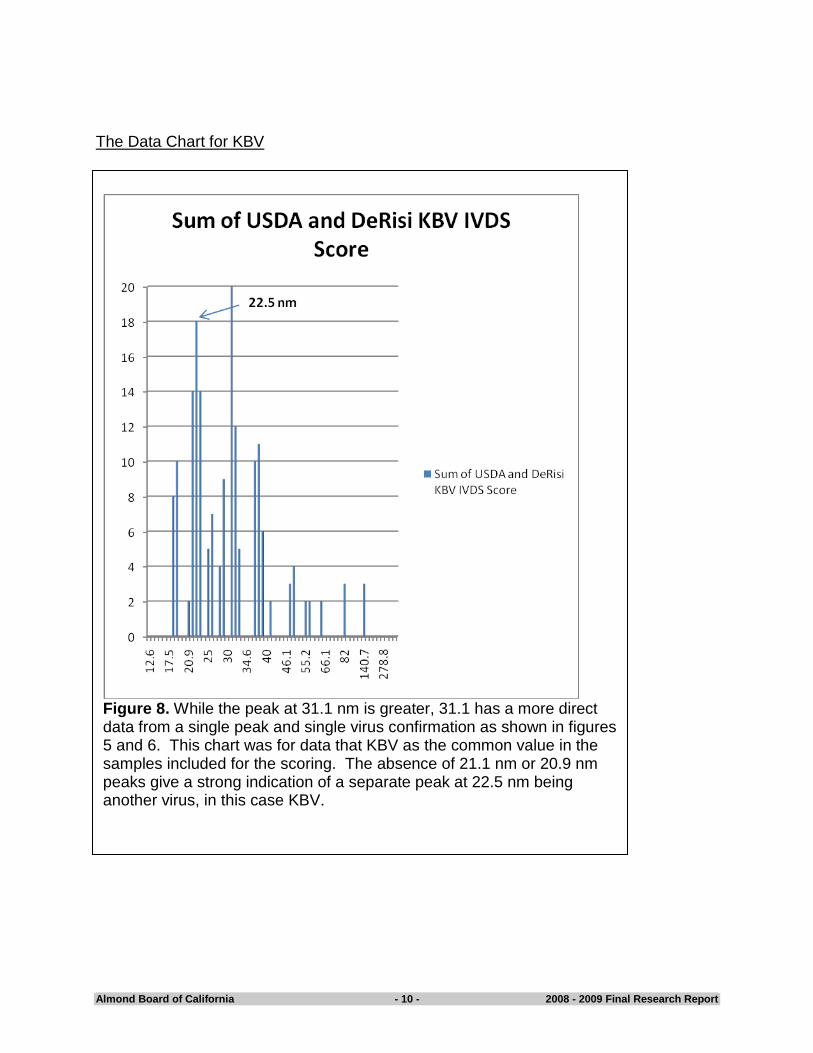
The Data Chart for KBV
Figure 8. While the peak at 31.1 nm is greater, 31.1 has a more direct data from a single peak and single virus confirmation as shown in figures 5 and 6. This chart was for data that KBV as the common value in the samples included for the scoring. The absence of 21.1 nm or 20.9 nm peaks give a strong indication of a separate peak at 22.5 nm being another virus, in this case KBV.
Almond Board of California - 11 - 2008 - 2009 Final Research Report
The Data Chart for ABPV
Figure 9. The assignment of 28.9 nm to ABPV is the process of elimination, literature review and scoring of all the data. While multiple viruses are present, the low peaks in IVDS and the consistence of PCR scores and MS/Proteomic comparisons. ABPV was the lowest scoring of the viruses looked for and mostly a secondary detection in the PCR, MS/proteomics data.
28.9 nm
Almond Board of California - 12 - 2008 - 2009 Final Research Report
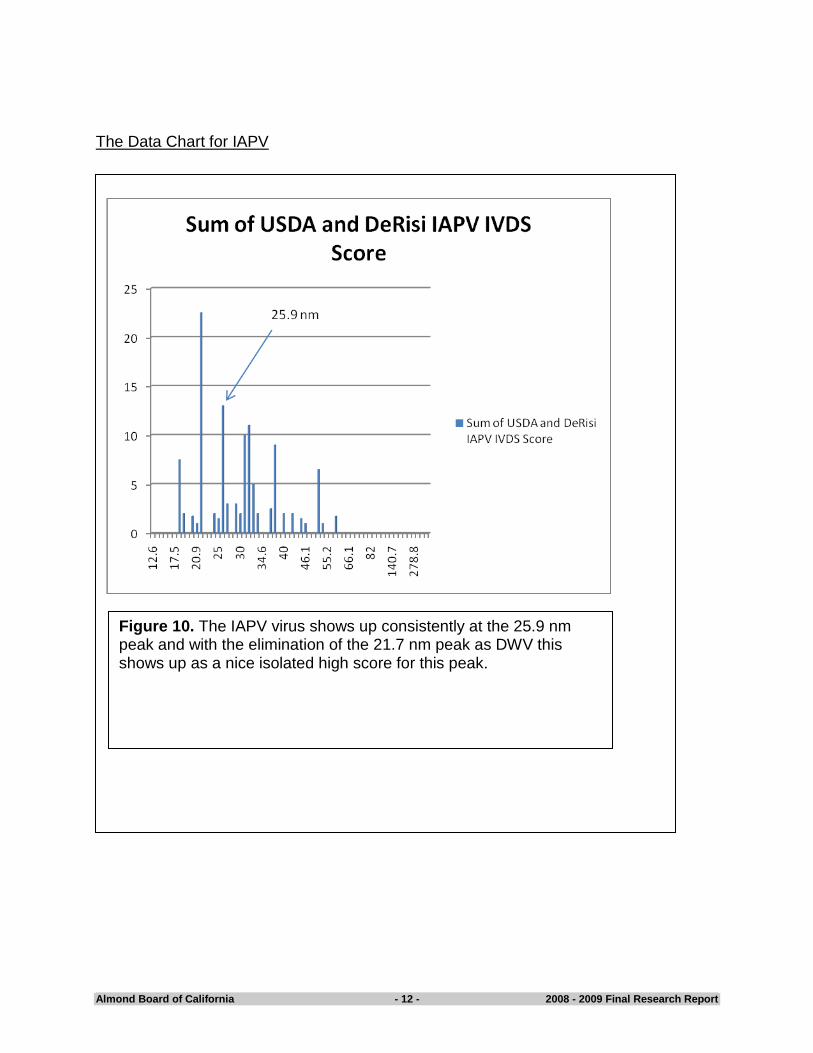
The Data Chart for IAPV
Figure 10. The IAPV virus shows up consistently at the 25.9 nm peak and with the elimination of the 21.7 nm peak as DWV this shows up as a nice isolated high score for this peak.
Almond Board of California - 13 - 2008 - 2009 Final Research Report
The Data Chart for BQCV
Figure 11. Strong and consistent detections and IVDS peaks at 33.4 would indicate a correlation with BQCV. The closeness with 32.2 nm but much higher score at 33.4 does separate the two viruses. While these two viruses are not closely related gnomically of this virus set they are closely related in size. The USDA data had very little SBV in its data and DeRisi had more the MS/Proteomic singled out SBV at 32.2 nm.
Almond Board of California - 14 - 2008 - 2009 Final Research Report
Conclusions: The data derived from the three sources has given IVDS a basis to name calling at peak detections.
DWV at 21.7 nm
KBV at 22.5 nm
ABPV at 28.9 nm
IAPV at 25.9 nm
BQCV at 33.4 nm
SBV at 32.2 nm There are two other peaks that show up in the IVDS data set that does not show up in the other technologies, perhaps because they are not looking for them or that they do not have the primers for them. The peaks at 17.5 to 18.8 may be a single virus that the many sources of literature refer to as a satellite virus. This virus consistently shows up as detection in IVDS. It seems to be associated with Chronic Paralysis Virus (CPV) which a literatures search shows CPV to be an ellipsoidal virus of 30, 40, 55, and 65 nm IVDS has detections of a broad peak that ranges from 40 to 70 nm and is found in some beekeeper samples although it is not confirmed. The peak at 37.2 nm may be Bee X Virus that is also associated with CPV. This is work that still needs to be conducted and comparative analysis done with the other technologies. The collection of bees and cross referencing the data to PCR and MS/proteomics was not a rapid as I thought it would be. There are still many sample data sets that have not been returned to BVS at this time. These are more specific and targeted samples looking at specific viruses. Confirmations of these IVDS detections should fall within the existing data used in this report and will correlate with the named peaks. I hope to have the rest of the data processed and ready for the meeting in October. Publications: There is a publication on this report being written, we are waiting for the rest of the sample data. IVDS is a broad based virus detector that now has names to some of the peaks. Acknowledgements: My thanks to the USDA ARS lab for sending me samples and answering my questions, specifically to Judy Chen, Jay Evans and Jeff Pettis, My Thanks to The Army lab at ECBC and Pat McCubbin, Charles Wick, Samir Deshpande, Rabih Jabbour and Michael Stanford. And my thanks to the Joe DeRisi Lab and to Joe. My thank to the Almond Board of California for this step forward in technology for honey bees, without your support this project would not have been feasible.