VLF sub-ionospheric signals and VLF sub-ionospheric signals and Earthquake precursor signatures? Earthquake precursor signatures? Results from the studies of some Results from the studies of some recent Earthquakes recent Earthquakes Ajeet K Maurya, Rajesh Singh, B. Veenadhari Indian Institute of Geomagnetism New Panvel, Navi Mumbai – 410218, India The Sharjah-Stanford AWESOME VLF Workshop Feb The Sharjah-Stanford AWESOME VLF Workshop Feb 22-24, 2010 22-24, 2010
Transcript
VLF sub-ionospheric signals and Earthquake VLF sub-ionospheric signals and Earthquake precursor signatures? Results from the studies precursor signatures? Results from the studies of some recent Earthquakesof some recent Earthquakes
Ajeet K Maurya, Rajesh Singh, B. VeenadhariIndian Institute of Geomagnetism
New Panvel, Navi Mumbai – 410218, India
The Sharjah-Stanford AWESOME VLF Workshop Feb 22-24, 2010The Sharjah-Stanford AWESOME VLF Workshop Feb 22-24, 2010
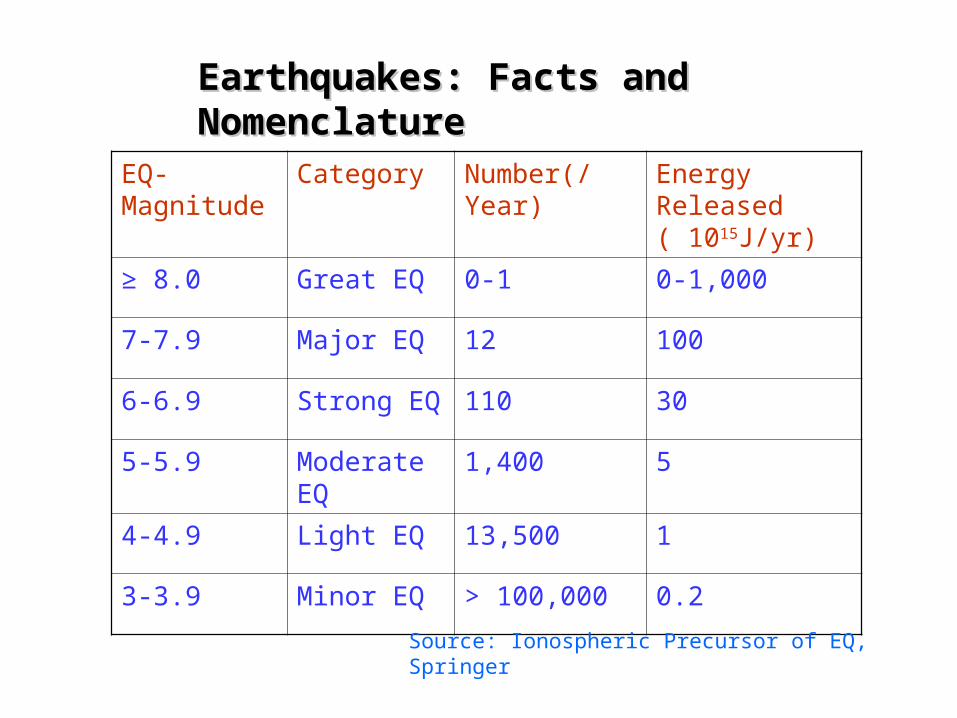
Earthquakes: Facts and NomenclatureEarthquakes: Facts and Nomenclature
EQ-Magnitude
Category Number(/Year) Energy Released ( 1015J/yr)
≥ 8.0 Great EQ 0-1 0-1,000
7-7.9 Major EQ 12 100
6-6.9 Strong EQ 110 30
5-5.9 Moderate EQ 1,400 5
4-4.9 Light EQ 13,500 1
3-3.9 Minor EQ > 100,000 0.2
Source: Ionospheric Precursor of EQ, Springer
People who live in a seismically active region of the world would like to know when an earthquake will occur
But Earthquake are notorious for striking suddenly.
They cause death and devastation apparently without warning
Tens of thousand of lives and damage to the structures and infrastructures could be saved, if early warning are available
Earthquake prediction: A Challenge for Scientific Earthquake prediction: A Challenge for Scientific communitycommunity
In last couple of decades scientific community is trying to investigate problem of earthquake prediction by looking into:
(i) Are there other signals that rock produce when subjected to ever increasing stress?
(ii) If such signals are produced at depth, can they be transmitted or somehow carried from the seismogenic region to region of the earth?
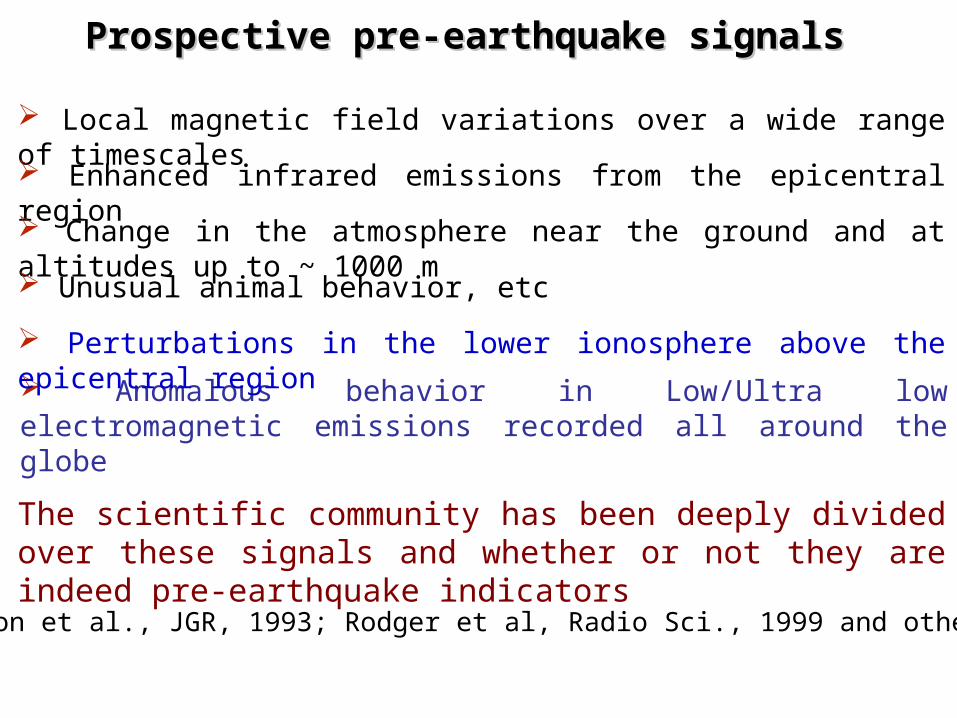
Anomalous behavior in Low/Ultra low electromagnetic emissions recorded all around the globe
Local magnetic field variations over a wide range of timescales
Enhanced infrared emissions from the epicentral region
Change in the atmosphere near the ground and at altitudes up to ~ 1000 m
Unusual animal behavior, etc
Perturbations in the lower ionosphere above the epicentral region
The scientific community has been deeply divided over these signals and whether or not they are indeed pre-earthquake indicators
(Henderson et al., JGR, 1993; Rodger et al, Radio Sci., 1999 and others)
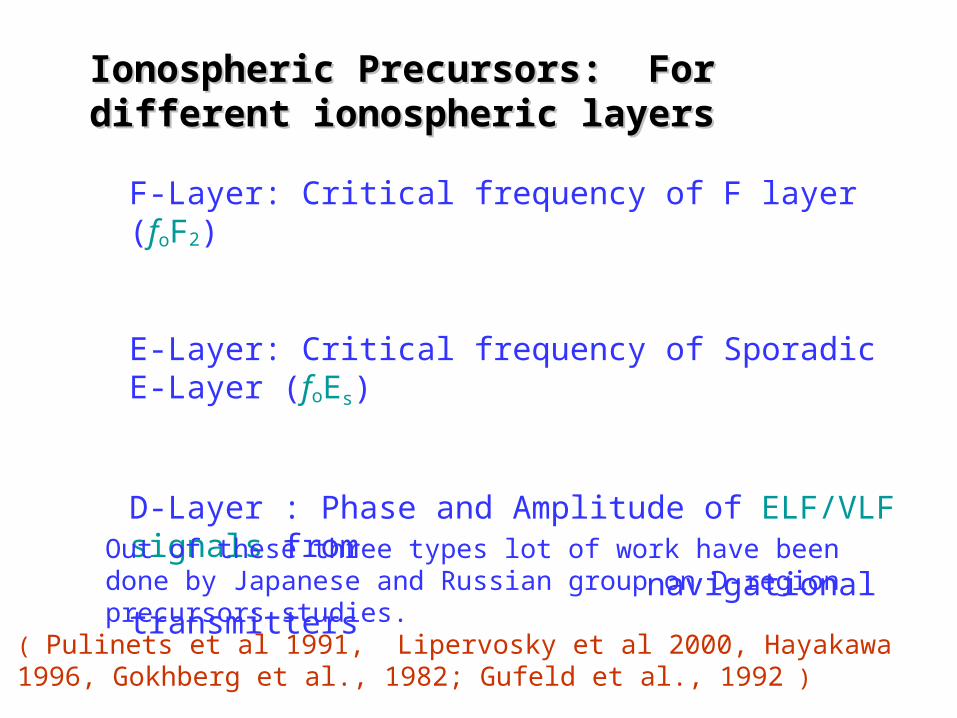
Ionospheric Precursors: For different ionospheric Ionospheric Precursors: For different ionospheric layerslayers
F-Layer: Critical frequency of F layer (foF2)
E-Layer: Critical frequency of Sporadic E-Layer (foEs)
D-Layer : Phase and Amplitude of ELF/VLF signals from navigational transmitters
Out of these three types lot of work have been done by Japanese and Russian group on D-region precursors studies.
( Pulinets et al 1991, Lipervosky et al 2000, Hayakawa 1996, Gokhberg et al., 1982; Gufeld et al., 1992 )
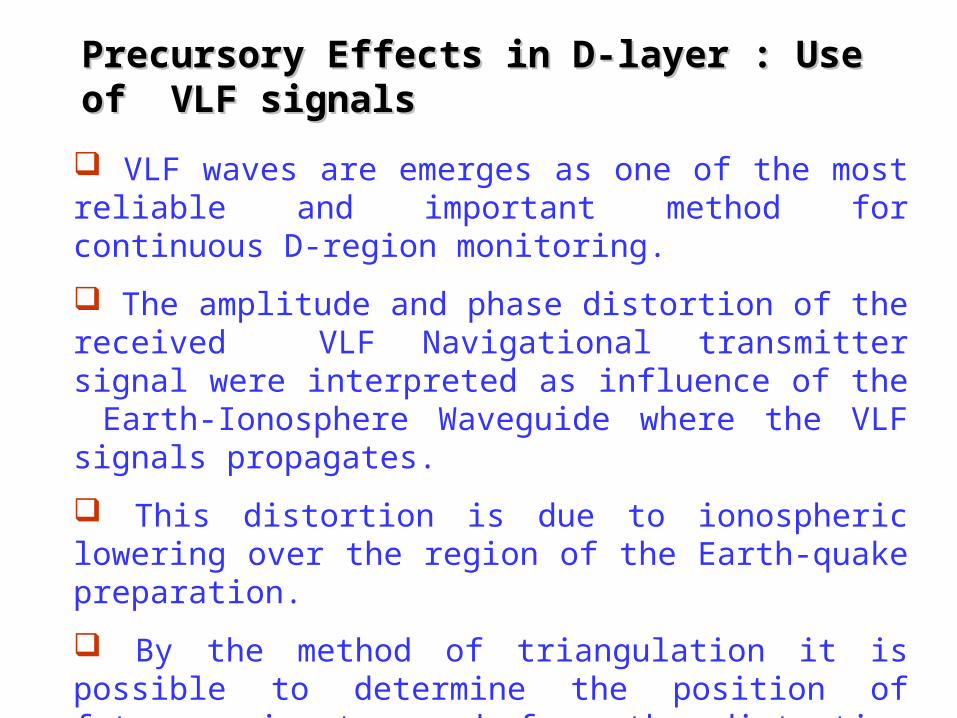
Precursory Effects in D-layer : Use of VLF signalsPrecursory Effects in D-layer : Use of VLF signals
VLF waves are emerges as one of the most reliable and important method for continuous D-region monitoring.
The amplitude and phase distortion of the received VLF Navigational transmitter signal were interpreted as influence of the Earth-Ionosphere Waveguide where the VLF signals propagates.
This distortion is due to ionospheric lowering over the region of the Earth-quake preparation.
By the method of triangulation it is possible to determine the position of future epicenter and form the distortion amplitude to determine the EQ magnitude.
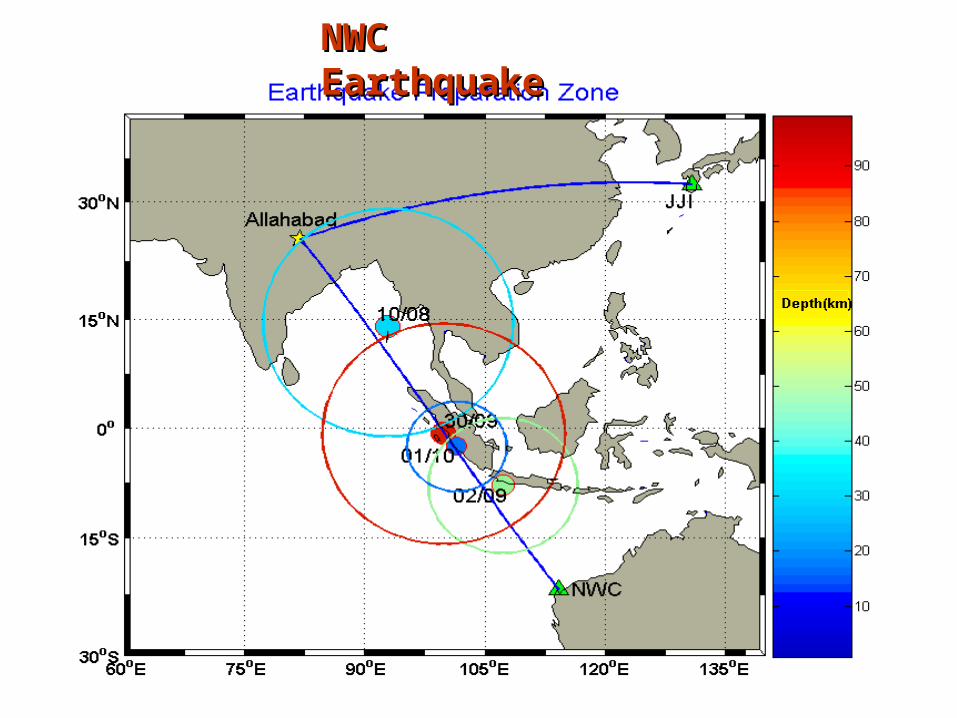
Earthquake Preparation ZoneEarthquake Preparation Zone
The area on the ground surface where precursory phenomenon associated with the approaching Earthquake are observed. It is also called the activation zone
The radius of preparation zone is given as :
M43.010 Km
Where ρ=radius of preparation zone, M= Earthquake magnitude
(Dobrovolsky et al 1979)
Primarily two methods of analysis is proposed using Primarily two methods of analysis is proposed using sub-ionospheric VLF data to make out precursory sub-ionospheric VLF data to make out precursory effects of ionospheric perturbationseffects of ionospheric perturbations
Terminator time method
Night time fluctuation method
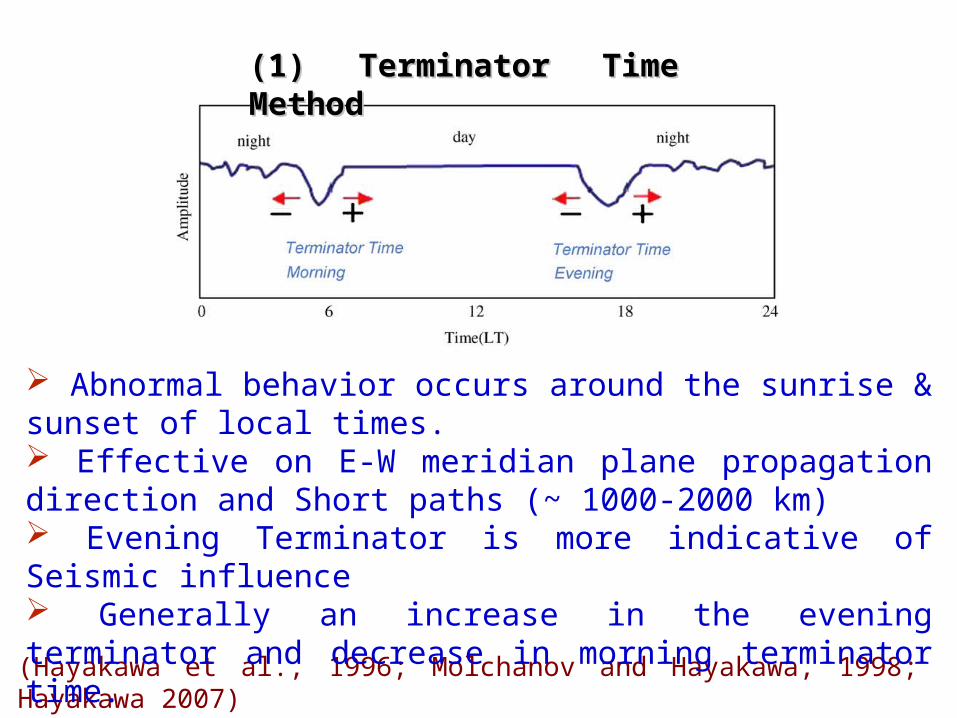
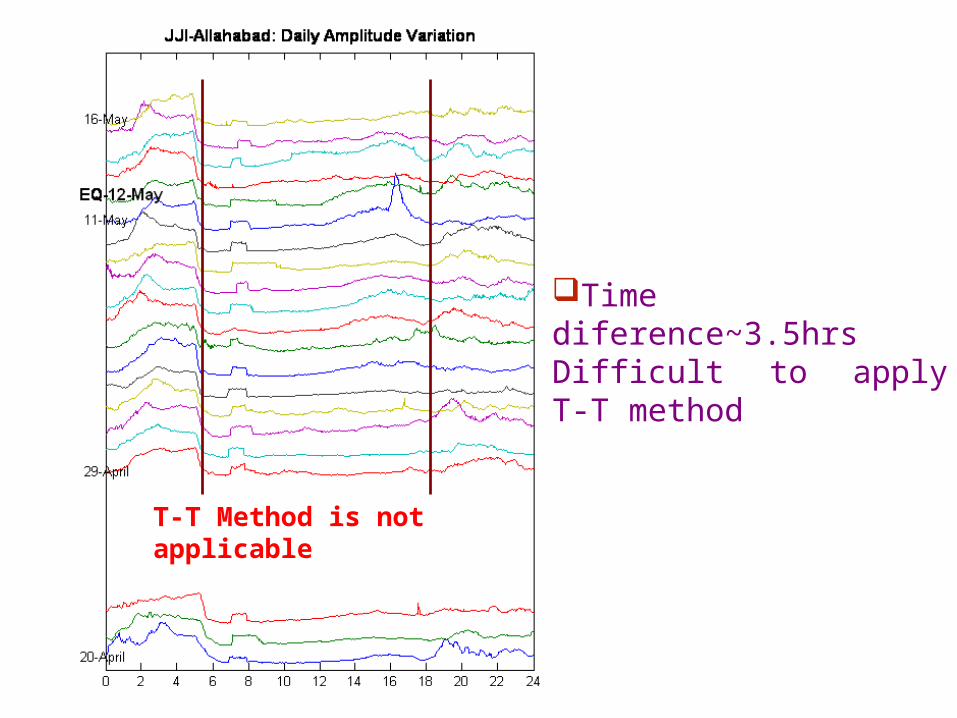
(1) Terminator Time Method(1) Terminator Time Method
(Hayakawa et al., 1996; Molchanov and Hayakawa, 1998; Hayakawa 2007)
Abnormal behavior occurs around the sunrise & sunset of local times. Effective on E-W meridian plane propagation direction and Short paths (~ 1000-2000 km) Evening Terminator is more indicative of Seismic influence Generally an increase in the evening terminator and decrease in morning terminator time.
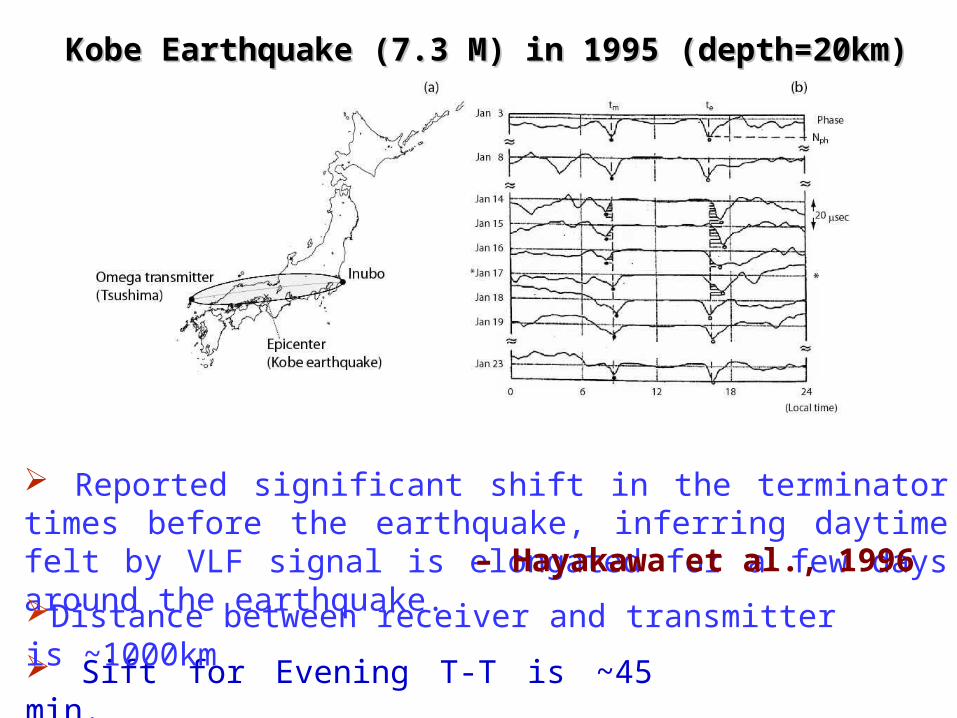
Kobe Earthquake (7.3 M) in 1995 (depth=20km)Kobe Earthquake (7.3 M) in 1995 (depth=20km)
Reported significant shift in the terminator times before the earthquake, inferring daytime felt by VLF signal is elongated for a few days around the earthquake. – Hayakawa et al., 1996
Sift for Evening T-T is ~45 min.
Distance between receiver and transmitter is ~1000km
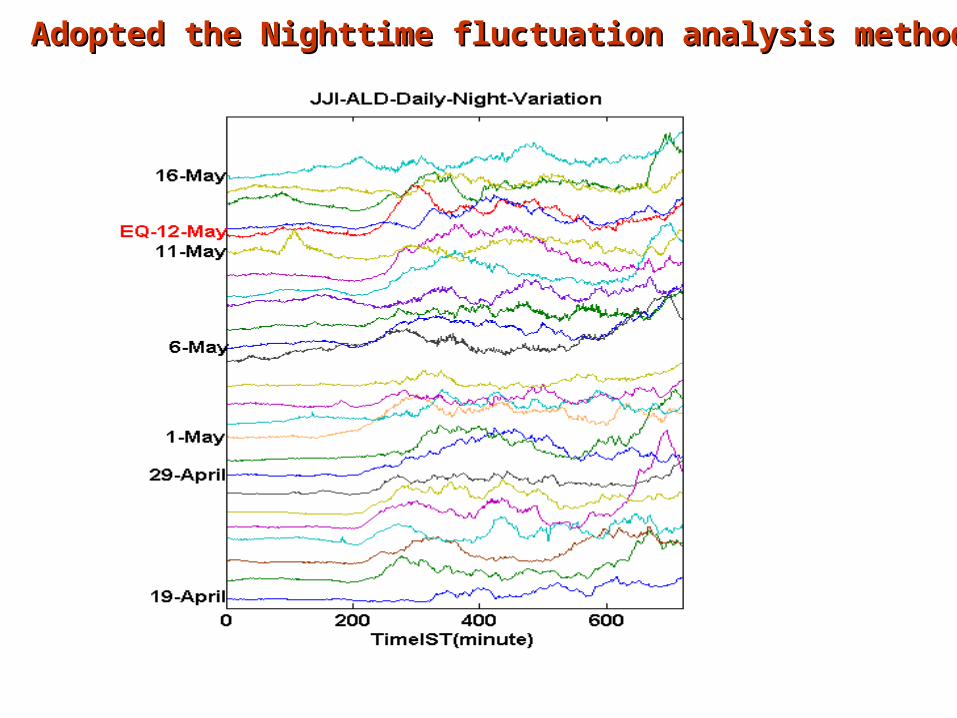
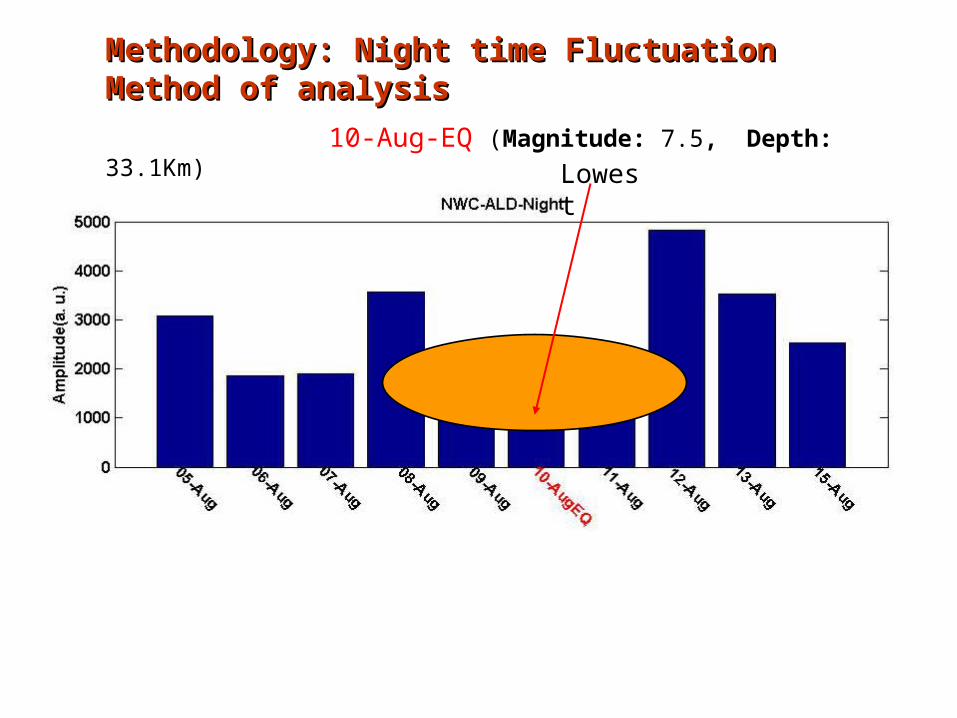
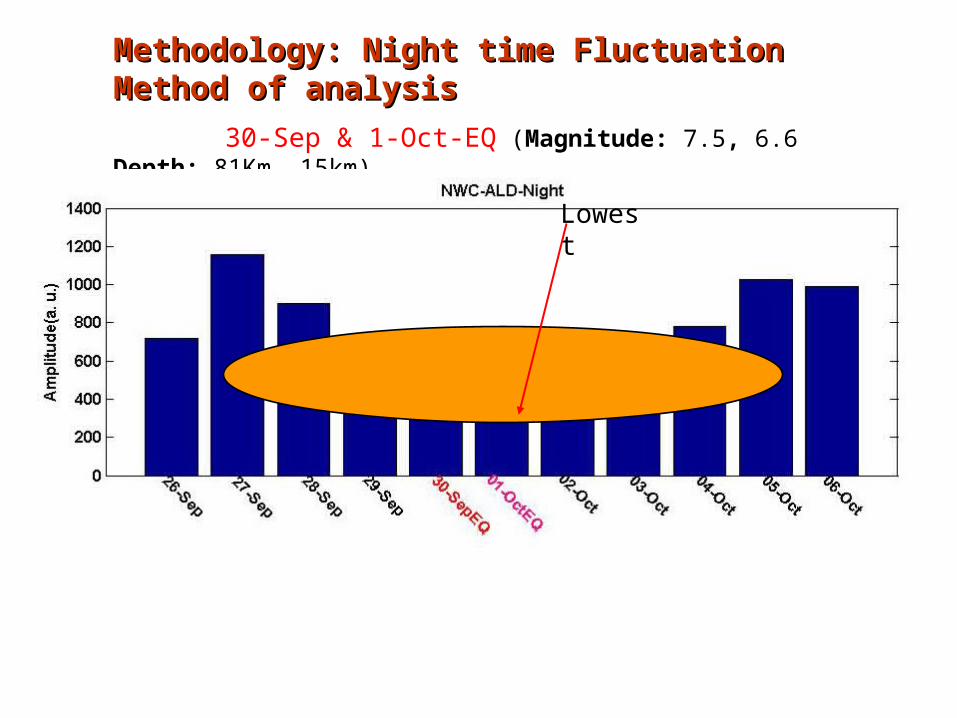
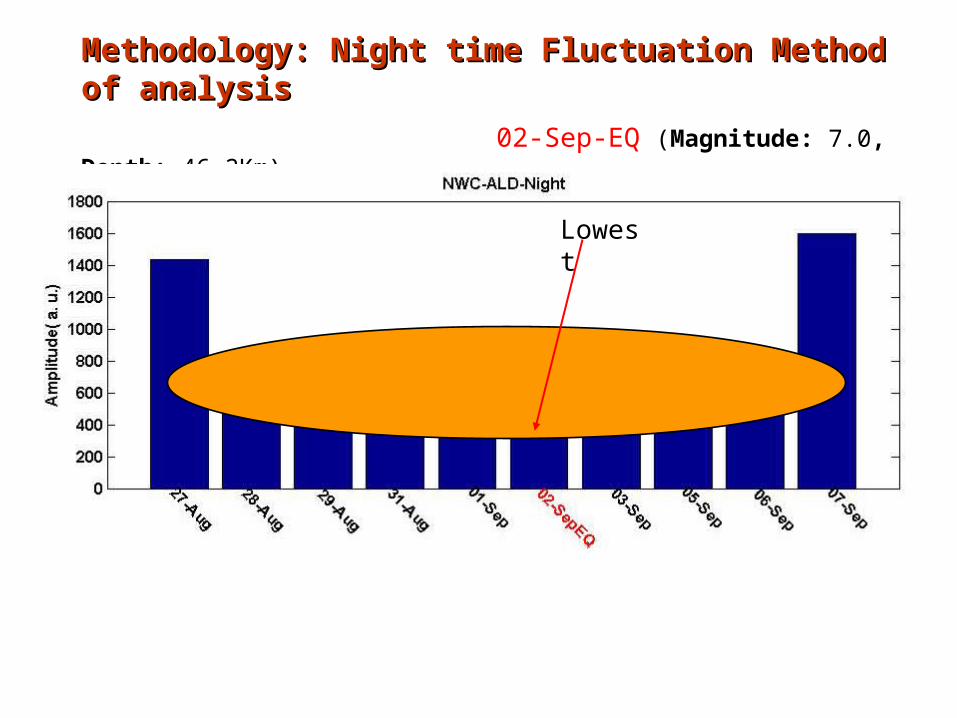
Methodology: Night time Fluctuation Method of analysisMethodology: Night time Fluctuation Method of analysis
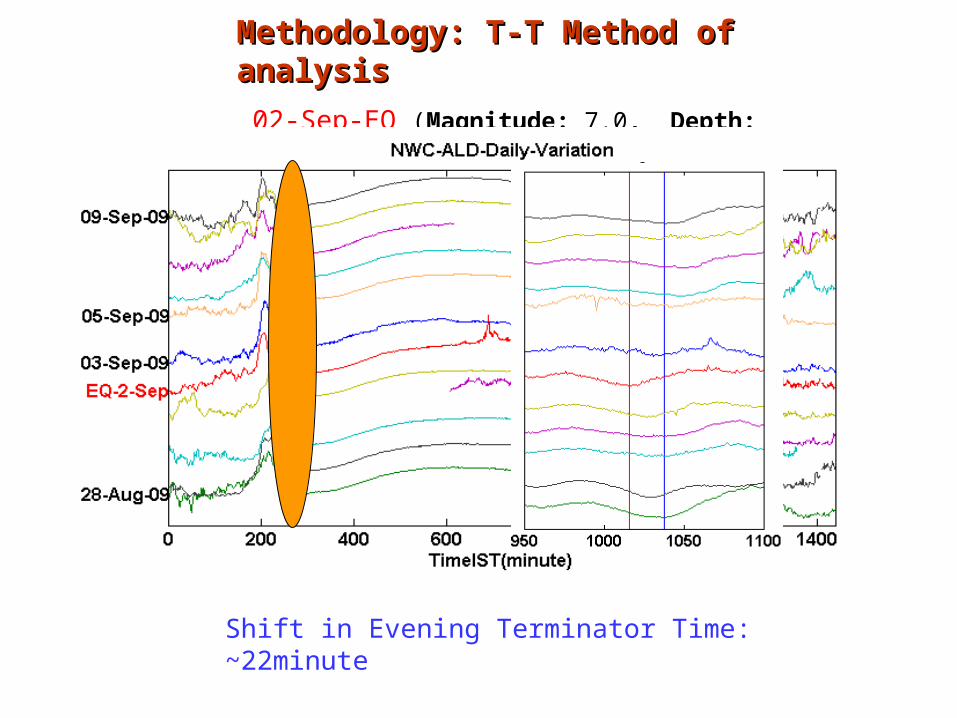
02-Sep-EQ (Magnitude: 7.0, Depth: 46.2Km)
Lowest
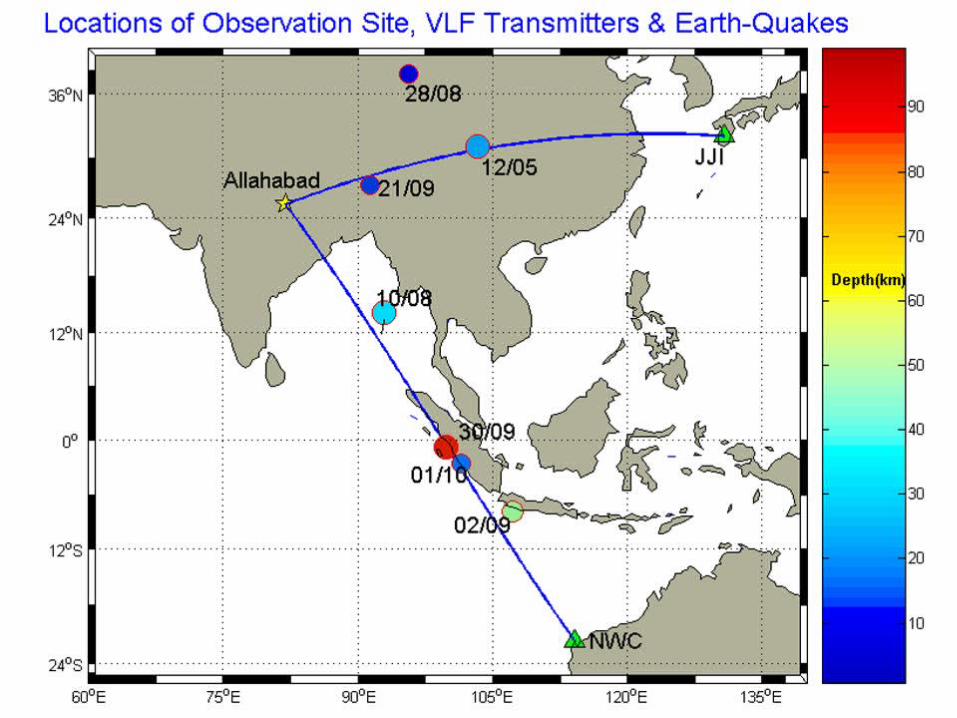
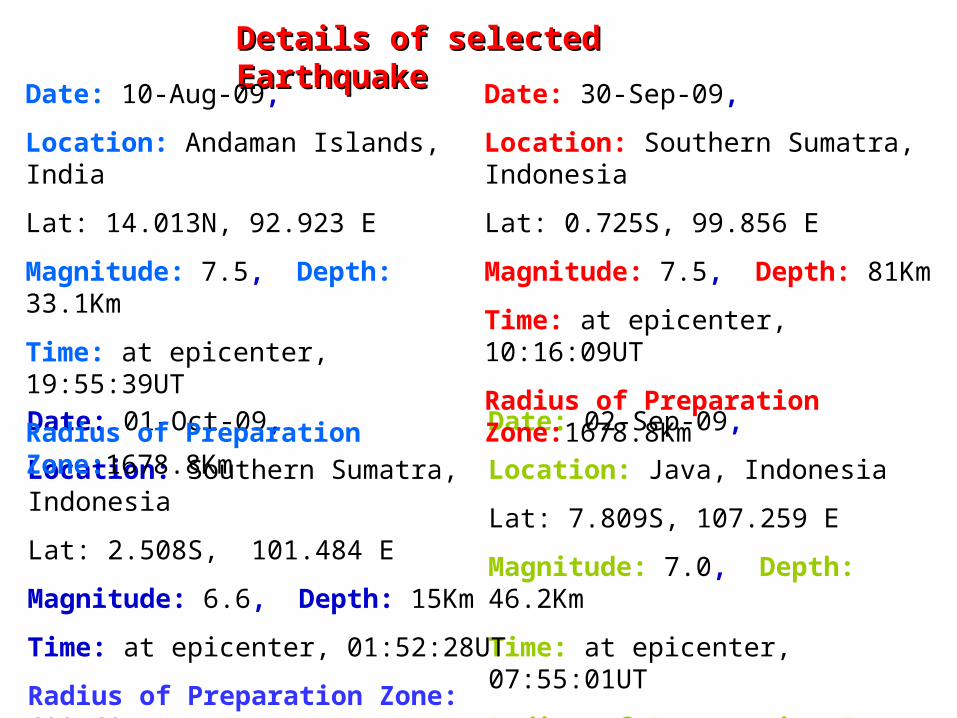
JJI-EarthquakeJJI-Earthquake
Date: 28-Aug-09,
Location: Northern Qinghai, China
Lat: 37.713N, 95.687 E
Magnitude: 6.2, Depth: 13Km
Time: at epicenter, 01:52:06UT
Radius of Preparation Zone: 463.45 Km
Date: 21-Sep-09
Location: Bhutan,
Lat: 27.346N, Long:91.412E
Magnitude: 6.1, Depth: 14Km
Time: at epicenter, 08:53:06 UT
Radius of Preparation Zone: 419.76 Km
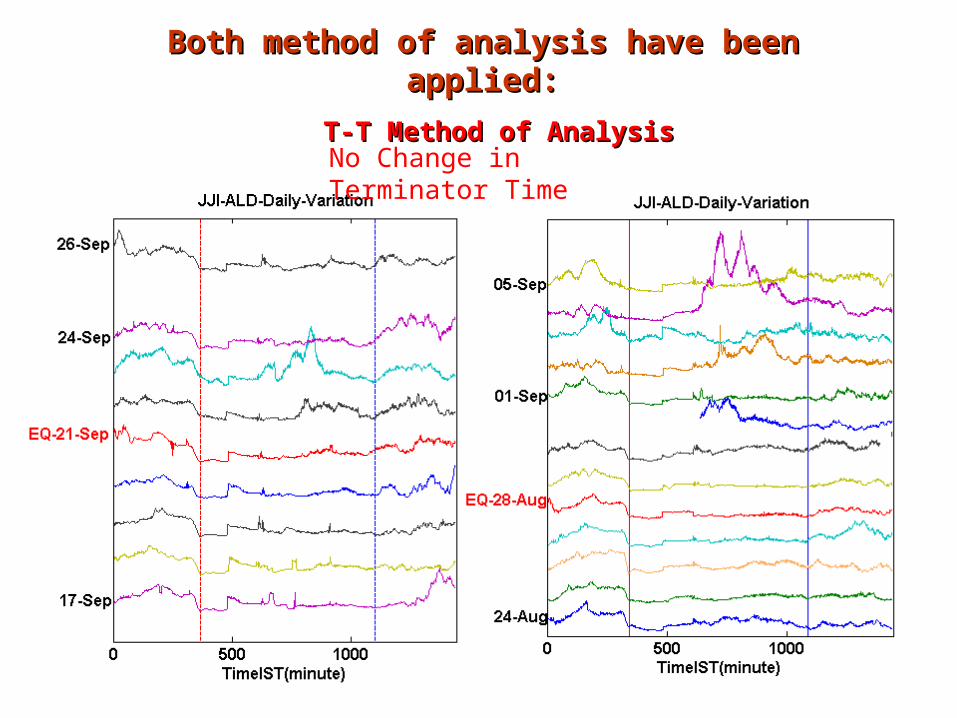
Both method of analysis have been applied:Both method of analysis have been applied:
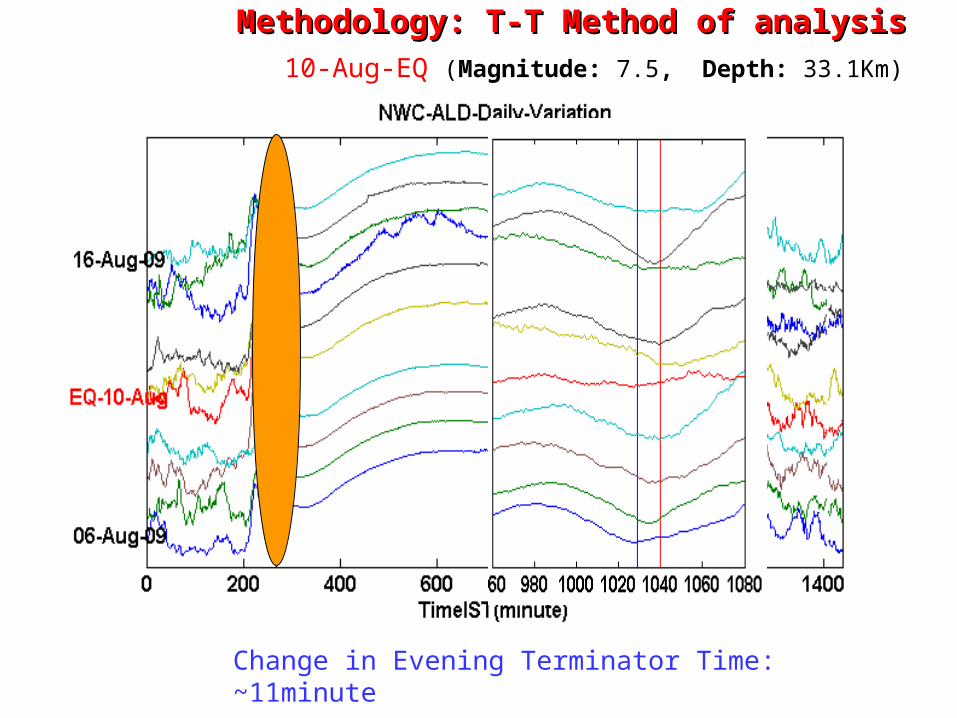
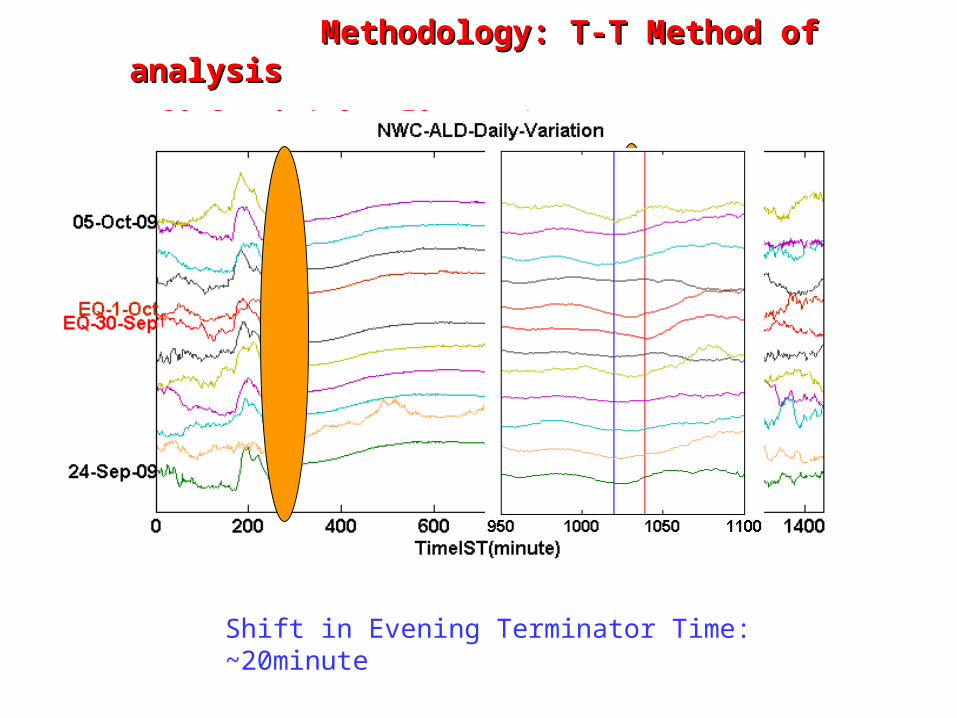
T-T Method of AnalysisT-T Method of Analysis
No Change in Terminator Time
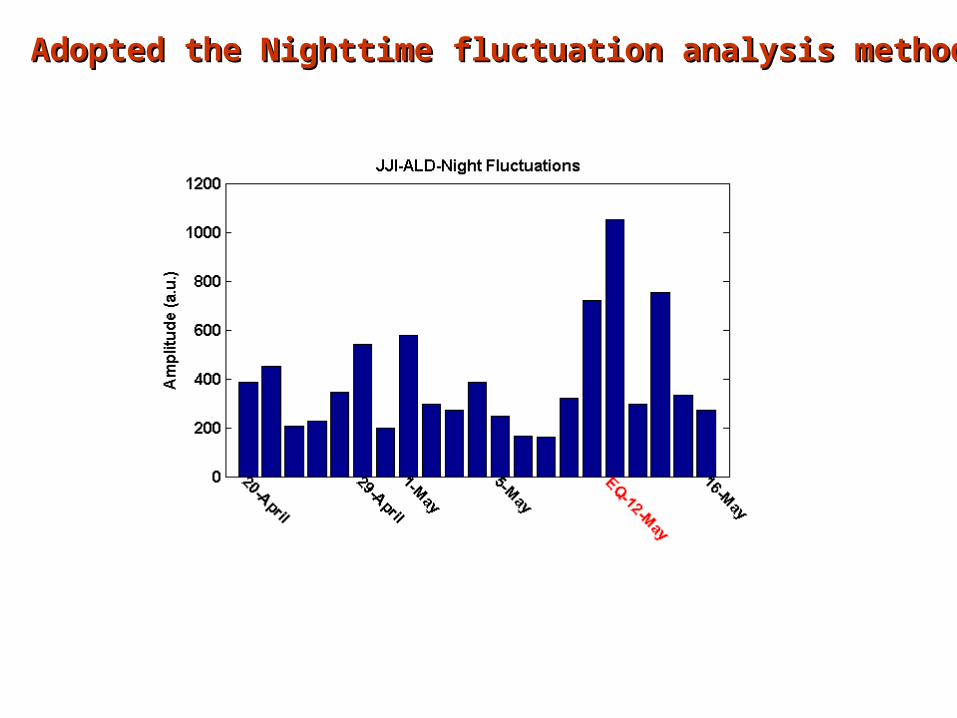
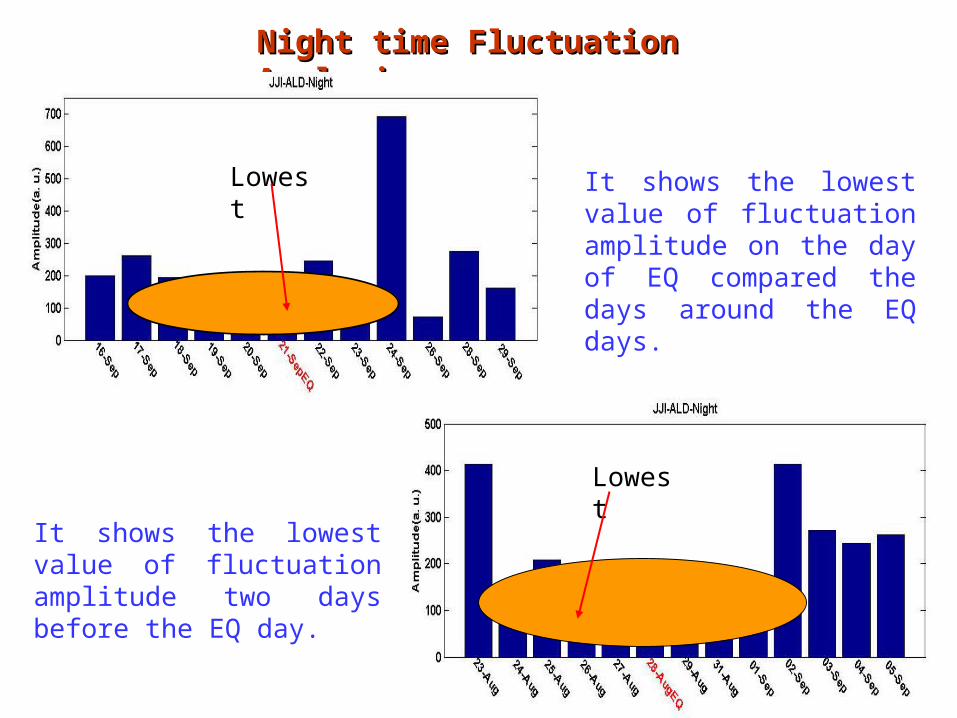
Night time Fluctuation AnalysisNight time Fluctuation Analysis
It shows the lowest value of fluctuation amplitude on the day of EQ compared the days around the EQ days.
Lowest
Lowest
It shows the lowest value of fluctuation amplitude two days before the EQ day.
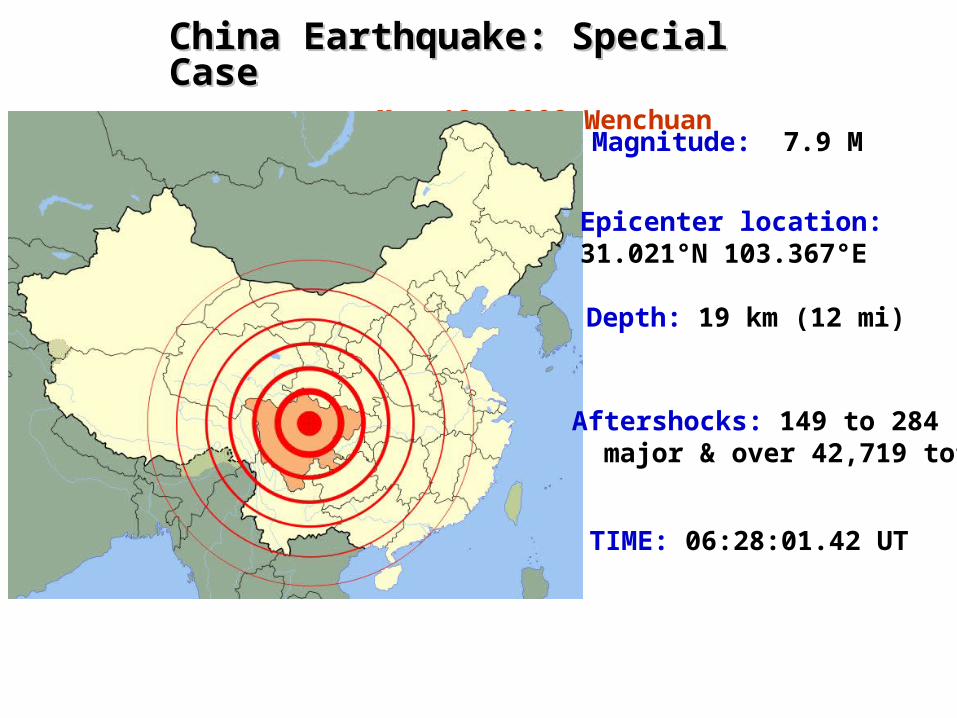
So, we clearly see the increase in the VLF amplitude fluctuation for 12 May, 2008 China Earthquake
This is not true for all the Earthquakes
Subject of Seismic-Ionospheric perturbations caused by Earthquakes needs more attention and study
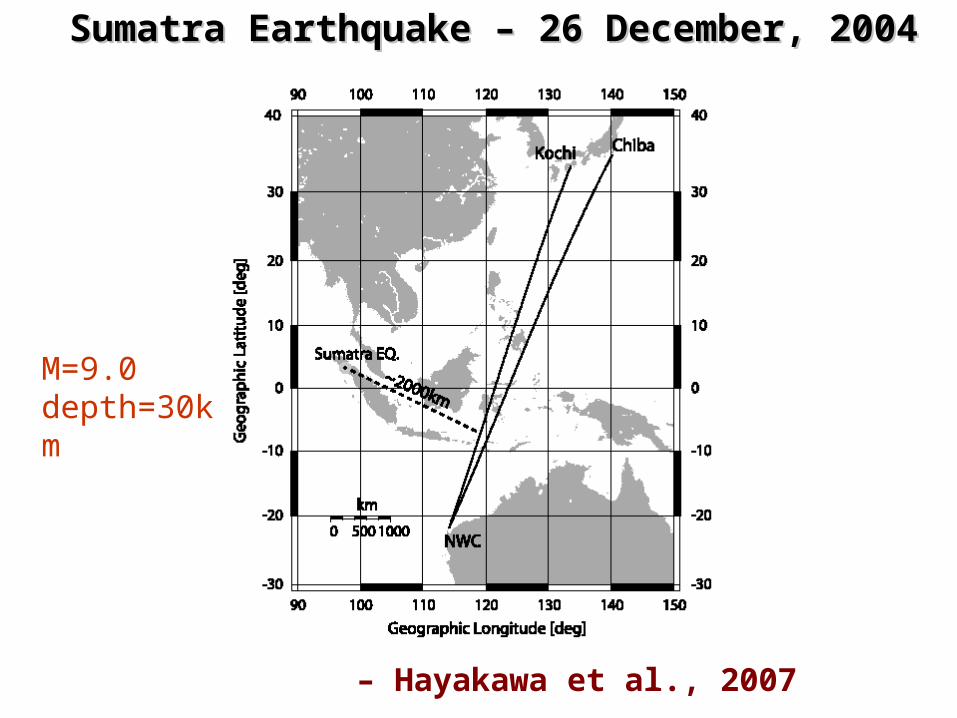
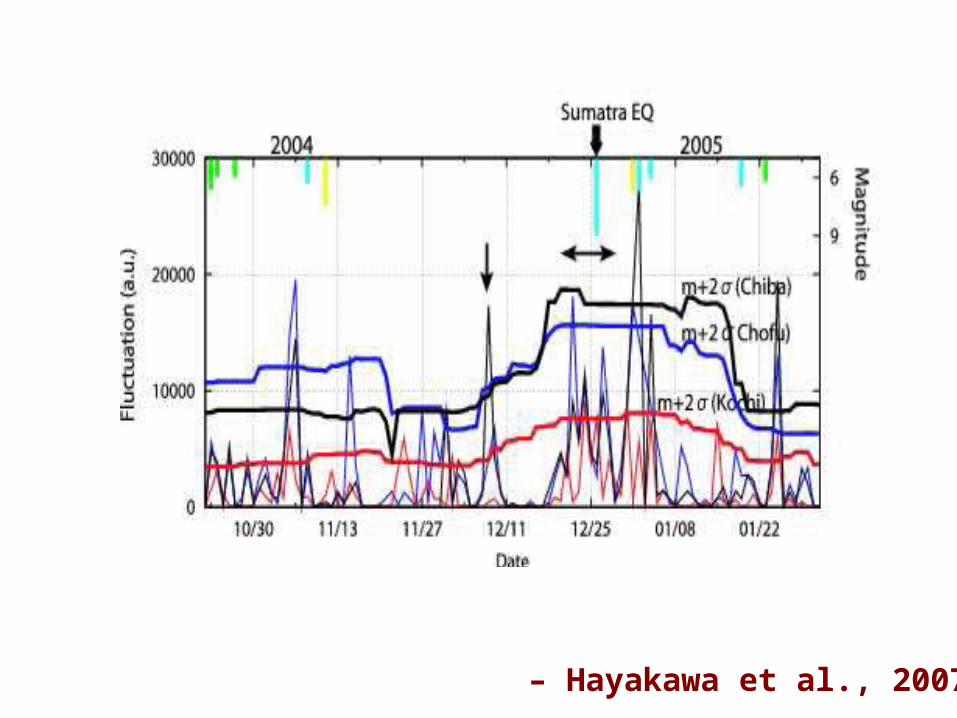
In case of Andaman and Indonesian we see lowest values of fluctuation on EQ day - with increase before and after EQ Clear shift in Evening Terminator time ~ 10 – 25 min for Andaman and Indonesian EQ is seen