61
U.S. Department of Transportation Federal Railroad Administration June 2012 Chicago to St. Louis High-Speed Rail Tier 1 DRAFT ENVIRONMENTAL IMPACT STATEMENT Volume I prepared by:
U.S. Department of TransportationFederal Railroad Administration
June 2012
Chicago to St. Louis High-Speed Rail Tier 1DRAFT ENVIRONMENTAL IMPACT STATEMENT
Volume I
prepared by:
Chicago-St. Louis High-Speed Rail i Tier 1 DEIS
List of Acronyms
AAR Association of American Railroads
ADT Average Daily Traffic
AREMA American Railway Engineering and Maintenance‐of‐Way Association
ARRA America Recovery and Reinvestment Act
ASLRRA American Short Line and Regional Railroad Association
BCS Biological Stream Characterization
CERCLIS Comprehensive Environmental Response, Compensation, and Liability
Information System
CEQ Council on Environmental Quality
CFR Code of Federal Regulations
CMAP Chicago Metropolitan Agency for Planning
CN Canadian National Railroad
COSIM Carbon Monoxide Screen for Signalized Intersections
CTA Chicago Transit Authority
CWS Community Water Supplies
dBA Decibels (A‐weighting)
DEIS Draft Environmental Impact Statement
EA Environmental Assessment
EDR Environmental Data Resources
EIS Environmental Impact Statement
EJ Environmental Justice
EJ&E Elgin, Joliet, & Eastern Railway
EO Executive Order
ESA Endangered Species Act
FEIS Final Environmental Impact Statement
FEMA Federal Emergency Management Agency
FHWA Federal Highway Administration
FONSI Finding of No Significant Impact
FRA Federal Railroad Administration
GHG Greenhouse Gas
GIS Geographical Information System
HC Heritage Corridor
HSR High‐Speed Rail
ICC Illinois Commerce Commission
IDOA Illinois Department of Agriculture
IDOT Illinois Department of Transportation
IEPA Illinois Environmental Protection Agency
IHPA Illinois Historic Preservation Agency
INAI Illinois Natural Areas Inventory
INHS Illinois Natural History Survey
Chicago-St. Louis High-Speed Rail ii Tier 1 DEIS
INPC Illinois Nature Preserves Commission
IPCB Illinois Pollution Control Board
ISTP Illinois State Transportation Plan
KCS Kansas City Southern Railroad
LOS Level of Service
LWCF Land and Water Conservation Fund
MWRRI Midwest Regional Rail Initiative
MOA Memorandum of Agreement
MOU Memorandum of Understanding
MP Milepost
MUTCD Manual on Uniform Traffic Control Devices
NAAQS National Ambient Air Quality Standards
NAJPTC North American Joint Positive Train Control Program
NEPA National Environmental Policy Act
NHPA National Historic Preservation Act
NIRC Northeast Illinois Regional Commuter Railroad
NS Norfolk Southern Railroad
NOx Nitrogen Oxides
NPDES National Pollutant Discharge Elimination System
NPS National Park Service
NRHP National Register of Historic Places
NRCS Natural Resources Conservation Service
NRI Nationwide Rivers Inventory
NWI National Wetlands Inventory
OMP O’Hare Modernization Program
Pb Lead
PEM Palustrine Emergent
PM Particulate Matter
PPV Peak Particle Velocity
PSS/PFO Palustrine Scrub‐Shrub Forested
PTC Positive Train Control
PUB Palustrine Unconsolidated Bottom
R Riverine
RCRA Resource and Conservation Recovery Act
RID Rock Island District
RMS Root Mean Square
ROD Record of Decision
ROW Right‐of‐Way
SCAL St. Charles Air Line
SIU Section of Independent Utility
SWPPP Stormwater Pollution Prevention Plan
TR Township Range
TRRA Terminal Railroad Association
Chicago-St. Louis High-Speed Rail iii Tier 1 DEIS
UP Union Pacific Railroad
USC United States Code
USDOT United States Department of Transportation
USEPA US Environmental Protection Agency
USFWS United States Fish and Wildlife Service
VHT Vehicles‐Hours Traveled
VMT Vehicle‐Miles Traveled
VOC Volatile Organic Compounds
Table of Contents
TABLE OF CONTENTS

Chicago-St. Louis High-Speed Rail i Tier 1 DEIS
VOLUME I Table of Contents
S.0 SUMMARY .................................................................................................................... 0‐2
S.1 Background ........................................................................................................... 0‐2
S.2 Purpose and Need ............................................................................................... 0‐4
S.3 Alternatives Considered .................................................................................... 0‐5
S.4 Summary of Impacts ........................................................................................... 0‐8
S.4.1 Land Use/Socioeconomic Impacts ........................................................ 0‐8
S.4.2 Energy ....................................................................................................... 0‐9
S.4.3 Agriculture ............................................................................................. 0‐10
S.4.4 Cultural Resources ................................................................................ 0‐10
S.4.5 Natural Resources ................................................................................. 0‐11
S.4.6 Air Quality ............................................................................................. 0‐13
S.4.7 Noise and Vibration .............................................................................. 0‐13
S.4.8 Water Quality ......................................................................................... 0‐13
S.4.9 Wetlands ................................................................................................. 0‐14
S.4.1S Utilities .................................................................................................... 0‐15
S.4.11 Visual and Aesthetic Quality Impacts ................................................ 0‐15
S.4.12 Special Waste ......................................................................................... 0‐15
S.4.13 Section 4(f)/6(f) and Parklands ............................................................ 0‐15
S.4.14 Indirect and Cumulative ...................................................................... 0‐17
S.4.15 Travel Benefits ....................................................................................... 0‐18
S.4.16 Transportation Impacts ........................................................................ 0‐20
S.5 Summary of Potential Mitigation .................................................................. 0‐23
S.6 Implementation Plan ........................................................................................ 0‐26
S.7 Comments and Coordination .......................................................................... 0‐28
S.8 Springfield Rail Improvements Project Tier 2 Summary (Volume II) ... 0‐28
S.8.1 Springfield Background ....................................................................... 0‐28
S.8.2 Springfield Purpose and Need ............................................................ 0‐29
S.8.3 Springfield Alternatives Considered .................................................. 0‐31
S.8.4 Summary of Springfield Impacts ........................................................ 0‐33
S.8.5 Summary of Mitigation ........................................................................ 0‐35
S.8.6 Springfield Preferred Alternative ....................................................... 0‐35
1.0 INTRODUCTION ........................................................................................................ 1‐1
1.1 Tiering Process ..................................................................................................... 1‐1
1.2 Anticipated Decisions ........................................................................................ 1‐2
2.0 PURPOSE AND NEED FOR ACTION ..................................................................... 2‐1
2.1 Background ........................................................................................................... 2‐1
Chicago-St. Louis High-Speed Rail ii Tier 1 DEIS
2.1.1 History ...................................................................................................... 2‐1
2.1.2 Midwest, Statewide, and Regional Planning Context ........................ 2‐3
2.1.3 Existing and Future Conditions ............................................................ 2‐4
2.2 Purpose .................................................................................................................. 2‐7
2.3 Need ....................................................................................................................... 2‐7
2.3.1 Travel Time, Frequency, and Reliability .............................................. 2‐8
2.3.2 Safety ....................................................................................................... 2‐11
2.3.3 Conclusion .............................................................................................. 2‐11
2.4 Major Authorizing Laws and Regulations ................................................... 2‐13
2.4.1 Permits, Licenses, and other Regulatory Requirements .................. 2‐13
3.0 ALTERNATIVES .......................................................................................................... 3‐1
3.1 Tier 1 Alternatives Screening Process ............................................................. 3‐1
3.1.1 Alternatives Screening and Selection Process ..................................... 3‐1
3.1.2 Tier 1 Screening Objectives and Criteria .............................................. 3‐2
3.2 No‐Build Alternative ........................................................................................ 3‐11
3.2.1 Passenger Rail Service under the No‐Build Alternative .................. 3‐12
3.2.2 Annual Ridership Estimates ................................................................ 3‐16
3.2.3 Purpose and Need Assessment of the No‐Build Alternative .......... 3‐17
3.3 Build Alternatives ............................................................................................. 3‐18
3.3.1 Program Elements for the Proposed High Speed Rail Corridor .... 3‐18
3.3.2 Annual Ridership Estimates ................................................................ 3‐20
3.3.3 Purpose and Need Assessment of the Build Alternatives ............... 3‐21
3.3.4 Alternative Route Screening for Chicago to Joliet ............................ 3‐22
3.3.5 Alternative Route Screening for Springfield ..................................... 3‐38
3.3.6 Alternative Route Screening for Alton to St. Louis .......................... 3‐45
3.3.7 Tier 1 Build Alternatives from Chicago to St. Louis ......................... 3‐52
3.4 Costs ..................................................................................................................... 3‐60
3.4.1 Capital Costs .......................................................................................... 3‐60
3.4.2 Maintenance Costs ................................................................................ 3‐63
4.0 AFFECTED ENVIRONMENT ................................................................................... 4‐1
4.1 Existing Land Use ................................................................................................ 4‐1
4.1.1 Development Patterns ............................................................................ 4‐1
4.1.2 Existing Land Use Description by County .......................................... 4‐2
4.2 Socioeconomic and Environmental Justice Community Characteristics .. 4‐7
4.2.1 Demographics .......................................................................................... 4‐7
4.2.2 Economics ................................................................................................. 4‐7
4.2.3 Environmental Justice ........................................................................... 4‐10
4.2.4 Community Services and Facilities ..................................................... 4‐11
4.3 Energy .................................................................................................................. 4‐12
Chicago-St. Louis High-Speed Rail iii Tier 1 DEIS
4.4 Agriculture .......................................................................................................... 4‐13
4.5 Cultural Resources ............................................................................................ 4‐14
4.5.1 Historic Architectural Resources ........................................................ 4‐18
4.5.2 Archaeological Resources .................................................................... 4‐21
4.6 Natural Resources ............................................................................................. 4‐21
4.6.1 Geology and Soils .................................................................................. 4‐21
4.6.2 Ecological Resources ............................................................................. 4‐24
4.6.3 Threatened and Endangered Species ................................................. 4‐38
4.6.4 Natural Areas ......................................................................................... 4‐39
4.7 Air Quality .......................................................................................................... 4‐41
4.7.1 Existing Conditions ............................................................................... 4‐42
4.7.2 Ambient Air Quality ............................................................................. 4‐45
4.8 Noise and Vibration.......................................................................................... 4‐48
4.8.1 Noise Descriptors .................................................................................. 4‐48
4.8.2 Vibration Descriptors ............................................................................ 4‐48
4.8.3 Existing Setting ...................................................................................... 4‐50
4.9 Water Quality/Resources ................................................................................. 4‐52
4.9.1 Surface Water ......................................................................................... 4‐52
4.9.2 Drainage Basins ..................................................................................... 4‐53
4.9.3 Water Quality ......................................................................................... 4‐57
4.9.4 Special Status Streams .......................................................................... 4‐60
4.9.5 Groundwater .......................................................................................... 4‐67
4.10 Floodplains ......................................................................................................... 4‐68
4.11 Wetlands ............................................................................................................. 4‐76
4.12 Utilities ................................................................................................................ 4‐80
4.13 Visual and Aesthetic Quality .......................................................................... 4‐80
4.13.1 Guidance ................................................................................................. 4‐80
4.13.2 Application of FHWA Guidance ......................................................... 4‐80
4.13.3 Visual Quality of the Study Area ........................................................ 4‐81
4.14 Special Waste ..................................................................................................... 4‐85
4.15 Section 4(f)/6(f) and Parklands ....................................................................... 4‐89
4.16 Safety and Security ........................................................................................... 4‐93
4.16.1 Rail Operations Safety and Security ................................................... 4‐93
4.16.2 Crossing Safety ...................................................................................... 4‐94
5.0 ENVIRONMENTAL CONSEQUENCES ................................................................. 5‐1
5.1 Land Use Impacts ................................................................................................ 5‐1
5.1.1 No‐Build Alternative .............................................................................. 5‐1
5.1.2 Alternative A ............................................................................................ 5‐1
5.1.3 Alternative B ............................................................................................ 5‐5

Chicago-St. Louis High-Speed Rail iv Tier 1 DEIS
5.1.4 Alternative C ............................................................................................ 5‐6
5.1.5 Alternative D ............................................................................................ 5‐7
5.1.6 Summary of Land Use Impacts ............................................................. 5‐8
5.1.7 Mitigation ................................................................................................. 5‐9
5.2 Socioeconomic and Environmental Justice Community Impacts .............. 5‐9
5.2.1 Methods for Evaluating Impacts ........................................................... 5‐9
5.2.2 No‐Build Alternative ............................................................................ 5‐10
5.2.3 Alternative A .......................................................................................... 5‐10
5.2.4 Alternative B .......................................................................................... 5‐12
5.2.5 Alternative C .......................................................................................... 5‐13
5.2.6 Alternative D .......................................................................................... 5‐15
5.2.7 Summary of Socioeconomic and Community Impacts ................... 5‐16
5.3 Energy .................................................................................................................. 5‐17
5.3.1 Energy Consumption during Construction ....................................... 5‐17
5.3.2 Energy Consumption during Operation ............................................ 5‐17
5.4 Agriculture .......................................................................................................... 5‐18
5.4.1 No‐Build Alternative ............................................................................ 5‐18
5.4.2 Build Alternatives ................................................................................. 5‐18
5.5 Cultural Resources ............................................................................................ 5‐20
5.5.1 Historic Architectural Resources ........................................................ 5‐21
5.5.2 Archaeological Resources .................................................................... 5‐32
5.6 Natural Resources ............................................................................................. 5‐32
5.6.1 No‐Build Alternative ............................................................................ 5‐32
5.6.2 Build Alternatives ................................................................................. 5‐32
5.7 Air Quality .......................................................................................................... 5‐36
5.7.1 No‐Build Alternative ............................................................................ 5‐36
5.7.2 Build Alternatives ................................................................................. 5‐36
5.8 Noise and Vibration.......................................................................................... 5‐44
5.8.1 Operation Noise Impact Criteria ......................................................... 5‐44
5.8.2 Operation Vibration Impact Criteria .................................................. 5‐47
5.8.3 Noise Impacts during Operation ........................................................ 5‐49
5.8.4 Vibration Impacts during Operation .................................................. 5‐51
5.8.5 Noise Impacts during Construction ................................................... 5‐52
5.8.6 Vibration Impacts during Construction ............................................. 5‐53
5.8.7 Mitigation during Construction .......................................................... 5‐54
5.8.8 Mitigation during Operation ............................................................... 5‐56
5.9 Water Quality/Resources ................................................................................. 5‐59
5.9.1 No‐Build Alternative ............................................................................ 5‐59
5.9.2 Build Alternatives ................................................................................. 5‐59
5.10 Floodplains ......................................................................................................... 5‐63
5.10.1 No‐Build Alternative ............................................................................ 5‐63
5.10.2 Build Alternatives ................................................................................. 5‐64
Chicago-St. Louis High-Speed Rail v Tier 1 DEIS
5.11 Wetlands ............................................................................................................. 5‐65
5.11.1 No‐Build Alternative ............................................................................ 5‐65
5.11.2 Build Alternatives ................................................................................. 5‐65
5.12 Utilities ................................................................................................................ 5‐67
5.12.1 No‐Build Alternative ............................................................................ 5‐67
5.12.2 Build Alternatives ................................................................................. 5‐67
5.13 Visual and Aesthetic Quality Impacts ........................................................... 5‐67
5.13.1 No‐Build Alternative ............................................................................ 5‐68
5.13.2 Build Alternatives ................................................................................. 5‐69
5.14 Special Waste ..................................................................................................... 5‐71
5.14.1 No‐Build Alternative ............................................................................ 5‐71
5.14.2 Build Alternatives ................................................................................. 5‐71
5.15 Section 4(f)/6(f) and Parklands ....................................................................... 5‐72
5.15.1 No‐Build Alternative ............................................................................ 5‐72
5.15.2 Build Alternatives ................................................................................. 5‐72
5.16 Safety and Security ........................................................................................... 5‐94
5.16.1 No‐Build Alternative ............................................................................ 5‐94
5.16.2 Build Alternatives ................................................................................. 5‐94
5.17 Permits ................................................................................................................. 5‐96
5.18 Construction Impacts ........................................................................................ 5‐97
5.18.1 No‐Build Alternative ............................................................................ 5‐97
5.18.2 Build Alternatives ................................................................................. 5‐97
5.19 Indirect and Cumulative Impacts ................................................................... 5‐98
5.19.1 No‐Build Alternative ............................................................................ 5‐98
5.19.2 Build Alternatives ................................................................................. 5‐98
5.20 The Relationship between Local Short‐Term Uses and Man’s
Environment and the Maintenance and Enhancement of Long‐Term
Productivity ................................................................................................................ 5‐100
5.21 Irreversible and Irretrievable Commitments of Resources ..................... 5‐101
5.22 Summary of Impacts and Costs .................................................................... 5‐102
5.23 Potential Mitigation Measures ..................................................................... 5‐103
6.0 TRANSPORTATION IMPACTS .............................................................................. 6‐1
6.1 Service Development Plan ................................................................................ 6‐1
6.1.1 Intercity Travel Options ......................................................................... 6‐1
6.1.2 Service Levels and Frequency ............................................................... 6‐7
6.1.3 Capital Costs .......................................................................................... 6‐31
6.1.4 Ridership and Revenue Forecast ......................................................... 6‐35
6.2 Travel Benefits ................................................................................................... 6‐42
6.2.1 No‐Build Alternative ............................................................................ 6‐42
Chicago-St. Louis High-Speed Rail vi Tier 1 DEIS
6.2.2 Build Alternatives ................................................................................. 6‐43
6.3 Impacts to Freight Rail Service ....................................................................... 6‐44
6.3.1 No‐Build Alternative ............................................................................ 6‐44
6.3.2 Build Alternatives ................................................................................. 6‐44
6.4 Impacts to Commuter Rail Service ................................................................. 6‐45
6.4.1 No‐Build Alternative ............................................................................ 6‐45
6.4.2 Build Alternatives ................................................................................. 6‐47
6.5 Impacts to Rail Service During Construction .............................................. 6‐48
6.5.1 No‐Build Alternative ............................................................................ 6‐48
6.5.2 Build Alternatives ................................................................................. 6‐48
6.6 Impacts at Highway‐Rail Grade Crossings .................................................. 6‐48
6.6.1 No‐Build Alternative ............................................................................ 6‐48
6.6.2 Build Alternatives ................................................................................. 6‐48
6.7 Impacts to Vehicular Traffic During Construction..................................... 6‐49
6.7.1 No‐Build Alternative ............................................................................ 6‐49
6.7.2 Build Alternatives ................................................................................. 6‐49
6.8 Station Access and Parking ............................................................................. 6‐50
6.8.1 No‐Build Alternative ............................................................................ 6‐50
6.8.2 Build Alternatives ................................................................................. 6‐50
7.0 IMPLEMENTATION PLAN ....................................................................................... 7‐1
7.1 Continuation of Current Investment ............................................................... 7‐1
7.2 Development of Staged Improvements .......................................................... 7‐2
7.2.1 Process ...................................................................................................... 7‐2
7.2.2 Staged Improvements – Additional Service ........................................ 7‐3
7.2.3 Staged Improvements – Additional Infrastructure ............................ 7‐4
7.2.4 Staged Improvements – Environmental Documentation .................. 7‐5
8.0 COMMENTS AND COORDINATION ................................................................... 8‐1
8.1 Agency Coordination .......................................................................................... 8‐1
8.1.1 Federal Agency Coordination ............................................................... 8‐1
8.1.2 State Agency Coordination .................................................................... 8‐2
8.1.3 Tribal Coordination................................................................................. 8‐3
8.1.4 Agency Coordination Meetings ............................................................ 8‐4
8.2 Public Coordination ............................................................................................ 8‐5
8.2.1 Public Open Houses ................................................................................ 8‐6
9.0 LIST OF PREPARERS .................................................................................................. 9‐1
10.0 DISTRIBUTION OF THE TIER 1 DEIS ................................................................. 10‐1
11.0 REFERENCES .............................................................................................................. 11‐1
Chicago-St. Louis High-Speed Rail vii Tier 1 DEIS
APPENDIX A. Alternative Exhibits
APPENDIX B. Prime Farmlands
APPENDIX C. Threatened and Endangered Species
APPENDIX D. Special Waste
APPENDIX E. Potential Grade Separation Crossings and Protection Measures
APPENDIX F. Agency Coordination
APPENDIX G. Federal Register Notice of Intent
List of Exhibits
Exhibit S.0‐1. Program Location .............................................................................................. 0‐3
Exhibit S.3‐1. Build Alternative Alignment Sections between Chicago and St. Louis .... 0‐7
Exhibit S.6‐1. Staged Improvements .................................................................................... 0‐27
Exhibit S.8‐1. Existing Railroad Corridors .......................................................................... 0‐30
Exhibit 2.0‐1. Program Location ............................................................................................. 2‐2
Exhibit 2.1‐1. Existing Track Configurations ........................................................................ 2‐6
Exhibit 3.1‐1. Map of Overall Study Corridor for the Alternatives Screening ................. 3‐4
Exhibit 3.3‐1. Initial Range of Chicago to Joliet Alternatives (Alternatives 1, 2, and 3) 3‐23
Exhibit 3.3‐2. Initial Range of Chicago to Joliet Alternatives (Alternatives 4A – 4E) ... 3‐24
Exhibit 3.3‐3. Initial Range of Chicago to Joliet Alternatives (Alternatives 5A – 5D) ... 3‐25
Exhibit 3.3‐4. Initial Range of Chicago to Joliet Alternatives (Alternatives 6A – 6D) ... 3‐26
Exhibit 3.3‐5. Initial Range of Springfield Alternatives (Alternative 1) .......................... 3‐39
Exhibit 3.3‐6. Initial Range of Springfield Alternatives (Alternatives 2 and 3).............. 3‐40
Exhibit 3.3‐7. Initial Range of Springfield Alternatives (Alternatives 4 and 5).............. 3‐41
Exhibit 3.3‐8. Initial Range of St. Louis Alternatives (Alternatives 1 and 2) .................. 3‐46
Exhibit 3.3‐9. Initial Range of St. Louis Alternatives (Alternatives 3 and 4) .................. 3‐47
Exhibit 3.3‐10. Build Alternative Alignment Sections between Chicago and St. Louis 3‐54
Exhibit 4.2‐1. Illinois Metropolitan Statistical Areas ........................................................... 4‐8
Exhibit 4.4‐1. Prime Farmland (1 of 3) ................................................................................. 4‐15
Exhibit 4.4‐2. Prime Farmland (2 of 3) ................................................................................. 4‐16
Exhibit 4.4‐3. Prime Farmland (3 of 3) ................................................................................. 4‐17
Exhibit 4.5‐1. NRHP and NRHP‐Eligible Resources within 250 Feet of Alignments ... 4‐20
Exhibit 4.6‐1. Physiographic Units ....................................................................................... 4‐22
Exhibit 4.6‐2. Ecoregions (1 of 3) .......................................................................................... 4‐25
Exhibit 4.6‐3. Ecoregions (2 of 3) .......................................................................................... 4‐26
Exhibit 4.6‐4. Ecoregions (3 of 3) .......................................................................................... 4‐27
Exhibit 4.6‐5. Ecological Provinces (1 of 3) .......................................................................... 4‐29
Exhibit 4.6‐6. Ecological Provinces (2 of 3) .......................................................................... 4‐30
Exhibit 4.6‐7. Ecological Provinces (3 of 3) .......................................................................... 4‐31
Exhibit 4.6‐8. Nature Preserves and Prairie Remnants ..................................................... 4‐33
Exhibit 4.6‐9. Nature Preserves and Prairie Remnants ..................................................... 4‐34
Exhibit 4.6‐10. Nature Preserves and Prairie Remnants ................................................... 4‐35

Chicago-St. Louis High-Speed Rail viii Tier 1 DEIS
Exhibit 4.6‐11. Hines Emerald Dragonfly............................................................................ 4‐40
Exhibit 4.8‐1. Typical A‐Weighted Sound Levels .............................................................. 4‐49
Exhibit 4.8‐2. Typical Levels of Ground‐Borne Vibration ................................................. 4‐51
Exhibit 4.9‐1. Drainage Basins (1 of 3) ................................................................................. 4‐54
Exhibit 4.9‐2. Drainage Basins (2 of 3) ................................................................................. 4‐55
Exhibit 4.9‐3. Drainage Basins (3 of 3) ................................................................................. 4‐56
Exhibit 4.9‐4. Outstanding Resource Value Streams ......................................................... 4‐62
Exhibit 4.9‐5. Biologically Significant Streams ................................................................... 4‐63
Exhibit 4.9‐6. Aquatic Features (1 of 3) ................................................................................ 4‐64
Exhibit 4.9‐7. Aquatic Features (2 of 3) ................................................................................ 4‐65
Exhibit 4.9‐8. Aquatic Features (3 of 3) ................................................................................ 4‐66
Exhibit 4.9‐9. Water Supply Resources (1 of 3) ................................................................... 4‐69
Exhibit 4.9‐10. Water Supply Resources (2 of 3) ................................................................. 4‐70
Exhibit 4.9‐11. Water Supply Resources (3 of 3) ................................................................. 4‐71
Exhibit 4.10‐1. 100 Year Floodplain Crossings (1 of 3) ...................................................... 4‐73
Exhibit 4.10‐2. 100 Year Floodplain Crossings (2 of 3) ...................................................... 4‐74
Exhibit 4.10‐3. 100 Year Floodplain Crossings (3 of 3) ...................................................... 4‐75
Exhibit 4.11‐1. National Wetland Inventory Crossings (1 of 3) ........................................ 4‐77
Exhibit 4.11‐2. National Wetland Inventory Crossings (2 of 3) ........................................ 4‐78
Exhibit 4.11‐3. National Wetland Inventory Crossings (3 of 3) ........................................ 4‐79
Exhibit 4.13‐1. Illinois Scenic Byways .................................................................................. 4‐84
Exhibit 4.14‐1. Special Waste (1 of 3) ................................................................................... 4‐86
Exhibit 4.14‐2. Special Waste (2 of 3) ................................................................................... 4‐87
Exhibit 4.14‐3. Special Waste (3 of 3) ................................................................................... 4‐88
Exhibit 4.15‐1. Section 4(f) Resources................................................................................... 4‐92
Exhibit 5.5‐1. Potential Impacts to the Lockport Historic DistrictExhibit 5.5‐2. Potential
Impacts to Joliet Steel Works ......................................................................... 5‐23
Exhibit 5.5‐2. Potential Impacts to Joliet Steel Works ........................................................ 5‐24
Exhibit 5.5‐3. Potential Impacts to Hamilton Park ............................................................. 5‐25
Exhibit 5.5‐4. Potential Impacts to Dwight Chicago and Alton Railroad Depot ........... 5‐27
Exhibit 5.5‐5. Potential Impacts to Bridge over Market Street ......................................... 5‐28
Exhibit 5.5‐6. Potential Impacts to Lincoln Courthouse Square Historic District .......... 5‐29
Exhibit 5.5‐7. Potential Impacts to Susan Lawrence Dana House ................................... 5‐30
Exhibit 5.5‐8. Potential Impacts to Route 66, Girard to Nilwood .................................... 5‐31
Exhibit 5.6‐1. Endangered Species (1 of 3) ........................................................................... 5‐37
Exhibit 5.6‐2. Endangered Species (2 of 3) ........................................................................... 5‐38
Exhibit 5.6‐3. Endangered Species (3 of 3) ........................................................................... 5‐39
Exhibit 5.8‐1. Noise Impact Criteria for High Speed Rail Programs ............................... 5‐46
Exhibit 5.8‐2. Increase in Cumulative Noise Levels Allowed by Criteria ...................... 5‐48
Exhibit 5.15‐1. Potential Impacts to Hoyne Park ................................................................ 5‐76
Exhibit 5.15‐2. Potential Impacts to Summit Park .............................................................. 5‐77
Exhibit 5.15‐5. Potential Impacts to Hamilton Park ........................................................... 5‐80
Exhibit 5.15‐7. Potential Impacts to Vogt Woods Park ...................................................... 5‐83
Exhibit 5.15‐8. Potential Impacts to Midlothian Meadows ............................................... 5‐84
Exhibit 5.15‐9. Potential Impacts to St. Mihiel Reservation .............................................. 5‐85
Exhibit 5.15‐10. Potential Impacts to Pilcher Park ............................................................. 5‐86
Chicago-St. Louis High-Speed Rail ix Tier 1 DEIS
Exhibit 5.15‐11. Potential Impacts to Hickory Creek Preserve ......................................... 5‐88
Exhibit 5.15‐12. Potential Impacts to Midewin National Tallgrass Prairie ..................... 5‐89
Exhibit 5.15‐13. Potential Impacts to Funks Grove/Stubblefield Nature Preserve ........ 5‐90
Exhibit 5.15‐14. Potential Impacts to Edward R. Madigan State Park / Railsplitter Park
………………. ........................................................................................................................... 5‐91
Exhibit 5.15‐15. Potential Impacts to the Interurban Trail ................................................ 5‐93
Exhibit 6.1‐1. Rail to Rail Crossings – Chicago to Joliet (Build Alternative Section 1) . 6‐11
Exhibit 6.1‐2. Rail to Rail Crossings – Chicago to Joliet (Build Alternative Section 2) . 6‐12
Exhibit 6.1‐3. Rail to Rail Crossings – Chicago to Joliet (Build Alternative Section 2) . 6‐14
Exhibit 6.1‐10. St. Louis Area Intercity Passenger Routes ................................................. 6‐26
Exhibit 6.1‐11 Railroads in the St. Louis Area ..................................................................... 6‐27
Exhibit 7.2‐1. Staged Improvements ...................................................................................... 7‐6
List of Tables
Table S.4‐1. Summary of Impacts and Costs ......................................................................... 0‐8
Table S.4‐2. Comparison of Land Use and Environmental Justice Impacts between Build
Alternatives ........................................................................................................ 0‐9
Table S.4‐3. Annual Energy Consumption (billions of BTUs) ............................................ 0‐9
Table S.4‐4. Prime Farmland Soil Impacts by Alternative ................................................ 0‐10
Table S.4‐5. Summary of Potentially Impacted Historic Architectural Resources ........ 0‐11
Table S.4‐6. Acreage of Impact to Natural Resources by Alternative ............................. 0‐12
Table S.4‐7 Noise and Vibration Impacts (Number of Sensitive Receptors) ................... 0‐13
Table S.4‐8. 100‐Year Floodplain Impact by Alternative .................................................. 0‐14
Table S.4‐9. NWI Wetland Impact by Alternative ............................................................. 0‐15
Table S.4‐11. Special Waste Sites by Alternative ................................................................ 0‐15
Table S.4‐10. Visual Resource Impact Summary ................................................................ 0‐16
Table S.4‐12. Potential Number of Section 4(f) Resources Impacted ............................... 0‐17
Table S.5‐1. Potential Mitigation ........................................................................................... 0‐23
Table S.8‐1. Predicted Crashes .............................................................................................. 0‐31
Table S.8‐2. Vehicle Delays .................................................................................................... 0‐31
Table S.8‐3. Horn Blowing ..................................................................................................... 0‐32
Table S.8‐4. Displacements and Access Changes ............................................................... 0‐32
Table S.8‐5. Environmental Impact Summary of Alternatives 2A and 2B ..................... 0‐33
Table S.8‐6. Summary of Noise Impact Results .................................................................. 0‐34
Table S.8‐7. Mitigation ........................................................................................................... 0‐35
Table 2.1‐1: Chicago to St. Louis HSR Corridor – Existing Track Configuration ............ 2‐5
Table 2.3‐1. U.S. Transportation Accident Rates for Land‐Based Modes (2006) ............. 2‐9
Table 2.3‐2: Fatality Rates by Mode (2006) .......................................................................... 2‐11
Table 3.1‐1. Design Elements of the Program Alternatives ................................................. 3‐3
Table 3.1‐2. Tier 1 Objectives and Screening Criteria ........................................................... 3‐5
Table 3.2‐1. Summary of Approved and/or Completed Rail Design Elements, Features,
and/or Improvements Considered Part of the No‐Build Alternative ...... 3‐13
Table 3.2‐2. Travel Times by Transportation Mode between Chicago and St. Louis .... 3‐16
Chicago-St. Louis High-Speed Rail x Tier 1 DEIS
Table 3.2‐3. Annual Ridership Data for Each Mode of Transportation between Chicago
and St. Louis under the Existing and No‐Build Alternative Conditions 3‐16
Table 3.3‐1. Travel Times by Transportation Mode between Chicago and St. Louis .... 3‐20
Table 3.3‐2. Annual Ridership Data for Each Mode of Transportation between Chicago
and St. Louis .................................................................................................... 3‐21
Table 3.3‐3. Summary of Chicago to Joliet Tier 1 Screening .............................................. 3‐36
Table 3.3‐4. Summary of Springfield Tier 1 Screening .......................................................... 43
Table 3.3‐5. Summary of Alton to St. Louis Tier 1 Screening ............................................ 3‐50
Table 3.3‐6. Proposed New Right‐of‐Way for each Build Alternative by Section .......... 3‐58
Table 3.3‐7. Summary of Station Improvements ................................................................. 3‐59
Table 3.4‐1. Capital Cost for each Build Alternative Section ............................................ 3‐63
Table 3.4‐2. Capital Cost for each Build Alternative Section ............................................ 3‐63
Table 4.2‐1. Environmental Justice Populations ................................................................. 4‐11
Table 4.2‐2. Community Facilities ........................................................................................ 4‐12
Table 4.3‐1. Existing Annual Passenger‐Miles of Travel and Energy Consumption .... 4‐13
Table 4.5‐1. NRHP and NRHP‐Eligible Resources within 250 Feet of Alignments ...... 4‐18
Table 4.5‐2. Previously‐Identified Archaeological Sites .................................................... 4‐21
Table 4.6‐1. INPC Protected Areas within Study Corridor .............................................. 4‐41
Table 4.7‐1. National Ambient Air Quality Standards ...................................................... 4‐43
Table 4.7‐2. Attainment Status1 ............................................................................................ 4‐44
Table 4.7‐3. Criteria Air Pollutant Monitoring Data .......................................................... 4‐46
Exhibit 4.8‐2. Typical Levels of Ground‐Borne VibrationTable 4.8‐1 Existing Noise
Levels ................................................................................................................ 4‐51
Table 4.8‐1 Existing Noise Levels .......................................................................................... 4‐52
Table 4.8‐2 Existing Vibration Levels ................................................................................... 4‐52
Table 4.9‐1. Drainage Basins* ................................................................................................ 4‐53
Table 4.9‐2. 303(d) Listed Impaired Waters in the Study Corridor ................................. 4‐58
Table 4.10‐1. Major 100‐year Floodplain Streams within Study Corridor ...................... 4‐72
Table 4.11‐1. Acreage of Wetland Types within the Study Corridor .............................. 4‐76
Table 4.13‐1. Landscape Regions, Units, and Visual Survey Locations .......................... 4‐82
Table 4.14‐1. Environmental Databases ............................................................................... 4‐85
Table 4.14‐2. NPL Sites ........................................................................................................... 4‐89
Table 4.15‐1. Potential Section 4(f) Properties within 250 Feet of Alignments .............. 4‐90
Table 4.15‐2. Potential Section 6(f) Properties within 250 Feet of Alignments .............. 4‐93
Table 4.16‐1. At‐Grade Rail‐Rail Crossings ......................................................................... 4‐95
Table 4.16‐2. Summary of Highway‐Rail Crossings .......................................................... 4‐96
Table 5.1‐1. Buildings Potentially Displaced by Alternative A .......................................... 5‐4
Table 5.1‐2. Buildings Potentially Displaced by Alternative B .......................................... 5‐6
Table 5.1‐3. Buildings Potentially Displaced by Alternative C .......................................... 5‐7
Table 5.1‐4. Buildings Potentially Displaced by Alternative D .......................................... 5‐8
Table 5.1‐5. Comparison of Land Use Impacts between Alternatives .............................. 5‐9
Table 5.2‐1. Alternative A Geographic Distribution of Low‐income and Minority
Populations ...................................................................................................... 5‐12
Table 5.2‐2. Alternative B Geographic Distribution of Low‐income and Minority
Populations ...................................................................................................... 5‐13
Chicago-St. Louis High-Speed Rail xi Tier 1 DEIS
Table 5.2‐3. Alternative C Geographic Distribution of Low‐income and Minority
Populations ...................................................................................................... 5‐14
Table 5.2‐4. Alternative D Geographic Distribution of Low‐income and Minority
Populations ...................................................................................................... 5‐15
Table 5.2‐5. Comparison of Socioeconomic and Community Impacts between Build
Alternatives and Sections ............................................................................... 5‐16
Table 5.3‐1. Annual Passenger‐Miles of Travel (millions) ................................................ 5‐17
Table 5.3‐2. Annual Energy Consumption (billions of BTUs) .......................................... 5‐18
Table 5.4‐1. Prime Farmland Soil Impacts by Section ....................................................... 5‐19
Table 5.4‐1. Prime Farmland Soil Impacts by Section (continued) .................................. 5‐20
Table 5.4‐2. Prime Farmland Soil Impacts by Alternative ................................................ 5‐20
Table 5.5‐1. Potentially Impacted Historic Architectural Resources ............................... 5‐21
Table 5.5‐2. Summary of Potentially Impacted Architectural Resources ....................... 5‐22
Table 5.6‐1. Acreage of Impact to Natural Resources by Section .................................... 5‐33
Table 5.6‐2. Acreage of Impact to Natural Resources by Alternative ............................. 5‐33
Table 5.6‐3. State Threatened and Endangered Species Recorded within the Existing and
Proposed ROW ................................................................................................ 5‐35
Table 5.7‐1. Estimated Annual Operational Emissions of Key Criteria Air Pollutants in
Nonattainment Areas1 .................................................................................... 5‐41
Table 5.7‐2. Predicted CO2 Emissions for Key Alternative Transportation Modes within
the Study Corridor .......................................................................................... 5‐44
Table 5.8‐1. Land Use Categories and Metrics for High Speed Rail Noise Impact Criteria
........................................................................................................................... 5‐45
Table 5.8‐2. Ground‐Borne Vibration Impact Criteria for Human Annoyance ............. 5‐49
Table 5.8‐3 Noise Impacts1,2 (Number of Sensitive Receptors) ......................................... 5‐50
Table 5.8‐4. Comparison of Ground Vibration Impact Curves ........................................ 5‐51
Table 5.8‐5 Vibration Impacts1,2 (Number of Sensitive Receptors) ................................... 5‐52
Table 5.8‐6. Vibration Source Levels for Construction Equipment ................................. 5‐53
Table 5.8‐7. Construction Equipment Vibration Impact Distances ................................. 5‐54
Table 5.9‐1. Summary of Surface Water Crossings by Section ......................................... 5‐59
Table 5.9‐2. Summary of Surface Water Crossings by Alternative .................................. 5‐60
Table 5.9‐3. Special Status Stream Impacts by Section ...................................................... 5‐61
Table 5.9‐4. Special Status Stream Impacts by Alternative ............................................... 5‐62
Table 5.9‐5. Well Crossings by Alternative ......................................................................... 5‐63
Table 5.10‐1. 100‐Year Floodplain Impacts by Section ...................................................... 5‐64
Table 5.10‐2. 100‐Year Floodplain Impacts by Alternative ............................................... 5‐64
Table 5.11‐1. NWI Wetland Impacts by Section ................................................................. 5‐65
Table 5.11‐2. NWI Wetland Impact by Alternative ........................................................... 5‐66
Table 5.13‐1. Visual Resource Impact Summary ................................................................ 5‐68
Table 5.14‐1. Special Waste Sites by Section ....................................................................... 5‐72
Table 5.14‐2. Special Waste Sites by Alternative ................................................................ 5‐72
Table 5.15‐1. Potential Section 4(f) Resource Uses by Section .......................................... 5‐73
Table 5.15‐2. Potential Number of Uses of Section 4(f) Resources by ............................. 5‐74
Section and Alternative .......................................................................................................... 5‐74
Table 5.16‐1. Rail‐Rail Crossings to be Modified ............................................................... 5‐95
Table 5.22‐1. Summary of Impacts and Costs ................................................................... 5‐102
Chicago-St. Louis High-Speed Rail xii Tier 1 DEIS
Table 5.23‐1. Potential Mitigation Measures ..................................................................... 5‐103
Table 6.1‐1. Travel Times and Costs by Mode of Transportation ...................................... 6‐2
Table 6.1‐2. Chicago–St. Louis Intercity Passenger Rail Service Representative Travel
Times – Southbound ......................................................................................... 6‐8
Table 6.1‐3. Trains per Day ‐ Chicago to Joliet (Section 1) ................................................ 6‐10
Table 6.1‐4. Trains per Day ‐ Chicago to Joliet (Section 2) ................................................ 6‐13
Table 6.1‐5. Chicago‐St. Louis Train Operations on the UP Joliet Subdivision (Joliet to
Bloomington) ................................................................................................... 6‐13
Table 6.1‐6. Chicago‐St. Louis Train Operations on the UP‐Springfield Subdivision
(Bloomington to Ridgley) ............................................................................... 6‐15
Table 6.1‐7. Chicago‐St. Louis Train Operations on the UP‐Springfield Subdivision
(Ridgley to Godfrey) ....................................................................................... 6‐16
Table 6.1‐8. Chicago‐St. Louis Train Operations on the UP‐Springfield Subdivision
(Godfrey to WR Tower) .................................................................................. 6‐16
Table 6.1‐9. Chicago to St. Louis Passenger Vehicles ........................................................ 6‐31
Table 6.1‐10. Annual Ridership – Existing (2010) .............................................................. 6‐36
Table 6.1‐11. Annual Ridership – 2030 No‐Build Alternative .......................................... 6‐37
Table 6.1‐12. Annual Ridership – 2030 Build Alternatives – Existing (100%) Fare ....... 6‐38
Table 6.1‐13. Annual Ridership – 2030 Build Alternatives – 150% Fare ......................... 6‐39
Table 6.1‐14. Annual Ridership – 2030 Build Alternatives – 200% Fare ......................... 6‐40
Table 6.1‐15. Ticket Revenue Forecasts (in 2010 dollars) .................................................. 6‐42
Table 7.1‐1. Expected Timetable after Completion of Current Program .......................... 7‐1
Table 7.2‐1. Expected Timetable after 303/304 Upgrade ..................................................... 7‐3
Table 8.2‐1. Areas of Concern ................................................................................................. 8‐6
Table 8.2‐2. Alternative Evaluation Criteria ......................................................................... 8‐8
Chicago-St. Louis High-Speed Rail xiii Tier 1 DEIS
Volume II Table of Contents 1.0 INTRODUCTION ......................................................................................................... 1‐1
1.1 Tiering Process ‐ Overview ............................................................................... 1‐1
1.2 Tier 1 Alternatives in Springfield .................................................................... 1‐1
1.3 Anticipated Decisions ........................................................................................ 1‐5
2.0 PURPOSE AND NEED FOR THE SPRINGFIELD RAIL IMPROVEMENTS
PROJECT .................................................................................................................................... 2‐1
2.1 Project Purpose .................................................................................................... 2‐1
2.1.1 Chicago to St. Louis High Speed Rail ................................................... 2‐1
2.1.2 Springfield Rail Improvements Project ................................................ 2‐1
2.2 Project Need ......................................................................................................... 2‐5
2.2.1 Chicago to St. Louis Need ...................................................................... 2‐5
2.2.2 Springfield Rail Improvements Project Need...................................... 2‐5
2.2.3 Goals and Objectives ............................................................................. 2‐14
2.3 Project Background ........................................................................................... 2‐14
2.3.1 Springfield Rail Improvements Project .............................................. 2‐15
2.4 Major Authorizing Laws and Regulations ................................................... 2‐16
2.5 Scoping ................................................................................................................ 2‐16
3.0 ALTERNATIVES ........................................................................................................... 3‐1
3.1 Tier 2 Alternatives Screening Process ............................................................. 3‐1
3.1.1 Tier 2 Screening and Selection Process ................................................. 3‐1
3.2 No Action – No Build Alternative .................................................................... 3‐4
3.3 Action – Build Alternatives ............................................................................... 3‐5
3.3.1 Alternative 1 ............................................................................................. 3‐5
3.3.2 Alternative 2 ........................................................................................... 3‐11
3.4 Springfield Tier 2 Screening of Alternatives ............................................... 3‐17
3.4.1 Safety ....................................................................................................... 3‐17
3.4.2 Congestion .............................................................................................. 3‐18
3.4.3 Livability and Commercial Activity ................................................... 3‐18
3.4.4 Lifecycle and Capital Costs .................................................................. 3‐19
3.4.5 Operational Issues ................................................................................. 3‐24
3.4.6 Impacts to Existing Development ....................................................... 3‐24
3.4.7 Impacts to Social and Economic Resources ....................................... 3‐24
3.4.8 Tier 2 Screening ..................................................................................... 3‐25
3.5 Alternatives Carried Forward ......................................................................... 3‐26

Chicago-St. Louis High-Speed Rail xiv Tier 1 DEIS
4.0 AFFECTED ENVIRONMENT .................................................................................... 4‐1
4.1 Existing Land Use ................................................................................................ 4‐1
4.2 Socioeconomic and Community Characteristics ........................................... 4‐3
4.2.1 Population and Population Distribution ............................................. 4‐3
4.2.2 Racial Composition ................................................................................. 4‐4
4.2.3 Economics and Employment ................................................................. 4‐4
4.2.4 Income and Wages .................................................................................. 4‐6
4.2.5 Environmental Justice and Title VI ....................................................... 4‐8
4.2.6 Transportation Network ...................................................................... 4‐13
4.2.7 Communities, Facilities, and Services ................................................ 4‐16
4.3 Energy .................................................................................................................. 4‐21
4.4 Cultural Resources ............................................................................................ 4‐21
4.4.1 Project Area – 10th Street Corridor ...................................................... 4‐23
4.4.2 Archaeological Resources .................................................................... 4‐27
4.5 Natural Resources ............................................................................................. 4‐28
4.5.1 Geology and Soils .................................................................................. 4‐28
4.5.2 Ecological Resources ............................................................................. 4‐32
4.5.3 Threatened and Endangered Species ................................................. 4‐34
4.5.4 Natural Areas ......................................................................................... 4‐37
4.6 Air Quality .......................................................................................................... 4‐37
4.6.1 Air Quality Conformity ........................................................................ 4‐37
4.6.2 Ambient Air Quality ............................................................................. 4‐38
4.7 Noise/Vibration ................................................................................................. 4‐39
4.7.1 Noise and Vibration Impact Criteria .................................................. 4‐39
4.7.2 Existing Conditions ............................................................................... 4‐44
4.8 Water Quality/Resources ................................................................................. 4‐50
4.8.1 Surface Water Resources ...................................................................... 4‐50
4.8.2 Water Quality ......................................................................................... 4‐53
4.8.3 Groundwater .......................................................................................... 4‐53
4.9 Floodplains ......................................................................................................... 4‐55
4.10 Wetlands ............................................................................................................. 4‐55
4.11 Special Waste ..................................................................................................... 4‐56
4.11.1 SProject Area – 10th Street Corridor .................................................... 4‐59
4.12 Special Lands ..................................................................................................... 4‐60
4.12.1 Section 4(f) Resources ........................................................................... 4‐60
4.12.2 Section 6(f) Lands .................................................................................. 4‐61
4.13 Public Health, Safety and Security ................................................................ 4‐63
4.13.1 Rail Operations Safety and Security ................................................... 4‐63
4.13.2 Crossing Safety ...................................................................................... 4‐64
Chicago-St. Louis High-Speed Rail xv Tier 1 DEIS
5.0 ENVIRONMENTAL CONSEQUENCES .................................................................. 5‐1
5.1 Land Use Impacts ................................................................................................ 5‐2
5.1.1 No‐Build Alternative .............................................................................. 5‐2
5.1.2 Alternatives 2A/2B ................................................................................ 5‐19
5.2 Socioeconomics and Environmental Justice ................................................ 5‐19
5.2.1 Displacements ........................................................................................ 5‐19
5.2.2 Public Services/Facilities ...................................................................... 5‐25
5.2.3 Community Impacts ............................................................................. 5‐26
5.2.4 Economic Impacts ................................................................................. 5‐38
5.3 Energy .................................................................................................................. 5‐41
5.4 Cultural Resources ............................................................................................ 5‐41
5.4.1 Archaeological Resources .................................................................... 5‐47
5.5 Agriculture .......................................................................................................... 5‐47
5.6 Air Quality .......................................................................................................... 5‐47
5.6.1 Conformity ............................................................................................. 5‐47
5.6.2 Local Air Quality ................................................................................... 5‐47
5.6.3 Construction Impacts ............................................................................ 5‐48
5.7 Noise/Vibration ................................................................................................. 5‐49
5.7.1 Noise and Vibration Projections ......................................................... 5‐49
5.7.2 Noise and Vibration Impact Assessment ........................................... 5‐52
5.7.3 Construction Noise Impact Assessment ............................................ 5‐57
5.7.4 Noise and Vibration Mitigation .......................................................... 5‐57
5.8 Water Quality/Resources ................................................................................. 5‐59
5.8.1 Surface Water Impacts .......................................................................... 5‐59
5.9 Utilities ................................................................................................................ 5‐60
5.10 Visual and Aesthetic Quality .......................................................................... 5‐61
5.11 Special Waste ..................................................................................................... 5‐61
5.12 Special Lands ..................................................................................................... 5‐61
5.13 Public Health, Safety and Security ................................................................ 5‐63
5.14 Permits ................................................................................................................. 5‐64
5.15 Construction Impacts ........................................................................................ 5‐65
5.16 Indirect and Cumulative Impacts ................................................................... 5‐65
5.16.1 Indirect Impacts ..................................................................................... 5‐65
5.16.2 Cumulative Impacts .............................................................................. 5‐67
5.17 Other Impacts ..................................................................................................... 5‐68
5.17.1 Railroad Operations .............................................................................. 5‐68

Chicago-St. Louis High-Speed Rail xvi Tier 1 DEIS
5.17.2 Reduce Train Horn Blowing ................................................................ 5‐68
5.18 The Relationship Between Local Short‐Term Uses and Man’s
Environment and the Maintenance and Enhancement of Long‐Term
Productivity ........................................................................................................ 5‐69
5.19 Irreversible and Irretrievable Commitments of Resources ....................... 5‐69
5.20 Transportation Impacts .................................................................................... 5‐70
5.20.1 Service Development Plan ................................................................... 5‐70
5.20.2 Capital Cost ............................................................................................ 5‐70
5.20.3 Travel Benefits ....................................................................................... 5‐71
5.20.4 Additional Impacts to Rail, Air and Bus Service .............................. 5‐71
5.21 Mitigation Actions ............................................................................................ 5‐71
5.22 Preferred Alternative ........................................................................................ 5‐72
6.0 COMMENTS AND COORDINATION .................................................................... 6‐1
6.1 Agency Coordination .......................................................................................... 6‐1
6.1.1 Federal Agency Coordination ............................................................... 6‐1
6.1.2 State Agency Coordination .................................................................... 6‐2
6.1.3 Local Governments ................................................................................. 6‐2
6.2 Technical Committee .......................................................................................... 6‐3
6.3 Public Involvement Activities .......................................................................... 6‐3
6.3.1 Stakeholder Interviews ........................................................................... 6‐3
6.3.2 Stakeholder Advisory Groups ............................................................... 6‐4
6.3.3 Communications, Outreach, and Engagement ................................... 6‐4
6.3.4 Public Open Houses ................................................................................ 6‐5
7.0 LIST OF PREPARERS ................................................................................................... 7‐1
8.0 DISTRIBUTION OF THE DRAFT EIS ...................................................................... 8‐1
9.0 REFERENCES ................................................................................................................. 9‐1
APPENDICES
Appendix A Correspondence
Appendix B Special Waste
Appendix C Newsletters

Chicago-St. Louis High-Speed Rail xvii Tier 1 DEIS
List of Exhibits Exhibit 2‐1A. Project Location ................................................................................................ 2‐2
Exhibit 2‐1B. Project Area Location ........................................................................................ 2‐3
Exhibit 2‐2. Existing Railroad Corridors ................................................................................ 2‐4
Exhibit 2‐3. Existing Tracks on 3rd Street ............................................................................... 2‐8
Exhibit 2‐4. Location and Magnitude of Crossing Delays ................................................ 2‐10
Exhibit 2‐5. Springfield’s Medical District .......................................................................... 2‐12
Exhibit 3‐1. Alternative 1A ...................................................................................................... 3‐7
Exhibit 3‐2. Alternative 1B ....................................................................................................... 3‐8
Exhibit 3‐3. Alternative 1C ...................................................................................................... 3‐9
Exhibit 3‐4. Passenger Station on 3rd Street ......................................................................... 3‐12
Exhibit 3‐5. Alternative 2A .................................................................................................... 3‐13
Exhibit 3‐6. Alternative 2B ..................................................................................................... 3‐14
Exhibit 3‐7. Passenger Station on 10th Street ....................................................................... 3‐19
Exhibit 4‐1. Existing Land Use ................................................................................................ 4‐2
Exhibit 4‐2. Economic Activity Centers ................................................................................. 4‐7
Exhibit 4‐3. Census Blocks with Minority Populations > 50 Percent ................................ 4‐11
Exhibit 4‐4. Roadways ........................................................................................................... 4‐14
Exhibit 4‐5. Bus Routes ........................................................................................................... 4‐15
Exhibit 4‐6. Neighborhood Associations .............................................................................. 4‐17
Exhibit 4‐7. Community Facilities ......................................................................................... 4‐18
Exhibit 4‐8. Bike Trails ........................................................................................................... 4‐20
Exhibit 4‐9. National Register Sites ...................................................................................... 4‐22
Exhibit 4‐10. Physiographic Divisions ................................................................................. 4‐29
Exhibit 4‐11. Bedrock Geology .............................................................................................. 4‐30
Exhibit 4‐12. Underground Mining ...................................................................................... 4‐31
Exhibit 4‐13. Noise and Vibration Locations ....................................................................... 4‐45
Exhibit 4‐14. Watersheds ....................................................................................................... 4‐51
Exhibit 4‐15. Streams and Floodplains ................................................................................ 4‐52
Exhibit 4‐16. Wells and Aquifers .......................................................................................... 4‐54
Exhibit 4‐17. NWI Mapped Wetlands .................................................................................. 4‐57
Exhibit 4‐18. Parks .................................................................................................................. 4‐62
Exhibit 5‐1. Alternative 2A and 2B – Key Map ..................................................................... 5‐3
Exhibit 5‐1A. Alternative 2A ................................................................................................... 5‐4
Exhibit 5‐1B. Alternative 2A ................................................................................................... 5‐5
Exhibit 5‐1C. Alternative 2A ................................................................................................... 5‐6
Exhibit 5‐1D. Alternative 2A ................................................................................................... 5‐7
Exhibit 5‐1E. Alternative 2A ................................................................................................... 5‐8
Exhibit 5‐1F. Alternative 2A .................................................................................................... 5‐9
Exhibit 5‐1G. Alternative 2A ................................................................................................. 5‐10
Exhibit 5‐1H. Alternative 2A ................................................................................................. 5‐11
Exhibit 5‐1I. Alternative 2A ................................................................................................... 5‐12
Exhibit 5‐1J. Alternative 2A ................................................................................................... 5‐13

Chicago-St. Louis High-Speed Rail xviii Tier 1 DEIS
Exhibit 5‐1K. Alternative 2A ................................................................................................. 5‐14
Exhibit 5‐1L. Alternative 2A ................................................................................................. 5‐15
Exhibit 5‐2A. Alternative 2B ................................................................................................. 5‐16
Exhibit 5‐2B. Alternative 2B .................................................................................................. 5‐17
Exhibit 5‐2C. Alternative 2B .................................................................................................. 5‐18
Exhibit 5‐3A. Adverse Travel Alternative 2A ..................................................................... 5‐29
Exhibit 5‐3B. Adverse Travel Alternative 2A ..................................................................... 5‐30
Exhibit 5‐3C. Adverse Travel Alternative 2A ..................................................................... 5‐31
Exhibit 5‐4A. Adverse Travel Alternative 2B ..................................................................... 5‐34
Exhibit 5‐4B. Adverse Travel Alternative 2B ...................................................................... 5‐35
Exhibit 5‐4C. Adverse Travel Alternative 2B ...................................................................... 5‐36
Exhibit 5‐5. Underpass – 10th St. ........................................................................................... 5‐39
Exhibit 5‐6. Underpass Separation – 19th St. ....................................................................... 5‐40
List of Tables
Table 1‐1. Summary of Springfield Tier 1 Screening ............................................................ 1‐3
Table 2‐1. Number of Trains Through Springfield ............................................................... 2‐6
Table 2‐2. Springfield At‐Grade Crossings and Grade Separations ................................... 2‐7
Table 2‐3. Springfield Illinois ICC Accident Data for all Years (1955‐2010) ...................... 2‐7
Table 2‐4. Springfield Illinois ICC Trespassing Incidents, 2000‐2010 ................................ 2‐7
Table 2‐5. Business Types along 3rd Street and 10th Street Corridors ................................ 2‐13
Table 3‐1. Tier 2 Objectives and Screening Criteria .............................................................. 3‐2
Table 3‐2. Tier 2 Alternatives ................................................................................................ 3‐10
Table 3‐3. Predicted Crashes .................................................................................................. 3‐17
Table 3‐4. Vehicle Delays ........................................................................................................ 3‐18
Table 3‐5. Horn Blowing ......................................................................................................... 3‐19
Table 3‐6. Annual and Lifecycle Cost Assumptions ........................................................... 3‐20
Table 3‐7. Present Value of Annual and Lifecycle Costs (Millions) ................................. 3‐21
Table 3‐8. Capital Cost for Each Alternative ....................................................................... 3‐22
Table 3‐9. Number of Existing At‐Grade Street Crossings and Grade Separations ...... 3‐24
Table 3‐10. Additional Right‐of‐Way ................................................................................... 3‐24
Table 3‐11. Displacements and Access Changes ................................................................. 3‐25
Table 3‐12. Summary of Springfield Tier 2 Screening ........................................................ 3‐27
Table 4‐1. Land Uses Within the Project Area ...................................................................... 4‐1
Table 4‐2. Populations and Households ................................................................................ 4‐3
Table 4‐3. Population by Racial Composition (2010) ........................................................... 4‐4
Table 4‐4. Labor Force Estimates for 2010 .............................................................................. 4‐4
Table 4‐5. Employment by Industry Category for Sangamon County for 2009 ............... 4‐5
Table 4‐6. Major Employers in Sangamon County (November 2009) ................................ 4‐6
Table 4‐7. Median Household Income .................................................................................... 4‐8
Table 4‐8. Minority Population and Poverty Level ............................................................. 4‐9
Table 4‐9. Environmental Justice Populations ..................................................................... 4‐12

Chicago-St. Louis High-Speed Rail xix Tier 1 DEIS
Table 4‐10. Neighborhood Associations along the Project Area ....................................... 4‐16
Table 4‐11. Significant Property Count in the 10th Street Corridor (1) .............................. 4‐24
Table 4‐12. Air Quality Monitor Data for Springfield, Illinois (2007‐2009) .................... 4‐38
Table 4‐13. FTA Land Use Categories .................................................................................. 4‐40
Table 4‐14. FTA Ground‐Borne Vibration and Ground‐Borne Noise Impact Criteria . 4‐43
Table 4‐15. Ground‐Borne Vibration and Noise Impact Criteria for Special Buildings 4‐43
Table 4‐16. FTA Construction Noise Criteria ..................................................................... 4‐44
Table 4‐17. Summary of Existing Ambient Noise Measurement Results ....................... 4‐46
Table 4‐18. Summary of Existing Vibration Measurements (1) ......................................... 4‐49
Table 4‐19. CERCLIS Sites ..................................................................................................... 4‐59
Table 4‐20. Hazardous Materials Sites within Project Area (10th Street Corridor) ........ 4‐60
Table 5‐1. Environmental Impact Summary of Alternatives 2A and 2B ........................... 5‐1
Table 5‐2. Residential and Commercial Displacements .................................................... 5‐21
Table 5‐3. Miles of Rail Traffic Through Residential Neighborhoods ............................. 5‐26
Table 5‐4. Maximum Adverse Travel for Enterprise Street ............................................... 5‐32
Table 5‐5. Grade Separations ................................................................................................. 5‐37
Table 5‐6. Properties of Architectural Significance within the Area of Potential Effect‐
10th Street Corridor (1) .............................................................................................................. 5‐44
Table 5‐7. Summary of Noise Impact Results ..................................................................... 5‐53
Table 5‐8. Alternatives 2A and 2B Land Use Category 2 Vibration Impact Summary. 5‐55
Table 5‐9. Alternatives 2A and 2B Land Use Category 3 Vibration Impact Summary. 5‐56
Table 5‐10. Potential Resources Not Qualifying for Protection Under Section 4(f) ...... 5‐63
Table 5‐11. Predicted Crashes ............................................................................................... 5‐64
Table 5‐12. Number of At‐Grade Street Crossing for each Alternative .......................... 5‐68
Table 5‐13. Horn Blowing ..................................................................................................... 5‐69
Table 5‐14. Capital Cost for each Alternative ..................................................................... 5‐71
Table 5‐15. Mitigation Actions .............................................................................................. 5‐72
Table 6‐1. Public Response Summary ‐ Alternative Which Best Addresses
Accommodating Increasing Rail Traffic ................................................................................. 6‐9
Table 6‐2. Public Response Summary ‐ Factors Considered in Alternative Selection .. 6‐10
Charts
Chart 4‐1. FTA Project Noise Impact Criteria ..................................................................... 4‐41
Chart 4‐2. Increase in Cumulative Noise Exposure Allowed by FTA Criteria………..4‐42
SUMMARY
Summ
ary
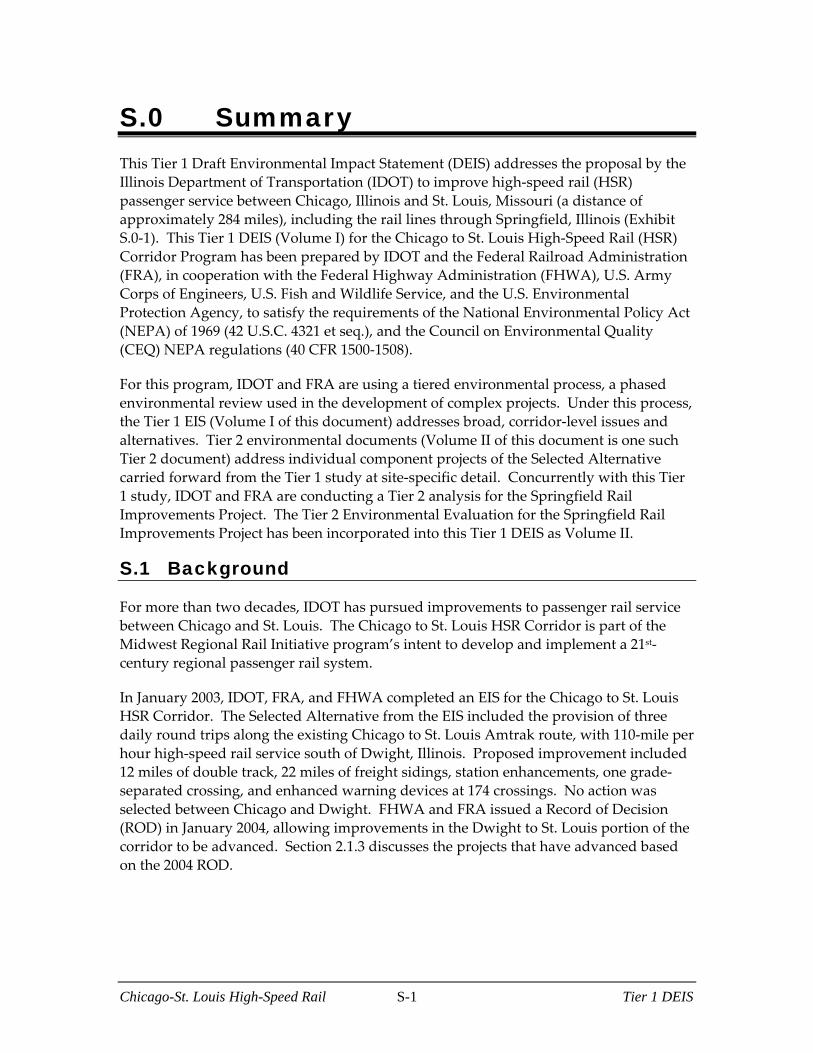
Chicago-St. Louis High-Speed Rail S-1 Tier 1 DEIS
S.0 Summary This Tier 1 Draft Environmental Impact Statement (DEIS) addresses the proposal by the
Illinois Department of Transportation (IDOT) to improve high‐speed rail (HSR)
passenger service between Chicago, Illinois and St. Louis, Missouri (a distance of
approximately 284 miles), including the rail lines through Springfield, Illinois (Exhibit
S.0‐1). This Tier 1 DEIS (Volume I) for the Chicago to St. Louis High‐Speed Rail (HSR)
Corridor Program has been prepared by IDOT and the Federal Railroad Administration
(FRA), in cooperation with the Federal Highway Administration (FHWA), U.S. Army
Corps of Engineers, U.S. Fish and Wildlife Service, and the U.S. Environmental
Protection Agency, to satisfy the requirements of the National Environmental Policy Act
(NEPA) of 1969 (42 U.S.C. 4321 et seq.), and the Council on Environmental Quality
(CEQ) NEPA regulations (40 CFR 1500‐1508).
For this program, IDOT and FRA are using a tiered environmental process, a phased
environmental review used in the development of complex projects. Under this process,
the Tier 1 EIS (Volume I of this document) addresses broad, corridor‐level issues and
alternatives. Tier 2 environmental documents (Volume II of this document is one such
Tier 2 document) address individual component projects of the Selected Alternative
carried forward from the Tier 1 study at site‐specific detail. Concurrently with this Tier
1 study, IDOT and FRA are conducting a Tier 2 analysis for the Springfield Rail
Improvements Project. The Tier 2 Environmental Evaluation for the Springfield Rail
Improvements Project has been incorporated into this Tier 1 DEIS as Volume II.
S.1 Background
For more than two decades, IDOT has pursued improvements to passenger rail service
between Chicago and St. Louis. The Chicago to St. Louis HSR Corridor is part of the
Midwest Regional Rail Initiative program’s intent to develop and implement a 21st‐
century regional passenger rail system.
In January 2003, IDOT, FRA, and FHWA completed an EIS for the Chicago to St. Louis
HSR Corridor. The Selected Alternative from the EIS included the provision of three
daily round trips along the existing Chicago to St. Louis Amtrak route, with 110‐mile per
hour high‐speed rail service south of Dwight, Illinois. Proposed improvement included
12 miles of double track, 22 miles of freight sidings, station enhancements, one grade‐
separated crossing, and enhanced warning devices at 174 crossings. No action was
selected between Chicago and Dwight. FHWA and FRA issued a Record of Decision
(ROD) in January 2004, allowing improvements in the Dwight to St. Louis portion of the
corridor to be advanced. Section 2.1.3 discusses the projects that have advanced based
on the 2004 ROD.
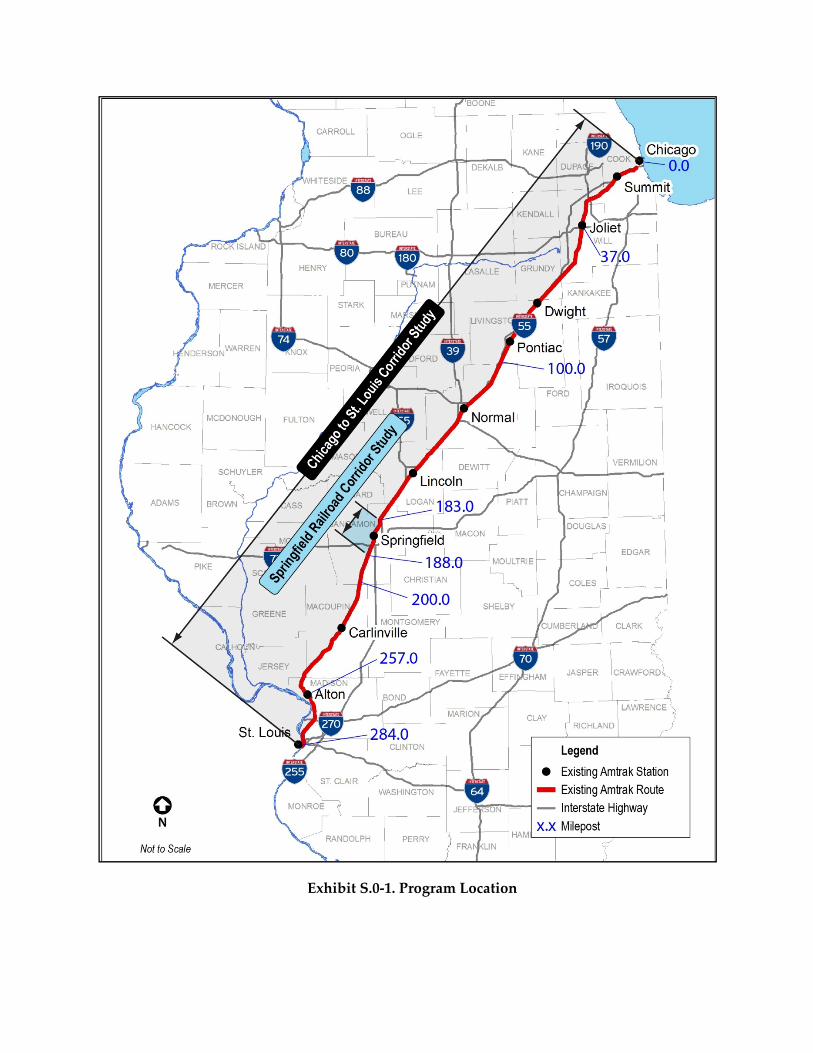
Exhibit S.0-1. Program Location
Chicago-St. Louis High-Speed Rail S-3 Tier 1 DEIS
In 2011, an Environmental Assessment (EA) was completed and a Finding of No
Significant Impact (FONSI) was issued for proposed track improvements from Joliet to
Dwight. These improvements include upgrading approximately 36 miles of existing
track and associated crossings to accommodate 110 mph high‐speed rail passenger
trains, the addition of six miles of double track, approximately two miles of new side
track, and about 12 new turnouts.
S.2 Purpose and Need
The purpose of the proposed Chicago to St. Louis HSR Corridor Program is to enhance
the passenger transportation network in the Chicago to St. Louis HSR Corridor by
improving high speed passenger rail service, resulting in a more balanced use of
different corridor travel options by diverting trips made by automobile and air to rail.
The existing transportation network consists of highway (automobile and bus), air, and
passenger rail travel. Currently, nearly all trips made annually within the Chicago to St.
Louis HSR Corridor are accomplished through automobile and air travel, with only one
percent by passenger rail. Enhancements to passenger rail service would include
reduced travel times, improved service reliability, increased frequency of trips, and
increased capacity. Increased use of passenger rail would result in an overall
improvement in traveler safety in the corridor, as well as a reduction in air pollutant
emissions and energy consumption.
The need for the Chicago to St. Louis High‐Speed Rail Corridor Program is based on the
following:
Because of inadequate rail capacity and deficiencies in the existing rail
infrastructure, there is currently a modal imbalance within the corridor. Rail travel
represents only 1.3 percent of the 51 million annual person trips within the Chicago
to St. Louis corridor, while automobile travel comprises 97.5 percent of these trips.
The other two modes, air and bus, comprise only 1.1 percent and 0.2 percent,
respectively. By 2030, it is projected that 62 million annual trips will occur in the
Chicago to St. Louis corridor with 96.6 percent consisting of automobiles, 1.5
percent air, 1.7 percent rail, and 0.2 percent bus. As a result, the modal imbalance is
projected to remain largely the same in 2030.
Between 2007 and 2010, on‐time performance for rail passenger service between
Chicago and St. Louis ranged from 38 percent to 75 percent. For air travel, 15 to 20
percent of flights in the corridor arrive late.
The single track between Joliet and St. Louis cannot accommodate existing and
projected freight and passenger train traffic resulting in travel time delays and the
inability to increase passenger rail service.
The new Joliet Intermodal Terminal will double the number of freight trains using
the Chicago to St. Louis corridor from six to 12. The number of freight trains is

Chicago-St. Louis High-Speed Rail S-4 Tier 1 DEIS
projected to increase to 22 by the year 2017, which could affect the performance and
capacity for high‐speed passenger rail.
From 2007 to 2010, rail passenger ridership between Chicago and St. Louis has
increased 34 percent. (Over this same period, ridership on the state‐supported
trains between Chicago and St. Louis increased by 72 percent.)
Automobile and bus travel between Chicago and St. Louis is limited primarily to
I‐55. Travel by this one route can often be unreliable due to traffic congestion,
weather, roadway construction, and accidents, which can substantially increase
travel times.
Automobile travel, which represents 95.5 percent of the trips within the corridor, is
the least safe mode of transportation when compared to air, rail, and bus travel.
Therefore, there is a need to provide safer alternative modes of transportation along
the corridor.
Although air travel has the shortest travel times and is the safest mode of
transportation, additional travel time must be considered for passage through
airport security and travel to and from the airport. In addition, air travel is
vulnerable to weather conditions, which can result in major delays and cancelled
flights. Also, there is currently no direct air service from the central part of the
corridor to St. Louis, and air travel provides little service to intermediate
destinations.
In addition to these corridor‐wide needs, the large number of grade crossings in
Springfield results in issues specific to that portion of the study area, including safety,
vehicle, and pedestrian delays. These needs are detailed in Volume II, Springfield Rail
Improvements Project Tier 2 Environmental Evaluation.
S.3 Alternatives Considered
An extensive alternatives screening process was conducted that led to the selection of
five alternatives to be evaluated in this Tier 1 DEIS: a No‐Build Alternative and four
HSR Build Alternatives (A, B, C, and D).
The No‐Build Alternative includes the continuation of intercity passenger service
between Chicago and St. Louis along with the planned passenger rail improvements
that will allow for limited HSR service between Joliet and St. Louis. The limited HSR
service between Joliet and St. Louis will begin following completion of several upgrades
to the existing tracks that were approved by a 2004 ROD (Dwight to St. Louis
improvements) and 2011 EA/FONSI (Joliet to Dwight improvements). The limited HSR
service resulting from these improvements will include up to three daily passenger
round trips at speeds up to 110 mph between Joliet and Alton, with the remaining
portions of the corridor allowing speeds of up to 79 mph. One additional non‐HSR daily
passenger round trip will continue to operate between Chicago and St. Louis, and one
non‐HSR Texas Eagle daily passenger round trip will continue to operate between
Chicago-St. Louis High-Speed Rail S-5 Tier 1 DEIS
Build Alternative. The estimated travel times between Chicago and St. Louis for the No‐
Build Alternative are expected to be between four hours and 30 minutes to four hours
and 45 minutes. This would allow the No‐Build Alternative to provide travel times that
are up to one hour and 12 minutes faster than the existing conditions.
The four Build Alternatives being evaluated would utilize different routes in three areas:
between Chicago and Joliet, through Springfield, and between Alton and St. Louis. The
proposed Build Alternative routes would utilize combinations of the existing passenger
rail (Amtrak) route and other proposed new intercity passenger routes that primarily
follow other existing rail lines. In general, the proposed improvements would include
double tracking along the entire length of the corridor in addition to improvements to
railroad crossings, signals, and stations. In developing these four Build Alternatives, the
corridor was divided into the following seven sections (Exhibit S.3‐1):
Section 1 – Existing Route from Chicago to Joliet
Section 2 – Proposed New Route (i.e., Rock Island Route) from Chicago to Joliet
Section 3 – Existing Route from Joliet to Springfield
Section 4 – Existing Route through Springfield
Section 5 – Proposed New Route through Springfield
Section 6 – Existing Route from Springfield to Alton
Section 7 – Existing Route from Alton to St. Louis
The four Build Alternatives were then comprised of various combinations of these
sections as follows:
Alternative A (Sections 1, 3, 4, 6, 7)
Alternative B (Sections 1, 3, 5, 6, 7)
Alternative C (Sections 2, 3, 4, 6, 7)
Alternative D (Sections 2, 3, 5, 6, 7)
All of these Build Alternatives would include eight daily round trips allowing for 110
mph intercity passenger service for the entire route between Chicago and St. Louis. The
overall travel times for these Build Alternatives between Chicago and St. Louis would
range from three hours and 51 minutes to four hours and 10 minutes for an overall
travel time decrease of up to one hour and 47 minutes over existing conditions.
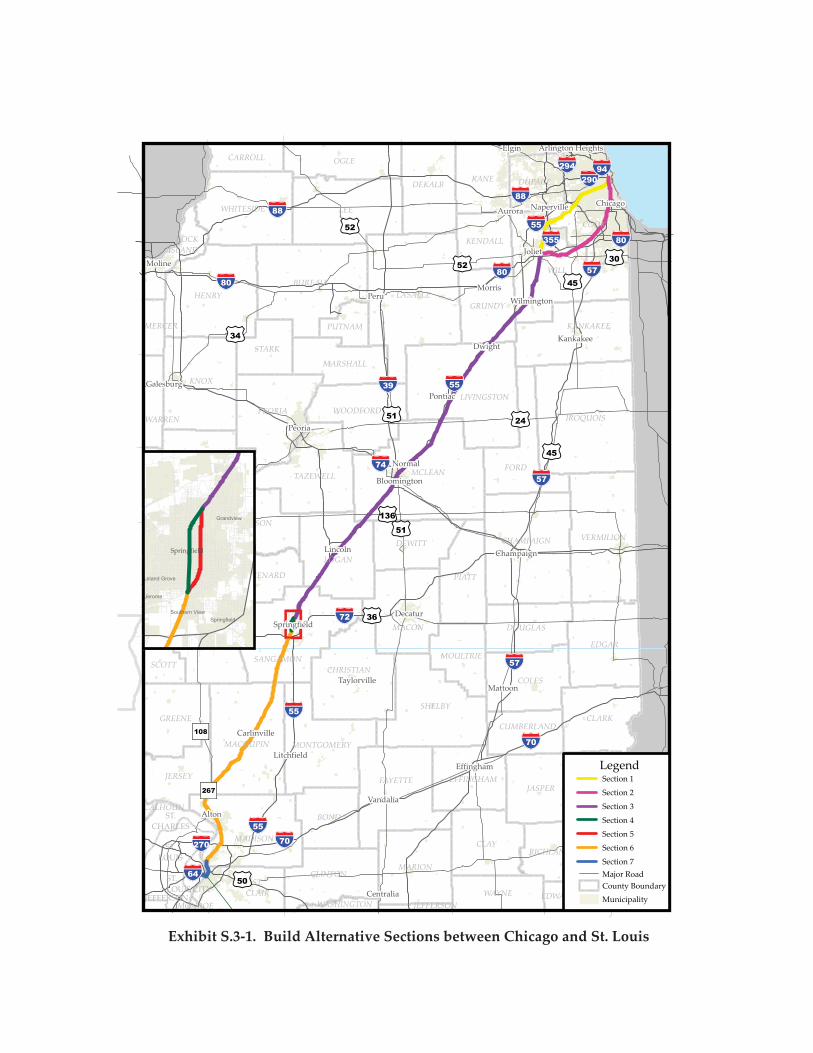
§̈¦§̈¦
§̈¦§̈¦
§̈¦
§̈¦
§̈¦§̈¦
§̈¦ ¡s
§̈¦¡s¡s
§̈¦§̈¦¡s
§̈¦
¡s
¡s
§̈¦
¡s¡s
¡s¡s§̈¦
§̈¦")
§̈¦§̈¦§̈¦
¡s§̈¦
")
§̈¦
§̈¦
§̈¦
§̈¦
¡s
¡s
ST.CHARLES
ST.LOUIS
ST.LOUIS CITY
JEFFERSON
Arlington HeightsElgin
ChicagoNapervilleAurora
JolietMoline
MorrisPeru Wilmington
KankakeeDwight
GalesburgPontiac
Peoria
Bloomington
Normal
Lincoln Champaign
DecaturSpringfield
TaylorvilleMattoon
Carlinville
LitchfieldEffingham
Vandalia
Alton
Centralia
OGLE
WILL
LASALLEBUREAU
HENRYGRUNDY
MERCER PUTNAM
MCLEANTAZEWELLFULTON
CHAMPAIGN
LOGAN
PIATT
STARK
KNOX
MARSHALL
LIVINGSTON
WARREN IROQUOISPEORIA WOODFORD
CARROLL
KANEDEKALB
COOK
ROCKISLAND
KENDALL
KANKAKEE
FORD
MENARD
MASON
DEWITTSCHUYLER
BROWN
DOUGLAS
CASS
CUMBERLAND
CALHOUN
CLAY
JERSEY EFFINGHAM
GREENE
CLINTON
WABASHEDWARDSWASHINGTON
RICHLAND
DUPAGE
WHITESIDE LEE
MCDONOUGH
VERMILION
MACON
SANGAMON
EDGARMORGAN
CHRISTIAN
MOULTRIESCOTT
COLES
SHELBY
MONTGOMERYMACOUPIN
CLARK
CR�AW�JASPER
BOND
MADISON
FAYETTE
ST.CLAIR WAYNE
MONROE JEFFERSON
LAW�R�E�N�C�E
MARION
108
267
45
3052
51 24
45
51
136
58
36
50
52
34
290294
88
94
57
80
55
80
355
5539
74
57
72
55
55
70270
64
70
57
88
80
LegendSection 1
Section 2
Major RoadCounty Boundary
Municipality
Section 3
Section 4
Section 5
Section 6
Section 7
Springfield
Springfield
Leland Grove
Jerome
Grandview
Southern View
Exhibit S.3-1. Build Alternative Sections between Chicago and St. Louis

Chicago-St. Louis High-Speed Rail S-7 Tier 1 DEIS
S.4 Summary of Impacts
Table S.4‐1 summarizes the impacts and costs for each of the Build Alternatives. The
No‐Build Alternative would not result in any impacts to the resources listed in the table.
Table S.4‐1. Summary of Impacts and Costs
Resources Alternative A Alternative B Alternative C Alternative D
Buildings Displaced 134 189 213 268
New Right‐of‐Way 336‐352 ac 372‐373 ac 394‐410 ac 430‐431 ac
Prime Farmland Soils 1,645 ac 1,643 ac 1,655 ac 1,652 ac
Historic Sites 7 6 6 5
Archaeological Sites 0 0 0 0
Forest 183.0 ac 181.3 ac 200.0 ac 198.3 ac
Prairie Remnants 232 ac 232 ac 232 ac 232 ac
Protected Natural Areas 16.3 ac 16.3 ac 16.6 ac 16.6 ac
Critical Habitat – Hine’s
Emerald Dragonfly3.7 ac 3.7 ac 0 0
Noise Sensitive
Receptors 218 685 342 809
Vibration Sensitive
Receptors 272 305 252 285
Surface Water 203 203 191 191
Special Status Streams:
Biologically Sensitive
Streams #/ft 6/1,136 6/1,136 6/1,136 6/1,136
Illinois Natural Areas
Inventory Streams #/ft 6/946 6/946 6/946 6/946
Nationwide Rivers
Inventory Streams #/ft 3/554 3/554 3/554 3/554
Navigable Waterways
#/ft 8/959 8/959 7/095 7/905
Wellhead Protection
Areas 2 2 2 2
Floodplains #/acres 36/72.7 36/72.7 43/77.9 43/77.9
Wetlands #/acres 52/41.3 52/41.7 65/46.4 65/46.3
Special Waste Sites 179 195 260 276
Section 4(f) Properties 8 8 12 12
Costs (millions) $4,693‐$4,978 $4,895‐$4,939 $4,163‐$4,448 $4,365‐$4,409

Chicago-St. Louis High-Speed Rail S-8 Tier 1 DEIS
S.4.1 Land Use/Socioeconomic Impacts
Table S.4‐2 shows the number of displacements and the acreage of right‐of‐way that
would be needed for each alternative. Alternative A would result in the fewest
displacements (134) and acres of new right‐of‐way (336‐352) while Alternative D would
result in the most displacements (268) and acres of new right‐of‐way (430‐431). Potential
impacts by each alternative to low‐income and minority populations (i.e., environmental
justice populations) were also evaluated. As indicated in Table S.4‐2, Alternatives C and
D would potentially result in greater impacts to low‐income and minority populations
than Alternatives A and B.
Table S.4‐2. Comparison of Land Use and Environmental Justice Impacts between
Build Alternatives
Build
Alternative
Number of
Buildings
Potentially
Displaced
Proposed New
Right-of-Way
(Acres)
Census Tracts
with
Populations
Below Poverty
Line (>50%)
Census Block
Groups with
Minority
Populations
(>50%)
Alternative A 134 336‐352 3 38
Alternative B 189 372‐373 3 44
Alternative C 213 394‐410 10 83
Alternative D 268 430‐431 10 89
S.4.2 Energy
Table S.4‐3 presents the annual energy consumption by mode and alternative.
Table S.4‐3. Annual Energy Consumption (billions of BTUs)
Alternative Rail Automobile Bus Air Total
Existing (2010) 199 22,754 69 411 23,433
No‐Build (2030) 354 27,558 93 692 28,697
A, B, C, or D 572 27,143 83 628 28,426
The results in Table S.4‐3 show that the total energy consumption from intercity
passenger travel under the No‐Build Alternative would be higher than the Build
Alternatives. Although the Build Alternatives would result in an increase in energy
consumption compared to the No‐Build Alternative with regard to rail transportation,
all of the other three modes would experience a decrease, thereby, resulting in an overall
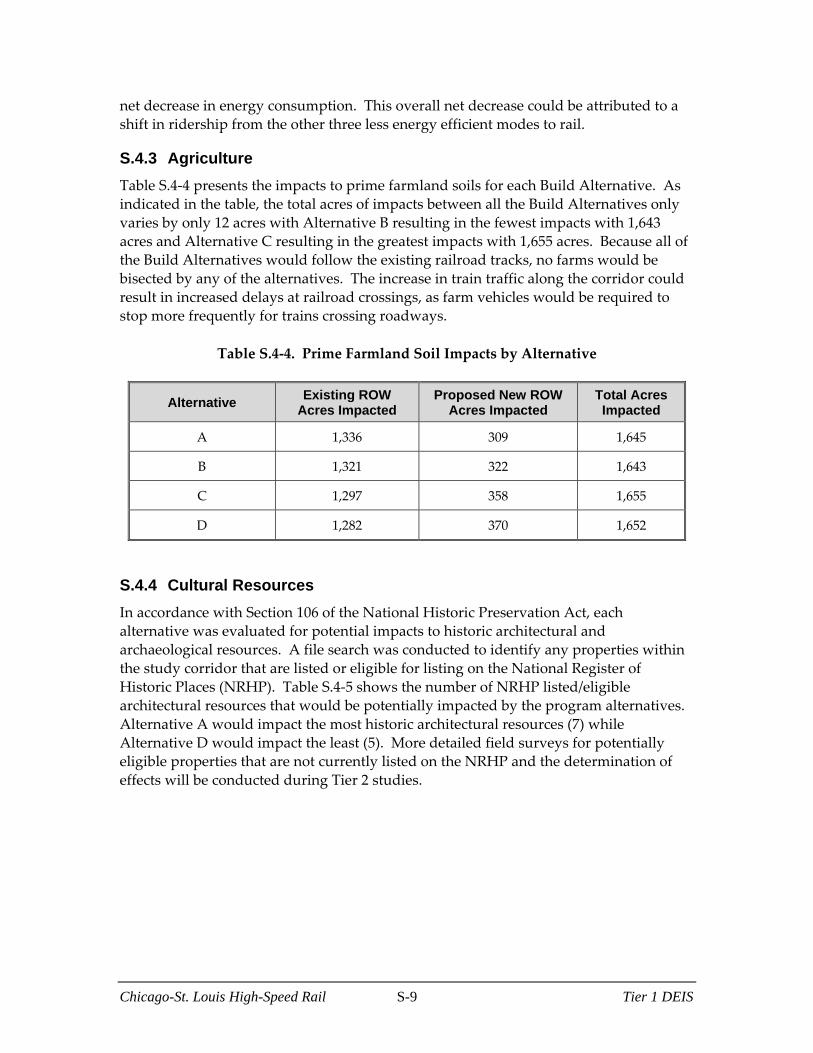
Chicago-St. Louis High-Speed Rail S-9 Tier 1 DEIS
net decrease in energy consumption. This overall net decrease could be attributed to a
shift in ridership from the other three less energy efficient modes to rail.
S.4.3 Agriculture
Table S.4‐4 presents the impacts to prime farmland soils for each Build Alternative. As
indicated in the table, the total acres of impacts between all the Build Alternatives only
varies by only 12 acres with Alternative B resulting in the fewest impacts with 1,643
acres and Alternative C resulting in the greatest impacts with 1,655 acres. Because all of
the Build Alternatives would follow the existing railroad tracks, no farms would be
bisected by any of the alternatives. The increase in train traffic along the corridor could
result in increased delays at railroad crossings, as farm vehicles would be required to
stop more frequently for trains crossing roadways.
Table S.4‐4. Prime Farmland Soil Impacts by Alternative
Alternative Existing ROW
Acres Impacted Proposed New ROW
Acres Impacted Total Acres Impacted
A 1,336 309 1,645
B 1,321 322 1,643
C 1,297 358 1,655
D 1,282 370 1,652
S.4.4 Cultural Resources
In accordance with Section 106 of the National Historic Preservation Act, each
alternative was evaluated for potential impacts to historic architectural and
archaeological resources. A file search was conducted to identify any properties within
the study corridor that are listed or eligible for listing on the National Register of
Historic Places (NRHP). Table S.4‐5 shows the number of NRHP listed/eligible
architectural resources that would be potentially impacted by the program alternatives.
Alternative A would impact the most historic architectural resources (7) while
Alternative D would impact the least (5). More detailed field surveys for potentially
eligible properties that are not currently listed on the NRHP and the determination of
effects will be conducted during Tier 2 studies.

Chicago-St. Louis High-Speed Rail S-10 Tier 1 DEIS
Table S.4‐5. Summary of Potentially Impacted Historic Architectural Resources
Section Alternative A Alternative B Alternative C Alternative D
1 2 2 ‐ ‐
2 ‐ ‐ 1 1
3 3 3 3 3
4 1 ‐ 1 ‐
5 ‐ 0 ‐ 0
6 1 1 1 1
7 0 0 0 0
Total 7 6 6 5
With regard to known archaeological resources, potential impacts were considered
where proposed improvements (construction activity) would physically impact the
property on which the resource lies or would be immediately adjacent to the
construction activity such that temporary impacts could result. Because the resources
lay belowground, noise, vibration, and visual impacts were not considered.
One site, 11MP4, located adjacent to Section 6 in Macoupin County is adjacent to an area
were construction activities would occur. As a result, all four Build Alternatives would
potentially impact this one archaeological resource. Further evaluation will be required
during Tier 2 studies to determine if the construction would have an adverse effect on
the resource. In addition, Tier 2 studies will include a survey of potential archaeological
resources in all areas to be disturbed.
S.4.5 Natural Resources
S.4.5.1 Forests, Prairie Remnants, and Illinois Natural Areas
Each Build Alternative was evaluated for potential impacts to natural resources such as
forest, prairie remnants, and protected natural areas. Table S.4‐6 shows the impacts to
these resources for each alternative. With regard to impacts to forest, Alternative B
would result in the fewest impacts (181.3 acres) while Alternative C would result in the
greatest impacts (200.0 acres). All of the Build Alternatives would impact 232 acres of
prairie remnants. They would also result in nearly the same impacts to protected
natural areas (16.3 to 16.6 acres). There are five natural areas located within the
construction ‐limits of the Build Alternatives: Hickory Creek Barrens Nature Preserve
(0.3 acres), Funks Grove Nature Preserve (0.9 acres), Thaddeus Stubblefield Grove
Nature Preserve (7 acres), Hitts Siding Prairie Nature Preserve (0.6 acres), and Funks
Grove Land and Water Reserve (7.9 acres), and have potential to be impacted by the
alternatives considered.

Chicago-St. Louis High-Speed Rail S-11 Tier 1 DEIS
Table S.4‐6. Acreage of Impact to Natural Resources by Alternative
S.4.5.2 Threatened and Endangered Species
As indicated in Table S.4‐6, Alternatives A and B would impact approximately 3.7 acres
of USFWS designated Critical Habitat for the federally endangered Hine’s emerald
dragonfly. Analysis of the impacts to this habitat will be addressed in more detail in the
Tier 2 environmental documentation. In addition to the potential direct loss of Critical
Habitat for the Hine’s emerald dragonfly, the only other notable impact to the species
could be the potential increase in train‐dragonfly collisions due to the increase in the
number of round trips associated with several of the alternatives. It is anticipated,
however, that this potential increase would have a minimal overall impact on the
species.
Based on the IDNR EcoCat database and coordination with USFWS and IDNR, there are
no other Critical Habitats or known habitats or populations of other federally listed
species located within the study corridor that could be impacted by any of the program
alternatives. However, this Tier 1 level of documentation did not include detailed
fieldwork to identify potential habitats and/or populations of threatened and
endangered species. Therefore, conclusions about impacts to listed species or their
habitat cannot be made at this time. Further coordination with USFWS and IDNR will
continue during the Tier 2 stage.
Species listed as threatened or endangered by the state, which have recorded
occurrences within the existing or proposed right‐of‐way based on the Natural Heritage
Data Base are included in Chapter 5, Table 5.6‐3 and Exhibits 5.6‐1 through 5.6‐3. Most
of the records for state listed species occur in Sections 3 and 6. Since these sections are
included in all the Build Alternatives, there is little difference in the species records for
each alternative. All of the species listed in Table 5.6‐3 are present in the right‐of‐way of
Alternatives A and B, with the exception of Mead’s milkweed, which is only known for
Section 2. All species listed in Table 5.6‐3 are also present in the right‐of‐way of
Alternatives C and D, with the exception of the leafy prairie clover, which is only known
for Section 1.
Alternative Forest Prairie Remnants
Protected
Natural
Areas
Designated Critical
Habitat (Hines
Emerald Dragonfly)
A 183.0 232 16.3 3.7
B 181.3 232 16.3 3.7
C 200.0 232 16.6 0
D 198.3 232 16.6 0
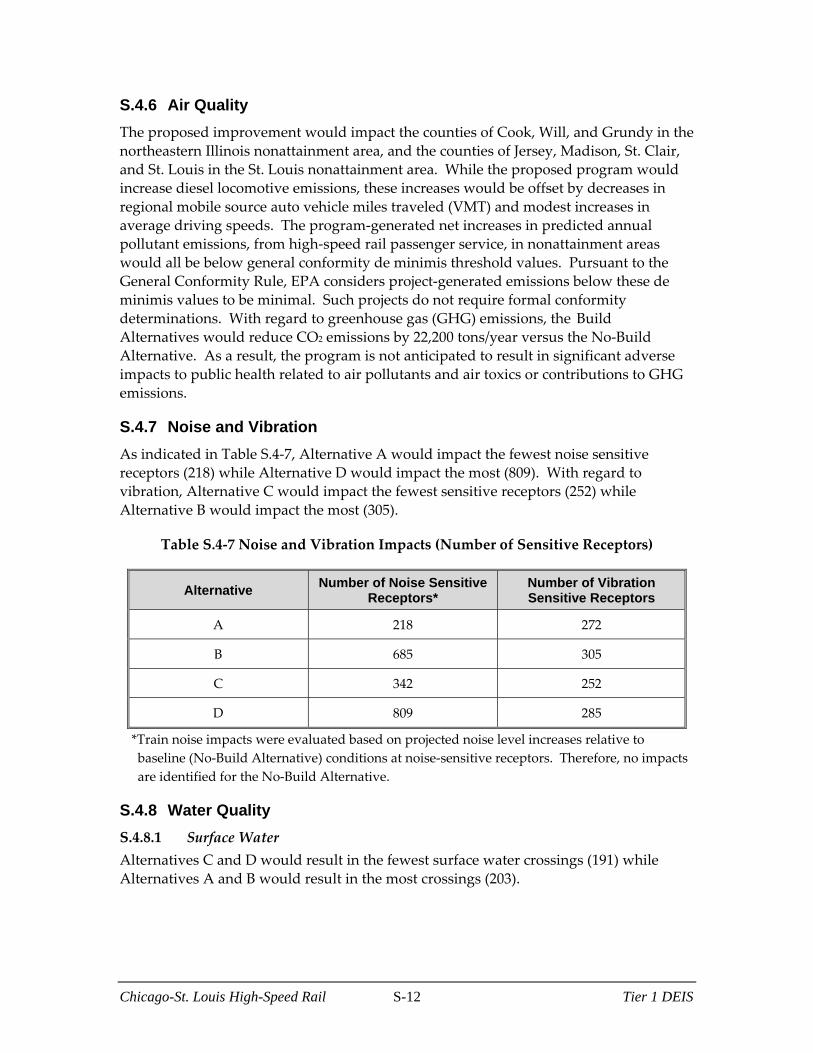
Chicago-St. Louis High-Speed Rail S-12 Tier 1 DEIS
S.4.6 Air Quality
The proposed improvement would impact the counties of Cook, Will, and Grundy in the
northeastern Illinois nonattainment area, and the counties of Jersey, Madison, St. Clair,
and St. Louis in the St. Louis nonattainment area. While the proposed program would
increase diesel locomotive emissions, these increases would be offset by decreases in
regional mobile source auto vehicle miles traveled (VMT) and modest increases in
average driving speeds. The program‐generated net increases in predicted annual
pollutant emissions, from high‐speed rail passenger service, in nonattainment areas
would all be below general conformity de minimis threshold values. Pursuant to the
General Conformity Rule, EPA considers project‐generated emissions below these de
minimis values to be minimal. Such projects do not require formal conformity
determinations. With regard to greenhouse gas (GHG) emissions, the Build
Alternatives would reduce CO2 emissions by 22,200 tons/year versus the No‐Build
Alternative. As a result, the program is not anticipated to result in significant adverse
impacts to public health related to air pollutants and air toxics or contributions to GHG
emissions.
S.4.7 Noise and Vibration
As indicated in Table S.4‐7, Alternative A would impact the fewest noise sensitive
receptors (218) while Alternative D would impact the most (809). With regard to
vibration, Alternative C would impact the fewest sensitive receptors (252) while
Alternative B would impact the most (305).
Table S.4‐7 Noise and Vibration Impacts (Number of Sensitive Receptors)
Alternative Number of Noise Sensitive
Receptors* Number of Vibration Sensitive Receptors
A 218 272
B 685 305
C 342 252
D 809 285
*Train noise impacts were evaluated based on projected noise level increases relative to
baseline (No‐Build Alternative) conditions at noise‐sensitive receptors. Therefore, no impacts
are identified for the No‐Build Alternative.
S.4.8 Water Quality
S.4.8.1 Surface Water
Alternatives C and D would result in the fewest surface water crossings (191) while
Alternatives A and B would result in the most crossings (203).
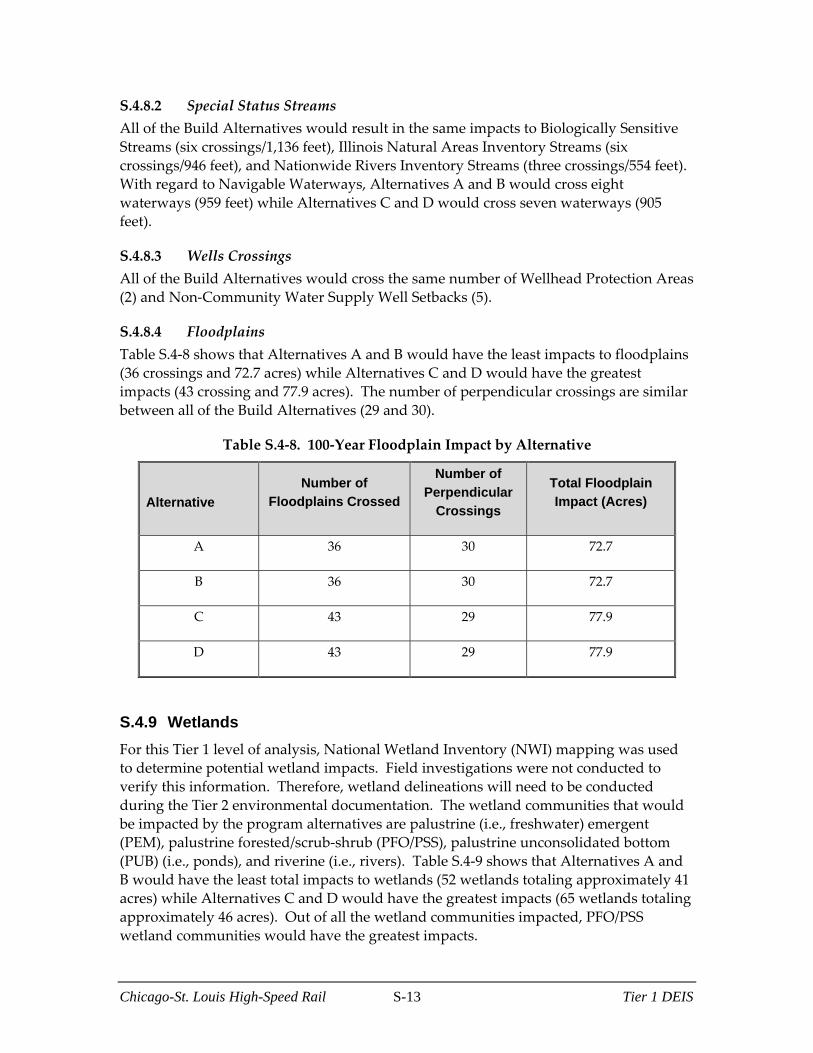
Chicago-St. Louis High-Speed Rail S-13 Tier 1 DEIS
S.4.8.2 Special Status Streams
All of the Build Alternatives would result in the same impacts to Biologically Sensitive
Streams (six crossings/1,136 feet), Illinois Natural Areas Inventory Streams (six
crossings/946 feet), and Nationwide Rivers Inventory Streams (three crossings/554 feet).
With regard to Navigable Waterways, Alternatives A and B would cross eight
waterways (959 feet) while Alternatives C and D would cross seven waterways (905
feet).
S.4.8.3 Wells Crossings
All of the Build Alternatives would cross the same number of Wellhead Protection Areas
(2) and Non‐Community Water Supply Well Setbacks (5).
S.4.8.4 Floodplains
Table S.4‐8 shows that Alternatives A and B would have the least impacts to floodplains
(36 crossings and 72.7 acres) while Alternatives C and D would have the greatest
impacts (43 crossing and 77.9 acres). The number of perpendicular crossings are similar
between all of the Build Alternatives (29 and 30).
Table S.4‐8. 100‐Year Floodplain Impact by Alternative
Alternative
Number of
Floodplains Crossed
Number of
Perpendicular
Crossings
Total Floodplain
Impact (Acres)
A 36 30 72.7
B 36 30 72.7
C 43 29 77.9
D 43 29 77.9
S.4.9 Wetlands
For this Tier 1 level of analysis, National Wetland Inventory (NWI) mapping was used
to determine potential wetland impacts. Field investigations were not conducted to
verify this information. Therefore, wetland delineations will need to be conducted
during the Tier 2 environmental documentation. The wetland communities that would
be impacted by the program alternatives are palustrine (i.e., freshwater) emergent
(PEM), palustrine forested/scrub‐shrub (PFO/PSS), palustrine unconsolidated bottom
(PUB) (i.e., ponds), and riverine (i.e., rivers). Table S.4‐9 shows that Alternatives A and
B would have the least total impacts to wetlands (52 wetlands totaling approximately 41
acres) while Alternatives C and D would have the greatest impacts (65 wetlands totaling
approximately 46 acres). Out of all the wetland communities impacted, PFO/PSS
wetland communities would have the greatest impacts.
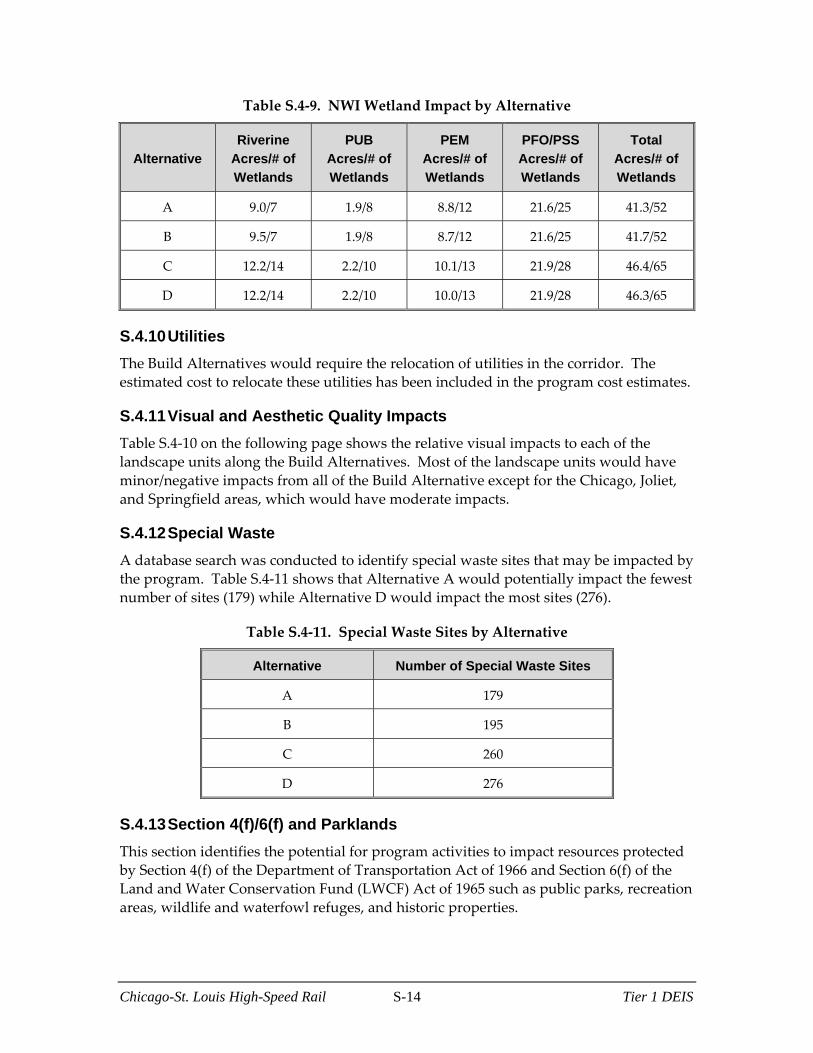
Chicago-St. Louis High-Speed Rail S-14 Tier 1 DEIS
Table S.4‐9. NWI Wetland Impact by Alternative
Alternative
Riverine
Acres/# of
Wetlands
PUB
Acres/# of
Wetlands
PEM
Acres/# of
Wetlands
PFO/PSS
Acres/# of
Wetlands
Total
Acres/# of
Wetlands
A 9.0/7 1.9/8 8.8/12 21.6/25 41.3/52
B 9.5/7 1.9/8 8.7/12 21.6/25 41.7/52
C 12.2/14 2.2/10 10.1/13 21.9/28 46.4/65
D 12.2/14 2.2/10 10.0/13 21.9/28 46.3/65
S.4.10 Utilities
The Build Alternatives would require the relocation of utilities in the corridor. The
estimated cost to relocate these utilities has been included in the program cost estimates.
S.4.11 Visual and Aesthetic Quality Impacts
Table S.4‐10 on the following page shows the relative visual impacts to each of the
landscape units along the Build Alternatives. Most of the landscape units would have
minor/negative impacts from all of the Build Alternative except for the Chicago, Joliet,
and Springfield areas, which would have moderate impacts.
S.4.12 Special Waste
A database search was conducted to identify special waste sites that may be impacted by
the program. Table S.4‐11 shows that Alternative A would potentially impact the fewest
number of sites (179) while Alternative D would impact the most sites (276).
Table S.4‐11. Special Waste Sites by Alternative
Alternative Number of Special Waste Sites
A 179
B 195
C 260
D 276
S.4.13 Section 4(f)/6(f) and Parklands
This section identifies the potential for program activities to impact resources protected
by Section 4(f) of the Department of Transportation Act of 1966 and Section 6(f) of the
Land and Water Conservation Fund (LWCF) Act of 1965 such as public parks, recreation
areas, wildlife and waterfowl refuges, and historic properties.

Chicago-St. Louis High-Speed Rail S-15 Tier 1 DEIS
Table S.4‐10. Visual Resource Impact Summary
Landscape Unit
No-Build Alternative
Alternative A Alternative B Alternative C Alternative D
Chicago Area
Joliet Area
Will County
Grundy
County
Livingston
County
McLean
County
Bloomington‐
Normal Area
Logan County
Sangamon
County
Springfield
Area
Macoupin
County
Madison
County
St. Louis Area
Major Moderate
Minor/Negligible
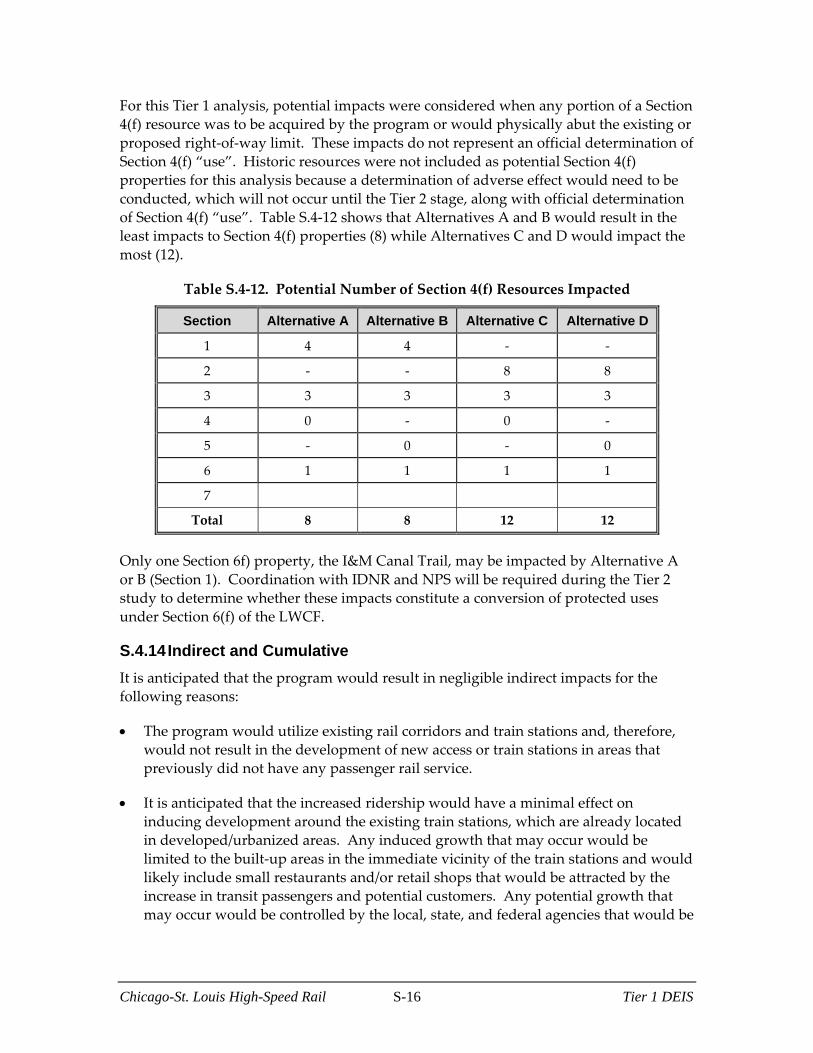
Chicago-St. Louis High-Speed Rail S-16 Tier 1 DEIS
For this Tier 1 analysis, potential impacts were considered when any portion of a Section
4(f) resource was to be acquired by the program or would physically abut the existing or
proposed right‐of‐way limit. These impacts do not represent an official determination of
Section 4(f) “use”. Historic resources were not included as potential Section 4(f)
properties for this analysis because a determination of adverse effect would need to be
conducted, which will not occur until the Tier 2 stage, along with official determination
of Section 4(f) “use”. Table S.4‐12 shows that Alternatives A and B would result in the
least impacts to Section 4(f) properties (8) while Alternatives C and D would impact the
most (12).
Table S.4‐12. Potential Number of Section 4(f) Resources Impacted
Section Alternative A Alternative B Alternative C Alternative D
1 4 4 ‐ ‐
2 ‐ ‐ 8 8
3 3 3 3 3
4 0 ‐ 0 ‐
5 ‐ 0 ‐ 0
6 1 1 1 1
7
Total 8 8 12 12
Only one Section 6f) property, the I&M Canal Trail, may be impacted by Alternative A
or B (Section 1). Coordination with IDNR and NPS will be required during the Tier 2
study to determine whether these impacts constitute a conversion of protected uses
under Section 6(f) of the LWCF.
S.4.14 Indirect and Cumulative
It is anticipated that the program would result in negligible indirect impacts for the
following reasons:
The program would utilize existing rail corridors and train stations and, therefore,
would not result in the development of new access or train stations in areas that
previously did not have any passenger rail service.
It is anticipated that the increased ridership would have a minimal effect on
inducing development around the existing train stations, which are already located
in developed/urbanized areas. Any induced growth that may occur would be
limited to the built‐up areas in the immediate vicinity of the train stations and would
likely include small restaurants and/or retail shops that would be attracted by the
increase in transit passengers and potential customers. Any potential growth that
may occur would be controlled by the local, state, and federal agencies that would be
Chicago-St. Louis High-Speed Rail S-17 Tier 1 DEIS
responsible for approving such development and permitting the impacts to any
regulated resources that may be impacted.
With regard to natural, cultural, agricultural, and socioeconomic resources, it is
anticipated that the program would result in negligible cumulative impacts for the
following reasons:
Because the Chicago‐St. Louis High‐Speed Rail Program would involve primarily
the addition of a second track that would parallel the existing track, the majority of
the impacts would be within the existing right‐of‐way and in previously disturbed
areas.
Any new impacts outside of the existing track’s footprint and right‐of‐way would be
relatively narrow, linear, and distributed over a long distance (i.e., 284 miles). As a
result, the impacts to any given resource (e.g., natural, cultural, agricultural, or
socioeconomic) within any given area (e.g., ecosystem, watershed, community) is
expected to be relatively small and would have a negligible cumulative effect when
added to any other project impacts in those areas.
The vast majority of the study corridor has been, currently is, and will continue to be
farmland. The remaining study corridor is mostly comprised of highly developed
urban areas that would not contribute to cumulative impacts. The only areas that
may be experiencing land use changes that could contribute to cumulative impacts
would be the suburban areas associated with the major metropolitan areas such as
Chicago, Springfield, and St. Louis.
The most notable known projects that would result in cumulative impacts along the
study corridor when added to this program are the high‐speed rail improvements from
Dwight to St. Louis associated with the 2004 ROD and the high‐speed rail improvements
from Joliet to Dwight associated with the 2011 EA/FONSI. Although minimal, the
cumulative negative impacts associated with these projects would primarily be limited
to prime farmland, vegetation/habitat, wetlands, and streams that are located along the
existing railroad corridor. With regard to air quality, these projects are expected to
provide an overall cumulative benefit. The high‐speed rail facility is expected to
provide service to motorists who would otherwise travel between Chicago and St. Louis
by automobile. This shift in travel mode is expected to reduce overall vehicle emissions.
These projects would also result in a cumulative benefit of removing automobiles from
congested roadways and improving safety by shifting automobile travelers to a safer
mode of transportation.
S.4.15 Travel Benefits
S.4.15.1 No‐Build Alternative
Travel Time, Frequency, and Reliability
Existing passenger rail travel time between Chicago and St. Louis ranges from five hours
and 20 minutes to five hours and 57 minutes. Under the No‐Build Alternative,

Chicago-St. Louis High-Speed Rail S-18 Tier 1 DEIS
passenger rail travel time is expected to range from four hours and 30 minutes and four
hours and 45 minutes.
Rail communication and signal systems would continue to be upgraded under the No‐
Build Alternative, which would improve some of the reliability and on‐time
performance issues. However, the limited capacity (i.e., the single track through most of
the corridor) would continue to affect reliability and on‐time performance and limit the
ability to add additional trains through the corridor.
With limits on travel time, passenger rail capacity, and reliability that remain with the
No‐Build Alternative. Ridership in 2030 is forecast to be approximately 1.1 million
passengers with the No‐Build Alternative, an increase of over 400,000 passengers
compared to existing conditions.
Safety
Overall passenger safety in the corridor would increase in that the passenger miles
traveled by rail in the corridor is expected to rise to 203 million passenger miles from the
existing 114 million passenger miles. To the extent that this increase represents a
diversion from automobile travel, the safety risk to travelers would decrease in that rail
travel is safer than automobile travel.
However, fewer passengers are expected to divert under the No‐Build Alternative
compared to the Build Alternatives, which would have overall travel times that are
expected to be substantially shorter than automobile travel times.
S.4.15.2 Build Alternatives
Travel Time, Frequency, Reliability
Rail passenger travel time between Chicago and St. Louis would decrease from a range of
four hours and 30 minutes to four hours and 45 minutes, to three hours and 51 minutes to
four hours and 10 minutes. The Build Alternatives could therefore result in an additional
35‐ to 39‐minute travel time savings compared to the No‐Build Alternative.
With the Build Alternatives, three additional passenger round trips would be operated
daily.
The Build alternatives would include the addition of a second track through most of the
corridor (Dwight to St. Louis), rail‐to‐rail grade separations, and added capacity north of
Joliet, as well as associated signal improvements. These features would address the
reliability‐related issues due to train interference that are not addressed by the No‐Build
Alternative.
Safety
Overall passenger safety in the corridor would increase in that the annual passenger
miles traveled by rail in the corridor is expected to rise to 328 million passenger miles
(Year 2030) from the existing 114 million passenger miles. This is 125 million passenger
miles greater than with the No‐Build Alternative. To the extent that this increase
Chicago-St. Louis High-Speed Rail S-19 Tier 1 DEIS
represents a diversion from automobile travel, the safety risk to travelers would
decrease in that rail travel is safer than automobile travel. Annual passenger miles by
automobile are projected to decrease by 118 million passenger miles compared to the
No‐Build Alternative.
With additional trains operating in the corridor, the possibility of train collisions is
increased. However, the installation of a positive train control signal system would
mitigate this risk.
Additional Travel Benefits
Improvements to passenger rail service improve its competitiveness with other modes of
travel. When compared to the other transportation modes, the Build Alternatives would
provide more access to intermediate markets along the corridor except for automobile
travel, which currently provides access along the entire corridor via the interstate
interchanges. Between Chicago and St. Louis, the Build Alternatives would provide
improved access to nine intermediate markets via the train stations while air and bus
travel currently provides access to only two markets (Bloomington/Normal and
Springfield). With regard to trip service, the Build Alternatives would provide for safe
use of cell phones and internet access for diverted automobile drivers. As for air travel,
although cell phone and internet access is available at airports, there are more
restrictions/limitations regarding their use during flight. With regard to cost and
service, Build Alternatives would provide higher quality service than bus travel and rail
service under the No‐Build Alternative at a lower cost than air travel.
S.4.16 Transportation Impacts
S.4.16.1 Freight Rail Service Impacts
The No‐Build Alternative includes conditions as exist in 2012, plus the completion of
construction of track upgrades, capacity improvements, and signal improvements
between Joliet and St. Louis per the 2004 ROD improvements and 2011 Dwight to Joliet
EA. IDOT and UP have coordinated extensively on these changes so that the projected
freight, as well as the No‐Build Alternative’s intercity passenger service, can operate
with improved reliability relative to existing conditions.
Implementation of the Build Alternatives may require some freight train scheduling
modifications to prevent conflicts with passenger rail service proposed for the Build
Alternatives. The increased frequency of passenger trains will further restrict rail time
available for freight movements. Since high‐speed operations will occur primarily
during the daytime, coordination with the host railroads would be required to
determine if the routing of freight trains could occur outside of the peak intercity
passenger periods. Ultimately, the freight carrier would have to agree to such a shift.
S.4.16.2 Commuter Rail Service Impacts
Commuter rail service in the Chicago area currently operates on Sections 1 (Metra
Heritage Corridor) and 2 (Metra Rock Island District). No other commuter rail service
operates in the corridor. Metra has no plans for changing or expanding the existing
Chicago-St. Louis High-Speed Rail S-20 Tier 1 DEIS
service along Metra’s Rock Island District, used by Alternatives C and D. There is also
no intercity passenger service currently operated via the Metra Rock Island District. For
Alternatives A and B (using Metra Heritage Corridor north of Joliet), Amtrak service in
the No‐Build Alternative would remain largely similar to the current service, with the
operation of five Amtrak round trips. Metra does have plans to expand service along
the Metra Heritage Corridor, possibly adding six trains per day and adding a new
station between Lemont and Lockport. The assumed capacity improvements for the
high speed service will be developed further in the Tier 2 process to provide appropriate
additional capacity, but not for the additional commuter service. Further improvements
(crossovers, segments of new trackage, etc) could be developed and analyzed to support
the future additional commuter rail service.
Implementation of the Build Alternatives would not result in changes in the number of
commuter trains operating daily. Impacts from the Build Alternatives could result in
additional intercity passenger trains operating, potentially affecting commuter rail
service.
S.4.16.3 Impacts to Rail Service during Construction
Under the No‐Build Alternative, construction would be limited to regular maintenance
activities, and improvements as planned by the 2004 ROD improvements. Therefore,
impacts to railroad operations would be minimal.
In general, construction activities for the Build Alternatives would affect rail traffic by
reducing operating train speeds through the construction zones, adding to rail travel
time and, in turn, cost. This would occur when adding new siding tracks, double‐tracks,
and connection tracks. The other impact would be schedule adjustments for existing
operations to create windows of opportunity for temporary shutdown of rail operations
on selected track sections, such as when the new turnouts are being placed for the
passing sections and new sidings, or when there is a potential safety risk, such as during
the construction of a flyover. During construction, there may be track outages that
would interrupt intercity passenger rail service. As necessary, bus service would be
provided along the corridor to replace intercity passenger rail service lost during
construction.
S.4.16.4 Highway‐Rail Grade Crossings Impacts
Based on the 2004 ROD and 2011 EA, at‐grade highway‐rail crossings through most of
Sections 3 through 7 (Joliet to East St. Louis) will be upgraded to provide four‐quadrant
gates and roadway configuration/approach improvements based on crossing
diagnostics. Under the No‐Build Alternative, no further modification to grade crossing
warning devices in the study corridor would be made.
Under the Build Alternatives, most crossings in the corridor would require some type of
improvement to accommodate the upgraded service. For example, where additional
tracks are to be added, crossing surfaces, gates, and other equipment must be modified.

Chicago-St. Louis High-Speed Rail S-21 Tier 1 DEIS
The Build Alternatives would increase vehicular delay at highway‐rail grade crossings
for the following reasons:
Additional intercity passenger rail service: Gate down time would increase
because the number of passenger trains operating in the corridor would increase
from 10 per day to 18 per day.
Increase in advance warning time: All crossings will be equipped with constant
warning time. Currently, crossing gates are activated approximately 20 to 30
seconds prior to a train reaching the grade crossing. For high‐speed passenger
trains, crossing gates would be activated sooner, possibly up to 90 seconds before a
train reaches the crossing. This increase in time would cause additional vehicular
delay for motorists using the highway‐rail grade crossing. As part of
implementation of the 2004 ROD improvements, coordination with the Illinois
Commerce Commission is underway to determine the length of time required for the
gates to be activated before a train reaches a crossing.
The combination of additional trains and longer gate down times would increase the
amount of time that a crossing is blocked by approximately 20 minutes per day.
Every highway‐rail crossing in the study corridor was evaluated for its suitability for
grade separation. Potential grade separation locations were identified based on setting
(urban or rural) and their predicted exposure factor, a function of train and vehicular
volumes. At the conclusion of this evaluation, 101 crossings were identified in the study
corridor for potential grade separation, which would be evaluated further during Tier 2
analysis.
S.4.16.5 Impacts to Vehicular Crossings during Construction
Vehicular traffic would be temporarily affected at locations where grade crossings
would be separated, modified, or improved. While the exact construction zones are not
known at this time, temporary lane closures or roadway closures would be required to
construct some of the proposed improvements. The grade crossing improvements
would, at a minimum, require traffic to slow down as it passes through the construction
zone while new warning devices and other improvements are installed. In some cases,
temporary diversion of traffic to adjacent crossings could be required. Construction of
grade separations would be staged to minimize street closures.
Where impacts to vehicular traffic exists, emergency services, schools, businesses, and
other activities requiring vehicular access would be affected by potential delays or
detours. However, construction related impacts on vehicular traffic would be
temporary. Traffic maintenance planning would be coordinated with schools and
emergency service providers.

Chicago-St. Louis High-Speed Rail S-22 Tier 1 DEIS
S.4.16.6 Station Access and Parking Impacts
The Build Alternatives could potentially involve proposed parking expansions and
station improvements to accommodate the increase in ridership. It is anticipated,
however, that there would be no access or traffic congestion problems associated with
the Build Alternatives.
Potential new stations will be evaluated in suburban Chicago (between Chicago and
Joliet) and St. Louis (between St. Louis and Alton). If this program moves forward, the
potential location for these stations would be evaluated in Tier 2 studies. However, it is
assumed that the location of new stations would be located immediately off of the
highway (e.g., I‐294 in Chicago and I‐270 in St. Louis).
S.5 Summary of Potential Mitigation
Table S.5‐1. Potential Mitigation
Impact Mitigation
Land Use Long Term ‐ IDOT will implement the provisions of the State of Illinois Relocation Assistance Plan in accordance with the Uniform Relocation Act as mitigation measures where ROW acquisitions and land use changes occur.
Cultural Mitigation measures will be determined based on the more detailed impact determinations from Tier 2 studies.
Natural Resources
Short Term ‐ Avoidance, minimization, and best management practices implementation will reduce adverse impacts.
Long Term – Coordination will continue through the Tier 2 level with the Illinois Nature Preserves Commission regarding the avoidance, minimization, and mitigation of any impacts to prairies. Coordination will continue through the Tier 2 level with the USFWS and INDR regarding the avoidance, minimization, and mitigation of any impacts to state and federal threatened and endangered species in the study corridor.
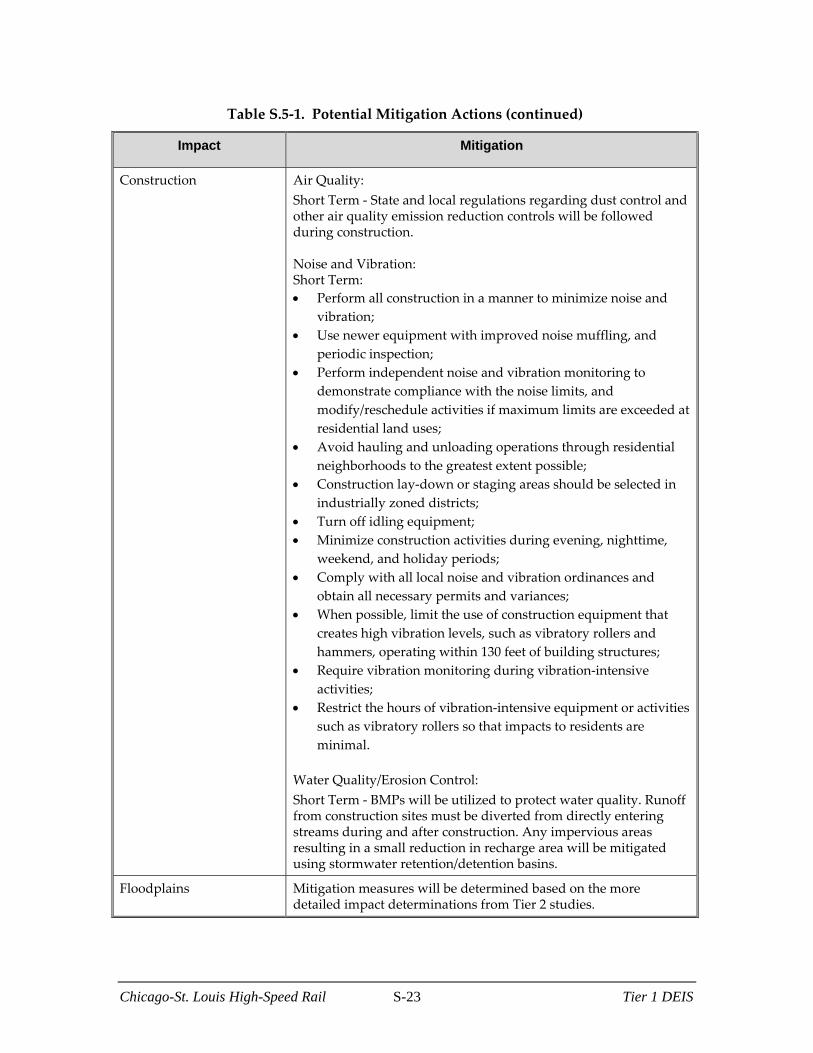
Chicago-St. Louis High-Speed Rail S-23 Tier 1 DEIS
Table S.5‐1. Potential Mitigation Actions (continued)
Impact Mitigation
Construction Air Quality:
Short Term ‐ State and local regulations regarding dust control and other air quality emission reduction controls will be followed during construction. Noise and Vibration: Short Term:
Perform all construction in a manner to minimize noise and
vibration;
Use newer equipment with improved noise muffling, and
periodic inspection;
Perform independent noise and vibration monitoring to
demonstrate compliance with the noise limits, and
modify/reschedule activities if maximum limits are exceeded at
residential land uses;
Avoid hauling and unloading operations through residential
neighborhoods to the greatest extent possible;
Construction lay‐down or staging areas should be selected in
industrially zoned districts;
Turn off idling equipment;
Minimize construction activities during evening, nighttime,
weekend, and holiday periods;
Comply with all local noise and vibration ordinances and
obtain all necessary permits and variances;
When possible, limit the use of construction equipment that
creates high vibration levels, such as vibratory rollers and
hammers, operating within 130 feet of building structures;
Require vibration monitoring during vibration‐intensive
activities;
Restrict the hours of vibration‐intensive equipment or activities
such as vibratory rollers so that impacts to residents are
minimal.
Water Quality/Erosion Control:
Short Term ‐ BMPs will be utilized to protect water quality. Runoff from construction sites must be diverted from directly entering streams during and after construction. Any impervious areas resulting in a small reduction in recharge area will be mitigated using stormwater retention/detention basins.
Floodplains Mitigation measures will be determined based on the more detailed impact determinations from Tier 2 studies.

Chicago-St. Louis High-Speed Rail S-24 Tier 1 DEIS
Table S.5‐1. Potential Mitigation Actions (continued)
Impact Mitigation
Wetlands Long Term ‐ A conceptual wetland mitigation plan will be developed to compensate for unavoidable impacts. Coordination with the USACE, the USFWS, and the IDNR will be required to determine specific mitigation requirements to adequately compensate for wetland losses pending final design to quantify actual wetland impacts.
Noise and Vibration Long Term
Wheel treatments;
Rail treatments;
Vehicle treatments;
Building insulation;
Noise barriers;
Maintenance‐
Rail grinding on a regular basis, especially on rails that
tend to develop corrugations;
Wheel truing to re‐contour the wheel and remove wheel
flats. This can result in a dramatic vibration reduction.
However, significant improvements can be gained from
simply smoothing the running surface. Install wheel‐flat
detector systems to identify vehicles that are most in need
of wheel truing;
Implement vehicle reconditioning programs, particularly
with components such as suspension systems, brakes,
wheels, and slip‐slide detectors;
Relocation of Special Trackwork;
Ballast Mats;
Resiliently Supported Ties;
High Resilience Fasteners;
Floating Slab Trackbed.
Visual and Aesthetic Quality
Long Term ‐ Views from trains into private spaces would be a positive visual impact and views of trains and new rail lines would be considered a minor adverse visual impact. IDOT will determine potential ways to help reduce minor impacts, such as planting vegetation screens or providing aesthetically pleasing features as part of the HSR design.
Special Waste Mitigation measures will be determined based on the more detailed impact determinations from Tier 2 studies.
Special Lands Mitigation measures will be determined based on the more detailed impact determinations from Tier 2 studies.
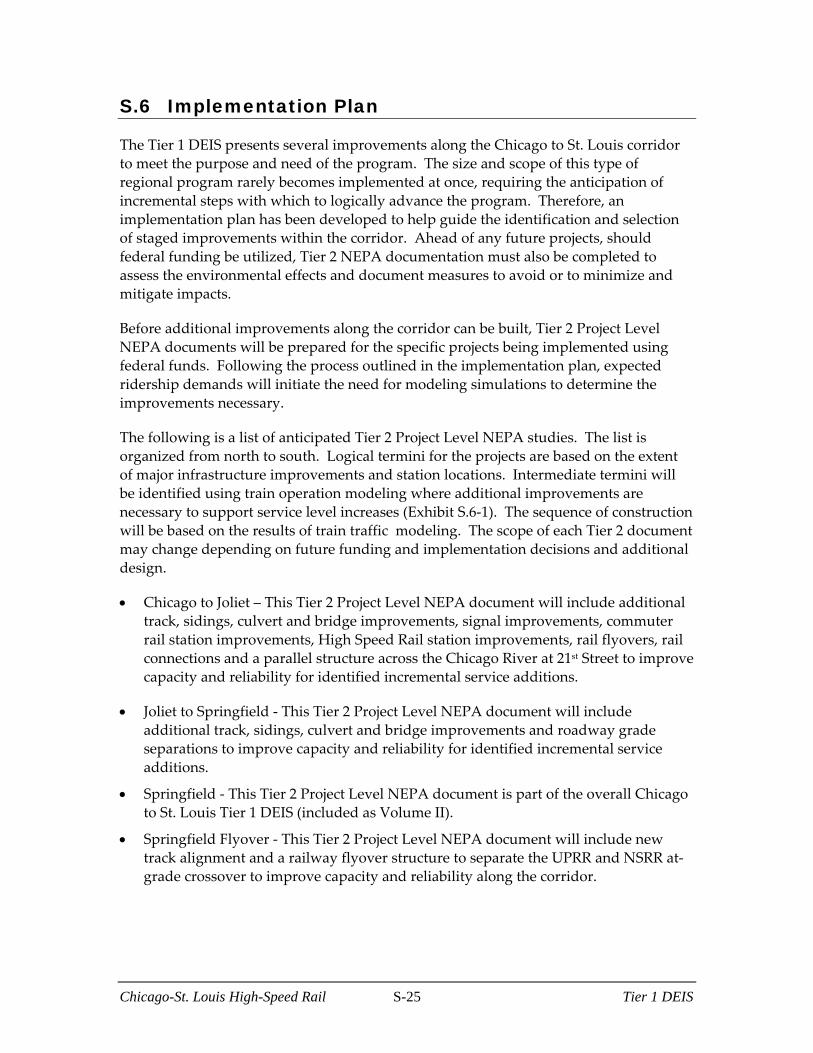
Chicago-St. Louis High-Speed Rail S-25 Tier 1 DEIS
S.6 Implementation Plan
The Tier 1 DEIS presents several improvements along the Chicago to St. Louis corridor
to meet the purpose and need of the program. The size and scope of this type of
regional program rarely becomes implemented at once, requiring the anticipation of
incremental steps with which to logically advance the program. Therefore, an
implementation plan has been developed to help guide the identification and selection
of staged improvements within the corridor. Ahead of any future projects, should
federal funding be utilized, Tier 2 NEPA documentation must also be completed to
assess the environmental effects and document measures to avoid or to minimize and
mitigate impacts.
Before additional improvements along the corridor can be built, Tier 2 Project Level
NEPA documents will be prepared for the specific projects being implemented using
federal funds. Following the process outlined in the implementation plan, expected
ridership demands will initiate the need for modeling simulations to determine the
improvements necessary.
The following is a list of anticipated Tier 2 Project Level NEPA studies. The list is
organized from north to south. Logical termini for the projects are based on the extent
of major infrastructure improvements and station locations. Intermediate termini will
be identified using train operation modeling where additional improvements are
necessary to support service level increases (Exhibit S.6‐1). The sequence of construction
will be based on the results of train traffic modeling. The scope of each Tier 2 document
may change depending on future funding and implementation decisions and additional
design.
Chicago to Joliet – This Tier 2 Project Level NEPA document will include additional
track, sidings, culvert and bridge improvements, signal improvements, commuter
rail station improvements, High Speed Rail station improvements, rail flyovers, rail
connections and a parallel structure across the Chicago River at 21st Street to improve
capacity and reliability for identified incremental service additions.
Joliet to Springfield ‐ This Tier 2 Project Level NEPA document will include
additional track, sidings, culvert and bridge improvements and roadway grade
separations to improve capacity and reliability for identified incremental service
additions.
Springfield ‐ This Tier 2 Project Level NEPA document is part of the overall Chicago
to St. Louis Tier 1 DEIS (included as Volume II).
Springfield Flyover ‐ This Tier 2 Project Level NEPA document will include new
track alignment and a railway flyover structure to separate the UPRR and NSRR at‐
grade crossover to improve capacity and reliability along the corridor.
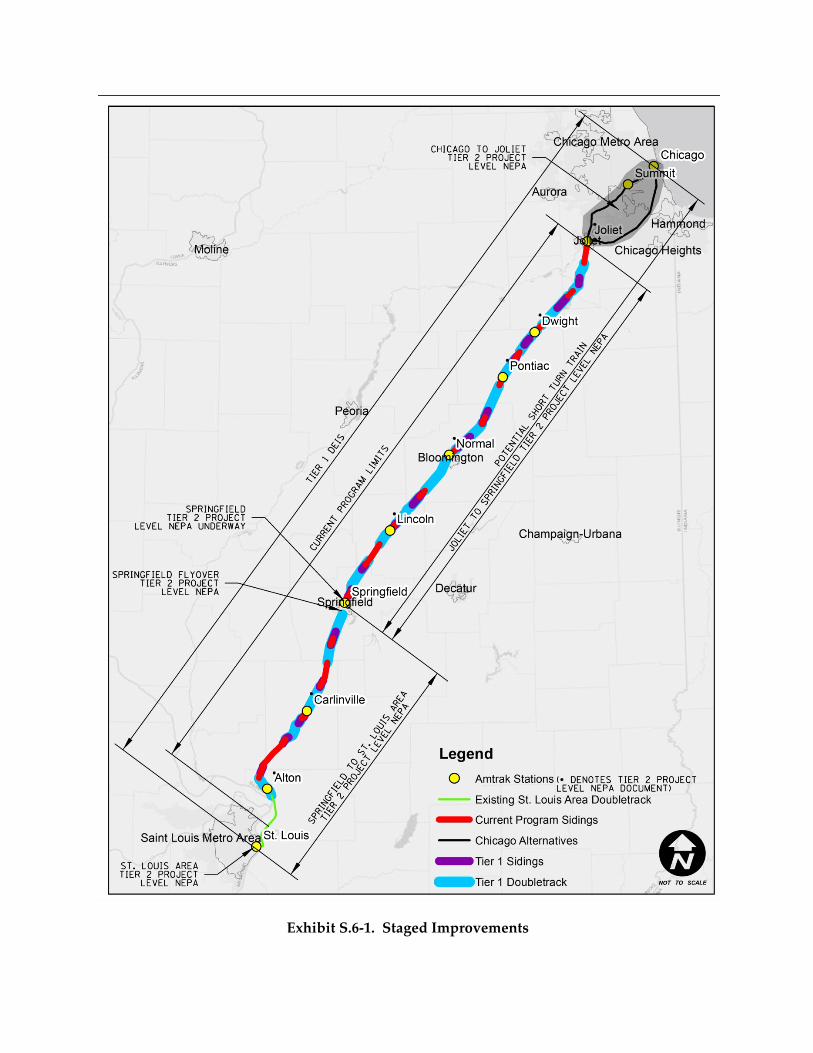
Exhibit S.6-1. Staged Improvements

Chicago-St. Louis High-Speed Rail S-27 Tier 1 DEIS
Springfield Flyover to St. Louis Area ‐ This Tier 2 Project Level NEPA document will
include additional track, sidings, culvert and bridge improvements and roadway
grade separations to improve capacity and reliability for identified incremental
service additions.
St. Louis Area ‐ This Tier 2 Project Level NEPA document will include new
doubletrack approaches to an increased capacity Mississippi River crossing to
improve capacity and reliability for identified incremental service additions. The
Tier 2 Level NEPA document will evaluate alternatives for an increased capacity
Mississippi River crossing. A new double track connection to the Merchants bridge
will also be include to provide redundant access in the system for the Mississippi
River crossing and to provide construction staging and future maintenance routes.
Station Improvements – Tier 2 Project Level NEPA documents will include High
Speed Rail station improvements at Joliet, Dwight, Pontiac, Normal, Lincoln,
Carlinville and Alton. These improvements include pedestrian grade separation
structures to provide access to both platforms and to avoid pedestrians crossing
tracks at‐grade, additional parking requirements and additional station capacity
requirements for identified incremental service additions.
S.7 Comments and Coordination
The environmental process for the Chicago to St. Louis High‐Speed Rail Corridor
Program Tier 1 DEIS began in February 2011. A scoping coordination letter describing
the program and requesting comments and attendance to upcoming scoping meetings,
held on March 1st and 3rd, 2011, was forwarded to the state and federal resource agencies
in February 2011. The agency scoping letter responses and cooperating agency
responses are located in Appendix F. The Tier 1 Chicago to St. Louis High Speed Rail
Environmental Impact Statement Notice of Intent (NOI) was published in the Federal
Register on February 14, 2011, and a copy is located in Appendix G. In March 2011, an
initial round of public meetings was held within the corridor to introduce the study to
the public, to explain the EIS process and timeline, and to get input. After these
meetings, the study team spent the next several months developing alternatives. In late
October and early November 2011, a second round of public meetings was held in the
cities of Joliet; Bloomington; Springfield; Carlinville; and Alton.
Section 8 of this document summarizes agency coordination that has occurred at this
early phase of this program as well as public coordination and comments relative to the
Tier 1 DEIS.
S.8 Springfield Rail Improvements Project Tier 2 Summary (Volume II)
S.8.1 Springfield Background
Multiple alignment options are available for the HSR corridor through Springfield. In
addition, the existing and projected rail traffic on the three north‐south corridors
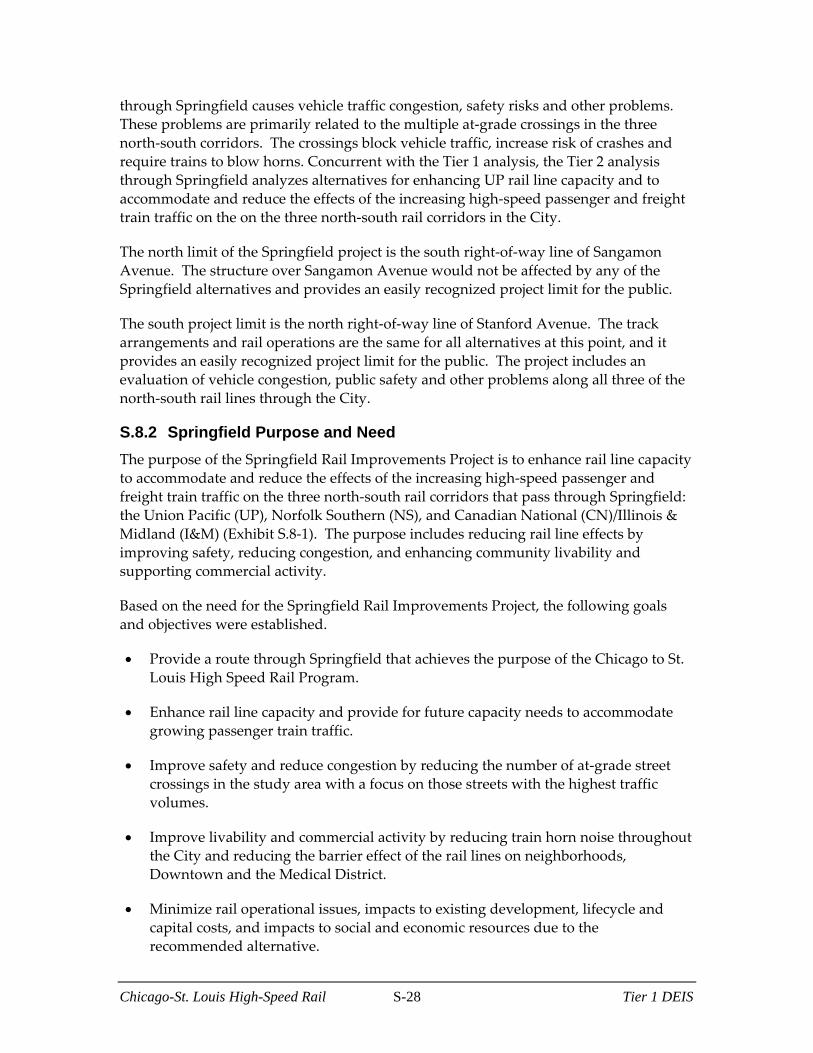
Chicago-St. Louis High-Speed Rail S-28 Tier 1 DEIS
through Springfield causes vehicle traffic congestion, safety risks and other problems.
These problems are primarily related to the multiple at‐grade crossings in the three
north‐south corridors. The crossings block vehicle traffic, increase risk of crashes and
require trains to blow horns. Concurrent with the Tier 1 analysis, the Tier 2 analysis
through Springfield analyzes alternatives for enhancing UP rail line capacity and to
accommodate and reduce the effects of the increasing high‐speed passenger and freight
train traffic on the on the three north‐south rail corridors in the City.
The north limit of the Springfield project is the south right‐of‐way line of Sangamon
Avenue. The structure over Sangamon Avenue would not be affected by any of the
Springfield alternatives and provides an easily recognized project limit for the public.
The south project limit is the north right‐of‐way line of Stanford Avenue. The track
arrangements and rail operations are the same for all alternatives at this point, and it
provides an easily recognized project limit for the public. The project includes an
evaluation of vehicle congestion, public safety and other problems along all three of the
north‐south rail lines through the City.
S.8.2 Springfield Purpose and Need
The purpose of the Springfield Rail Improvements Project is to enhance rail line capacity
to accommodate and reduce the effects of the increasing high‐speed passenger and
freight train traffic on the three north‐south rail corridors that pass through Springfield:
the Union Pacific (UP), Norfolk Southern (NS), and Canadian National (CN)/Illinois &
Midland (I&M) (Exhibit S.8‐1). The purpose includes reducing rail line effects by
improving safety, reducing congestion, and enhancing community livability and
supporting commercial activity.
Based on the need for the Springfield Rail Improvements Project, the following goals
and objectives were established.
Provide a route through Springfield that achieves the purpose of the Chicago to St.
Louis High Speed Rail Program.
Enhance rail line capacity and provide for future capacity needs to accommodate
growing passenger train traffic.
Improve safety and reduce congestion by reducing the number of at‐grade street
crossings in the study area with a focus on those streets with the highest traffic
volumes.
Improve livability and commercial activity by reducing train horn noise throughout
the City and reducing the barrier effect of the rail lines on neighborhoods,
Downtown and the Medical District.
Minimize rail operational issues, impacts to existing development, lifecycle and
capital costs, and impacts to social and economic resources due to the
recommended alternative.

Chicago-St. Louis High-Speed Rail S-29 Tier 1 DEIS
Exhibit S.8‐1. Existing Railroad Corridors
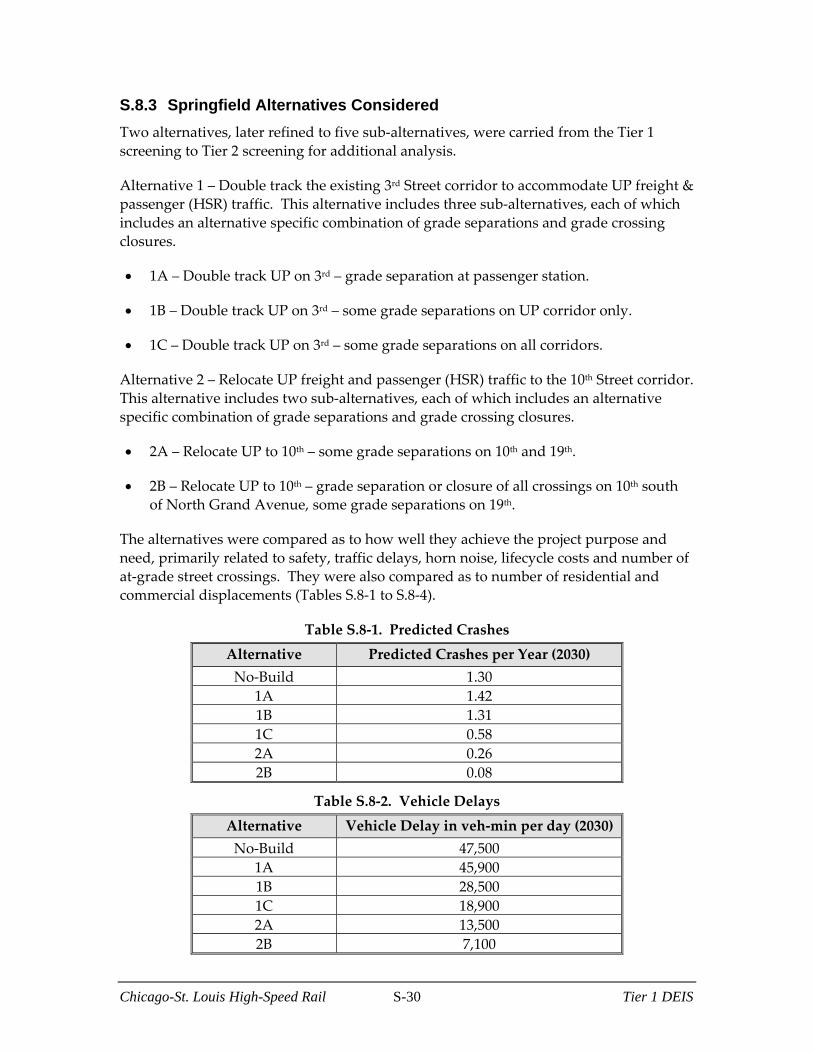
Chicago-St. Louis High-Speed Rail S-30 Tier 1 DEIS
S.8.3 Springfield Alternatives Considered
Two alternatives, later refined to five sub‐alternatives, were carried from the Tier 1
screening to Tier 2 screening for additional analysis.
Alternative 1 – Double track the existing 3rd Street corridor to accommodate UP freight &
passenger (HSR) traffic. This alternative includes three sub‐alternatives, each of which
includes an alternative specific combination of grade separations and grade crossing
closures.
1A – Double track UP on 3rd – grade separation at passenger station.
1B – Double track UP on 3rd – some grade separations on UP corridor only.
1C – Double track UP on 3rd – some grade separations on all corridors.
Alternative 2 – Relocate UP freight and passenger (HSR) traffic to the 10th Street corridor.
This alternative includes two sub‐alternatives, each of which includes an alternative
specific combination of grade separations and grade crossing closures.
2A – Relocate UP to 10th – some grade separations on 10th and 19th.
2B – Relocate UP to 10th – grade separation or closure of all crossings on 10th south
of North Grand Avenue, some grade separations on 19th.
The alternatives were compared as to how well they achieve the project purpose and
need, primarily related to safety, traffic delays, horn noise, lifecycle costs and number of
at‐grade street crossings. They were also compared as to number of residential and
commercial displacements (Tables S.8‐1 to S.8‐4).
Table S.8‐1. Predicted Crashes
Alternative Predicted Crashes per Year (2030)
No‐Build 1.30
1A 1.42
1B 1.31
1C 0.58
2A 0.26
2B 0.08
Table S.8‐2. Vehicle Delays
Alternative Vehicle Delay in veh‐min per day (2030)
No‐Build 47,500
1A 45,900
1B 28,500
1C 18,900
2A 13,500
2B 7,100
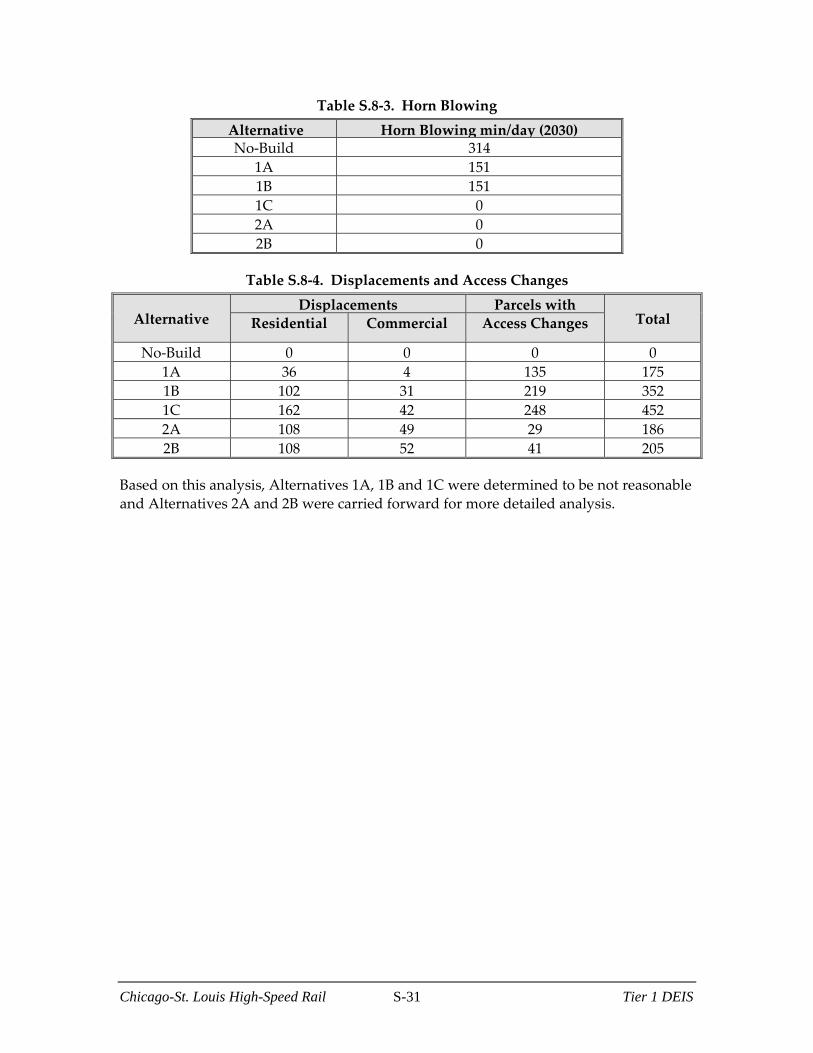
Chicago-St. Louis High-Speed Rail S-31 Tier 1 DEIS
Table S.8‐3. Horn Blowing
Alternative Horn Blowing min/day (2030) No‐Build 314
1A 151
1B 151
1C 0
2A 0
2B 0
Table S.8‐4. Displacements and Access Changes
Alternative Displacements Parcels with
Total Residential Commercial Access Changes
No‐Build 0 0 0 0
1A 36 4 135 175
1B 102 31 219 352
1C 162 42 248 452
2A 108 49 29 186
2B 108 52 41 205
Based on this analysis, Alternatives 1A, 1B and 1C were determined to be not reasonable
and Alternatives 2A and 2B were carried forward for more detailed analysis.
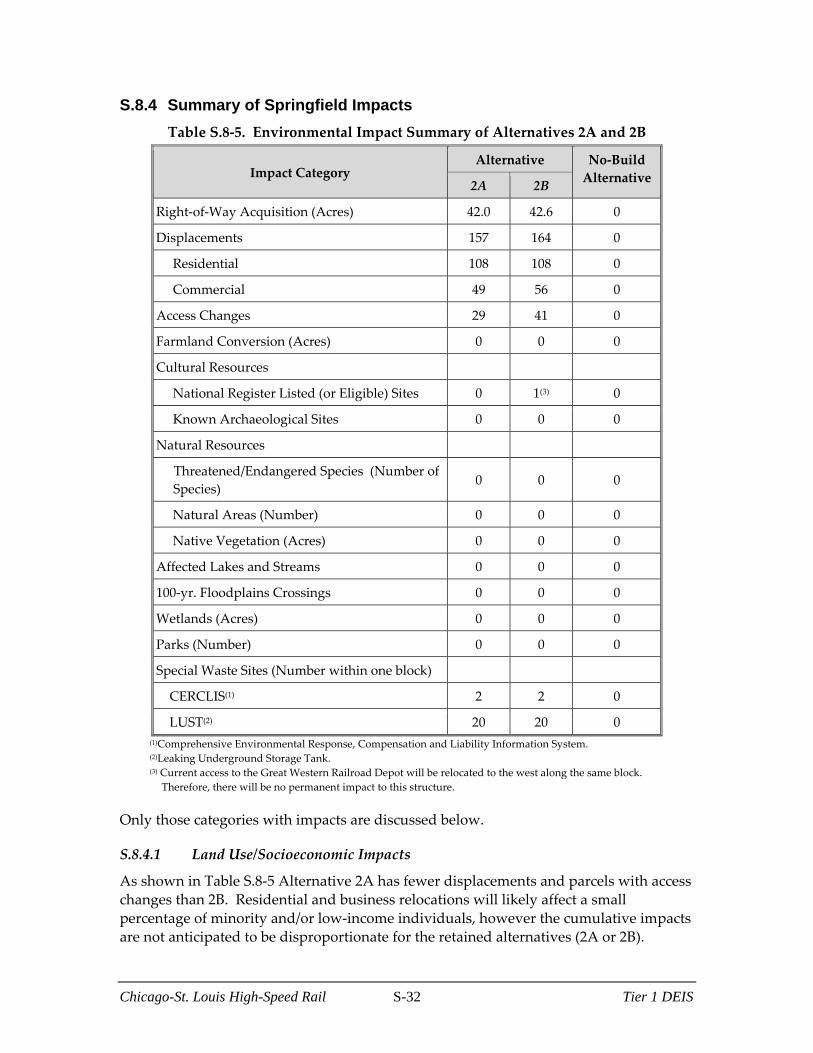
Chicago-St. Louis High-Speed Rail S-32 Tier 1 DEIS
S.8.4 Summary of Springfield Impacts
Table S.8‐5. Environmental Impact Summary of Alternatives 2A and 2B
Impact Category Alternative No‐Build
Alternative 2A 2B
Right‐of‐Way Acquisition (Acres) 42.0 42.6 0
Displacements 157 164 0
Residential 108 108 0
Commercial 49 56 0
Access Changes 29 41 0
Farmland Conversion (Acres) 0 0 0
Cultural Resources
National Register Listed (or Eligible) Sites 0 1(3) 0
Known Archaeological Sites 0 0 0
Natural Resources
Threatened/Endangered Species (Number of
Species) 0 0 0
Natural Areas (Number) 0 0 0
Native Vegetation (Acres) 0 0 0
Affected Lakes and Streams 0 0 0
100‐yr. Floodplains Crossings 0 0 0
Wetlands (Acres) 0 0 0
Parks (Number) 0 0 0
Special Waste Sites (Number within one block)
CERCLIS(1) 2 2 0
LUST(2) 20 20 0
(1)Comprehensive Environmental Response, Compensation and Liability Information System. (2)Leaking Underground Storage Tank. (3) Current access to the Great Western Railroad Depot will be relocated to the west along the same block.
Therefore, there will be no permanent impact to this structure.
Only those categories with impacts are discussed below.
S.8.4.1 Land Use/Socioeconomic Impacts
As shown in Table S.8‐5 Alternative 2A has fewer displacements and parcels with access
changes than 2B. Residential and business relocations will likely affect a small
percentage of minority and/or low‐income individuals, however the cumulative impacts
are not anticipated to be disproportionate for the retained alternatives (2A or 2B).
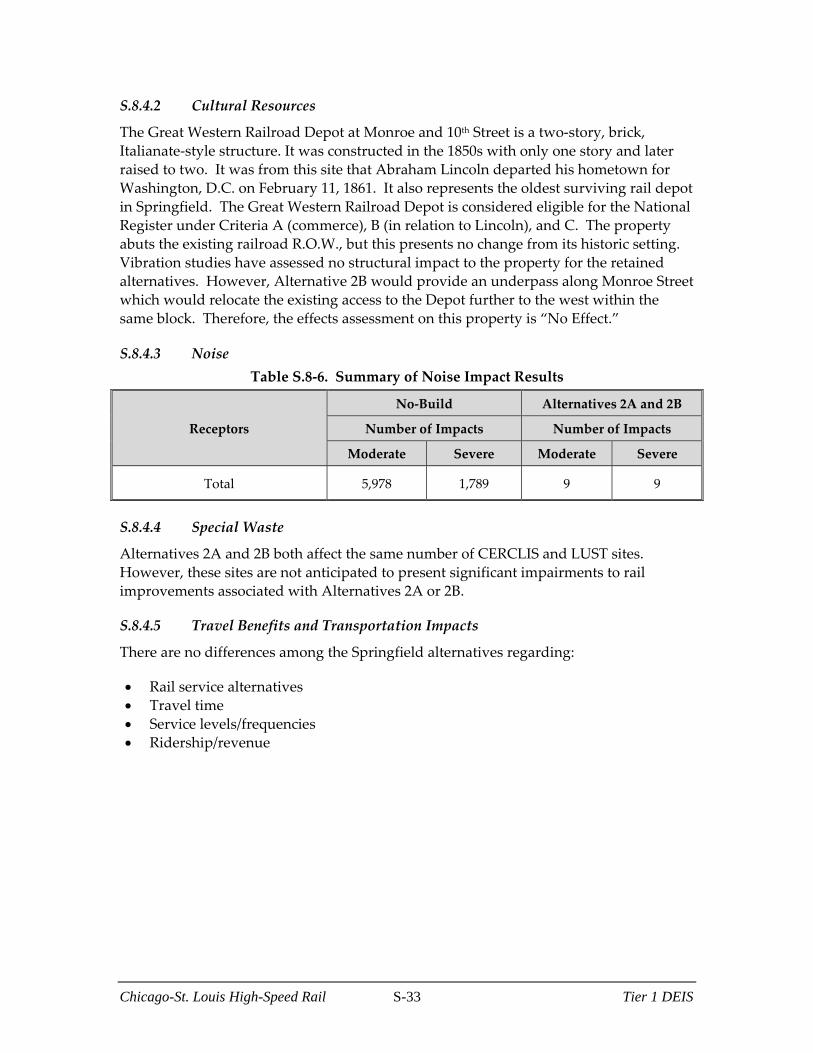
Chicago-St. Louis High-Speed Rail S-33 Tier 1 DEIS
S.8.4.2 Cultural Resources
The Great Western Railroad Depot at Monroe and 10th Street is a two‐story, brick,
Italianate‐style structure. It was constructed in the 1850s with only one story and later
raised to two. It was from this site that Abraham Lincoln departed his hometown for
Washington, D.C. on February 11, 1861. It also represents the oldest surviving rail depot
in Springfield. The Great Western Railroad Depot is considered eligible for the National
Register under Criteria A (commerce), B (in relation to Lincoln), and C. The property
abuts the existing railroad R.O.W., but this presents no change from its historic setting.
Vibration studies have assessed no structural impact to the property for the retained
alternatives. However, Alternative 2B would provide an underpass along Monroe Street
which would relocate the existing access to the Depot further to the west within the
same block. Therefore, the effects assessment on this property is “No Effect.”
S.8.4.3 Noise
Table S.8‐6. Summary of Noise Impact Results
Receptors
No‐Build Alternatives 2A and 2B
Number of Impacts Number of Impacts
Moderate Severe Moderate Severe
Total 5,978 1,789 9 9
S.8.4.4 Special Waste
Alternatives 2A and 2B both affect the same number of CERCLIS and LUST sites.
However, these sites are not anticipated to present significant impairments to rail
improvements associated with Alternatives 2A or 2B.
S.8.4.5 Travel Benefits and Transportation Impacts
There are no differences among the Springfield alternatives regarding:
Rail service alternatives
Travel time
Service levels/frequencies
Ridership/revenue
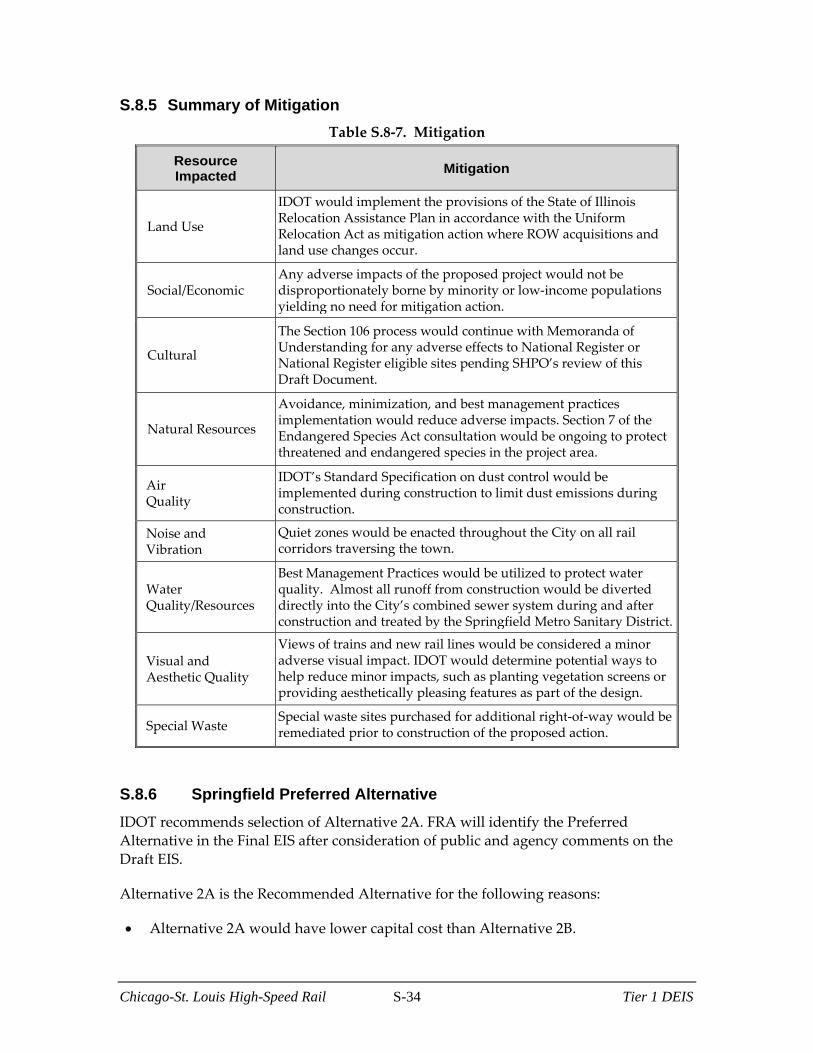
Chicago-St. Louis High-Speed Rail S-34 Tier 1 DEIS
S.8.5 Summary of Mitigation
Table S.8‐7. Mitigation
Resource Impacted
Mitigation
Land Use
IDOT would implement the provisions of the State of Illinois Relocation Assistance Plan in accordance with the Uniform Relocation Act as mitigation action where ROW acquisitions and land use changes occur.
Social/Economic Any adverse impacts of the proposed project would not be disproportionately borne by minority or low‐income populations yielding no need for mitigation action.
Cultural
The Section 106 process would continue with Memoranda of Understanding for any adverse effects to National Register or National Register eligible sites pending SHPO’s review of this Draft Document.
Natural Resources
Avoidance, minimization, and best management practices implementation would reduce adverse impacts. Section 7 of the Endangered Species Act consultation would be ongoing to protect threatened and endangered species in the project area.
Air Quality
IDOT’s Standard Specification on dust control would be implemented during construction to limit dust emissions during construction.
Noise and Vibration
Quiet zones would be enacted throughout the City on all rail corridors traversing the town.
Water Quality/Resources
Best Management Practices would be utilized to protect water quality. Almost all runoff from construction would be diverted directly into the City’s combined sewer system during and after construction and treated by the Springfield Metro Sanitary District.
Visual and Aesthetic Quality
Views of trains and new rail lines would be considered a minor adverse visual impact. IDOT would determine potential ways to help reduce minor impacts, such as planting vegetation screens or providing aesthetically pleasing features as part of the design.
Special Waste Special waste sites purchased for additional right‐of‐way would be remediated prior to construction of the proposed action.
S.8.6 Springfield Preferred Alternative
IDOT recommends selection of Alternative 2A. FRA will identify the Preferred
Alternative in the Final EIS after consideration of public and agency comments on the
Draft EIS.
Alternative 2A is the Recommended Alternative for the following reasons:
Alternative 2A would have lower capital cost than Alternative 2B.

Chicago-St. Louis High-Speed Rail S-35 Tier 1 DEIS
Alternative 2B would have lower delays, crash rates and lifecycles costs, but this
results primarily from constructing new grade separations at Monroe and
Washington Streets and closing Capitol Avenue and Enos Streets. The grade
separations both have a benefit/cost ratio much less than 1.0. The grade separations
and street closures create undesirable access and adverse travel issues.
Alternative 2B would require more right‐of‐way acquisition, and would result in
more commercial displacements and more parcels with a change in access.
Alternative 2B changes the access to the Great Western Railroad Depot due to the
construction of an underpass grade separation along Monroe Street.
There are no other anticipated differences between the impacts for Alternatives 2A
and 2B including environmental justice concerns, Section 4(f) properties, noise or
vibrations impacts.


