Page 1
8/3/2019 Volume IV Population and Housing
http://slidepdf.com/reader/full/volume-iv-population-and-housing 1/90
Venango County
2004 Comprehensive Development Plan
Population and Housing (Vol. IV)
Venango
Countyin the
21st Century
Plum
Pleasantville
IrwinBarkeyville EmlentonClintonClintonville Scrubgrass Richland
CherrytreeOil Creek
Allegheny
Jackson
Cooperstown
Canal
Oakland Cornplanter
Sugarcreek President
Rouseville
Oil CityUtica
RocklandVictory
Mineral
Frenchcreek
Polk Sandycreek
Cranberry
Franklin
Pinegrove
Page 2
8/3/2019 Volume IV Population and Housing
http://slidepdf.com/reader/full/volume-iv-population-and-housing 2/90
Venango County Regional Planning Commission
191 Howard St.
Franklin, PA 16323
Phone: 814-432-4555
Fax: 814-432-5885
This Plan was partially funded with a grant from the
Pennsylvania Department of Community and Economic Development.
Population and Housing
Demographic Analysis
enango County’s people are clearly its most vital resource. This chapter will
analyze the composition of this population, how this composition has changed,
and how it may continue to change in the future.
This analysis will center on variables such as population
growth and decline, population distribution/density, age
structure, gender and racial composition, education,
household size and structure, and income. Each of these
variables can reveal information that is essential to
properly planning for the County’s future. Where it is
applicable, Venango County’s demographic statistics will
be compared to those of neighboring counties, the
Commonwealth of Pennsylvania and the United States.
V
Present Population
As of April 1, 2000 the US Census reported the population of Venango County
was 57,565 making the County the 44th largest county in the State (out of 67) and the
829th largest in the U.S. (out of 3,141). Through the period of April 1, 2000 to July 1,
2000 Total Population
Pennsylvania 12,281,054Venango County 57,565Armstrong County 72,392Butler County 174,083Clarion County 41,765Crawford County 90,366Erie County 280,843Forest County 4,946Mercer County 120,293Warren County 43,863
V e n
a n g o
A r m s
t r o n g
B
u t l e r
C l a
r i o n
C r a w f o r d
E
r i e
F o r e
s t
M e r c e r
W a r r e n
0
50
100
150
200
250
300
T h o u s a n d s
Page 3
8/3/2019 Volume IV Population and Housing
http://slidepdf.com/reader/full/volume-iv-population-and-housing 3/90
2001 the Census Bureau estimates the population to have declined by 487 persons, a
0.8% loss placing the population at slightly over 57,000. The loss of nearly 1% from
April 2000 through July of 2001 placed the County 55th in terms of population growth
during that time period. Over that same time period 33 Pennsylvania counties were
estimated to have gained population. See Table 3-1 below for detailed population
totals.
Page 4
8/3/2019 Volume IV Population and Housing
http://slidepdf.com/reader/full/volume-iv-population-and-housing 4/90
.........
Venango County, PennsylvaniaComprehensive Development Plan
TABLE 3-1
PRESENT POPULATION
Jurisdiction 2000 Population Jurisdiction 2000 Population
U.S. 281,421,906 Central Planning UnitPA 12,281,054 City of Franklin 7,212Venango Co. 57,565 City of Oil City 11,504
Northern Planning Unit Cranberry Township 7,014Allegheny Township 281 Sugarcreek Borough 5,331Canal Township 1,008 Total 31,061Cherry Tree Township 1,543 Southern Planning UnitCooperstown Borough 400 Barkeyville Borough 237Cornplanter Township 2,687 Clinton Township 758Jackson Township 1,168 Clintonville Borough 528Oakland Township 1,565 Emlenton Borough 784Oil Creek Township 840 French Creek Township 1,605
Pine Grove Township 1,338 Irwin Township 1,309Pleasantville Borough 850 Mineral Township 533Plum Township 1,060 Polk Borough 1,031President Township 543 Richland Township 744Rouseville Borough 472 Rockland Township 1,346
Total 13,755 Sandy Creek Township 2,406Scrubgrass Township 799Utica Borough 211Victory Township 408
Total 12,699Source: 2000 US Census of Population and Housing
Population Changes
Historical Changes: Venango County, Pennsylvania and the U.S.
The 2000 United States Census of Population and Housing determined that
Venango County had 57,565 residents. This was a 3.15% decrease from the County’s
1990 population of 59,381. That loss ranks the County as the 64th slowest growing
44 - 4 -4490 - 4 - Population and Housings
Page 4 of 90
Page 5
8/3/2019 Volume IV Population and Housing
http://slidepdf.com/reader/full/volume-iv-population-and-housing 5/90
.........
20th CENTURY POPULATION CHANGEVenago County, PA and the U.S.
-10.0%
-5.0%
0.0%
5.0%
10.0%
15.0%
20.0%
25.0%
1900 1910 1920 1930 1940 1950 1960 1970 1980 1990 2000YEAR
P e r c e n t o f P o p u l a t i o n L o s s / G
Venango County
PA
US
Venango County, PennsylvaniaComprehensive Development Plan
county in the State for that time period. However, only five decades since 1800 has the
County’s population declined, four of which took place in the later half of the 20 th
century. Since the County’s peak population of 65,328 in1950 population losses had
amounted to 13.4%.
The chart below indicates that Venango County has followed closely to the
population patterns of both Pennsylvania and the Unites States, however, at lower
levels of growth and higher levels of population decline – with the exception of the
growth patterns of the 1970’s.
55 - 5 -5590 - 5 - Population and Housings
Page 5 of 90
Page 6
8/3/2019 Volume IV Population and Housing
http://slidepdf.com/reader/full/volume-iv-population-and-housing 6/90
.........
Venango County, PennsylvaniaComprehensive Development Plan
Figure 1
Source: 1900-2000 US Census
In comparison, the County has experienced recent population losses very similar
to many western Pennsylvania Counties. The population loss 13.4% was experienced
since 1980.
See Table 3-2 for details on the population changes of Venango County, the
Commonwealth, and the United States as a whole.
TABLE 3-2
66 - 6 -6690 - 6 -
1800-2000 VENANGO COUNTY, PENNSYLVANIA, AND THE U.S.
Year Population Percent Change in Decade
Venango Co. PA U.S. Venango Co. PA U.S.
1800 1,130 602,356 5,308,483 - - -
1810 3,060 810,091 7,239,881 65.35% 25.64% 35.10%
1820 4,915 1,049,458 9,638,453 37.74% 29.55% 33.13%
1830 9,470 1,348,233 12,860,702 48.10% 28.47% 33.43%
1840 17,900 1,724,033 17,063,353 47.10% 27.87% 32.68%
1850 18,310 2,311,786 23,191,876 2.23% 34.09% 35.92%
1860 25,043 2,906,215 31,443,321 26.89% 25.71% 35.58%
1870 47,925 3,521,951 38,558,371 47.74% 21.19% 22.63%
1880 43,670 4,282,891 50,189,209 -9.74% 21.61% 30.16%
1890 46,640 5,258,113 62,979,766 6.36% 22.77% 25.48%
1900 49,648 6,302,115 76,212,168 6.05% 19.86% 21.01%
1910 56,359 7,665,111 92,228,496 11.91% 21.63% 21.02%
1920 59,184 8,720,017 106,021,537 4.77% 13.76% 14.96%
1930 63,226 9,631,350 123,202,624 6.39% 10.45% 16.21%
1940 63,958 9,900,180 132,164,569 1.14% 2.79% 7.27%
1950 65,328 10,498,012 151,325,798 2.10% 6.04% 14.50%
1960 65,295 11,319,366 179,323,175 -0.05% 7.82% 18.50%
1970 62,335 11,800,766 203,302,031 -4.74% 4.25% 13.37%
1980 64,444 11,864,720 226,542,199 3.27% 0.54% 11.43%
1990 59,381 11,881,643 248,709,873 -7.86% 0.14% 9.79%
2000 57,565 12,281,054 281,421,906 -3.15% 3.25% 11.62%Source: US Census of Population and Housing
Population and Housings
Page 6 of 90
Page 7
8/3/2019 Volume IV Population and Housing
http://slidepdf.com/reader/full/volume-iv-population-and-housing 7/90
.........
Venango County, PennsylvaniaComprehensive Development Plan
POPULATION CHANGE
77 - 7 -7790 - 7 - Population and Housings
Page 7 of 90
Page 8
8/3/2019 Volume IV Population and Housing
http://slidepdf.com/reader/full/volume-iv-population-and-housing 8/90
.........
Figure 2Source: 1990-2000 US Census
Venango County, PennsylvaniaComprehensive Development Plan
Historical Municipal Population Comparisons
This section summarizes the population changes in each of Venango County’s
31 municipalities. Since 1980 the County has experienced a significant population
decline. The majority of these population losses occurred in the nine (9) Boroughs and
the cities of Franklin and Oil City.
Cities
The population of Franklin and Oil City in 1980 was 22,027, which declined by 3,311
(15.0%) and was reported to be 18,716 in 2000. Since 1980 Oil City lost 2,377
residents, while Franklin lost nearly 1,000. The losses slowed greatly in the 1990’s and
perhaps are stabilizing throughout the 2000 decade. From 1990 to 2000 Franklin and Oil
City lost numerical totals equal to 117 and 445 respectively. In 2000 the city populationsmade up 32.5% of the county’s total population down from 34.1% in 1980.
Boroughs
The Borough population in 1980 was 12,142, which declined by 2,298 (18.9%) to settle
at 9,844 for the 2000 Census. The Borough population as of 2000 represented 17.1% of
the county’s total population down from
18.8% in 1980. As the population of the
county slowed its population losses through
the 1990’s the Boroughs continued to lose
significant population. From 1990 to 2000 the
Boroughs of Venango County lost 897
residents, or 8.4% of their 10,739 1990 total.
Since 1990 only one Borough in Venango
County has increased its population.
Clintonville grew by 1.5%; however, this was
an actual increase of only 8 residents. The
largest percent loss of population since 1980
was Polk Borough who saw 45.3% of its
population leave its boundaries. The reason
for this population loss directly related to the
Department of Public Welfare’s normalization
program, which aggressively
88 - 8 -8890 - 8 - Population and Housings
Page 8 of 90
Page 9
8/3/2019 Volume IV Population and Housing
http://slidepdf.com/reader/full/volume-iv-population-and-housing 9/90
.........
Venango County, PennsylvaniaComprehensive Development Plan
relocated residents at Polk Center into community awareness settings.
Townships
Since 1980 the 20 Venango County Township’s present a mixed bag of change. The
1980 Township population was 30,274 representing 46.9% of the county’s total
population. Since 1980 the Townships lost 1,269 residents bringing their 2000 population
totals to 29,005, a loss of 4.1% for the decade, but a gain since 1980 in terms of the
county’s total population representation (50.3%). During the 90’s 12 of the 20 Townships
gained modestly in population, while Richland and French Creek Townships experienced
heavy percentage losses. Numerically the largest population losses occurred in
Cornplanter and Cranberry Townships, despite the latter’s significant commercial
developments. As the county slowed its population losses through the 1990’s the
Townships began to respond. From 1990 to 2000 the Townships of Venango County lost
only 359 residents, or 1.2% of their 1990 total of 29,364. Since 1990, seven (7) of the
20 Townships lost population. The fastest growing Townships, growing at 10% or more
for the decade, include Scrubgrass, Victory and Irwin. Numerically the Townships
adding the most people to its boundaries since 1990 include Irwin, Jackson, Victory,
President and Oakland. See Figure 2 and Table 3-3 for a detailed presentation of
population changes in Venango County since 1980.
99 - 9 -9990 - 9 - Population and Housings
Page 9 of 90
Page 10
8/3/2019 Volume IV Population and Housing
http://slidepdf.com/reader/full/volume-iv-population-and-housing 10/90
.........
Venango County, PennsylvaniaComprehensive Development Plan
TABLE 3-3MUNICIPAL POPULATION COMPARISONS
Name1980
Population1990
Population2000
Population
TotalChange1980-2000
PercentChange1980-2000
TotalChange1990-2000
PercentChange1990-2000
VenangoCounty
64,444 59,381 57,565 -6,879 -11.9 1,816 -3.15
NORTHERN MUNICIPALITIES
Name1980
Population1990
Population2000
Population
TotalChange1980-2000
PercentChange1980-2000
TotalChange1990-2000
PercentChange1990-2000
AlleghenyTownship
261 281 281 20 7.7 0 0.0
CanalTownship
1,055 1,067 1,008 -47 -4.5 -59 -5.5
Cherry TreeTownship
1635 1601 1,543 -92 -5.6 -58 -3.6
CooperstownBorough
644 506 400 -244 -37.9 -106 -20.9
Cornplanter Township
3,038 2,968 2,687 -351 -11.6 -281 -9.5
JacksonTownship
1,097 1,089 1,168 71 6.5 79 7.3
OaklandTownship
1,559 1,527 1,565 6 0.4 38 2.5
Oil CreekTownship
873 915 840 -33 -3.8 -75 -8.2
Pine GroveTownship
1,437 1,395 1,338 -99 -6.9 -57 -4.1
PleasantvilleBorough
1,099 991 850 -249 -22.7 -141 -14.2
PlumTownship
1,031 1,031 1,060 29 2.8 29 2.8
PresidentTownship
534 501 543 9 1.7 42 8.4
RousevilleBorough
734 583 472 -262 -35.7 -111 -19.0
Total 14,997 14,455 13,755 -1,242 -8.4 -700 -64
CENTRAL MUNICIPALITIES
1010 - 10 -101090 - 10 - Population and Housings
Page 10 of 90
Page 11
8/3/2019 Volume IV Population and Housing
http://slidepdf.com/reader/full/volume-iv-population-and-housing 11/90
.........
Venango County, PennsylvaniaComprehensive Development Plan
Name1980
Population1990
Population2000
Population
TotalChange1980-2000
PercentChange1980-2000
TotalChange1990-2000
PercentChange
1990-2000
City of Franklin
8,146 7,329 7,212 -934 -11.5 -117 -1.6
City of OilCity
13,881 11949 11,504 -2,377 -17.1 -445 -3.7
CranberryTownship
7,873 7,256 7,014 -859 -10.9 -242 -3.3
SugarcreekBorough
5,954 5,532 5,331 -623 -10.5 -201 -3.6
Total 35,854 32,066 31,061 -4,793 -13.5 -1,005 -12.2
SOUTHERN MUNICIPALITIES
1111 - 11 -111190 - 11 - Population and Housings
Page 11 of 90
Page 12
8/3/2019 Volume IV Population and Housing
http://slidepdf.com/reader/full/volume-iv-population-and-housing 12/90
.........
Venango County, PennsylvaniaComprehensive Development Plan
Name1980
Population1990
Population2000
Population
TotalChange1980-2000
PercentChange1980-2000
TotalChange1990-2000
PercentChange1990-2000
BarkeyvilleBorough
266 274 237 -29 -10.9 -37 -13.5
ClintonTownship
686 733 758 72 10.5 25 3.4
ClintonvilleBorough
512 520 528 16 3.1 8 1.5
EmlentonBorough
794 824 784 -10 -1.3 -40 -4.9
FrenchCreekTownship
2,076 1,676 1,605 -471 -22.7 -71 -4.2
IrwinTownship
1,234 1,182 1,309 75 6.1 127 10.7
Mineral
Township519 514 533 14 2.7 19 3.7
PolkBorough
1,884 1,267 1,031 -853 -45.3 -236 -18.6
RichlandTownship
1,055 775 744 -311 -29.5 -31 -4.0
RocklandTownship
1,310 1,320 1,346 36 2.7 26 2.0
SandyCreekTownship
1,948 2,495 2,406 458 23.5 -89 -3.6
ScrubgrassTownship
719 673 799 80 11.1 126 18.7
UticaBorough
255 242 211 -44 -17.3 -31 -12.8
VictoryTownship
335 365 408 73 21.8 43 11.8
Total 13,593 12,860 12,699 -894 -7 -161 -9.8
Source: US Census of Population and Housing
1212 - 12 -121290 - 12 - Population and Housings
Page 12 of 90
Page 13
8/3/2019 Volume IV Population and Housing
http://slidepdf.com/reader/full/volume-iv-population-and-housing 13/90
.........
Figure 3Source: 2000 US Census
Figure 4Source: 2000 US Census
Venango County, PennsylvaniaComprehensive Development Plan
Density
The population density for
Venango County in 2000 was 85.3
persons per square mile. The 2000
density for Pennsylvania was much
higher at 274 persons per square
mile, while the U.S. was 79.6.
Density is calculated by taking the
total population and dividing it by
the land area of the unit assigned.
Figure 3 shows the density of the
County by municipal subdivision.
The density
for the county is
represented by dark
brown in the
densest areas and
off-white in the
rural areas. As
would be expected
the density per
square mile is
concentrated in the
Boroughs and cities,
along major
transportation
corridors and
within the Townships near Oil City and Franklin.
1313 - 13 -131390 - 13 - Population and Housings
Page 13 of 90
Page 14
8/3/2019 Volume IV Population and Housing
http://slidepdf.com/reader/full/volume-iv-population-and-housing 14/90
.........
Venango County, PennsylvaniaComprehensive Development Plan
Distribution
The weakness in a density analysis for large areas, rural areas and other land
areas where populations are dispersed in clusters is the assumption that all people live
equidistance from one another. By breaking the municipal subdivisions down into
population distribution categories such as Census Tracts and Census Block Groups an
improved picture of an areas density and population distribution can be assembled.
Census Tracts
A Census Tract is a small, relatively permanent statistical subdivision of a county
delineated by a local committee of census data users for the purpose of presenting data.
Census tract boundaries normally follow visible features, but may follow governmental
unit boundaries and other non-visible features in some instances; they always nest
within counties. Designed to be relatively homogeneous units with respect to population
characteristics, economic status, and living conditions at the time of establishment,
census tracts average about 4,000 inhabitants. They may be split by any sub-county
geographic entity.
The advantage to this density interpretation is that the census tracts are
established around population areas that amount to around 4,000 residents. Thus the
areas with more census tracts have higher concentrations of; however, the disadvantage
is that the census tracts are larger than most subdivisions.
The census tract density picture (Figure 4) is more representative of the
population distribution of the county. The major corridor along routes 322 and 62 make
up the smallest census tracts and highest population concentrations. However, the
concentrated distribution patterns that appear in the Townships of Sugarcreek, Sandy
Creek and Cranberry are not represented in sufficient detail.
1414 - 14 -141490 - 14 - Population and Housings
Page 14 of 90
2000 Population Density
Pennsylvania 274.0Venango County 85.3Armstrong County 110.7Butler County 220.8Clarion County 69.3Crawford County 89.2Erie County 350.2Forest County 11.6Mercer County 179.1Warren Count 49.6
Page 15
8/3/2019 Volume IV Population and Housing
http://slidepdf.com/reader/full/volume-iv-population-and-housing 15/90
.........
Figure 5
Source: 2000 US Census
Venango County, PennsylvaniaComprehensive Development Plan
Block Groups
A Census Block is a subdivision of a census
tract. Many blocks correspond to individual city
blocks bounded by streets, but blocks – especially in
rural areas – may include many square miles and
may have some boundaries that are not streets.
A Census Block Group is a subdivision of a
census tract. A block group consists of all the blocks
within a census tract with the same beginning
number. To a far greater degree of usefulness are
the census blocks. Like Census Tracts they also
represent areas of population concentrations in a
range of 1,000 to 2,500 persons and therefore they
identify some of the detailed distribution patterns we were looking for. The primary
concentrations of inhabitants newly identified in Figure 5 are the commercial and
residential developments in Cranberry and Sugarcreek Township on the outskirts of
Franklin and Oil City.
Population Projection to 2020
This section uses the cohort-component projection technique to forecast the
probable size and composition of Venango County’s population through the year 2020.
There are three components of population change that will determine the future of any
population. The first of these is mortality, and the second is fertility. A population
projection that uses only these two components is called a “natural increase” projection.
The “Natural Increase Population Projection” for Venango County shown in Table 3-4
uses the County’s 1990 to 1999 mortality rates and its 1990 to 1999 fertility rates. All of
this data was obtained from the Pennsylvania State Data Center and the Pennsylvania
Health Data Center.
However, a “natural increase” projection ignores the third, and often the most
important component of population change -- migration. Throughout western
Pennsylvania and northeastern Ohio, the effects of migration have usually outweighed
the effects of mortality and fertility over the past 30 years. Unfortunately, migration is
almost impossible to predict due to the many variables that influence it -- such as the
1515 - 15 -151590 - 15 - Population and Housings
Page 15 of 90
Page 16
8/3/2019 Volume IV Population and Housing
http://slidepdf.com/reader/full/volume-iv-population-and-housing 16/90
.........
Venango County, PennsylvaniaComprehensive Development Plan
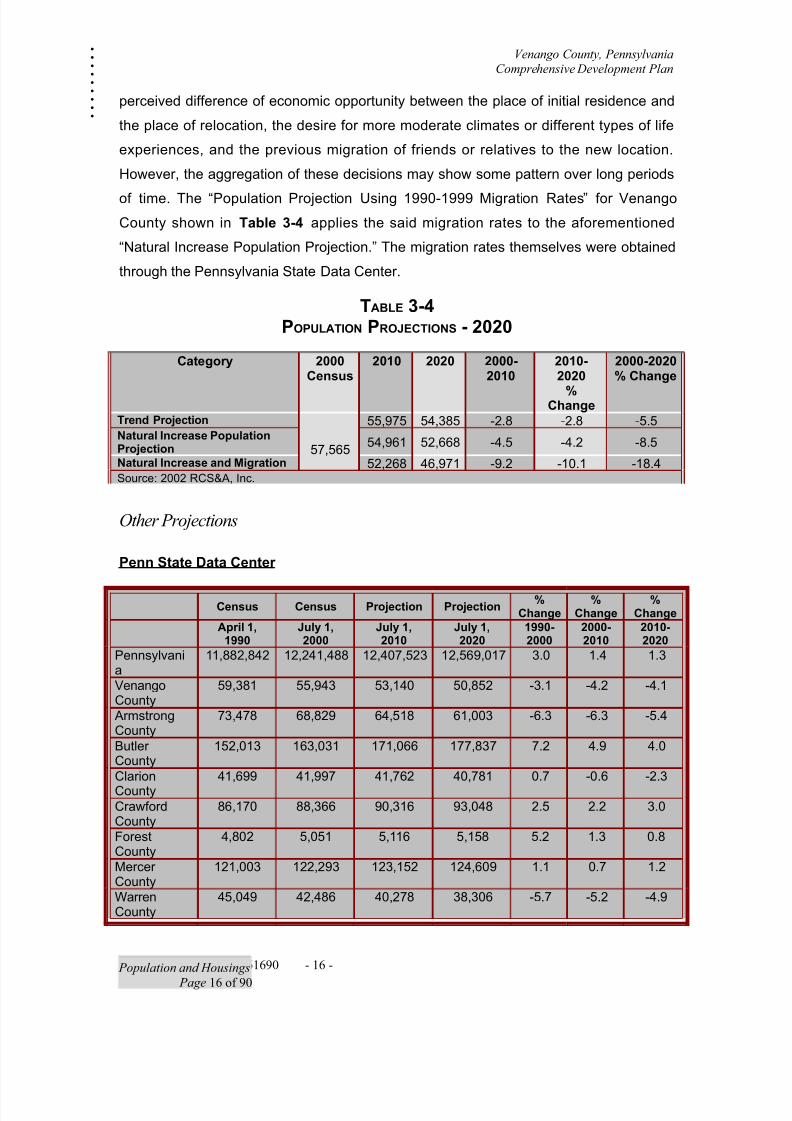
perceived difference of economic opportunity between the place of initial residence and
the place of relocation, the desire for more moderate climates or different types of life
experiences, and the previous migration of friends or relatives to the new location.
However, the aggregation of these decisions may show some pattern over long periods
of time. The “Population Projection Using 1990-1999 Migration Rates” for Venango
County shown in Table 3-4 applies the said migration rates to the aforementioned
“Natural Increase Population Projection.” The migration rates themselves were obtained
through the Pennsylvania State Data Center.
TABLE 3-4POPULATION PROJECTIONS - 2020
Category 2000Census
2010 2020 2000-2010
2010-2020
%Change
2000-2020% Change
Trend Projection
57,565
55,975 54,385 -2.8 -2.8 -5.5Natural Increase PopulationProjection
54,961 52,668 -4.5 -4.2 -8.5
Natural Increase and Migration 52,268 46,971 -9.2 -10.1 -18.4Source: 2002 RCS&A, Inc.
Other Projections
Penn State Data Center
Census Census Projection Projection%
Change%
Change%
ChangeApril 1,
1990July 1,2000
July 1,2010
July 1,2020
1990-2000
2000-2010
2010-2020
Pennsylvania
11,882,842 12,241,488 12,407,523 12,569,017 3.0 1.4 1.3
VenangoCounty
59,381 55,943 53,140 50,852 -3.1 -4.2 -4.1
ArmstrongCounty
73,478 68,829 64,518 61,003 -6.3 -6.3 -5.4
Butler County
152,013 163,031 171,066 177,837 7.2 4.9 4.0
ClarionCounty
41,699 41,997 41,762 40,781 0.7 -0.6 -2.3
CrawfordCounty
86,170 88,366 90,316 93,048 2.5 2.2 3.0
ForestCounty
4,802 5,051 5,116 5,158 5.2 1.3 0.8
Mercer County
121,003 122,293 123,152 124,609 1.1 0.7 1.2
WarrenCounty
45,049 42,486 40,278 38,306 -5.7 -5.2 -4.9
1616 - 16 -161690 - 16 - Population and Housings
Page 16 of 90
Page 17
8/3/2019 Volume IV Population and Housing
http://slidepdf.com/reader/full/volume-iv-population-and-housing 17/90
.........
Venango County, PennsylvaniaComprehensive Development Plan
Age, Gender and Racial Composition
Median Age
1According to the 2000 US Census
the median age for Pennsylvania was 38.0
years of age increasing sharply from the
1990 median age of 34.0 years, which was
the 2nd highest among all of the states. The
2000 US median age was 35.3 ranking
Pennsylvania as now having the 3rd oldest
resident population in the US behind West
Virginia and Florida, which were at 38.9 and
38.7, respectively. In 2000, Venango County
had a median age of 40.2 years ranking the
County as having the 11th oldest resident
population in the state. In 1990 the median age in the County was 34.8 years.
1717 - 17 -171790 - 17 - Population and Housings
Page 17 of 90
Median Age 2000
Pennsylvania 38.0
Venango County 40.2
Armstrong County 40.4
Butler County 37.6
Clarion County 36.3
Crawford County 38.1
Erie County 36.2
Forest County 44.2
Mercer County 39.6
Warren County 40.5
Page 18
8/3/2019 Volume IV Population and Housing
http://slidepdf.com/reader/full/volume-iv-population-and-housing 18/90
.........
Venango County, PennsylvaniaComprehensive Development Plan
Table 3-5
Median Age by Planning Unit
1990-2000
Central Planning Unit
1990 2000
City of Franklin 35.9 39.5
City of Oil City 35.8 37.9
Cranberry Township 35.6 40.2
Sugarcreek Borough 38.0 41.8
Southern Planning Unit
Barkeyville Borough 35.7 41.6
Clinton Township 32.6 37.4
Photo by Daniel Alward Clintonville Borough 33.4 35.3
Northern Planning Unit Emlenton Borough 39.4 42.4
Allegheny Township 36.5 41.9 French Creek Township 34.8 41.7
Canal Township 36.3 40.2 Irwin Township 32.3 37.2
Cherry Tree Township 34.1 40.2 Mineral Township 35.6 41.3
Cooperstown Borough 36.1 43.4 Polk Borough 43.0 46.5
Cornplanter Township 37.2 42.4 Richland Township 34.7 41.7
Jackson Township 30.3 35.7 Rockland Township 36.8 43.4
Oakland Township 33.4 40.1 Sandy Creek Township 32.8 38.3
Oil Creek Township 36.5 42.6 Scrubgrass Township 38.7 41.4
Pine Grove Township 35.6 40.2 Utica Borough 30.3 34.4
Pleasantville Borough 33.1 40.4 Victory Township 37.8 40.6
Plum Township 34.9 39.5
President Township 39.6 45.9
Rouseville Borough 36.9 44.0
1818 - 18 -181890 - 18 - Population and Housings
Page 18 of 90
Page 19
8/3/2019 Volume IV Population and Housing
http://slidepdf.com/reader/full/volume-iv-population-and-housing 19/90
.........
Venango County, PennsylvaniaComprehensive Development Plan
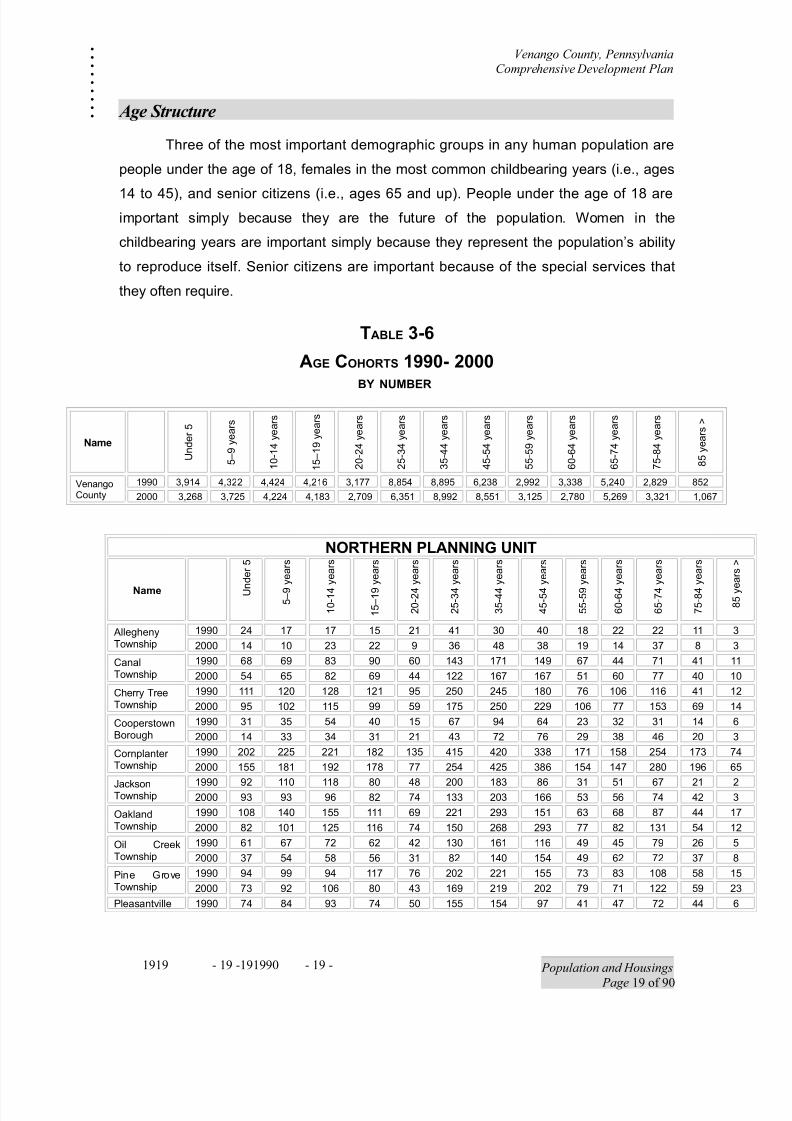
Age Structure
Three of the most important demographic groups in any human population are
people under the age of 18, females in the most common childbearing years (i.e., ages
14 to 45), and senior citizens (i.e., ages 65 and up). People under the age of 18 areimportant simply because they are the future of the population. Women in the
childbearing years are important simply because they represent the population’s ability
to reproduce itself. Senior citizens are important because of the special services that
they often require.
TABLE 3-6
AGE COHORTS 1990- 2000BY NUMBER
Name
U n d e r 5
5 – 9
y e a r s
1 0 - 1 4
y e a r s
1 5 – 1 9
y e a r s
2 0 - 2 4
y e a r s
2 5 - 3 4
y e a r s
3 5 - 4 4
y e a r s
4 5 - 5 4
y e a r s
5 5 - 5 9
y e a r s
6 0 - 6 4
y e a r s
6 5 - 7 4
y e a r s
7 5 - 8 4
y e a r s
8 5
y e a r s >
VenangoCounty
1990 3,914 4,322 4,424 4,216 3,177 8,854 8,895 6,238 2,992 3,338 5,240 2,829 852
2000 3,268 3,725 4,224 4,183 2,709 6,351 8,992 8,551 3,125 2,780 5,269 3,321 1,067
NORTHERN PLANNING UNIT
Name U n d e r 5
5 – 9
y e a r s
1 0 - 1 4
y e a r s
1 5 – 1 9
y e a r s
2 0 - 2 4
y e a r s
2 5 - 3 4
y e a r s
3 5 - 4 4
y e a r s
4 5 - 5 4
y e a r s
5 5 - 5 9
y e a r s
6 0 - 6 4
y e a r s
6 5 - 7 4
y e a r s
7 5 - 8 4
y e a r s
8 5 y e a r s >
AlleghenyTownship
1990 24 17 17 15 21 41 30 40 18 22 22 11 3
2000 14 10 23 22 9 36 48 38 19 14 37 8 3
CanalTownship
1990 68 69 83 90 60 143 171 149 67 44 71 41 11
2000 54 65 82 69 44 122 167 167 51 60 77 40 10
Cherry TreeTownship
1990 111 120 128 121 95 250 245 180 76 106 116 41 12
2000 95 102 115 99 59 175 250 229 106 77 153 69 14
CooperstownBorough
1990 31 35 54 40 15 67 94 64 23 32 31 14 6
2000 14 33 34 31 21 43 72 76 29 38 46 20 3
Cornplanter Township
1990 202 225 221 182 135 415 420 338 171 158 254 173 74
2000 155 181 192 178 77 254 425 386 154 147 280 196 65
JacksonTownship
1990 92 110 118 80 48 200 183 86 31 51 67 21 22000 93 93 96 82 74 133 203 166 53 56 74 42 3
OaklandTownship
1990 108 140 155 111 69 221 293 151 63 68 87 44 17
2000 82 101 125 116 74 150 268 293 77 82 131 54 12
Oil CreekTownship
1990 61 67 72 62 42 130 161 116 49 45 79 26 5
2000 37 54 58 56 31 82 140 154 49 62 72 37 8
Pine GroveTownship
1990 94 99 94 117 76 202 221 155 73 83 108 58 15
2000 73 92 106 80 43 169 219 202 79 71 122 59 23
Pleasantville 1990 74 84 93 74 50 155 154 97 41 47 72 44 6
1919 - 19 -191990 - 19 - Population and Housings
Page 19 of 90
Page 20
8/3/2019 Volume IV Population and Housing
http://slidepdf.com/reader/full/volume-iv-population-and-housing 20/90
.........
Venango County, PennsylvaniaComprehensive Development Plan
NORTHERN PLANNING UNIT
Name U n d e r 5
5 – 9
y e a r s
1 0 - 1 4
y e a r s
1 5 – 1 9
y e a r s
2 0 - 2 4
y e a r s
2 5 - 3 4
y e a r s
3 5 - 4 4
y e a r s
4 5 - 5 4
y e a r s
5 5 - 5 9
y e a r s
6 0 - 6 4
y e a r s
6 5 - 7 4
y e a r s
7 5 - 8 4
y e a r s
8 5
y e a r s >
Borough 2000 36 56 71 64 41 87 130 123 35 43 100 55 9
PlumTownship
1990 69 78 79 80 58 153 168 133 46 57 77 32 1
2000 53 80 92 72 35 133 174 156 57 58 93 47 10
PresidentTownship
1990 25 27 36 33 20 72 80 50 32 33 65 23 5
2000 21 22 39 37 24 36 86 82 35 34 85 37 5
RousevilleBorough
1990 40 44 26 49 37 80 75 54 49 34 58 25 12
2000 24 39 20 25 18 60 57 65 23 21 67 40 13
Total 1990 999 1,115 1,176 1,054 726 2,129 2,295 1,613 739 780 1,107 553 169
Total 2000 751 928 1,053 931 550 1,480 2,239 2,137 767 763 1,337 704 178
CENTRAL PLANNING UNIT
Name U n d e r 5
5 –
9
y e a r s
1 0 - 1
4
y e a r s
1 5 – 1
9
y e a r s
2 0 - 2
4
y e a r s
2 5 - 3
4
y e a r s
3 5 - 4
4
y e a r s
4 5 - 5
4
y e a r s
5 5 - 5
9
y e a r s
6 0 - 6
4
y e a r s
6 5 - 7
4
y e a r s
7 5 - 8
4
y e a r s
City of Franklin
1990 492 539 509 495 448 1,079 1,090 696 327 364 749 776 1
2000 457 560 489 514 426 839 1,031 988 347 330 632 507 1
City of OilCity
1990 839 932 963 727 719 1,844 1,696 1,066 527 701 1,185 705 2
2000 731 837 882 802 629 1,403 1,723 1,572 514 401 968 771 2
CranberryTownship
1990 499 547 566 469 340 1,131 1,107 755 386 432 663 295
2000 415 438 536 490 340 715 1,126 1,083 400 333 660 381
SugarcreekBorough
1990 324 392 380 353 276 800 763 652 347 323 509 293 1
2000 290 310 349 335 245 573 842 749 303 326 547 327 1
Total 1990 2,154 2,410 2,418 2,044 1,783 4,854 4,656 3,169 1,587 1,820 3,106 2,069 5
Total 2000 1,893 2,145 2,256 2,141 1,640 3,530 4,722 4,392 1,564 1,390 2,807 1,986 6
SOUTHERN MUNICIPALITIES
Name U n d e r 5
5 – 9
y e a r s
1 0 - 1 4
y e a r s
1 5
–
1 9
y e a r s
2 0 - 2 4
y e a r s
2 5 - 3 4
y e a r s
3 5 - 4 4
y e a r s
4 5 - 5 4
y e a r s
5 5 - 5 9
y e a r s
6 0 - 6 4
y e a r s
6 5 - 7 4
y e a r s
7 5 - 8 4
y e a r s
8 5
y e a r s >
BarkeyvilleBorough
1990 14 15 23 22 14 44 46 21 21 19 26 7 2
2000 16 16 13 8 11 32 40 44 9 6 24 17 1
ClintonTownship
1990 66 55 66 58 37 116 87 79 34 40 54 36 5
2000 40 52 70 57 36 93 114 105 55 35 65 29 7
ClintonvilleBorough
1990 47 45 34 32 32 82 62 49 20 20 50 40 7
2000 39 32 38 45 34 75 70 62 26 25 33 37 12
Emlenton
Borough
1990 42 67 50 51 47 100 110 81 36 49 77 83 31
2000 38 50 51 58 37 83 97 96 46 34 66 61 57FrenchCreekTownship
1990 109 128 126 128 87 266 280 188 79 93 119 58 15
2000 64 108 133 114 49 147 297 278 100 100 128 67 20
IrwinTownship
1990 72 92 99 112 84 177 182 104 58 76 80 39 7
2000 101 90 93 86 80 167 217 208 60 57 94 42 14
MineralTownship
1990 25 27 40 58 20 79 100 68 35 24 21 13 4
2000 37 30 25 28 18 66 98 94 33 30 53 16 5
PolkBorough
1990 28 39 48 55 52 190 281 205 84 79 130 68 8
2000 26 34 32 35 26 140 180 230 81 71 99 64 13
2020 - 20 -202090 - 20 - Population and Housings
Page 20 of 90
Page 21
8/3/2019 Volume IV Population and Housing
http://slidepdf.com/reader/full/volume-iv-population-and-housing 21/90
.........
Venango County, PennsylvaniaComprehensive Development Plan
SOUTHERN MUNICIPALITIES
Name U n d e r 5
5 – 9
y e a r s
1 0 - 1 4
y e a r s
1 5
–
1 9
y e a r s
2 0 - 2 4
y e a r s
2 5 - 3 4
y e a r s
3 5 - 4 4
y e a r s
4 5 - 5 4
y e a r s
5 5 - 5 9
y e a r s
6 0 - 6 4
y e a r s
6 5 - 7 4
y e a r s
7 5 - 8 4
y e a r s
8 5
y e a r s >
RichlandTownship
1990 39 75 72 55 36 115 107 93 37 48 56 34 8
2000 40 37 45 69 31 94 108 115 43 41 76 34 11
RocklandTownship
1990 89 86 93 106 66 185 189 150 77 90 131 50 8
2000 63 71 104 81 52 120 227 217 96 73 150 79 13
SandyCreekTownship
1990 141 182 188 343 124 350 381 297 117 129 160 73 10
2000 102 125 190 429 80 182 341 355 166 105 207 100 24
ScrubgrassTownship
1990 40 38 48 47 40 96 89 70 39 35 76 44 11
2000 30 56 52 57 44 73 146 101 55 33 72 64 16
UticaBorough
1990 25 29 15 22 11 33 37 234 9 11 13 10 3
2000 7 26 31 16 4 24 29 31 7 11 19 6 0
VictoryTownship
1990 24 19 28 29 18 38 83 27 20 25 34 16 4
2000 21 25 38 28 17 45 67 86 17 6 39 18 1
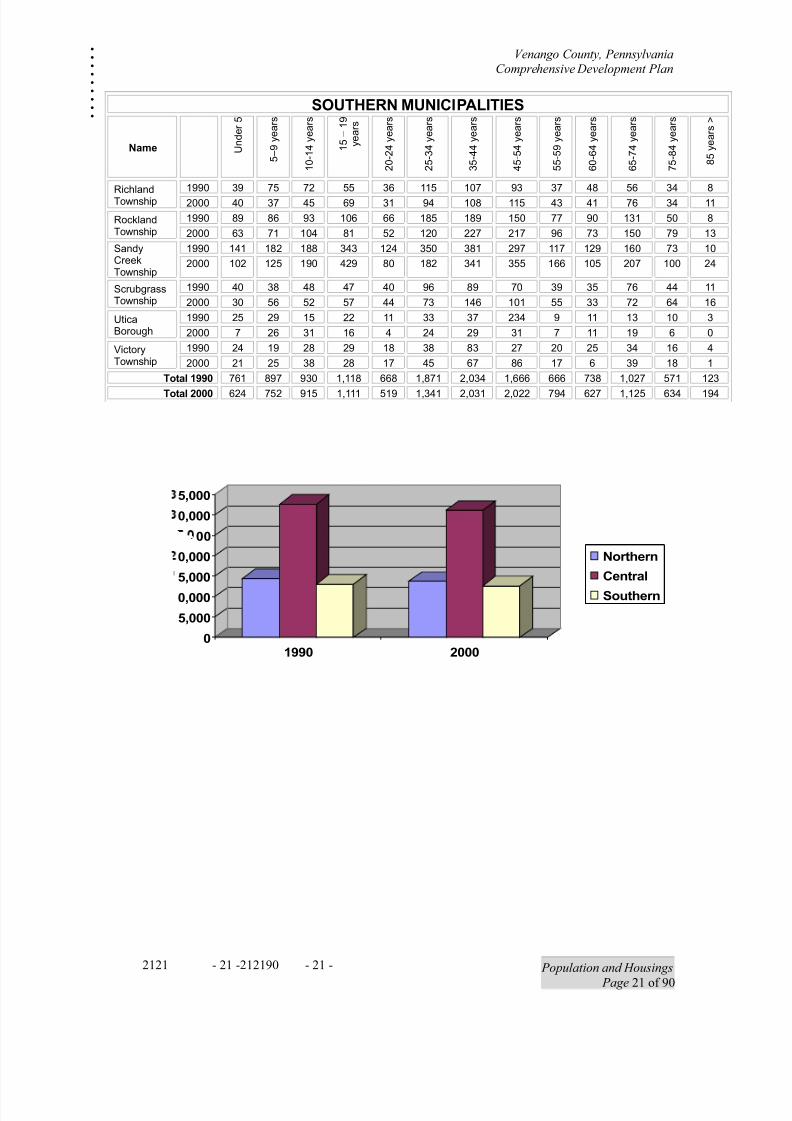
Total 1990 761 897 930 1,118 668 1,871 2,034 1,666 666 738 1,027 571 123
Total 2000 624 752 915 1,111 519 1,341 2,031 2,022 794 627 1,125 634 194
2121 - 21 -212190 - 21 - Population and Housings
Page 21 of 90
0
5,000
0,000
5,000
0,000
00
0,000
5,000
1990 2000
Northern
Central
Southern
Page 22
8/3/2019 Volume IV Population and Housing
http://slidepdf.com/reader/full/volume-iv-population-and-housing 22/90
.........
Venango County, PennsylvaniaComprehensive Development Plan
TABLE 3-7AGE COHORTS 1900-2000
BY PERCENT
Name
U n d e r
5
5 – 9
y e a
r s
1 0 - 1 4
y e
a r s
1 5 – 1 9 y e
a r s
2 0 - 2 4
y e
a r s
2 5 - 3 4
y e
a r s
3 5 - 4 4
y e
a r s
4 5 - 5 4
y e
a r s
5 5 - 5 9
y e
a r s
6 0 - 6 4
y e
a r s
6 5 - 7 4
y e
a r s
7 5 - 8 4
y e
a r s
8 5
y e a r s >
VenangoCounty
1990 6.7 7.5 7.6 7.3 5.5 15.3 15.4 10.8 5.2 5.8 9.1 4.9 1.4
2000 5.7 6.5 7.3 7.3 4.7 11.0 15.6 14.9 5.4 4.8 9.2 5.8 1.9
NORTHERN PLANNING UNIT
Name
U n d e r 5
5 – 9
y e a r s
1 0 - 1 4
y e a r s
1 5 – 1 9
y e a r s
2 0 - 2 4
y e a r s
2 5 - 3 4
y e a r s
3 5 - 4 4
y e a r s
4 5 - 5 4
y e a r s
5 5 - 5 9
y e a r s
6 0 - 6 4
y e a r s
6 5 - 7 4
y e a r s
7 5 - 8 4
y e a r s
8 5
y e a r s >
AlleghenyTownship
1990 8.5 6.0 6.0 5.3 7.5 14.5 10.7 14.2 6.4 7.8 7.8 3.9 1.1
2000 5.0 3.6 8.2 7.8 3.2 12.8 17.1 13.5 6.8 5.0 13.2 2.8 1.1
CanalTownship
1990 6.4 6.5 7.8 8.4 5.6 13.4 16.0 14.0 6.3 4.1 6.7 3.8 1.0
2000 5.4 6.4 8.1 6.8 4.4 12.1 16.6 16.6 5.1 6.0 7.6 4.0 1.0
Cherry TreeTownship
1990 6.9 7.5 8.0 7.6 5.9 15.6 15.3 11.3 4.7 6.6 7.2 2.5 0.7
2000 6.2 6.6 7.5 6.4 3.8 11.3 16.2 14.8 6.9 5.0 9.9 4.5 0.9
CooperstownBorough
1990 6.1 6.9 10.7 7.9 3.0 13.2 18.6 12.6 4.5 6.3 6.2 2.8 1.2
2000 3.0 7.2 7.4 6.7 4.6 9.3 15.7 16.5 6.3 8.3 10.0 1.3 0.7
Cornplanter Township
1990 6.8 7.6 7.4 6.1 4.5 13.9 14.2 11.4 5.8 5.3 8.6 5.8 2.5
2000 5.8 6.7 7.1 6.6 2.9 9.5 15.8 14.4 5.7 5.5 10.4 7.2 2.4
JacksonTownship
1990 8.4 10.1 10.8 7.3 4.4 18.4 16.9 7.9 2.8 4.7 6.1 1.9 0.2
2000 8.0 8.0 8.2 7.0 6.3 11.4 17.4 14.2 4.5 4.8 6.3 3.6 0.3
OaklandTownship
1990 7.1 9.2 10.2 7.3 4.5 14.5 19.2 9.9 4.1 4.5 5.7 2.9 1.1
2000 5.2 6.5 8.0 7.4 4.7 9.6 17.1 18.7 4.9 5.2 8.4 3.5 0.8
Oil CreekTownship
1990 6.7 7.3 7.9 6.8 4.6 14.2 17.6 12.6 5.4 4.9 8.6 2.8 0.5
2000 4.4 6.4 6.9 6.7 3.7 9.8 16.7 18.3 5.8 7.4 8.6 4.4 1.0
Pine GroveTownship
1990 6.7 7.1 6.7 8.4 5.4 14.5 15.9 11.1 5.2 5.9 7.7 4.2 1.1
2000 5.5 6.9 7.9 6.0 3.2 12.6 16.4 15.1 5.9 5.3 9.1 4.4 1.7
PleasantvilleBorough
1990 7.5 8.5 9.4 7.5 5.0 15.7 15.6 9.8 4.1 4.7 7.2 4.4 0.6
2000 4.2 6.6 8.4 7.5 4.8 10.2 15.3 14.5 4.1 5.1 11.8 6.5 1.1
PlumTownship
1990 6.7 7.6 7.7 7.8 5.6 14.8 16.3 12.9 4.5 5.5 7.4 3.1 0.1
2000 5.0 7.5 8.7 6.8 3.3 12.5 16.4 14.7 5.4 5.5 8.8 4.4 0.9
PresidentTownship
1990 5.0 5.4 7.2 6.6 4.0 14.4 16.0 10.0 6.4 6.6 13.0 4.6 1.0
2000 3.9 4.1 7.2 6.8 4.4 6.6 15.8 15.1 6.4 6.3 15.7 6.8 0.9
RousevilleBorough
1990 6.9 7.5 4.5 8.4 6.3 13.8 12.8 9.3 8.4 5.8 9.9 4.3 2.1
2000 5.1 8.3 4.2 5.3 3.8 12.7 12.1 13.8 4.9 4.4 14.2 8.5 2.8
2222 - 22 -222290 - 22 - Population and Housings
Page 22 of 90
Page 23
8/3/2019 Volume IV Population and Housing
http://slidepdf.com/reader/full/volume-iv-population-and-housing 23/90
.........
Venango County, PennsylvaniaComprehensive Development Plan
CENTRAL PLANNING UNIT
Name U n d e r 5
5 – 9
y e a r s
1 0 - 1 4
y e a r s
1 5 – 1 9
y e a r s
2 0 - 2 4
y e a r s
2 5 - 3 4
y e a r s
3 5 - 4 4
y e a r s
4 5 - 5 4
y e a r s
5 5 - 5 9
y e a r s
6 0 - 6 4
y e a r s
6 5 - 7 4
y e a r s
7 5 - 8 4
y e a r s
8 5
y e a r s >
City of Franklin
1990 6.7 7.4 6.9 6.8 6.1 14.7 14.9 9.5 4.5 5.0 10.2 5.6 1.8
2000 6.3 6.4 6.8 7.1 5.9 11.6 14.3 13.7 4.8 4.6 8.8 7.0 2.7
City of OilCity
1990 7.0 7.0 7.2 6.1 6.0 15.4 14.2 8.9 4.4 5.9 9.9 5.9 2.1
2000 6.4 7.3 7.7 7.0 5.5 12.2 15.0 13.7 4.5 3.5 8.4 6.7 2.4
CranberryTownship
1990 6.9 7.5 7.8 6.5 4.7 15.6 15.2 10.4 5.3 6.0 9.2 4.1 0.9
2000 5.9 6.2 7.6 7.0 4.8 10.2 16.1 15.4 5.7 4.7 9.4 5.4 1.4
SugarcreekBorough
1990 5.9 7.1 6.9 6.4 5.0 14.5 13.8 11.8 6.3 5.8 9.2 5.3 2.2
2000 5.4 5.8 6.5 6.3 4.6 10.7 15.8 14.0 5.7 6.1 10.3 6.1 2.5
SOUTHERN MUNICIPALITIES
Name U
n d e r 5
5 –
9
y e a r s
1 0 - 1
4
y e a r s
1 5
–
1 9
y e a r s
2 0 - 2
4
y e a r s
2 5 - 3
4
y e a r s
3 5 - 4
4
y e a r s
4 5 - 5
4
y e a r s
5 5 - 5
9
y e a r s
6 0 - 6
4
y e a r s
6 5 - 7
4
y e a r s
7 5 - 8
4
y e a r s
8 5
y e a r s >
BarkeyvilleBorough
1990 5.1 5.5 8.4 8.0 5.1 16.0 16.8 7.6 7.7 6.9 9.5 2.5 0.7
2000 6.8 6.8 5.5 3.4 4.6 13.5 16.9 18.6 3.8 2.5 10.1 7.2 0.4
ClintonTownship
1990 9.0 7.5 9.0 7.9 5.0 15.9 11.9 10.8 4.6 5.5 7.3 4.9 0.7
2000 5.3 6.9 9.2 7.5 4.7 12.3 15.0 13.9 7.3 4.6 8.6 3.8 0.9
ClintonvilleBorough
1990 9.0 8.7 6.5 6.2 6.2 15.8 12.0 9.4 3.8 3.8 9.6 7.7 1.3
2000 7.4 6.1 7.2 8.5 6.4 14.2 13.3 11.7 4.9 4.7 6.3 7.0 2.3
EmlentonBorough
1990 5.1 8.1 6.1 6.2 5.7 12.1 13.3 9.8 4.4 5.9 9.3 10.1 3.8
2000 4.9 6.5 6.6 7.5 4.8 10.7 12.5 12.4 5.9 4.4 8.5 7.9 7.4
FrenchCreekTownship
1990 6.5 7.6 7.5 7.6 5.2 15.9 16.7 11.2 4.7 5.5 7.1 3.5 0.9
2000 4.0 6.7 8.3 7.1 3.1 9.2 18.5 17.3 6.2 6.2 8.0 4.2 1.2
IrwinTownship
1990 6.1 7.8 8.4 9.5 7.1 15.0 15.4 8.8 4.9 6.4 6.7 3.3 0.62000 7.7 6.9 7.1 6.6 6.1 12.8 16.6 15.9 4.6 4.4 7.2 3.2 1.1
MineralTownship
1990 4.9 5.3 7.8 11.3 3.9 15.4 19.5 13.3 6.8 4.7 6.6 2.6 0.8
2000 6.9 5.6 4.7 5.3 3.4 12.4 18.4 17.6 6.2 5.6 9.9 3.0 0.9
PolkBorough
1990 2.2 3.1 3.8 4.3 4.1 15.0 22.2 16.2 6.6 6.2 10.2 5.4 0.6
2000 2.5 3.3 3.1 3.4 2.5 13.6 17.5 22.3 7.9 6.9 9.6 6.2 1.3
RichlandTownship
1990 5.0 9.7 9.3 7.1 4.6 14.8 13.8 12.0 4.8 6.2 7.2 4.4 1.0
2000 5.4 5.0 6.0 9.3 4.2 12.6 14.5 15.5 5.8 5.5 10.2 4.6 1.5
RocklandTownship
1990 6.7 6.5 7.0 8.0 5.0 14.0 14.3 11.3 5.8 6.8 9.9 3.8 0.6
2000 4.7 5.3 7.7 6.0 3.9 8.9 16.9 16.1 7.1 5.4 11.1 5.9 1.0
SandyCreekTownship
1990 5.7 7.3 7.5 13.7 5.0 14.1 15.3 11.9 4.7 5.2 6.4 2.9 0.4
2000 4.2 5.2 7.9 17.8 3.3 7.6 14.2 14.8 6.9 4.4 8.6 4.2 1.0
ScrubgrassTownship
1990 5.9 5.6 7.1 7.0 5.9 14.3 13.2 10.4 5.8 5.2 11.3 6.5 1.6
2000 3.8 7.0 6.5 7.1 5.5 9.1 18.3 12.6 6.9 4.1 9.0 8.0 2.0
UticaBorough
1990 10.3 12.0 6.2 9.1 4.5 13.6 15.3 9.9 3.7 4.5 5.4 4.2 1.2
2000 3.3 12.3 14.7 7.6 1.9 11.4 13.7 14.7 3.3 5.2 9.0 2.8 0
VictoryTownship
1990 6.6 5.2 7.7 7.9 4.9 10.4 22.8 7.4 5.5 6.8 9.3 4.4 1.1
2000 5.1 6.1 9.3 6.9 4.2 11.0 16.4 21.1 4.2 1.5 9.6 4.4 0.2
2323 - 23 -232390 - 23 - Population and Housings
Page 23 of 90
Page 24
8/3/2019 Volume IV Population and Housing
http://slidepdf.com/reader/full/volume-iv-population-and-housing 24/90
Venango County, PennsylvaniaComprehensive Development Plan
February 2004
Middle Age
The population in Venango County is aging, but not significantly more than
Pennsylvania. Since 1990 the County has lost 1,936 females and 1,694 males between
the ages of 20 and 39. The total male and female population losses in those categories
represent 3,630 persons, or 6.1% of the 1990 total population. Meanwhile, between the
ages of 40 to 59 the County gained 1,722 males and 1,390 females – a total gain of
3,112.
Elderly
Furthermore, the elderly population
has increased significantly. The elderly aredefined as being 75 years or older at the
time of the 2000 Census. Since 1990 the
County has experienced a gain of 554 males
that were 70 years or older and 523 females,
half of which were elderly. The total
population in the County that were 70 years or older represented 12.2% of the total
population. Comparatively, Pennsylvania’s persons 65 years or older represented a
slightly lower 11.7% of the total statewide population in 2000.
Children
In 2000, 13,947, or 24.2% of Venango residents were under the age of 18. In
comparison, 23.5% of Pennsylvanians were under the age of 18. Considering the
losses of persons 20 to 39 it is not surprising that the number of children under the age
of 10 has decreased with 1,243 less since 1990. The number of children under 10
represented 12.2% of the total County population in 2000. In Pennsylvania the same
age category represented 12.6%.
The graphic on the next page depicts the age pyramid for the County from 1990
to 2000.
Population and Housing
Page 24 of 90
Under 18 19-64 65 +Pennsylvania 23.8 60.6 15.6
Venango County 24.2 59.0 16.8ArmstrongCounty
22.9 59.1 18.0
Butler County 24.6 61.1 14.3Clarion County 21.6 63.2 15.2Crawford County 24.7 59.7 15.6Erie County 25.0 60.7 14.3Forest County 22.7 57.4 19.9Mercer County 23.4 58.5 18.1Warren County 24.1 59.2 16.7
Page 25
8/3/2019 Volume IV Population and Housing
http://slidepdf.com/reader/full/volume-iv-population-and-housing 25/90
Figure 7Source: 1990-2000 US Census
Venango County, PennsylvaniaComprehensive Development Plan
February 2004
Population and Housing
Page 25 of 90
Page 26
8/3/2019 Volume IV Population and Housing
http://slidepdf.com/reader/full/volume-iv-population-and-housing 26/90
Venango County, PennsylvaniaComprehensive Development Plan
February 2004
Racial Composition
In 2000 97.6% of the County’s
residents considered themselves to
be white and 1.1% black. The racialdiversity has varied little since 1990.
The racial composition in
Pennsylvania is higher with 14.6%
considering themselves a race other
than white.
URBAN AND RURAL POPULATIONS
For Census 2000, the Census Bureau classifies as "urban" all territory,
population, and housing units located within an urbanized area (UA) or an urban cluster
(UC). It delineates UA and UC boundaries to encompass densely settled territory, which
consists of:
o core census block groups or blocks that have a population density of at least1,000 people per square mile and
o surrounding census blocks that have an overall density of at least 500people per square mile.
In addition, under certain conditions, less densely settled territory may be part of
each UA or UC. The Census Bureau's classification of "rural" consists of all territory,
population, and housing units located outside of UAs and UCs. The rural component
contains both place and non-place territory. Geographic entities, such as census tracts,
counties, metropolitan areas, and the territory outside metropolitan areas, often are
"split" between urban and rural territory, and the population and housing units they
contain often are partly classified as urban and partly classified as rural.
Population and Housing
Page 26 of 90
White
Black Asian Hispanic
Pennsylvania 85.4 10.0 1.8 3.2Venango County 97.6 1.1 0.2 0.5ArmstrongCounty
98.3 0.8 0.1 0.4
Butler County 97.8 0.8 0.1 0.6Clarion County 98.2 0.8 0.3 0.4Crawford County 97.0 1.6 0.3 0.6Erie County 90.6 6.1 0.7 2.2Forest County 95.9 2.2 0.1 1.2Mercer County 93.1 5.3 0.4 0.7Warren County 98.7 0.2 0.3 0.3
Page 27
8/3/2019 Volume IV Population and Housing
http://slidepdf.com/reader/full/volume-iv-population-and-housing 27/90
Educational
Attainment 2000
< 9th
Grade
High
School
Grad
Bach
Degree
or >
Pennsylvania 5.5 81.9 22.4
Venango County 6.3 81.0 13.1
Armstrong County 7.2 80.0 10.4
Butler County 4.0 86.8 23.5
Clarion County 6.3 81.8 15.3
Crawford County 6.0 81.6 14.7
Erie County 8.5 76.0 11.5
Forest County 7.1 78.9 14.8
Mercer County 4.9 82.9 17.3
Warren County 4.6 84.8 14.2
Venango County, PennsylvaniaComprehensive Development Plan
February 2004
Venango County
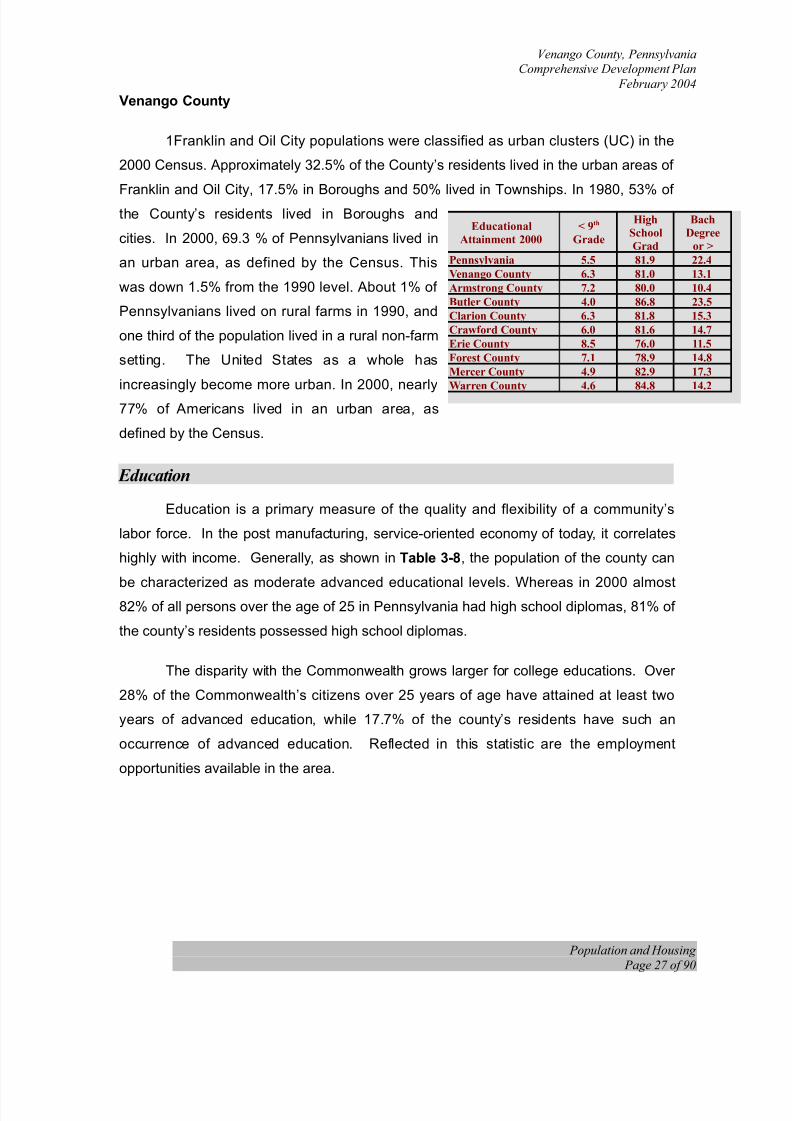
1Franklin and Oil City populations were classified as urban clusters (UC) in the
2000 Census. Approximately 32.5% of the County’s residents lived in the urban areas of
Franklin and Oil City, 17.5% in Boroughs and 50% lived in Townships. In 1980, 53% of the County’s residents lived in Boroughs and
cities. In 2000, 69.3 % of Pennsylvanians lived in
an urban area, as defined by the Census. This
was down 1.5% from the 1990 level. About 1% of
Pennsylvanians lived on rural farms in 1990, and
one third of the population lived in a rural non-farm
setting. The United States as a whole has
increasingly become more urban. In 2000, nearly
77% of Americans lived in an urban area, as
defined by the Census.
Education
Education is a primary measure of the quality and flexibility of a community’s
labor force. In the post manufacturing, service-oriented economy of today, it correlates
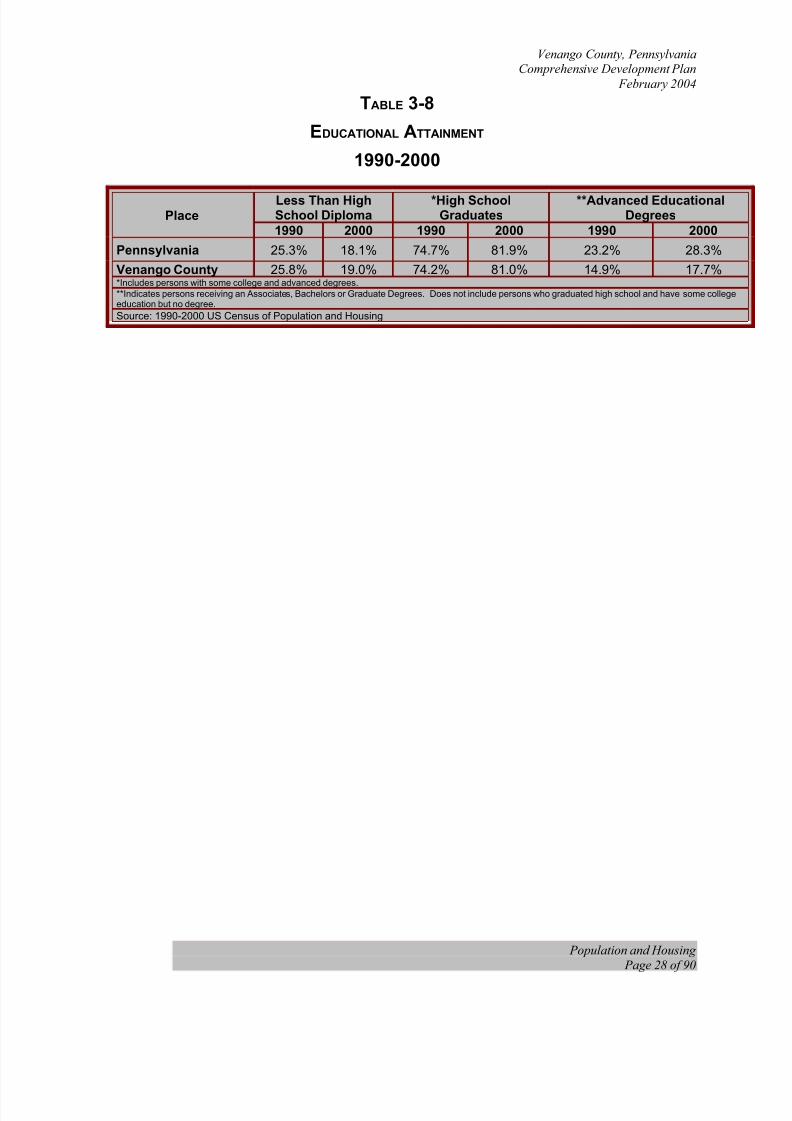
highly with income. Generally, as shown in Table 3-8, the population of the county can
be characterized as moderate advanced educational levels. Whereas in 2000 almost82% of all persons over the age of 25 in Pennsylvania had high school diplomas, 81% of
the county’s residents possessed high school diplomas.
The disparity with the Commonwealth grows larger for college educations. Over
28% of the Commonwealth’s citizens over 25 years of age have attained at least two
years of advanced education, while 17.7% of the county’s residents have such an
occurrence of advanced education. Reflected in this statistic are the employment
opportunities available in the area.
Population and Housing
Page 27 of 90
Page 28
8/3/2019 Volume IV Population and Housing
http://slidepdf.com/reader/full/volume-iv-population-and-housing 28/90
Venango County, PennsylvaniaComprehensive Development Plan
February 2004
TABLE 3-8
EDUCATIONAL ATTAINMENT
1990-2000
PlaceLess Than HighSchool Diploma
*High SchoolGraduates
**Advanced EducationalDegrees
1990 2000 1990 2000 1990 2000
Pennsylvania 25.3% 18.1% 74.7% 81.9% 23.2% 28.3%
Venango County 25.8% 19.0% 74.2% 81.0% 14.9% 17.7%*Includes persons with some college and advanced degrees.**Indicates persons receiving an Associates, Bachelors or Graduate Degrees. Does not include persons who graduated high school and have some collegeeducation but no degree.
Source: 1990-2000 US Census of Population and Housing
Population and Housing
Page 28 of 90
Page 29
8/3/2019 Volume IV Population and Housing
http://slidepdf.com/reader/full/volume-iv-population-and-housing 29/90
Venango County, PennsylvaniaComprehensive Development Plan
February 2004
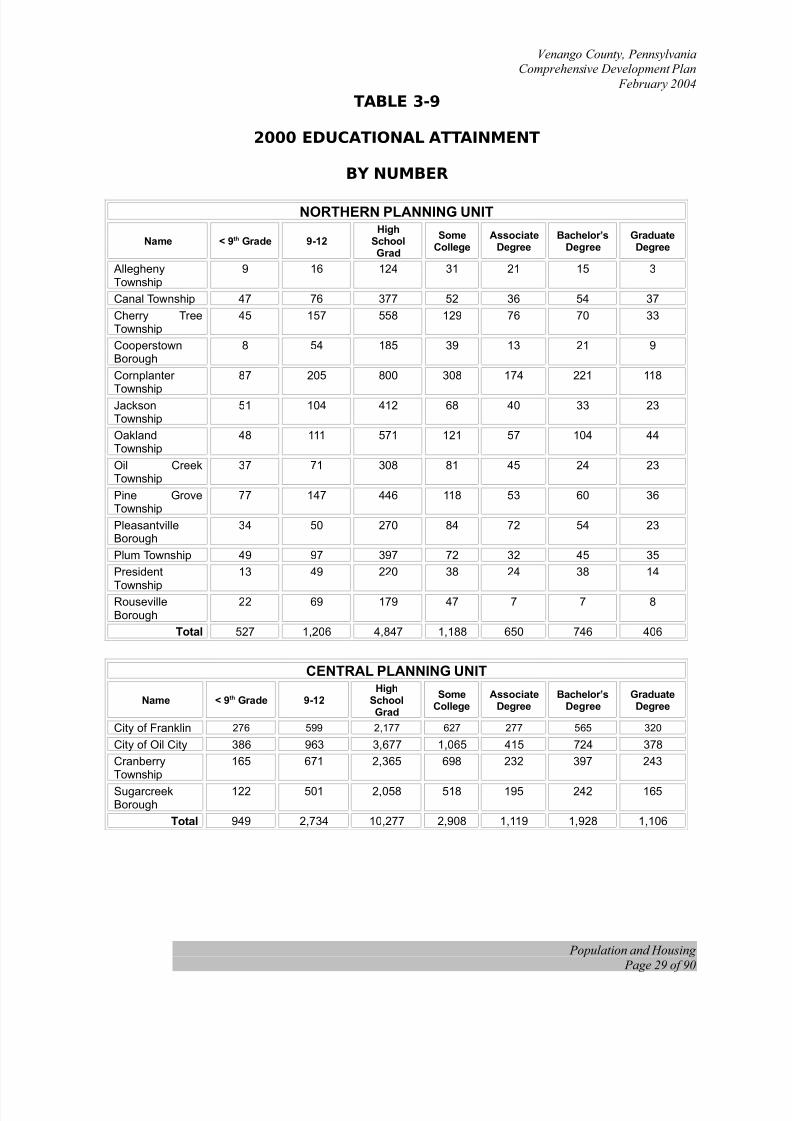
TABLE 3-9
2000 EDUCATIONAL ATTAINMENT
BY NUMBER
NORTHERN PLANNING UNIT
Name < 9th Grade 9-12High
SchoolGrad
SomeCollege
AssociateDegree
Bachelor’sDegree
GraduateDegree
AlleghenyTownship
9 16 124 31 21 15 3
Canal Township 47 76 377 52 36 54 37
Cherry TreeTownship
45 157 558 129 76 70 33
CooperstownBorough
8 54 185 39 13 21 9
Cornplanter
Township
87 205 800 308 174 221 118
JacksonTownship
51 104 412 68 40 33 23
OaklandTownship
48 111 571 121 57 104 44
Oil CreekTownship
37 71 308 81 45 24 23
Pine GroveTownship
77 147 446 118 53 60 36
PleasantvilleBorough
34 50 270 84 72 54 23
Plum Township 49 97 397 72 32 45 35
President
Township
13 49 220 38 24 38 14
RousevilleBorough
22 69 179 47 7 7 8
Total 527 1,206 4,847 1,188 650 746 406
CENTRAL PLANNING UNIT
Name < 9th Grade 9-12High
SchoolGrad
SomeCollege
AssociateDegree
Bachelor’sDegree
GraduateDegree
City of Franklin 276 599 2,177 627 277 565 320
City of Oil City 386 963 3,677 1,065 415 724 378
CranberryTownship
165 671 2,365 698 232 397 243
SugarcreekBorough
122 501 2,058 518 195 242 165
Total 949 2,734 10,277 2,908 1,119 1,928 1,106
Population and Housing
Page 29 of 90
Page 30
8/3/2019 Volume IV Population and Housing
http://slidepdf.com/reader/full/volume-iv-population-and-housing 30/90
Venango County, PennsylvaniaComprehensive Development Plan
February 2004
SOUTHERN PLANNING UNIT
Name < 9th Grade 9-12High
SchoolGrad
SomeCollege
AssociateDegree
Bachelor’sDegree
GraduateDegree
BarkeyvilleBorough
23 27 86 31 8 4 7
Clinton Township 53 67 287 30 34 15 14
ClintonvilleBorough
38 45 185 28 6 27 10
EmlentonBorough
27 47 284 64 27 52 52
French Creek
Township
41 151 596 158 64 115 49
Irwin Township 63 176 412 83 37 62 24
MineralTownship
37 53 208 42 14 18 14
Polk Borough 553 58 159 43 18 18 19
RichlandTownship
35 69 288 42 30 46 29
RocklandTownship
59 124 543 107 43 60 21
Sandy CreekTownship
27 107 780 220 123 118 96
ScrubgrassTownship
43 65 297 73 21 28 17
Utica Borough 1 16 73 8 7 5 6Victory Township 9 45 149 43 12 23 4
Total 1,009 1,050 4,347 972 444 591 362
Source: US Census of Population and Housing
TABLE 3-10
2000 EDUCATIONAL ATTAINMENT
BY PERCENT
NORTHERN PLANNING UNITName < 9th Grade 9-12 High Some Associate Bachelor’s Graduate
Population and Housing
Page 30 of 90
Page 31
8/3/2019 Volume IV Population and Housing
http://slidepdf.com/reader/full/volume-iv-population-and-housing 31/90
Venango County, PennsylvaniaComprehensive Development Plan
February 2004
SchoolGrad
College Degree Degree Degree
AlleghenyTownship
4.1 7.3 56.6 14.2 9.6 6.8 1.4
Canal Township 6.9 11.2 55.5 7.7 5.3 8.0 5.4
Cherry TreeTownship
4.2 14.7 52.2 12.1 7.1 6.6 3.1
CooperstownBorough
2.4 16.4 56.2 11.9 4.0 6.4 2.7
Cornplanter Township
4.5 10.7 41.8 16.1 9.1 11.6 6.2
JacksonTownship
7.0 14.2 56.4 9.3 5.5 4.5 3.1
OaklandTownship
4.5 10.5 54.1 11.5 5.4 9.8 4.2
Oil CreekTownship
6.3 12.1 52.3 13.8 7.6 4.1 3.9
Pine GroveTownship
8.2 15.7 47.6 12.6 5.7 6.4 3.8
PleasantvilleBorough
5.8 8.5 46.0 14.3 12.3 9.2 3.9
Plum Township 6.7 13.3 54.6 919 4.4 6.2 4.8
PresidentTownship
3.3 12.4 55.6 9.6 6.1 9.6 3.5
RousevilleBorough
6.5 20.4 52.8 13.9 2.1 2.1 2.4
CENTRAL PLANNING UNIT
< 9th Grade 9-12 HighSchoolGrad
SomeCollege
AssociateDegree
Bachelor’sDegree
GraduateDegree
Name
City of Franklin 5.7 12.4 45.0 13.0 5.7 11.7 6.6
City of Oil City 5.1 12.7 48.3 14.0 5.5 9.5 5.0
CranberryTownship
3.5 14.1 49.6 14.6 4.9 8.3 5.1
SugarcreekBorough
3.2 13.2 54.1 13.6 5.1 6.4 4.3
SOUTHERN PLANNING UNIT
< 9th Grade 9-12High
SchoolGrad
SomeCollege
AssociateDegree
Bachelor’sDegree
GraduateDegree
Name
BarkeyvilleBorough
12.4 14.5 46.2 16.7 4.3 2.2 3.8
Clinton Township 10.6 13.4 57.4 6.0 6.8 3.0 2.8
Clintonville 11.2 13.3 54.6 8.3 1.8 8.0 2.9
Population and Housing
Page 31 of 90
Page 32
8/3/2019 Volume IV Population and Housing
http://slidepdf.com/reader/full/volume-iv-population-and-housing 32/90
Venango County, PennsylvaniaComprehensive Development Plan
February 2004
Borough
EmlentonBorough
4.9 8.5 51.4 11.6 4.9 9.4 9.4
French CreekTownship
3.5 12.9 50.8 13.5 5.5 9.8 4.2
Irwin Township 7.4 20.5 48.1 9.7 4.3 7.2 2.8
MineralTownship
9.6 13.7 53.9 10.9 3.6 4.7 3.6
Polk Borough 63.7 6.7 18.3 5.0 2.1 2.1 2.2
RichlandTownship
6.5 12.8 53.4 7.8 5.6 8.5 5.4
RocklandTownship
6.2 13.0 56.7 11.2 4.5 6.3 2.2
Sandy CreekTownship
1.8 7.3 53.0 15.0 8.4 8.0 6.5
ScrubgrassTownship
7.9 11.9 54.6 13.4 3.9 5.1 3.1
Utica Borough 0.9 13.8 62.9 6.9 6.0 4.3 5.2
Victory Township 3.2 15.8 52.3 15.1 4.2 8.1 1.4
Source: US Census of Population and Housing
Income and Poverty
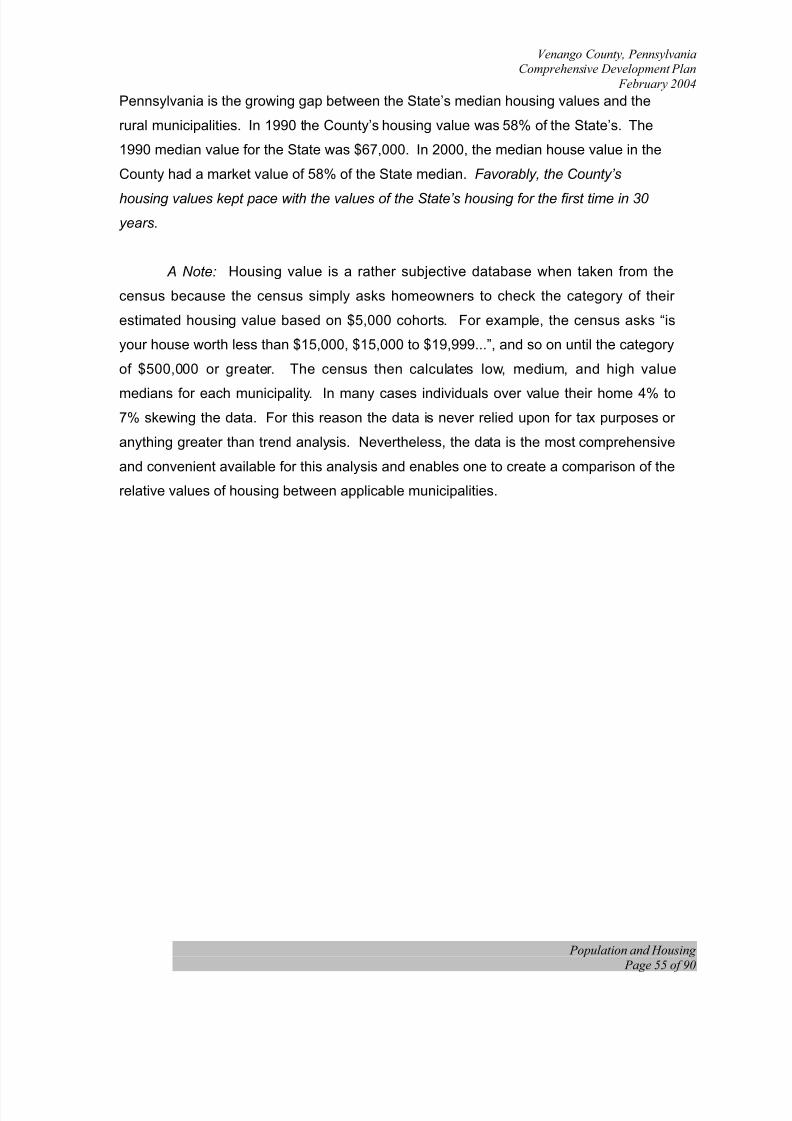
Income levels in Venango County since 1990 have increased quite favorably
outpacing income growth in Pennsylvania. Since 1990 median family incomes
increased 42.8%, while Pennsylvania’s grew at 38%. Significant growth income levels
included a 100% growth in families earning $50-75,000 annually and tremendous
increases in those earning $75,000 or more. Although the number of families makingless than $10,000 annually decreased by 7% since 1990, nearly 12% of the population
still falls into this poverty challenged income area.
Population and Housing
Page 32 of 90
Page 33
8/3/2019 Volume IV Population and Housing
http://slidepdf.com/reader/full/volume-iv-population-and-housing 33/90
Venango County, PennsylvaniaComprehensive Development Plan
February 2004
TABLE 3-11
HOUSEHOLDS BY INCOME GROUP, 1990-2000
1990 2000 1990 2000
Household Incomein 1999:
PA Households Venango County
No. % No. % No. % No. %
Total Households 4,492,958 100.0 4,779,186 100.0 22,496 100.0 22,788 100.0
Less than $10,000 244,825 5.1 465,860 9.7 4180 18.6 2,652 11.6
$10,000 to $14,999 452,700 10.1 333,381 7.0 2718 12.1 2,011 8.8
$15,000 to $24,999 415,303 9.2 657,266 13.8 5437 24.2 4,074 17.9
$25,000 to $34,999 412,315 9.2 633,953 13.3 3994 17.8 3,485 15.3
$35,000 to $49,999 406,603 9.1 809,165 16.9 3520 15.6 4,176 18.3
$50,000 to $74,999 744,694 16.6 929,863 19.5 2061 9.2 4,013 17.6
$75,000 to $99,999 828,196 18.4 457,480 9.6 352 1.6 1351 5.9
$100,000 plus 988,322 22.0 492,218 10.3 284 1.3 1,026 4.5
Source: 1990-2000 US Census of Population and Housing
TABLE 3-12
HOUSEHOLD BY INCOME GROUP - 2000
BY PLANNING UNIT, NUMBER AND PERCENTAGE OF TOTAL
NORTHERN PLANNING UNIT
Name<
10,00010-
14,99915-
24,99925-
34,99935-
49,99950-
74,99975-
99,999100,000
+
AlleghenyTownship
12 0 8 27 32 18 8 5
10.9 5.0 17.7 16.6 19.5 20.8 7.1 5.0
Canal Township31 19 67 63 74 79 27 19
8.7 4.9 20.1 14.6 20.8 20.1 5.2 5.6
Cherry TreeTownship
52 29 120 87 124 120 31 34
8.7 4.9 20.1 14.6 20.8 20.1 5.2 5.6
CooperstownBorough
12 11 30 27 49 68 9 8
6.5 6.0 16.3 14.7 26.6 20.7 4.9 4.2
Cornplanter Township
84 82 143 194 155 241 86 50
8.1 7.9 13.8 18.7 15.0 23.3 8.3 4.9
Jackson Township 51 39 53 73 101 77 18 1112.1 9.2 12.5 17.3 23.9 18.2 4.3 2.6
Oakland Township22 27 124 74 115 153 33 27
3.8 4.7 21.6 12.9 20.0 26.6 5.7 4.7
Oil CreekTownship
23 37 57 52 58 71 16 14
7.0 11.3 17.4 15.9 17.7 21.6 4.9 4.2
Pine Grove 44 39 91 66 103 114 31 19
Population and Housing
Page 33 of 90
Page 34
8/3/2019 Volume IV Population and Housing
http://slidepdf.com/reader/full/volume-iv-population-and-housing 34/90
Venango County, PennsylvaniaComprehensive Development Plan
February 2004
NORTHERN PLANNING UNIT
Name<
10,00010-
14,99915-
24,99925-
34,99935-
49,99950-
74,99975-
99,999100,000
+
Township 8.7 7.7 17.9 13.0 20.3 22.5 6.1 3.8
Pleasantville
Borough
36 31 71 48 71 65 13 10
10.4 9.0 20.6 13.9 20.6 18.8 3.8 2.9
Plum Township27 28 54 71 92 82 20 8
7.1 7.3 14.1 18.6 24.1 21.5 5.2 2.0
PresidentTownship
28 17 71 55 25 38 9 4
11.3 6.9 28.7 22.3 10.1 15.4 3.6 1.6
RousevilleBorough
36 15 53 23 34 22 6 4
18.7 7.8 27.5 22.3 10.1 15.4 3.6 1.6
Total # 458 374 942 860 1,033 1,148 307 213
CENTRAL PLANNING UNIT
Name < 10,00010-
14,99915-
24,99925-
34,99935-
49,99950-
74,99975-
99,999100,000
+
City of Franklin
511 336 592 368 453 415 190 183
16.8 11.0 19.4 12.1 14.9 13.6 6.2 6.0
City of OilCity
772 539 881 692 825 718 192 164
16.1 11.3 18.4 14.5 17.2 15.0 4.0 3.4
CranberryTownship
334 265 393 441 599 500 178 135
11.7 9.3 13.8 15.5 21.1 17.6 6.3 4.7
SugarcreekBorough
190 143 450 378 356 367 142 77
9.0 6.8 21.4 18.0 16.9 17.5 6.8 3.6
Total # 1,807 1,283 2,316 1,879 2,233 2,000 702 559
SOUTHERN PLANNING UNIT
Name<
10,00010-
14,99915-
24,99925-
34,99935-
49,99950-
74,99975-
99,999100,000
+
BarkeyvilleBorough
2 2 18 14 25 23 4 4
2.2 2.2 19.6 15.2 27.2 25.0 4.3 4.3
Clinton Township21 23 49 33 67 53 12 11
7.8 8.6 18.2 12.3 24.9 19.7 4.5 4.1
ClintonvilleBorough
42 32 47 32 19 35 9 9
18.7 14.2 20.9 14.2 8.4 15.6 4.0 4.0
EmlentonBorough
40 41 55 51 50 51 18 20
12.3 12.6 16.9 15.6 15.3 15.6 5.5 6.1
French CreekTownship
47 46 104 109 119 160 50 34
7.0 6.9 15.5 16.3 17.8 23.9 7.5 5.0
Irwin Township45 45 74 87 90 103 25 29
9.0 9.0 14.9 17.5 18.1 20.7 5.0 5.8
Population and Housing
Page 34 of 90
Page 35
8/3/2019 Volume IV Population and Housing
http://slidepdf.com/reader/full/volume-iv-population-and-housing 35/90
Venango County, PennsylvaniaComprehensive Development Plan
February 2004
SOUTHERN PLANNING UNIT
Name<
10,00010-
14,99915-
24,99925-
34,99935-
49,99950-
74,99975-
99,999100,000
+
Mineral Township11 15 33 32 45 37 11 10
5.7 7.7 17.0 16.5 23.2 19.1 5.7 5.1
Polk Borough 6 10 55 27 41 23 15 133.2 5.3 28.9 14.2 21.6 12.1 7.9 6.9
RichlandTownship
29 18 55 51 53 44 24 17
10.0 6.2 18.9 17.5 18.2 15.1 8.2 5.9
RocklandTownship
46 45 112 127 114 71 36 17
8.1 7.9 19.7 22.4 20.1 12.5 6.3 3.0
Sandy CreekTownship
46 35 107 102 162 208 108 61
5.5 4.2 12.9 12.3 19.5 25.1 13.0 7.4
ScrubgrassTownship
29 23 50 47 72 54 19 19
9.3 7.3 16.0 15.0 23.0 17.3 6.1 6.1
Utica Borough8 10 30 5 15 7 2 2
10.1 12.7 38.0 6.3 19.0 8.9 2.5 2.5
Victory Township15 9 27 29 38 26 9 8
9.3 5.6 16.8 18.0 23.6 16.1 5.6 5.0
Total # 387 354 816 746 910 895 342 254
TABLE 3-13
MEDIAN AND PER CAPITA INCOME, 1980-2000
Median Household Income Per Capita Income
Name 1980 1990 20001990-2000% Change
1980 1990 2000
Pennsylvania $16,880 $29,069 $40,106 38.0 $7,075 $14,068 $20,880
Venango County $14,698 $22,593 $32,257 42.8 $6,056 $10,696 $16,252
Source: US Census Small Area Income and Poverty Estimates Program and Housing and Population Statistics
Population and Housing
Page 35 of 90
Page 36
8/3/2019 Volume IV Population and Housing
http://slidepdf.com/reader/full/volume-iv-population-and-housing 36/90
Venango County, PennsylvaniaComprehensive Development Plan
February 2004
$0 $10,000 $20,000 $30,000
1980
1990
2000
Per Capita Income 1980-2000
Pennsylvania
Venango
TABLE 3-14
INCOME GROUP – 2000MEDIAN HOUSEHOLD, MEDIAN FAMILY, PER CAPITA AND MEDIAN EARNINGS
BY PLANNING UNIT
CENTRAL PLANNING UNIT
Name Median Median Per Median Earnings
Population and Housing
Page 36 of 90
NORTHERN PLANNING UNIT
NameMedian
HouseholdMedianFamily
Per Capita
Median Earnings
Male Female
Allegheny Township 37,500 43,125 15,646 28,571 24,063
Canal Township 36,484 42,833 16,612 30,463 22,109
Cherry Tree Township 36,193 39,559 16,176 29,583 21,438
CooperstownBorough 37,143 41,875 16,314 34,375 20,455
Cornplanter Township 36,066 48,259 18,532 33,750 23,182
Jackson Township 34,338 37,202 13,644 30,357 19,559
Oakland Township 39,293 45,417 17,051 32,917 21,719
Oil Creek Township 34,107 41,442 16,166 31,094 22,188
Pine Grove Township 36,467 39,900 16,843 32,625 24,688
Pleasantville Borough 32,426 37,679 15,608 29,722 20,909
Plum Township 37,800 39,511 14,578 30,500 20,313
President Township 26,172 30,962 14,913 25,000 21,607
Rouseville Borough 22,917 30,341 13,286 29,250 18,125
Per Capita – 2000
Pennsylvania 20.880Venango County 16.252Armstrong County 15,709Butler County 27,430Clarion County 15,243Crawford County 16,870Forest County 14,341Mercer County 17,636Warren County 17,862
Page 37
8/3/2019 Volume IV Population and Housing
http://slidepdf.com/reader/full/volume-iv-population-and-housing 37/90
Venango County, PennsylvaniaComprehensive Development Plan
February 2004
Household Family Capita Male Female
City of Franklin 37,063 37,433 16,414 35,088 22,475
City of Oil City 29,060 36,149 14,696 30,072 19,697
Cranberry Township 34,547 40,063 16,361 31,573 24,750
Sugarcreek Borough 31,952 36,926 16,873 32,875 21,996
SOUTHERN PLANNING UNIT
Name MedianHousehold
MedianFamily Per Capita
Median Earnings
Male Female
Barkeyville Borough 41,500 42,500 16,161 33,750 20,682
Clinton Township 37,361 40,563 16,370 32,375 17,656
Clintonville Borough 22,083 29,135 15,488 23,667 16,932
Emlenton Borough 30,455 41,250 17,030 33,125 22,083
French Creek Township 38,813 46,771 17,620 35,000 21,852
Irwin Township 34,615 39,567 16,549 34,792 23,194Mineral Township 37,500 39,773 15,945 31,731 29,375
Polk Borough 33,929 38,438 12,963 22,273 31,875
Richland Township 33,661 39,688 16,940 27,500 20,972
Rockland Township 31,129 34,491 15,495 31,477 22,411
Sandy Creek Township 46,723 51,574 22,165 35,743 27,500
Scrubgrass Township 37,083 40,655 16,839 37,500 20,417
Utica Borough 22,875 23,929 11,435 29,063 19,250
Victory Township 35,096 42,589 15,156 34,375 19,643
MEDIAN EARNINGS
2000
Population and Housing
Page 37 of 90
010,00020,00030,00040,00050,000
P e n n s y l v a n i a
V e n a n g o C o u n t y
A r m s t r o n g C o u n t y
B u t l e r C o u n t y
C l a r i o n
C o u n t y
C r a w f o r d C o u n t y
E r i e C o u n t y
F o r e s t C o u n t y
M e r c e r C o u n t y
W a r r e n C o u n t y
Male
Female
Page 38
8/3/2019 Volume IV Population and Housing
http://slidepdf.com/reader/full/volume-iv-population-and-housing 38/90
Venango County, PennsylvaniaComprehensive Development Plan
February 2004
Poverty
Poverty levels for Venango County in 2000 were high compared to Pennsylvania.
Of particular concern were the poverty levels of women who are single parents with very
young children, nearly 70% of such households were considered below poverty.
Families in general with young children have significantly less income than Pennsylvania
families as a whole. Over one-third of families with young children were considered
below poverty. See Table 3-15 for more details.
Poverty statistics presented in census
publications were based on a definition
originated by the Social Security
Administration in 1964 and subsequently
modified by Federal interagency committees in
1969 and 1980 and prescribed by the Office of
Management and Budget in Directive 14 as
the standard to be used by Federal agencies for statistical purposes.
At the core of this definition was the 1961 economy food plan, the least costly of
four nutritionally adequate food plans designed by the Department of Agriculture. It was
determined that families of three or more persons spend approximately one-third of their
income on food; hence, the poverty level for these families was set at three times the
cost of the economy food plan. For smaller families and persons living alone, the cost of
the economy food plan was multiplied by factors that were slightly higher to compensate
for the relatively larger fixed expenses for these smaller households.
The total income of each family or unrelated individual in the sample was tested
against the appropriate poverty threshold to determine the poverty status of that family
or unrelated individual. If the total income was less than the corresponding cutoff, the
family or unrelated individual was classified as “below the poverty level.” The number of
persons in families with incomes below the poverty level and the number of unrelated
individuals with incomes below the poverty level.
Population and Housing
Page 38 of 90
Poverty LevelFamilies Individuals
Pennsylvania 7.8 11.0Venango County 10.4 13.4ArmstrongCounty
9.3 11.7
Butler County 6.1 9.1Clarion County 10.4 15.4
Crawford County 8.7 12.8Erie County 8.2 12.0Forest County 10.0 16.4Mercer County 8.8 11.5Warren County 6.8 9.9
Page 39
8/3/2019 Volume IV Population and Housing
http://slidepdf.com/reader/full/volume-iv-population-and-housing 39/90
Venango County, PennsylvaniaComprehensive Development Plan
February 2004
TABLE 3-15
POVERTY, 2000
Poverty CategoryPA Venango County
No. % No. %
Families 250,296 7.8 1,657 10.4
With related children under 18 years 188,366 12.1 1,279 17.3
With related children under 5 years 88,081 15.3 645 24.7
Families with female householder, nohusband present
134,560 24.9 782 34.4
With related children under 18 years 118,782 34.9 706 47.9
With related children under 5 years 55,163 47.4 355 70.2
Individuals 1,304,117 11.0 7,516 13.4
18 years and over 882,372 9.8 4,913 11.5
65 years and over 164,095 9.1 830 9.1
Related children under 18 years 408,079 14.3 2,545 19.2
Related children 5 to 17 years 291,913 13.6 1,665 16.5
Unrelated individuals 15 years and over 473,182 22.8 2,399 25.7Source: 2000 US Census of Population and Housing
TABLE 3-16
INCOME IN 1999 BELOW POVERTY LEVEL
NORTHERN PLANNING UNIT
INCOME IN 1999 BELOW POVERTY LEVEL% OF
FAMILIES
ALL AGES RELATED CHILDREN <18
65 YEARS AND OLDER
Allegheny Township 7.9 13.8 8.3 2.2
Canal Township 6.2 8.1 3.9 4.7
Cherry TreeTownship
7.5 9.4 10.5 6.6
CooperstownBorough
8.4 12.3 10.7 8.8
Cornplanter Township 10.1 14.2 7.4 7.5
Jackson Township 13.7 17.6 10.9 12.8
Oakland Township 3.3 2.1 1.0 1.7
Oil Creek Township 9.1 10.9 11.4 8.2
Pine Grove Township10.6 14.8 5.2 6.6Pleasantville Borough 11.4 18.0 10.4 7.5
Plum Township 8.2 11.3 5.9 6.6
President Township 13.9 29.1 2.5 13.0
Rouseville Borough 25.2 38.2 20.1 16.3
CENTRAL PLANNING UNIT
Population and Housing
Page 39 of 90
Page 40
8/3/2019 Volume IV Population and Housing
http://slidepdf.com/reader/full/volume-iv-population-and-housing 40/90
Venango County, PennsylvaniaComprehensive Development Plan
February 2004
INCOME IN 1999 BELOW POVERTY LEVEL% OF
FAMILIESALL AGES
RELATED CHILDREN <18
65 YEARS AND OLDER
City of Franklin 17.3 25.4 14.4 13.6
City of Oil City 19.0 28.3 12.4 16.2
Cranberry Township 11.8 16.2 6.1 10.6
SugarcreekBorough
10.8 20.1 0.9 8.8
SOUTHERN PLANNING UNIT
INCOME IN 1999 BELOW POVERTY LEVEL% OF
FAMILIESALL AGES
RELATED CHILDREN <18
65 YEARS AND OLDER
Barkeyville Borough 12.7 28.1 10.3 8.8
Clinton Township 11.2 14.7 3.2 8.1
Clintonville Borough 13.4 16.4 7.1 14.4
Emlenton Borough 14.6 17.5 11.4 9.9French CreekTownship
7.4 9.1 4.9 5.9
Irwin Township 10.0 13.0 6.4 7.5
Mineral Township 7.7 11.8 2.9 6.1
Polk Borough 35.0 1.7 42.5 3.1
Richland Township 11.9 19.0 7.8 8.7
Rockland Township 12.7 22.9 3.8 8.6
Sandy CreekTownship
5.0 6.0 3.8 3.9
Scrubgrass Township 14.3 29.2 48.1 7.7
Utica Borough 29.2 48.1 -- 30.4
Victory Township 9.0 4.0 11.9 5.2
Analysis by Planning Unit
The foregoing analysis of the demographic characteristics of Venango County
was completed at the County level. In order to further understand the dynamics and
trends in place within the County, it has been segregated geographically into three (3)
planning units. This allows for a more specific look at certain benchmark data which
indicate short or long term trends. It should be noted at the outset that the four (4)
municipalities comprising the Central Planning Unit are not only the four (4) most
populous communities in the County, but together represent more than fifty-four percent
(54%) of the total year 2000 County population. (Table 3-1)
There are three (3) communities in both the Northern Planning Unit and Southern
Planning Unit with populations less than five hundred (500) persons, as of the year
Population and Housing
Page 40 of 90
Page 41
8/3/2019 Volume IV Population and Housing
http://slidepdf.com/reader/full/volume-iv-population-and-housing 41/90
Venango County, PennsylvaniaComprehensive Development Plan
February 2004
2000. However, six (6) communities in the Northern Planning Unit and nine (9)
communities in the Southern Planning Unit reported populations of under one thousand
(1,000) persons in the year 2000. There are a total of eight (8) Boroughs in the Northern
and Southern Planning Units, only one of which, Polk Borough, reported a population in
excess of one thousand persons (1,000) in the year 2000. These areas of the County,
because of the low population density per square mile, are considered more rural than
the Central Planning Unit.
Of the thirteen (13) communities in the Northern Planning Unit, eight (8) lost
population between 1980 and the year 1990, and the same eight (8) municipalities
continued to lose population between 1990 and the year 2000. The three (3) Boroughs,
Cooperstown, Pleasantville and Rouseville, averaged between them a 32.1% loss in
total population. this trend is significant in the long term (20 year trend), although the
percentage of population loss for the most recent ten (10) year period averaged 18% for
the three (3) Boroughs. These statistics equate to a 1.6% average yearly loss in
population over a twenty (20) year period and a 1.8% average yearly loss during the
most recent ten (10) year period.
In the Central Planning Unit, where municipal populations are much larger, the
twenty (20) year trend as well as the most recent ten (10) year trend showed a steady
decline in total population. Oil City along lost more people between 1980 and the year
2000 (2,377) than both the Northern and Southern Planning Units combined (2,136).
While every municipality in the Central Planning Unit lost population in double digit
percentages between 1980 and 2000, the most significant losses occurred between
1980 and 1990.
The communities in the Southern Planning Unit faced the best in time of
maintaining population. While six (6) communities showed a loss over the twenty (20)
year comparison period, eight (8) communities reported population increases, some
significant. As discussed in part earlier, three (3) Townships in the Southern PlanningUnit reported population gains in double digit percentages between 1980 and the year
2000 (Table 1-3). Sandy Creek Township experienced a total increase of 23.5%,
although between 1990 and 2000, the Township lost3.6% of the population increase it
experienced between 1980 and 1990. The Central Planning nit municipalities combined
population loss stands at 13.5% for the period 1980 to 2000, while the Northern Planning
Population and Housing
Page 41 of 90
Page 42
8/3/2019 Volume IV Population and Housing
http://slidepdf.com/reader/full/volume-iv-population-and-housing 42/90
Venango County, PennsylvaniaComprehensive Development Plan
February 2004
Units combined population was reduced by 8.4% and the Southern Planning Units lost
7% of their total population.
Characteristics by Planning Unit
Three (3) Counties in Northwest Pennsylvania have a higher median age than
Venango County. Oldest at 44.2 years if Forest County, followed by Warren County at
40.5 years and Armstrong County at 40.4 years. Venango County’s median age in the
year 2000, was 40.2 years. Of interest is the fact that in the Northern Planning Unit, ten
(10) of the thirteen (13) communities’ populations have a median age at or older than the
County’s median age. Two (2) of the four (4) communities in the Central Planning Unit
are at or above the County’s median age and nine (9) of the fourteen (14) communities
in the Southern Planning Unit are at or above the median age of the County. The oldest
population is Polk Borough’s, with a median age of 46.5 years and the youngest is in
Utica Borough, with a median age of 34.4. both Boroughs are in the Southern Planning
Unit.
Table 3-7 presents age cohorts for each municipality in Venango County by
percentages of the total population and by Planning Unit. In each community and in
each Planning Unit, the highest percentages of each municipal population falls in the
three (3) age cohorts between age 25 and 54, both as an aggregate total and as an
individual ten (10) year cohort. What is interesting is the aged 65 to 74 cohort withdouble digit percentages, based on the 2000 Census data. Six (6) municipalities in the
Northern Planning Unit have double digit percentages of population in the 65 to 74 year
old cohort. All three Boroughs are included. In the Central Planning Unit, the single
Borough, Sugarcreek, has a population with 10.3% of the total in the 65 to 74 year old
cohort. The Southern Planning Unit includes three (3) municipalities with double-digit
percentages in the subject age cohort, Barkeyville Borough, Richland Township and
Rockland Township. This demographic characteristic is confirmation that in the County’s
Boroughs, the population has aged more rapidly in the sense that fewer young peopleare migrating in.
In educational attainment, as a population characteristic, the Northern Planning
Unit population is the least educated with almost 27% (26.9%) of the total population not
having completed high school. Only 19% of the total population of the Southern
Population and Housing
Page 42 of 90
Page 43
8/3/2019 Volume IV Population and Housing
http://slidepdf.com/reader/full/volume-iv-population-and-housing 43/90
Venango County, PennsylvaniaComprehensive Development Plan
February 2004
Planning Unit do not have a high school education. The Central Planning Unit’s
population has attained the highest overall level of education with only 16.4% of the total
without a high school education.
There are a few anomalies in these data. For instance, 17.8% of the totalpopulation of Cornplanter Township has attained a bachelors or a graduate degree. The
only two (2) municipalities with higher percentages of the population with post high
school educations are the City of Franklin with 18.3% and Emlenton Borough with
18.8%. The other anomaly is the population of Polk Borough with 70.4% of the total
population not having finished high school. It should be noted that this population
includes permanent residents of Polk Center, where those institutionalized persons
comprise the majority of the total population.
Income characteristics paint an interesting picture in Venango County. While in
almost every municipality the highest percentage of households fall into the two (2)
income ranges starting with $25,000 and ending with $49,999, there are exceptions. In
the Northern Planning Unit, the percentage of households reporting income of $50,000
and more in both Cornplanter and Oakland Townships exceeds 35% (36.5% and 37%
respectively), while in three (3) municipalities, 40% or more of the households reported
incomes less than $24,999; they are Pleasantville Borough (40%), President Township
(46.9) and Rouseville Borough (54%). Rouseville Borough reported the highest
percentage of low income households in the Northern Planning Unit and conversely, the
lowest percentage of high income (over $50,000) at 20.6%.
The Central Planning Unit’s income ranges indicate that both Franklin and Oil
City have high percentages of households in the bottom three (3) categories. At 47.2%
of the households reporting income less than $25,000 in Franklin and 45.8% of the
households reporting the same in Oil City, the cost of living in either city must be
relatively low. In Oil City, only 22.4% of householders reported income in excess of
$50,000 in the year 2000.
In the Southern Planning Unit, only Barkeyville Borough of the four (4) Boroughs
in the region, reported less than 37% of their households with income below $25,000.
Polk Borough (37.4%), Emlenton Borough (41.8%), Clintonville Borough (53.8%) and
Utica Borough (60.8%) all reported high percentages of low income households. Utica
Population and Housing
Page 43 of 90
Page 44
8/3/2019 Volume IV Population and Housing
http://slidepdf.com/reader/full/volume-iv-population-and-housing 44/90
Venango County, PennsylvaniaComprehensive Development Plan
February 2004
borough had the highest percentage of households earning less than $25,000 in the
year 2000 in Venango County, as well as the lowest percentage of households (13.9%)
reporting income of more than $50,000. Sandy Creek township has the highest
percentage of households (45.5%) in the County with incomes in excess of $50,000.
Rouseville Borough reported the lowest median household income of any
municipality in the Northern Planning Unit ($22,917) in the year 2000, while Oakland
Township reported the highest median income at $39,293. In the Central Planning Unit,
the City of Franklin had the highest median income at $37,063, and Oil City reported the
lowest at $29,060. In 2000, the highest median household income in the Southern
Planning Unit was reported by Sandy Creek Township at $46,723, while the lowest
median household income was reported by Clintonville Borough, at $22,083. It should
be noted that the two (2) highest median incomes reported in Venango County in the
year 2000, belonged to communities in the Southern Planning Unit, Sandy Creek
Township ($46,723) and Barkeyville Borough ($41,500.) In addition, the two (2) lowest
reported median household incomes in the County also belonged to communities in the
Southern Planning Unit, Utica Borough ($22,875) and Clintonville Borough ($22,083).
Three (3) communities in the Northern Planning Unit had double-digit
percentages of families at or below the poverty level in the year 2000. They are
Rouseville Borough (16.3%), President Township (13.0%), and Jackson Township
(12.8%). In the Central Planning Unit, three (3) of the four (4) municipalities exhibited
double digit percentages of families at or below poverty level. They include Oil City
(16.2%), Franklin (13.6%) and Cranberry Township at 10.6%. The Southern Planning
Unit includes two (2) municipalities with double digit percentages of families at or below
the poverty level, Clintonville Borough (14.4%) and Utica Borough (30.4%). Utica
Borough’s percentage of families at or below poverty level was the highest percentage
reported for any municipality in Venango County.
SUMMARY
The County’s population peaked at over 65,000 in 1950. Since that timepopulation losses have amounted to 13.4% settling at just over 57,000 in April of 2000.
Because of past population trends, migration records, fertility and birth statistics,various population projections inevitably show continued population losses for theCounty through 2020.
Population and Housing
Page 44 of 90
Page 45
8/3/2019 Volume IV Population and Housing
http://slidepdf.com/reader/full/volume-iv-population-and-housing 45/90
Venango County, PennsylvaniaComprehensive Development Plan
February 2004
The Boroughs and cities of Venango County lost significant population since1980, while a majority of the Townships grew at slow levels.
The density of the County varies greatly from the dense development of Franklinand Oil City to the rural farming landscapes in the north east and southern portions.
The distribution of the population is concentrated near the major transportationcorridors, Route 62, 322 and Route 8, and to a lesser degree, State Routes 157, 257and 417 and adjacent to the commercial development areas outside of Oil City inCranberry Township.
The County experienced tremendous losses of persons both male and femalebetween the ages of 20 to 39 since 1990.
As a result of the loss of families and individuals of child-bearing age since 1990,a severe decline in the number of persons below the age of 10 also occurred.
The County experienced a significant gain in persons 65 and over since 1990.
The County can be considered highly rural in nature compared to urban andrural population distributions for Pennsylvania.
Education levels in the County have improved since 1990 and were comparableto State levels in 2000.
Income levels lagged behind Pennsylvania in 2000; however, the improvementssince 1990 in median and per capita income levels outpaced the State for the same timeperiod.
Poverty levels for Venango County in 2000 were high compared toPennsylvania. Of particular concern were the poverty levels of women who were singleparents with very young children, nearly 70% of such households were consideredbelow poverty levels.
Housing and Households
Population and Housing
Page 45 of 90
Page 46
8/3/2019 Volume IV Population and Housing
http://slidepdf.com/reader/full/volume-iv-population-and-housing 46/90
Venango County, PennsylvaniaComprehensive Development Plan
February 2004
1his section of the plan reviews and analyzes the housing stock in Venango
County. Field survey information is augmented by demographic and housing
data from the 1980, 1990 and 2000 Census, and with locally generated
information concerning housing character, style and conditions. The integration and
synthesis of this information provides a profile of the condition and character of the
housing stock. Where it is applicable the comparisons have been made between the
County, its municipalities and the Commonwealth as a whole.
T
Number of Housing Units
In 2000 Venango County had 26,904 total housing units, a -.21% decrease from
26,961 units in 1990, as seen in Table 4-1 on the next page. Growth slowed
considerably since the 1980’s when the housing stock increased by nearly 11%countywide. There are 31 municipalities in Venango County of which 19 experienced
additions to their housing stocks – fifteen (15) townships and four (4) boroughs. Of
these municipalities townships accounted for 477 of the 502 units of the municipalities
that increased their housing stock - growth areas of the county were largely a product of
suburban and rural housing starts. Oil City and Franklin accounted for a majority of the
unit losses.
Oil City and Franklin accounted for 322 of the 612 units of decrease over the
decade. Couple that total with Sugarcreek Borough’s 90 units and the three
municipalities accounted for two-thirds of the housing
unit losses in the county since 1990. The remainders of
the housing stock decreases were divided up between
four (4) townships and boroughs.
Fifteen (15) of the twenty (20) townships
experienced housing growth with Allegheny, Irwin and
Victory adding approximately 15% to their housing
stock, as did Cranberry Township numerically.
Sugarcreek, Rockland and Cornplanter Township’s
experienced significant decreases in numbers, but Oil
City and Franklin accounted for the majority of housing unit losses.
Population and Housing
Page 46 of 90
Total Housing Units 2000
Pennsylvania 5,249,75
0
Venango 26,904
Armstrong 32,387
Butler 69,868
Clarion 19,426
Crawford 42,416
Erie 114,322
Forest 8,701
Mercer 49,859
Warren 23,058
Page 47
8/3/2019 Volume IV Population and Housing
http://slidepdf.com/reader/full/volume-iv-population-and-housing 47/90
Venango County, PennsylvaniaComprehensive Development Plan
February 2004
Four (4) of the nine (9) boroughs added a small amount of housing units:
Clintonville, Emlenton, Utica and Sugarcreek. Housing losses in the remaining five
boroughs were minor at less than 5%, except for Polk Borough, which lost nearly 11% of
its housing stock.
In comparison, Pennsylvania added over 6% to its housing stock despite a very
modest gain in total population. This is a trend, which has been very typical as the
number of persons per household continues to decrease within the state and nationally.
TABLE 4-1
TOTAL HOUSING UNITS, 1980-2000
Jurisdiction 1980 1990 2000 NumericalChange1980-90
PercentChange1980-90
NumericalChange1990-00
Percent Chang1990-00
PA 4,509,332 4,938,140 5,249,750 428,808 9.51% 311,610 6.31%
Venango County 24,358 26,961 26,904 2,603 10.69% -57 -0.21%
Population and Housing
Page 47 of 90
Page 48
8/3/2019 Volume IV Population and Housing
http://slidepdf.com/reader/full/volume-iv-population-and-housing 48/90
Venango County, PennsylvaniaComprehensive Development Plan
February 2004
Northern Planning
Unit1980 1990 2000
NumericalChange1980-90
PercentChange1980-90
NumericalChange1990-00
Percent Chang1990-00
Allegheny Township 95 158 184 63 66.32% 26 16.46%
Canal township 387 417 432 30 7.75% 15 3.60%
Cherry Tree township 579 639 671 60 10.36% 32 5.01%Cooperstown borough 206 204 198 -2 -0.97% -6 -2.94%
Cornplanter township 1,065 1,204 1,179 139 13.05% -25 -2.08%
Jackson township 367 433 473 66 17.98% 40 9.24%
Oakland township 536 576 631 40 7.46% 55 9.55%
Oilcreek township 326 400 389 74 22.70% -11 -2.75%
Pine Grove township 476 559 576 83 17.44% 17 3.04%
Pleasantville borough 393 371 369 -22 -5.60% -2 -0.54%
Plum township 362 453 461 91 25.14% 8 1.77%
President township 205 703 719 498 242.93% 16 2.28%
Rouseville borough 276 254 240 -22 -7.97% -14 -5.51%
Total 7,253 8,361 8,522
Central Planning
Unit
1980 1990 2000 Numerical Change1980-90
PercentChange1980-90
Numerical Change1990-00
PercentChange1990-00
Franklin city 3,531 3,430 3,281 -101 -2.86% -149 -4.34%
City of Oil City 5,660 5,449 5,276 -211 -3.73% -173 -3.17%
Cranberry township 2,850 2,975 3,054 125 4.39% 79 2.66%
Sugarcreek borough 2,161 2,230 2,245 69 3.19% 15 0.67%
Total 14,202 14,084 13,856
Southern Planning
Unit1980 1990 2000
NumericalChange1980-90
PercentChange1980-90
NumericalChange1990-00
PercentChange1990-00
Barkeyville borough 98 110 106 12 12.24% -4 -3.64%
Clinton township 269 416 414 147 54.65% -2 -0.48%
Clintonville borough 201 238 242 37 18.41% 4 1.68%
Emlenton borough 334 356 360 22 6.59% 4 1.12%
French Creektownship
813 738 788 -75 -9.23% 50 6.78%
Irwin township 422 504 578 82 19.43% 74 14.68%
Mineral township 202 263 274 61 30.20% 11 4.18%
Population and Housing
Page 48 of 90
Page 49
8/3/2019 Volume IV Population and Housing
http://slidepdf.com/reader/full/volume-iv-population-and-housing 49/90
VacancyRates
1990 2000
* ** * **Pennsylvania 1.8 8.0 1.6 7.2
Venango 2.3 8.6 1.7 6.9
Armstrong 1.4 7.1 1.7 7.1
Butler 1.1 5.1 1.5 7.2Clarion 1.4 5.8 1.4 7.0
Crawford 1.5 5.8 2.0 8.3
Erie 1.2 6.9 1.6 7.9
Forest 2.6 5.5 2.2 6.5
Mercer 1.1 5.5 1.5 6.7
Warren 1.2 8.2 1.8 9.8
*Homeowner** Renter
Venango County, PennsylvaniaComprehensive Development Plan
February 2004
Polk borough 245 234 209 -11 -4.49% -25 -10.68%
Richland township 549 341 341 -208 -37.89% 0 0.00%Rockland township 526 1,309 1,255 783 148.86% -54 -4.13%Sandy Creek township 721 1,004 914 283 39.25% -90 -8.96%Scrubgrass township 269 591 600 322 119.70% 9 1.52%Utica borough 95 120 122 25 26.32% 2 1.67%Victory township 139 282 327 143 102.88% 45 15.96%
Total 4,883 6,506 6,530
Source: 1980, 1990 and 2000 United States Census
Housing Occupancy Status
Occupied
In 2000, 22,747 of the 26,904 Venango County’s total housing units were
occupied equaling an 84.5% occupancy rate. In comparison, Pennsylvania had a 91.0%
occupancy rate. Table 4-2 on the next page contains all the data for occupied, vacant
and seasonal housing units for the state, county and Venango County’s thirty-one (31)
municipalities.
With the exception of Utica Borough the boroughs have occupancy rates nearly
identical to the state within 1% of the 90% range. The townships occupancy rates are
quite varied and different due to many of the municipality’s high number of seasonal
units.
Vacancy rates within the occupied units were directly comparable to statewide
figures as highlighted in the table below.
Population and Housing
Page 49 of 90
VACANCY RATES
Jurisdiction1990 2000Homeowner Rental Homeowner Rental
Pennsylvania 1.8 8.0 1.6 7.2
Venango County 2.3 8.6 1.7 6.9
Page 50
8/3/2019 Volume IV Population and Housing
http://slidepdf.com/reader/full/volume-iv-population-and-housing 50/90
Venango County, PennsylvaniaComprehensive Development Plan
February 2004
NOTE: Seasonal units are considered vacant for purposes of the table and thisanalysis. “Occupied” and “Vacant” housing units make up 100% of the data.Seasonal units are a subcategory of vacant units; however, the percent total iscalculated using the total housing units. Therefore, the percentage of vacant units and seasonal units are directly comparable. For example, the county reported 4,157 vacant units in 2000, or 15.5% of the total housing units. This
would be an alarming statistic; however, 2,586 of these units, or 9.6% of the total were reported as seasonal leaving only a 7.5% vacancy rate, which is 1.5%lower than the state.
Vacant and Seasonal
As is the case in many municipalities the largest percent of housing units are
categorized under owner occupied or rental. A certain amount of vacant units are
necessary to provide opportunities for families and other people to be able to find
adequate housing if desiring to relocate into the area. A rate of only 1-2% would indicate
stagnation in the housing stock. Stagnation often means declining values and local tax
bases eroding.
The County’s 15.5% vacant housing rates were very high compared to
Pennsylvania’s 9.0% in 2000. However, the 4,157 vacant units were reasonable
considering that 2,545 or 62.2% were seasonally occupied units.
Nearly half of the seasonal units were
located in President and Rockland Townships
accounting for 1,077 or 41.6% of the County’s
total seasonal units. Other significant
concentrations of seasonal units were located
in Scrubgrass (257), Victory (150), Clinton
(116), and Cornplanter (114) Townships.
TABLE 4-2HOUSING OCCUPANCY STATUS, 1990-2000
Jurisdiction1990 2000
OccupiedUnits
%VacantUnits
%Seasonal
Units% Occupied
Units% Vacant
Units
% SeasonalUnits %
PA 4,495,966 91.0% 442,174 9.0% 144,359 2.9% 4,777,003 91.0% 472,747 9.0% 148,230 2.8%
Venango County 22,408 83.1% 4,553 16.9% 2,545 9.4% 22,747 84.5% 4,157 15.5% 2,586 9.6%
Northern Planning Unit
Allegheny township 107 67.7% 51 32.3% 11 7.0% 108 58.7% 76 41.3% 59 32.1%
Canal township 379 90.9% 38 9.1% 20 4.8% 382 88.4% 50 11.6% 24 5.6%
Population and Housing
Page 50 of 90
Housing Occupancy Status – 2000
by Number and PercentOccupied Vacant Seasonal
Pennsylvania4,777.003 472,747 148,230
91.0 9.0 2.8
Venango22,747 4,157 2,586
84.5 15.5 9.6
Armstrong29,005 3,382 1,422
89.6 10.4 4.4
Butler65,862 4,006 826
94.3 5.7 1.2
Clarion16,052 3,374 2,331
82.6 17.4 12.0
Crawford34,678 7,738 4,964
81.8 18.2 11.7
Erie 106,507 7,815 1,12693.2 6.8 1.0
Forest2,000 6,701 6,560
23.0 77.0 75.4
Mercer46,712 3,147 482
93.7 6.3 1.0
Warren17,696 5,362 4,125
76.7 23.3 17.9
Page 51
8/3/2019 Volume IV Population and Housing
http://slidepdf.com/reader/full/volume-iv-population-and-housing 51/90
Venango County, PennsylvaniaComprehensive Development Plan
February 2004
Cherry Tree township 558 87.3% 81 12.7% 32 5.0% 593 88.4% 78 11.6% 38 5.7%
Cooperstown borough 184 90.2% 20 9.8% 2 1.0% 187 94.4% 11 5.6% 6 3.0%
Cornplanter township 1,049 87.1% 155 12.9% 113 9.4% 1,034 87.7% 145 12.3% 114 9.7%
Jackson township 356 82.2% 77 17.8% 20 4.6% 422 89.2% 51 10.8% 27 5.7%
Oakland township 517 89.8% 59 10.2% 36 6.3% 575 91.1% 56 8.9% 27 4.3%
Oilcreek township 335 83.8% 65 16.3% 24 6.0% 328 84.3% 61 15.7% 38 9.8%
Pine Grove township 507 90.7% 52 9.3% 36 6.4% 511 88.7% 65 11.3% 44 7.6%Pleasantville borough 352 94.9% 19 5.1% 2 0.5% 340 92.1% 29 7.9% 7 1.9%
Plum township 362 79.9% 91 20.1% 56 12.4% 391 84.8% 70 15.2% 55 11.9%
President township 217 30.9% 486 69.1% 459 65.3% 241 33.5% 478 66.5% 462 64.3%
Rouseville borough 226 89.0% 28 11.0% 1 0.4% 204 85.0% 36 15.0% 9 3.8%
Total 5,149 1,222 812 5,316 1,206 910
Central Planning Unit
Franklin city 3,118 90.9% 312 9.1% 10 0.3% 3,030 92.3% 251 7.7% 13 0.4%
City of Oil City 4,875 89.5% 574 10.5% 14 0.3% 4,762 90.3% 514 9.7% 34 0.6%
Cranberry township 2,769 93.1% 206 6.9% 64 2.2% 2,843 93.1% 211 6.9% 74 2.4%
Sugarcreek borough 2,072 92.9% 158 7.1% 30 1.3% 2,093 93.2% 152 6.8% 59 2.6%
Total 12,834 1,250 118 12,728 1,128 180
Population and Housing
Page 51 of 90
Page 52
8/3/2019 Volume IV Population and Housing
http://slidepdf.com/reader/full/volume-iv-population-and-housing 52/90
Venango County, PennsylvaniaComprehensive Development Plan
February 2004
Southern Planning Unit
Jurisdiction
1990 2000
OccupiedUnits
%VacantUnits
%Seasonal
Units%
OccupiedUnits
%VacantUnits
%Seasonal
Units%
Clinton township 251 60.3% 165 39.7% 121 29.1% 278 67.1% 136 32.9% 116 28.0%
Clintonville borough 214 89.9% 24 10.1% 1 0.4% 215 88.8% 27 11.2% 7 2.9%
Emlenton borough 314 88.2% 42 11.8% 6 1.7% 322 89.4% 38 10.6% 11 3.1%
French Creek township 626 84.8% 112 15.2% 77 10.4% 662 84.0% 126 16.0% 86 10.9%
Irwin township 414 82.1% 90 17.9% 63 12.5% 494 85.5% 84 14.5% 61 10.6%
Mineral township 187 71.1% 76 28.9% 53 20.2% 208 75.9% 66 24.1% 60 21.9%
Polk borough 215 91.9% 19 8.1% 10 4.3% 196 93.8% 13 6.2% 1 0.5%
Richland township 276 80.9% 65 19.1% 39 11.4% 291 85.3% 50 14.7% 40 11.7%
Rockland township 500 38.2% 809 61.8% 716 54.7% 556 44.3% 699 55.7% 615 49.0%
Sandy Creek township 833 83.0% 171 17.0% 113 11.3% 832 91.0% 82 9.0% 44 4.8%
Scrubgrass township 267 45.2% 324 54.8% 253 42.8% 320 53.3% 280 46.7% 257 42.8%
Utica borough 85 70.8% 35 29.2% 27 22.5% 79 64.8% 43 35.2% 36 29.5%
Victory township 143 50.7% 139 49.3% 127 45.0% 162 49.5% 165 50.5% 150 45.9%
Total 4,425 2,081 1,615 4,706 1,824 1,497
Source: 1990 and 2000 United States Census
Occupied Housing Unit Status
Owner Occupied
In 2000, 17,386 of the 22,747 occupied housing units in the County were lived in
by their owners (Table 4-3). This was an owner occupancy rate of 64.6% compared to
the Pennsylvania rate of 64.9%. This rate places the County in line with the owner
occupancy among Pennsylvania counties. The percent of owner-occupied housing is
important to maintain a reasonable level because it means less general deterioration of housing stock. Renters clearly do not maintain their properties as well as homeowners.
Landlords often have less incentive, need, or desire to upkeep their properties to the
same degree as a homeowner.
Absentee landlords are often the result
of deteriorating housing stock that
becomes attractive for reuse as rental
units. In many cases, absentee
landlords have used little discretion whenselecting tenants and maintaining their
properties. However, deterioration of
housing stock can come in other
packages.
Renter-Occupied
Population and Housing
Page 52 of 90
Housing Tenure 2000
by Number and Percent
Owner Renter# % # %
Pennsylvania 3,406337 71.3 1,370,666 28.7
Venango 17,386 76.4 5,361 23.6
Armstrong 22,408 77.3 6,597 22.7
Butler 51,285 77.9 14,577 22.1
Clarion 11.599 72.3 4,453 27.7
Crawford 26,190 75.5 8,488 24.5Erie 73,729 69.2 32.778 30.8
Forest 1,654 82.7 346 17.3
Mercer 35,646 76.3 11.066 23.7
Warren 13,845 78.2 3,851 21.8
Page 53
8/3/2019 Volume IV Population and Housing
http://slidepdf.com/reader/full/volume-iv-population-and-housing 53/90
Venango County, PennsylvaniaComprehensive Development Plan
February 2004
In 2000, 5,361 rental units were occupied in the County. This was moderate to
low for PA at 19.9% of all occupied units. See Table 4-3 below. Between rentals and
owner-occupied housing nearly 84.5% of the housing stock is accounted for. Add in the
15.5% vacant units and the housing package for Venango County is complete.
TABLE 4-3
HOUSING TENURE, 1990-2000
Jurisdiction
1990 2000
Owner-Occupied
UnitsPercent
Renter-Occupied
UnitsPercent
Owner-Occupied
UnitsPercent
Renter-Occupied
UnitsPercent
PA 3,176,121 64.3% 1,319,845 25.1% 3,406,337 71.3% 1,370,666 28.7%
Venango County 16,692 61.9% 5,716 21.2% 17,386 76.4% 5,361 23.5%
Northern Planning UnitAllegheny township 87 55.1% 20 10.9% 92 85.2% 16 14.8%
Canal township 333 79.9% 46 10.6% 344 90.1% 38 9.9%
Cherry Tree township 488 76.4% 70 10.4% 522 88.0% 71 12.0%
Cooperstown borough 167 81.9% 17 8.6% 170 90.9% 17 9.1%
Cornplanter township 905 75.2% 144 12.2% 921 89.1% 113 10.9%
Jackson township 290 67.0% 66 14.0% 344 81.5% 78 18.5%
Oakland township 466 80.9% 51 8.1% 533 92.7% 42 7.3%
Oilcreek township 294 73.5% 41 10.5% 295 89.9% 33 10.1%
Pine Grove township 435 77.8% 72 12.5% 447 87.5% 64 12.5%
Pleasantville borough 279 75.2% 73 19.8% 286 84.1% 54 15.9%Plum township 325 71.7% 37 8.0% 350 89.5% 41 10.5%
President township 188 26.7% 29 4.0% 219 90.9% 22 9.1%
Rouseville borough 180 70.9% 46 19.2% 161 78.9% 43 21.1%
Total 4,437 712 4,684 632
Central Planning Unit
Franklin city 1,730 50.4% 1,388 42.3% 1,744 57.6% 1,286 42.4%
City of Oil City 3,005 55.1% 1,870 35.4% 2,977 62.5% 1,785 37.5%
Cranberry township 2,198 73.9% 571 18.7% 2,291 80.6% 552 19.4%
Sugarcreek borough 1,692 75.9% 380 16.9% 1,753 83.8% 340 16.2%
Total 8,625 4,209 8,765 3,963
Population and Housing
Page 53 of 90
Page 54
8/3/2019 Volume IV Population and Housing
http://slidepdf.com/reader/full/volume-iv-population-and-housing 54/90
Venango County, PennsylvaniaComprehensive Development Plan
February 2004
Jurisdiction
1990 2000
Owner-Occupied
UnitsPercent
Renter-Occupied
UnitsPercent
Owner-Occupied
UnitsPercent
Renter-Occupied
UnitsPercent
Southern Planning Unit
Barkeyville borough 87 79.1% 13 12.3% 73 80.2% 18 19.8%Clinton township 217 52.2% 34 8.2% 250 89.9% 28 10.1%
Clintonville borough 147 61.8% 67 27.7% 137 63.7% 78 36.3%
Emlenton borough 217 61.0% 97 26.9% 206 64.0% 116 36.0%
French Creektownship
520 70.5% 106 13.5% 571 86.3% 91 13.7%
Irwin township 349 69.2% 65 11.2% 411 83.2% 83 16.8%
Mineral township 162 61.6% 25 9.1% 187 89.9% 21 10.1%
Polk borough 151 64.5% 64 30.6% 152 77.6% 44 22.4%
Richland township 224 65.7% 52 15.2% 243 83.5% 48 16.5%
Rockland township 432 33.0% 68 5.4% 503 90.5% 53 9.5%
Sandy Creek township 712 70.9% 121 13.2% 737 88.6% 95 11.4%
Scrubgrass township 228 38.6% 39 6.5% 270 84.4% 50 15.6%
Utica borough 59 49.2% 26 21.3% 65 82.3% 14 17.7%
Victory township 125 44.3% 18 5.5% 134 82.7% 28 17.3%
Total 3,630 795 3,939 767
Source: 1980, 1990 and 2000 United States Census
Value of Housing Units
In 2000, the median value of an owner-occupied housing unit in Pennsylvania
was $97,000. In Venango County the median value was $55,900 as seen in Table 4-4.
As expected due to the ages of the housing and the slightly depressed real estate
market in the County, the value was below averages for the Commonwealth.
The
County’s
median
housing value
in 1990 was
$38,600. A
concern for
much of rural
western
Population and Housing
Page 54 of 90
Value of Housing 2000
<$50,000
$50-99,999
$100-149,999
$150-199,999
$200-299,999
$300-499,999
$500.000>
Pennsylvania 15.1 37.4 24.3 11.9 7.4 2.9 1.0
Venango 42.8 46.2 7.7 2.2 1.0 0.1 0.1
Armstrong 32.6 50.1 11.3 4.6 1.1 0.3 0
Butler 6.4 34.1 30.7 14.3 10.9 3.0 0.7
Clarion 27.3 52.8 13.5 4.3 1.6 0.4 0.2
Crawford 22.9 54.3 15.4 4.1 2.4 0.7 0.2
Erie 14.4 49.7 21.9 8.3 3.9 1.3 0.5
Forest 41.1 50.3 6.1 1.2 1.1 0 0.2
Mercer 24.2 47.1 18.6 5.9 3.0 0.8 0.3
Warren 31.6 52.1 11.8 2.6 1.3 0.4 0.3
Page 55
8/3/2019 Volume IV Population and Housing
http://slidepdf.com/reader/full/volume-iv-population-and-housing 55/90
Venango County, PennsylvaniaComprehensive Development Plan
February 2004
Pennsylvania is the growing gap between the State’s median housing values and the
rural municipalities. In 1990 the County’s housing value was 58% of the State’s. The
1990 median value for the State was $67,000. In 2000, the median house value in the
County had a market value of 58% of the State median. Favorably, the County’s
housing values kept pace with the values of the State’s housing for the first time in 30
years.
A Note: Housing value is a rather subjective database when taken from the
census because the census simply asks homeowners to check the category of their
estimated housing value based on $5,000 cohorts. For example, the census asks “is
your house worth less than $15,000, $15,000 to $19,999...”, and so on until the category
of $500,000 or greater. The census then calculates low, medium, and high value
medians for each municipality. In many cases individuals over value their home 4% to
7% skewing the data. For this reason the data is never relied upon for tax purposes or
anything greater than trend analysis. Nevertheless, the data is the most comprehensive
and convenient available for this analysis and enables one to create a comparison of the
relative values of housing between applicable municipalities.
Population and Housing
Page 55 of 90
Page 56
8/3/2019 Volume IV Population and Housing
http://slidepdf.com/reader/full/volume-iv-population-and-housing 56/90
Venango County, PennsylvaniaComprehensive Development Plan
February 2004
TABLE 4-4
HOUSING VALUE OF OWNER-OCCUPIED UNITS, 1990-2000
Venango County, Venango County Townships, Borough and Cities
and Pennsylvania
(Percent of Sampled Units in Value Range)
ValueRange
PennsylvaniaVenango
County
Venango CountyTownships
Venango CountyBoroughs
Venango CountyCities
1990 2000 1990 2000 1990 2000 1990 2000 1990 2000
*Units 2,581,261 2,889,484 11,709 12,554 5,224 4,273 2,345 6,013 4,140 2,368
Less than$50,000
32.1% 15.0% 68.2% 42.8% 59.0% 28.9% 74.7% 48.7% 76.2% 58.9%
$50,000 to$99,999
39.4% 37.4% 28.4% 46.2% 38.1% 54.3% 24.3% 46.7% 18.4% 33.8%
$100,000 to
$149,999
15.3% 24.3% 2.5% 7.7% 2.3% 12.0% 0.9% 4.7% 3.8% 3.1%
$150,000 to$199,999
7.0% 11.9% 0.5% 2.2% 0.4% 2.0% 0.0% 1.1% 1.0% 2.9%
$200,000 to$299,999
4.2% 7.4% 0.3% 1.0% 0.2% 0.9% 0.0% 0.7% 0.5% 1.3%
$300,000 to$499,999
1.4% 2.9% 0.1% 0.1% 0.0% 0.1% 0.0% 0.1% 0.2% 0.0%
$500,000plus
0.4% 1.0% 0.0% 0.1% 0.0% 0.1% 0.0% 0.1% 0.0% 0.0%
MedianValue
$67,000 $97,000 $38,600 $55,900
*Not a 100% sample
Source: 1990 and 2000 United States Census of Population and Housing
TABLE 4-5
VALUE OF HOUSING
NORTHERN PLANNING UNIT
Name < $50,000$50-
99,999$100-
149,999$150-
199,999$200-
299,999$300-
499,999$500.000>
AlleghenyTownship
36.2 53.2 10.6 0 0 0 0
Canal Township 32.8 53.1 10.9 1.6 1.6 0 0
Cherry TreeTownship
37.5 53.1 7.4 2.0 0 0 0
CooperstownBorough
37.6 58.8 2.4 0 1.2 0 0
Cornplanter Township
30.6 56.0 11.5 1.4 0.5 0 0
Jackson Township 23.5 69.3 5.2 1.3 0.7 0 0
Oakland Township 30.1 55.7 11.7 0.7 0.4 0 1.4
Oil CreekTownship
34.4 49.0 11.3 4.0 0 0 1.3
Pine Grove 33.3 48.9 16.0 0.9 0.9 0 0
Population and Housing
Page 56 of 90
Page 57
8/3/2019 Volume IV Population and Housing
http://slidepdf.com/reader/full/volume-iv-population-and-housing 57/90
Figure 8Source: 2000 US Census
Venango County, PennsylvaniaComprehensive Development Plan
February 2004
NORTHERN PLANNING UNIT
Name < $50,000$50-
99,999$100-
149,999$150-
199,999$200-
299,999$300-
499,999$500.000>
Township
PleasantvilleBorough
36.7 57.5 4.2 0.8 0 0 0.8
Plum Township 29.6 65.4 5.0 0 0 0 0PresidentTownship
40.3 48.9 8.1 0 2.7 0 0
RousevilleBorough
79.7 17.4 2.9 0 0 0 0
CENTRAL PLANNING UNIT
Name < $50,000 $50-99,999$100-
149,999$150-
199,999$200-
299,999$300-
499,999$500.000>
City of Franklin 51.3 38.7 3.7 4.0 2.4 0 0
City of Oil City 63.1 31.1 2.8 2.3 0.7 0 0
Cranberry Township 28.9 56.0 12.1 2.2 0.7 0 0
SugarcreekBorough 47.9 44.7 4.6 1.7 1.0 0 0
SOUTHERN PLANNING UNIT
Name< $50,000 $50-99,999 $100-
149,999$150-
199,999$200-
299,999$300-
499,999$500.000>
Barkeyville Borough 22.9 68.8 8.3 0 0 0 0
Clinton Township 32.0 51.6 13.3 1.6 1.6 0 0
Clintonville Borough 24.2 71.2 4.5 0 0 0 0
Emlenton Borough 36.1 50.0 12.8 1.1 0 0 0
French CreekTownship
18.9 61.8 16.3 1.8 0.6 0.6 0
Irwin Township 26.1 58.0 11.7 2.1 2.1 0 0
Mineral Township 50.6 40.5 5.1 3.8 0 0 0
Polk Borough 62.7 35.6 0 0 0 1.7 0
Richland Township 37.1 43.2 8.3 9.1 0 2.3 0
Rockland Township 32.5 56.0 9.9 1.0 0.7 0 0
Sandy CreekTownship
16.9 56.6 21.5 3.5 1.2 0.4 0
Scrubgrass Township 28.9 44.0 14.5 4.4 8.2 0 0
Utica Borough 75.0 25.0 0 0 0 0 0
Victory Township 40.7 42.2 6.8 3.4 0 0 0
Source: US Census of Population and Housing
Age of the Housing
Stock: A
Comparative
Analysis
The
Population and Housing
Page 57 of 90
Page 58
8/3/2019 Volume IV Population and Housing
http://slidepdf.com/reader/full/volume-iv-population-and-housing 58/90
Venango County, PennsylvaniaComprehensive Development Plan
February 2004
year of housing unit construction assists in conjuring a mental and physical image of the
communities housing stock. For example, a municipality with most of its housing built
prior to 1939 indicates a historical downtown or housing area with similar architectural
styles, lot sizes, and infrastructure. On the other hand, a municipality with most of its
housing built during the 1970's shows suburbanization with larger housing, modern in
design, on larger lots in a more rural setting.
Figure 8 compares Venango County housing construction chronologically as of
March 2000. Pennsylvania’s housing stock was primarily built prior to 1970 with 71.8%
of the total housing stock completed before the beginning of the decade. Nearly half of
this total was constructed prior to 1939, by far the largest cohort. Other housing boomstook place in the 1950', 60's, 70's, and 80's with approximately 12 to 14% of the housing
stock constructed per decade.
The County’s housing is only slightly older than the Commonwealth. Almost 40%
of the County’s stock was built prior to 1939. During the 1950's and 60's when many
communities were experiencing consistent 12-14% housing growths per decade, the
County’s housing grew at a higher pace for both decades. The county has experienced
modest housing growth during the 1980’s, which continued adding significant portions of
their housing stock throughout the 90’s.
TABLE 4-6 YEAR STRUCTURE BUILT – 2000
BY MUNICIPALITY
Population and Housing
Page 58 of 90
Year Structure Built
1999-2000
1995-1998
1990-1994
1980-1989
1970-1979
1960-1969
1940-1959
1939or
earlier
Pennsylvania
1.3 4.1 5.1 10.1 13.5 11.4 24.3 30.3
Venango 0.8 3.3 3.0 9.0 15.2 9.6 20.0 10.4
Armstrong 1.1 3.7 3.6 9.1 14.0 10.0 22.2 36.4
Butler 2.5 9.1 9.1 12.6 17.9 10.1 18.6 20.1
Clarion 1.5 4.6 3.9 11.8 18.1 11.2 17.8 31.1
Crawford 1.4 4.9 4.7 9.2 18.0 10.6 19.5 31.8
Erie 1.1 4.2 4.9 9.0 15.3 10.6 25.1 29.7
Forest 0.2 5.0 3.2 10.0 8.7 17.0 35.1 20.9
Mercer 0.8 4.2 4.1 7.4 14.1 11.3 26.0 32.1
Page 59
8/3/2019 Volume IV Population and Housing
http://slidepdf.com/reader/full/volume-iv-population-and-housing 59/90
Venango County, PennsylvaniaComprehensive Development Plan
February 2004
NORTHERN PLANNING UNIT1999-2000
1995-1998
1990-1994
1980-1989
1970-1979
1960-1969
1940-1959
1939 or earlier
AlleghenyTownship
0 1.1 9.9 14.9 11.0 11.0 24.9 27.1
Canal Township 0.5 3.2 3.5 17.6 22.2 9.5 11.3 32.3Cherry TreeTownship
3.0 5.8 6.1 13.3 23.1 7.3 18.5 23.0
CooperstownBorough
0 1.0 1.5 3.0 26.3 28.3 18.7 21.2
Cornplanter Township
0.3 2.5 1.4 12.8 16.8 13.1 27.4 25.8
Jackson Township 1.9 3.6 3.4 19.5 39.5 7.8 6.3 18.0
Oakland Township 0.8 8.6 2.9 17.0 23.6 9.0 13.9 24.2
Oil Creek Township 1.8 6.1 6.6 14.3 20.9 12.8 15.3 22.2
Pine GroveTownship
1.0 2.6 5.2 14.5 18.3 7.6 15.2 35.6
Pleasantville
Borough 0 2.7 5.1 3.8 14.6 7.6 22.0 44.2
Plum Township 1.3 2.2 3.3 12.4 24.9 9.1 11.7 35.1
President Township 1.1 4.5 2.6 3.9 12.5 15.4 41.0 18.9
Rouseville Borough 0 0.8 1.7 2.5 6.3 7.6 16.9 64.1
CENTRAL PLANNING UNIT1999-2000
1995-1998
1990-1994
1980-1989
1970-1979
1960-1969
1940-1959
1939 or earlier
City of Franklin 0 0.9 1.3 3.9 12.0 5.5 14.4 62.1
City of Oil City 0 1.2 0.2 2.9 6.9 5.2 19.9 63.7
CranberryTownship
1.0 3.4 2.5 13.0 18.5 10.7 24.5 26.4
SugarcreekBorough
0.3 2.9 4.2 6.4 10.1 13.4 24.4 38.3
SOUTHERN PLANNING UNIT1999-2000
1995-1998
1990-1994
1980-1989
1970-1979
1960-1969
1940-1959
1939 or earlier
BarkeyvilleBorough
0 0.9 11.9 15.6 3.7 10.1 17.4 40.4
Clinton Township 1.2 6.6 5.3 17.5 18.4 8.0 18.0 25.0
ClintonvilleBorough
0 2.5 5.3 24.2 17.2 4.1 9.8 36.9
Emlenton Borough 1.1 0 4.8 9.3 5.3 3.9 19.9 55.6
French CreekTownship
2.3 7.0 5.3 10.0 21.1 16.0 21.0 17.4
Irwin Township 2.4 7.0 8.9 16.7 20.7 7.5 12.7 24.2
Mineral Township 0.4 12.5 9..2 11.0 26.4 9.2 16.5 15.0
Polk Borough 0 1.0 1.9 5.3 15.0 11.2 19.4 46.1
Richland Township 1.2 3.6 2.4 12.5 12.2 11.0 13.7 43.3
Rockland Township 1.6 6.9 3.7 9.9 21.6 17.8 20.9 17.6
Sandy Creek 1.2 6.1 5.0 13.9 21.3 13.0 21.5 18.1
Population and Housing
Page 59 of 90
Page 60
8/3/2019 Volume IV Population and Housing
http://slidepdf.com/reader/full/volume-iv-population-and-housing 60/90
Venango County, PennsylvaniaComprehensive Development Plan
February 2004
SOUTHERN PLANNING UNIT1999-2000
1995-1998
1990-1994
1980-1989
1970-1979
1960-1969
1940-1959
1939 or earlier
Township
ScrubgrassTownship
2.7 4.3 5.2 11.8 17.1 14.0 27.5 17.5
Utica Borough 1.7 0 0 5.9 8.4 10.1 25.2 48.7Victory Township 1.2 12.8 9.1 13.4 24.1 12.5 10.7 16.2
Source: US Census of Population and Housing
Living Situations
This section concerns the number of persons below 18 years of age, the number
of over 65, their living situations, and their living arrangements. In other words, do the
younger and older populations of the county live with a spouse, in a core group family
(mother, father), alone, or in an institution like a nursing home or single parent
household? Apparently, Venango County is very family oriented, however it is defined.
In 2000, 70.0% of the households in the County were considered families, outpacing the
statewide average slightly. Likewise a greater number of married couples live in
Venango than other areas in Pennsylvania. The number of families with children under
18 is nearly identical to the state. Likewise, the numbers of households with persons
over 65 are very similar. Venango County’s relationships within households are average
for the state overall.
Population and Housing
Page 60 of 90
Page 61
8/3/2019 Volume IV Population and Housing
http://slidepdf.com/reader/full/volume-iv-population-and-housing 61/90
Venango County, PennsylvaniaComprehensive Development Plan
February 2004
TABLE 4-7
RELATIONSHIP, 2000
RELATIONSHIP 2000 BY PLANNING UNIT
Population and Housing
Page 61 of 90
Category
Pennsylvania Venango County
Number Percen
tNumber Percent
Total households4,777,00
3100.0 22,747 100.0
Families3,208,38
867.2 15,926 70.0
Married-couple family 2,467,67
351.7 12,693 55.8
Female householder,
no husband 554,693 11.6 2,248 9.9
With children <18 298,021 6.2 1,347 5.9
Non-family1,568,61
532.8 6,821 30.0
Householder alone 65 or >
55,374 11.6 2,852 12.5
Households with children<181,559,28
132.6 7,450 32.8
Households with persons>651,328,23
727.8 6,633 29.2
Source: 1990 and 2000 United States Census of Population and HousingNORTHERN PLANNING UNIT
TotalHouseholds
FamilyHouseholds
Married
Couple
FemaleHouseholder
Nonfamily Households<18
Households> 65
Allegheny
Township
108 86 79 5 22 35 33
CanalTownship
382 301 262 20 81 136 87
Cherry TreeTownship
593 451 377 40 142 210 165
Cooperstown Borough
187 146 127 12 41 52 51
Cornplanter Township
1,034 767 645 77 267 339 309
JacksonTownship
422 337 279 37 85 170 84
OaklandTownship
575 466 417 29 109 204 134
Oil CreekTownship
328 254 223 24 74 104 90
Pine GroveTownship
511 389 330 37 122 169 148
PleasantvilleBorough
340 250 217 20 90 113 118
PlumTownship
391 310 266 28 81 149 108
PresidentTownship
241 163 141 17 78 61 91
RousevilleBorough
204 138 99 27 66 50 85
Total 5,316 4,058 3,462 373 1,258 1,792 1,503
Relationship, 2000
Total
HouseholdsFamilies
Pennsylvania 4,777,0033,208,38
8
Venango 22,747 15,926
Armstrong 29,005 20,548
Butler 65,862 46,839
Clarion 16,052 10,735
Crawford 34,678 23,871
Erie 106,507 71,039
Forest 2,000 1,328
Mercer 46,712 32,387Warren 17,696 12,122
Page 62
8/3/2019 Volume IV Population and Housing
http://slidepdf.com/reader/full/volume-iv-population-and-housing 62/90
Venango County, PennsylvaniaComprehensive Development Plan
February 2004
SOUTHERN PLANNING UNITTotal
HouseholdsFamily
HouseholdsMarrie
dCouple
FemaleHouseholder
Nonfamily Households<18
Households> 65
BarkeyvilleBorough
91 72 60 6 19 25 29
ClintonTownship
278 219 186 15 59 95 74
ClintonvilleBorough
215 147 110 22 68 80 65
EmlentonBorough
322 201 146 41 121 97 108
FrenchCreekTownship
662 474 409 44 188 210 160
IrwinTownship
494 380 318 41 114 180 108
MineralTownship
208 174 152 12 34 67 51
PolkBorough
196 127 97 19 69 64 50
RichlandTownship
291 214 180 26 77 87 86
RocklandTownship
556 399 353 31 157 163 175
SandyCreekTownship
832 648 561 52 184 287 227
ScrubgrassTownship
320 241 201 29 79 98 102
UticaBorough
79 57 38 13 22 35 20
VictoryTownship
162 120 101 11 42 59 39
Total 4,706 3,473 2,912 362 1,233 1,547 1,294
Source: US Census of Population and Housing
Population and Housing
Page 62 of 90
CENTRAL PLANNING UNITTotal
HouseholdsFamily
HouseholdsMarriedCouple
FemaleHouseholder
NonfamilyHouseholds
<18Households
> 65
City of Franklin
3,030 1,825 1,256 441 1,205 960 956
City of Oil
City 4,762 2,983 2,131 607 1,779 1,563 1,449CranberryTownship
2,843 2,068 1,682 276 775 944 823
SugarcreekBorough
2,093 1,522 1,252 190 571 646 608
Total 12,728 8,398 6,321 1,514 4,330 4,113 3,836
Page 63
8/3/2019 Volume IV Population and Housing
http://slidepdf.com/reader/full/volume-iv-population-and-housing 63/90
Venango County, PennsylvaniaComprehensive Development Plan
February 2004
TABLE 4-8
INSTITUTIONALIZED POPULATION
CorrectionalInstitutions
NursingHomes
JuvenileInstitution
Other
Pennsylvania 76,553 114,113 6,987 16,137Venango 200 555 355 44Armstrong 57 405 0 0Butler 153 2,206 296 344Clarion 73 386 0 58Crawford 786 1,021 82 28Erie 2,574 3,005 194 592Forest 0 95 0 0Mercer 1,051 1,323 521 170Warren 63 557 0 264
Household Size and Structure
Venango County’s household structure and size within that household is very
typical for Pennsylvania with the exception of a higher percentage of 1 unit, detached
houses and a higher percent of mobile homes typical of a rural area. Persons per
household 1990 for Pennsylvania were 2.57 and the County was at 2.58. In 2000 the
state’s PPH declined to 2.48 and the County followed, declining to 2.45.
TABLE 4-9
STRUCTURE, 1990-2000
Category
Pennsylvania Venango County
1990 2000 1990 2000
Number Percent Number Percent Number Percent Number Percent
Total units4,938,14
0100.0
5,249,750
100.0 26,961 100.0 26,904 100.0
1-unit, detached 2636631 53.42,935,24
855.9 19227 71.3 19,917 74.0
1-unit, attached 909676 18.4 940,396 17.9 267 1.0 259 1.0
2 units 279700 5.7 273,798 5.2 1441 5.3 1,287 4.83 or 4 units 227788 4.6 241,745 4.6 808 3.0 792 2.9
5 to 9 units 171041 3.5 179,909 3.4 529 2.0 479 1.8
10 to 19 units 149419 3.0 131,691 2.5 360 1.3 250 0.9
20 or moreunits
143672 4.9 283,714 5.4 333 1.6 637 2.4
Mobile Home 254920 5.2 258,551 4.9 3338 12.4 3,221 12.0
Population and Housing
Page 63 of 90
Page 64
8/3/2019 Volume IV Population and Housing
http://slidepdf.com/reader/full/volume-iv-population-and-housing 64/90
Venango County, PennsylvaniaComprehensive Development Plan
February 2004
Source: 1990 and 2000 United States Census of Population and Housing
TABLE 4-10
2000 STRUCTURE BY PLANNING UNIT
NORTHERN PLANNING UNIT1 unitdetached
1 unitattach
ed
2units
3 or 4units
5-9units
10-19units
20 >Mobil
eHome
AlleghenyTownship
156 0 0 0 0 0 0 25
CanalTownship
313 0 2 0 0 0 0 118
Cherry TreeTownship
542 2 4 6 0 0 0 111
Cooperstown Borough
179 0 2 4 0 0 0 13
Cornplanter Township 1,048 6 8 3 8 0 3 103
JacksonTownship
279 2 0 0 0 3 0 187
OaklandTownship
525 0 1 0 0 0 0 101
Oil CreekTownship
304 4 1 0 0 0 4 77
Pine GroveTownship
460 3 4 4 0 0 0 108
PleasantvilleBorough
310 0 12 11 0 0 0 36
PlumTownship
339 0 2 0 0 0 0 117
PresidentTownship 588 0 3 0 0 0 0 114
RousevilleBorough
210 0 10 30 0 0 0 14
TOTAL 5,253 17 49 58 8 3 7 1124
CENTRAL PLANNING UNITS1 unitdetached
1 unitattach
ed
2units
3 or 4units
5-9units
10-19units
20 >MobileHome
City of Franklin
2,057 49 339 223 144 118 273 78
City of OilCity
3545 122 682 366 224 54 277 6
CranberryTownship
2,308 11 57 128 54 68 11 417
SugarcreekBorough
1,863 7 77 9 36 0 0 245
TOTAL 9,773 189 1,155 726 458 240 561 746
Population and Housing
Page 64 of 90
Page 65
8/3/2019 Volume IV Population and Housing
http://slidepdf.com/reader/full/volume-iv-population-and-housing 65/90
Venango County, PennsylvaniaComprehensive Development Plan
February 2004
SOUTHERN PLANNING UNIT1 unitdetached
1 unitattach
ed
2units
3 or 4units
5-9units
10-19units
20 >Mobil
eHome
Barkeyville
Borough
79 3 2 0 0 0 0 25
ClintonTownship
301 2 0 0 0 0 0 108
ClintonvilleBorough
107 4 10 2 2 2 32 85
EmlentonBorough
273 4 15 24 0 2 35 3
FrenchCreekTownship
605 4 5 0 9 0 0 175
IrwinTownship
395 3 2 0 0 0 2 165
MineralTownship
176 2 0 0 0 0 0 93
PolkBorough 163 0 18 9 0 0 0 16
RichlandTownship
275 3 7 0 0 0 0 50
RocklandTownship
954 19 6 0 0 0 0 278
Sandy CreekTownship
745 5 9 0 0 3 0 145
ScrubgrassTownship
504 2 3 0 0 0 0 90
UticaBorough
96 2 6 0 2 0 0 13
VictoryTownship
219 0 0 0 0 0 0 105
TOTAL 4,892 53 83 35 13 7 69 1,351
Population and Housing
Page 65 of 90
Page 66
8/3/2019 Volume IV Population and Housing
http://slidepdf.com/reader/full/volume-iv-population-and-housing 66/90
Venango County, PennsylvaniaComprehensive Development Plan
February 2004
TABLE 4-11
HOUSE HEATING FUEL – 2000
NORTHERN PLANNING UNIT
Utility
Gas
Bottle
d Tank
Electri
c
Fuel
Oil/Kerosene
Coal
orCoke
Wood
Other
(Solar)
None
AlleghenyTownship
3.6 34.2 4.5 39.6 0 18.0 0 0
CanalTownship
12.9 35.5 6.6 35.5 0 15.5 3.4 0.5
Cherry TreeTownship
32.9 27.3 4.7 17.5 0.3 13.5 3.4 0.3
Cooperstown Borough
45.2 7.0 43.0 0 0 4.8 0 0
Cornplanter Township
84.1 3.2 5.3 3.1 0 3.1 0.4 0.8
JacksonTownship
27.9 24.6 11.6 18.9 0 14.7 2.4 0
OaklandTownship 44.2 20.9 6.6 16.7 0 10.3 8.4 1.4Oil CreekTownship
42.2 20.9 10.2 13.2 0 12.9 0.6 0
Pine GroveTownship
78.0 5.4 1.9 3.7 1.2 8.4 1.4 0
PleasantvilleBorough
88.5 2.1 2.1 1.8 0 4.7 0.9 0
PlumTownship
17.9 23.0 5.6 29.7 0 20.2 3.6 0
PresidentTownship
67.6 6.2 4.6 10.4 0 11.2 0 0
RousevilleBorough
97.0 0 0 1.0 0 2.0 0 0
CENTRAL PLANNING UNIT
UtilityGas
Bottled Tank
Electric
FuelOil/Kerose
ne
Coalor
CokeWood
Other(Solar
)None
City Of Franklin
91.1 0.4 6.5 0.6 0 0.2 0.8 0.5
City of OilCity
93.8 0.4 3.1 0.8 0 1.1 0.6 0.1
CranberryTownship
83.1 3.9 5.8 2.0 0 4.7 0.2 0.2
SugarcreekBorough
77.9 7.5 4.0 4.8 0 5.8 0 0
Population and Housing
Page 66 of 90
Page 67
8/3/2019 Volume IV Population and Housing
http://slidepdf.com/reader/full/volume-iv-population-and-housing 67/90
Venango County, PennsylvaniaComprehensive Development Plan
February 2004
SOUTHERN PLANNING UNIT
UtilityGas
Bottled Tank
Electric
FuelOil/Kerose
ne
Coalor
CokeWood
Other(Solar)
None
BarkeyvilleBorough
0 13.0 4.3 77.2 3.3 2.2 0 0
ClintonTownship 41.2 12.9 2.6 29.8 3.3 8.8 1.5 0ClintonvilleBorough
59.7 8.1 14.5 14.0 1.8 0.9 0.9 0
EmlentonBorough
85.8 0 12.6 0.9 0 0.6 0 0
FrenchCreekTownship
51.0 14.2 7.4 14.1 0 13.3 0 0
IrwinTownship
12.6 17.2 4.3 48.3 1.0 16.2 0.4 0
MineralTownship
29.9 20.6 5.4 28.9 1.0 12.7 1.5 0
PolkBorough
90.2 1.0 3.1 1.5 0 4.1 0 0
RichlandTownship
63.8 5.2 2.8 15.0 0.7 8.7 3.8 0
RocklandTownship
58.6 8.2 4.1 12.9 0.7 15.2 0.4 0
SandyCreekTownship
84.6 5.7 4.6 2.7 0 2.4 0 0
ScrubgrassTownship
35.7 14.9 1.2 40.4 1.9 5.9 0 0
UticaBorough
80.5 2.6 9.1 5.2 0 0 2.6 0
VictoryTownship
7.8 31.3 1.2 45.8 0 13.9 0 0
Nativity and Place of Birth
This category shows where the people that live in the County come from and
where they were originally birthed. To a larger degree than is typical for Pennsylvania,
Venango County residents were born in Pennsylvania and nearly 100% were born in the
US.
Population and Housing
Page 67 of 90
Page 68
8/3/2019 Volume IV Population and Housing
http://slidepdf.com/reader/full/volume-iv-population-and-housing 68/90
Venango County, PennsylvaniaComprehensive Development Plan
February 2004
TABLE 4-12
NATIVITY AND PLACE OF BIRTH
Venango County and Pennsylvania
Category Pennsylvania Venango County
1990 2000 1990 2000
Number Percent Number Percent Number Percent Number Percent
TOTAL 11,881,643 100.0 12,281,054 100.0 59,381 100.0 57,565 100.0
Native 11,512,327 96.9 11,772,763 95.9 58,888 99.2 57,221 99.4
Born in US 11,389,926 95.9 11,620,495 94.6 58,747 99.0 56,887 98.8
Born in PA 9,527,402 80.2 9,544,251 77.7 52,920 89.1 50,866 88.4
Out of State 1,862,524 15.7 2,076,244 16.9 5,827 9.9 6,021 10.5
Born Outside US 122,401 1.0 152,268 1.2 141 0.2 334 0.6
Foreign Born 369,316 3.1 508,291 4.1 493 0.8 344 0.6Source: 1990 and 2000 United States Census of Population and Housing
Residence in 1995
This category shows the stability of the County. To a slight degree Venango
County residents tended to remain in their house since 1995 as compared to
Pennsylvania residents as a whole. However, overall the County residents reflect
housing and migration trends very similar to Pennsylvania.
TABLE 4-13RESIDENCE IN 1995
Venango County and Pennsylvania
CategoryPennsylvania Venango County
Number Percent Number Percent
Population 5 and older 11,555,538 100.0 54,307 100.0
Same house in 1995 7,333,591 63.5 36,513 67.2
Different house in US 4,056,716 35.1 17,549 32.3
Same County 2,513,167 21.7 10,993 20.2
Different County 1,543,549 13.4 6,556 12.1
Same State 874,796 7.6 4,360 8.0
Different State 668,753 5.8 2,196 4.0
Elsewhere in 1995 165,231 1.4 245 0.5
Population and Housing
Page 68 of 90
Page 69
8/3/2019 Volume IV Population and Housing
http://slidepdf.com/reader/full/volume-iv-population-and-housing 69/90
Venango County, PennsylvaniaComprehensive Development Plan
February 2004
Year Householder Moved Into Unit
The year which residents occupied their present house tends to measure the
mobility of an area. In 2000 Venango County finds itself nearly identical to statewide
figures with a healthy amount of persons moving into their present residence in the1990’s.
TABLE 4-14
YEAR HOUSEHOLDER MOVED INTO HOUSEHOLD
Venango County and Pennsylvania
CategoryPennsylvania Venango County
Number Percent Number Percent
Occupied Housing Units 4,777,003 100.0 22,747 100.0
1999 to March 2000 696,279 14.6 2,669 11.7
1995 to 1998 1,139,483 23.9 5,150 22.6
1990 to 1994 734,248 15.4 3,590 15.8
1980 to 1989 821,152 17.2 4,070 17.9
1970 to 1979 575,344 12.0 3,324 14.6
1969 or earlier 810,497 17.0 3,944 17.3
Population and Housing
Page 69 of 90
Page 70
8/3/2019 Volume IV Population and Housing
http://slidepdf.com/reader/full/volume-iv-population-and-housing 70/90
Venango County, PennsylvaniaComprehensive Development Plan
February 2004
Table 4-15
Age of Householder
Northern Planning Unit
Allegheny TownshipAGE OF HOUSEHOLDER
05
1015202530
1 5 t o 2 4 y e a r s
2 5 t o 3 4 y e a r s
3 5 t o 4 4 y e a r s
4 5 t o 5 4 y e a r s
5 5 t o 6 4 y e a r s
6 5 t o 7 4 y e a r s
7 5 t o 8 4 y e a r s
8 5 y e a r s a n d o . . .
Occupied housing
units108 100.0%
15 to 24 years 1 0.9%
25 to 34 years 14 13.0%
35 to 44 years 26 24.1%
45 to 54 years 14 13.0%
55 to 64 years 20 18.5%
65 to 74 years 26 24.1%
75 to 84 years 5 4.6%
85 years and older 2 1.9%
020406080
100120
1 5 t o 2 4 y e a r s
2 5 t o 3 4 y e a r s
3 5 t o 4 4 y e a r s
4 5 t o 5 4 y e a r s
5 5 t o 6 4 y e a r s
6 5 t o 7 4 y e a r s
7 5 t o 8 4 y e a r s
8 5 y e a r s a n d o . . .
Canal TownshipAGE OF HOUSEHOLDER
Occupied housing
units382 100.0%
15 to 24 years 11 2.9%
25 to 34 years 48 12.6%
35 to 44 years 85 22.3%
45 to 54 years 96 25.1%
55 to 64 years 64 16.8%
65 to 74 years 46 12.0%
75 to 84 years 25 6.5%
85 years and older 7 1.8%
Cherry Tree TownshipAGE OF HOUSEHOLDER
020406080
100120140
1 5 t o 2 4 y e a r s
2 5 t o 3 4 y e a r s
3 5 t o 4 4 y e a r s
4 5 t o 5 4 y e a r s
5 5 t o 6 4 y e a r s
6 5 t o 7 4 y e a r s
7 5 t o 8 4 y e a r s
8 5 y e a r s a n d o . . .
Occupied housing
units593 100.0%
15 to 24 years 11 1.9%
25 to 34 years 69 11.6%
35 to 44 years 131 22.1%
45 to 54 years 119 20.1%
55 to 64 years 112 18.9%
65 to 74 years 101 17.0%
75 to 84 years 40 6.7%
85 years and older 10 1.7%
Cooperstown BoroughAGE OF HOUSEHOLDER
Occupied housing
units187 100.0%
15 to 24 years 5 2.7%
25 to 34 years 19 10.2%
Population and Housing
Page 70 of 90
Page 71
8/3/2019 Volume IV Population and Housing
http://slidepdf.com/reader/full/volume-iv-population-and-housing 71/90
Venango County, PennsylvaniaComprehensive Development Plan
February 2004
0
10
20
30
40
50
1 5 t o 2 4 y e a r s
2 5 t o 3 4 y e a r s
3 5 t o 4 4 y e a r s
4 5 t o 5 4 y e a r s
5 5 t o 6 4 y e a r s
6 5 t o 7 4 y e a r s
7 5 t o 8 4 y e a r s
8 5 y e a r s a n d o . . .
35 to 44 years 37 19.8%
45 to 54 years 44 23.5%
55 to 64 years 35 18.7%
65 to 74 years 29 15.5%
75 to 84 years 15 8.0%
85 years and older 3 1.6%
Cornplanter TownshipAGE OF HOUSEHOLDER
0
50
100
150
200
250
1 5 t o 2 4
y e a r s
2 5 t o 3 4
y e a r s
3 5 t o 4 4
y e a r s
4 5 t o 5 4
y e a r s
5 5 t o 6 4
y e a r s
6 5 t o 7 4
y e a r s
7 5 t o 8 4
y e a r s
8 5 y e a r s a n
d o . . .
Occupied housingunits
1,034 100.0%
15 to 24 years 16 1.5%
25 to 34 years 122 11.8%35 to 44 years 210 20.3%
45 to 54 years 229 22.1%
55 to 64 years 163 15.8%
65 to 74 years 168 16.2%
75 to 84 years 107 10.3%
85 years and older 19 1.8%
020406080
100120
1 5 t o 2 4 y e a r s
2 5 t o 3 4 y e a r s
3 5 t o 4 4 y e a r s
4 5 t o 5 4 y e a r s
5 5 t o 6 4 y e a r s
6 5 t o 7 4 y e a r s
7 5 t o 8 4 y e a r s
8 5 y e a r s a n d o . . .
Jackson TownshipAGE OF HOUSEHOLDER
Occupied housingunits
422 100.0%
15 to 24 years 15 3.6%
25 to 34 years 68 16.1%
35 to 44 years 109 25.8%
45 to 54 years 88 20.9%
55 to 64 years 67 15.9%
65 to 74 years 46 10.9%
75 to 84 years 27 6.4%
85 years and older 2 0.5%
Oakland TownshipAGE OF HOUSEHOLDER
Occupied housing
units575 100.0%
15 to 24 years 6 1.0%
25 to 34 years 59 10.3%
35 to 44 years 132 23.0%
45 to 54 years 164 28.5%
55 to 64 years 90 15.7%
Population and Housing
Page 71 of 90
Page 72
8/3/2019 Volume IV Population and Housing
http://slidepdf.com/reader/full/volume-iv-population-and-housing 72/90
1
Venango County, PennsylvaniaComprehensive Development Plan
February 2004
0
50
100
150
200
1 5 t o 2 4 y e a r s
2 5 t o 3 4 y e a r s
3 5 t o 4 4 y e a r s
4 5 t o 5 4 y e a r s
5 5 t o 6 4 y e a r s
6 5 t o 7 4 y e a r s
7 5 t o 8 4 y e a r s
8 5 y e a r s a n d o . . .
65 to 74 years 80 13.9%
75 to 84 years 36 6.3%
85 years and older 8 1.4%
0
20
40
60
80
100
1 5 t o 2 4 y e a r s
2 5 t o 3 4 y e a r s
3 5 t o 4 4 y e a r s
4 5 t o 5 4 y e a r s
5 5 t o 6 4 y e a r s
6 5 t o 7 4 y e a r s
7 5 t o 8 4 y e a r s
8 5 y e a r s a n d o . . .
Oil Creek TownshipAGE OF HOUSEHOLDER
Occupied housing
units328 100.0%
15 to 24 years 5 1.5%25 to 34 years 32 9.8%
35 to 44 years 70 21.3%
45 to 54 years 81 24.7%
55 to 64 years 61 18.6%
65 to 74 years 46 14.0%
75 to 84 years 28 8.5%
85 years and older 5 1.5%
Pine Grove TownshipAGE OF HOUSEHOLDER
Occupied housing
units 511 100.0%
15 to 24 years 2 0.4%
25 to 34 years 78 15.3%
35 to 44 years 104 20.4%
45 to 54 years 113 22.1%
55 to 64 years 80 15.7%
65 to 74 years 76 14.9%
75 to 84 years 45 8.8%
85 years and older 13 2.5%
Population and Housing
Page 72 of 90
020406080
100120
1 5 t o
2 4 y e
a r s
2 5 t o
3 4 y e
a r s
3 5 t o
4 4 y e
a r s
4 5 t o
5 4 y e
a r s
5 5 t o
6 4 y e
a r s
6 5 t o
7 4 y e
a r s
7 5 t o
8 4 y e
a r s
8 5 y e a
r s a n d
o l d
e r
Page 73
8/3/2019 Volume IV Population and Housing
http://slidepdf.com/reader/full/volume-iv-population-and-housing 73/90
Venango County, PennsylvaniaComprehensive Development Plan
February 2004
01020304050607080
1 5 t o 2 4 y e a r s
2 5 t o 3 4 y e a r s
3 5 t o 4 4 y e a r s
4 5 t o 5 4
y e a r s
5 5 t o 6 4 y e a r s
6 5 t o 7 4
y e a r s
7 5 t o 8 4 y e a r s
8 5 y e a r s a n d o . . .
Pleasantville BoroughAGE OF HOUSEHOLDER
Occupied housing
units340 100.0%
15 to 24 years 8 2.4%
25 to 34 years 39 11.5%
35 to 44 years 70 20.6%
45 to 54 years 69 20.3%
55 to 64 years 43 12.6%
65 to 74 years 63 18.5%
75 to 84 years 42 12.4%
85 years and older 6 1.8%
Plum TownshipAGE OF HOUSEHOLDER
0
2040
60
80
100
1 5 t o 2 4 y e a r s
2 5 t o 3 4 y e a r s
3 5 t o 4 4 y e a r s
4 5 t o 5 4 y e a r s
5 5 t o 6 4 y e a r s
6 5 t o 7 4 y e a r s
7 5 t o 8 4 y e a r s
8 5 y e a r s a n d o . . .
Occupied housingunits
391 100.0%
15 to 24 years 9 2.3%
25 to 34 years 51 13.0%
35 to 44 years 82 21.0%
45 to 54 years 88 22.5%
55 to 64 years 65 16.6%
65 to 74 years 60 15.3%
75 to 84 years 30 7.7%
85 years and older 6 1.5%
0102030405060
1 5 t o 2 4 y e a r s
2 5 t o 3 4 y e a r s
3 5 t o 4 4 y e a r s
4 5 t o 5 4 y e a r s
5 5 t o 6 4 y e a r s
6 5 t o 7 4 y e a r s
7 5 t o 8 4 y e a r s
8 5 y e a r s a n d o . . .
President TownshipAGE OF HOUSEHOLDER
Occupied housing
units241 100.0%
15 to 24 years 7 2.9%
25 to 34 years 16 6.6%
35 to 44 years 44 18.3%
45 to 54 years 43 17.8%
55 to 64 years 45 18.7%
65 to 74 years 51 21.2%
75 to 84 years 32 13.3%
85 years and older 3 1.2%
Rouseville BoroughAGE OF HOUSEHOLDER
Occupied housing
units204 100.0%
15 to 24 years 3 1.5%
25 to 34 years 28 13.7%
35 to 44 years 29 14.2%
45 to 54 years 39 19.1%
Population and Housing
Page 73 of 90
Page 74
8/3/2019 Volume IV Population and Housing
http://slidepdf.com/reader/full/volume-iv-population-and-housing 74/90
Venango County, PennsylvaniaComprehensive Development Plan
February 2004
0
20
40
60
80
100
1 5 t o 2 4 y e a r s
2 5 t o 3 4 y e a r s
3 5 t o 4 4 y e a r s
4 5 t o 5 4 y e a r s
5 5 t o 6 4 y e a r s
6 5 t o 7 4 y e a r s
7 5 t o 8 4 y e a r s
8 5 y e a r s a n d o . . .
55 to 64 years 25 12.3%
65 to 74 years 80 39.2%
75 to 84 years 44 21.6%
85 years and older 27 13.2%
NORTHERN PLANNING UNIT TOTAL
A l l e g h e n y T o w n s h i p
C a n a l T o w n s h i p
C h e r r y T r e e T o w n s h i p
C o o p e r s t o w n B o r o u g h
C o r n p l a n t e r T o w n s h i p
J a c k s o n T o w n s h i p
O a k l a n d T o w n s h i p
O i l C r e e k T o w n s h i p
P i n e G r o v e T o w n s h i p
P l e a s a n t v i l l e B o r o u g h
P l u m T o w n s h i p
P r e s i d e n t T o w n s h i p
R o u s e v i l l e B o r o u g h
T O T A L
15 to
24
years
1 11 11 5 16 15 6 5 2 8 9 7 3 99
25 to
34years 14 48 69 19 122 68 59 32 78 39 51 16 28 643
35 to44
years
26 85 131 37 210 109 132 70 104 70 82 44 29 1,129
45 to
54years
14 96 119 44 229 88 164 81 113 69 88 43 39 1,187
55 to
64
years
20 64 112 35 163 67 90 61 80 43 65 45 25 870
65 to
74
years
26 46 101 29 168 46 80 46 76 63 60 51 80 872
75 to84
years
5 25 40 15 107 27 36 28 45 42 30 32 44 476
85
years>
2 7 10 3 19 2 8 5 13 6 6 3 27 111
TOTAL 108 382 593 187 1,034 422 575 328 511 340 391 241 275 5,387
Population and Housing
Page 74 of 90
Page 75
8/3/2019 Volume IV Population and Housing
http://slidepdf.com/reader/full/volume-iv-population-and-housing 75/90
Venango County, PennsylvaniaComprehensive Development Plan
February 2004
CENTRAL PLANNING UNIT
0100200
300400500600700
1 5 t o 2 4 y e a r s
2 5 t o 3 4 y e a r s
3 5 t o 4 4 y e a r s
4 5 t o 5 4 y e a r s
5 5 t o 6 4 y e a r s
6 5 t o 7 4 y e a r s
7 5 t o 8 4 y e a r s
8 5 y e a r s a n d o . . .
City of FranklinAGE OF HOUSEHOLDER
Occupied housingunits 3,030 100.0%
15 to 24 years 184 6.1%
25 to 34 years 397 13.1%
35 to 44 years 550 18.2%
45 to 54 years 577 19.0%
55 to 64 years 420 13.9%
65 to 74 years 436 14.4%
75 to 84 years 353 11.7%
85 years and older 113 3.7%
City of Oil City
AGE OF HOUSEHOLDER
0200400600800
1000
1200
1 5 t o 2 4 y e a r s
2 5 t o 3 4 y e a r s
3 5 t o 4 4 y e a r s
4 5 t o 5 4 y e a r s
5 5 t o 6 4 y e a r s
6 5 t o 7 4 y e a r s
7 5 t o 8 4 y e a r s
8 5 y e a r s a n d o . . .
Occupied housing
units4,762 100.0%
15 to 24 years 239 5.0%
25 to 34 years 689 14.5%
35 to 44 years 982 20.6%
45 to 54 years 923 19.4%
55 to 64 years 554 11.6%
65 to 74 years 650 13.6%
75 to 84 years 559 11.7%
85 years and older 166 3.5%
0100200300400500600700
1 5 t o 2 4 y e a r s
2 5 t o 3 4 y e a r s
3 5 t o 4 4 y e a r s
4 5 t o 5 4 y e a r s
5 5 t o 6 4 y e a r s
6 5 t o 7 4 y e a r s
7 5 t o 8 4 y e a r s
8 5 y e a r s a n d o . . .
Cranberry TownshipAGE OF HOUSEHOLDER
Occupied housing
units2,843 100.0%
15 to 24 years 120 4.2%
25 to 34 years 326 11.5%
35 to 44 years 611 21.5%
45 to 54 years 602 21.2%
55 to 64 years 409 14.4%
65 to 74 years 414 14.6%
75 to 84 years 285 10.0%
85 years and older 76 2.7%
Population and Housing
Page 75 of 90
Page 76
8/3/2019 Volume IV Population and Housing
http://slidepdf.com/reader/full/volume-iv-population-and-housing 76/90
Venango County, PennsylvaniaComprehensive Development Plan
February 2004
Sugarcreek BoroughAGE OF HOUSEHOLDER
0
100
200
300
400
500
1 5 t o 2 4 y e a r s
2 5 t o 3 4 y e a r s
3 5 t o 4 4 y e a r s
4 5 t o 5 4 y e a r s
5 5 t o 6 4 y e a r s
6 5 t o 7 4 y e a r s
7 5 t o 8 4 y e a r s
8 5 y e a r s a n d o . .
.
Occupied housing
units2,093 100.0%
15 to 24 years 59 2.8%
25 to 34 years 275 13.1%
35 to 44 years 421 20.1%
45 to 54 years 414 19.8%
55 to 64 years 364 17.4%
65 to 74 years 327 15.6%
75 to 84 years 187 8.9%
85 years and older 46 2.2
Central Planning Unit Totals
Population and Housing
Page 76 of 90
C i t y o f F r a n k l i n
C i t y o f O i l C i t y
C r a n b e r r y T o w n s h i p
S u g a r c r e e k B o r o u g h
T O T A L
15 to 24 years 184 239 120 59 60225 to 34 years 397 689 326 275 1,68735 to 44 years 550 982 611 421 2,56445 to 54 years 577 923 602 414 2,51655 to 64 years 420 554 409 364 1,747
65 to 74 years 436 650 414 327 1,82775 to 84 years 353 559 285 187 1,38485 years > 113 166 76 46 401TOTAL 3,030 4,762 2,843 2,093 12,728
Page 77
8/3/2019 Volume IV Population and Housing
http://slidepdf.com/reader/full/volume-iv-population-and-housing 77/90
Venango County, PennsylvaniaComprehensive Development Plan
February 2004
SOUTHERN PLANNING UNIT
05
10
15202530
1 5 t o 2 4 y e a r s
2 5 t o 3 4 y e a r s
3 5 t o 4 4 y e a r s
4 5 t o 5 4 y e a r s
5 5 t o 6 4 y e a r s
6 5 t o 7 4 y e a r s
7 5 t o 8 4 y e a r s
8 5 y e a r s a n d o . . .
Barkeyville BoroughAGE OF HOUSEHOLDER
Occupied housingunits 91 100.0%
15 to 24 years 3 3.3%
25 to 34 years 11 12.1%
35 to 44 years 17 18.7%
45 to 54 years 24 26.4%
55 to 64 years 7 7.7%
65 to 74 years 16 17.6%
75 to 84 years 12 13.2%
85 years and older 1 1.1%
Clinton TownshipAGE OF HOUSEHOLDER
010203040506070
1 5 t o 2 4 y e a r s
2 5 t o 3 4 y e a r s
3 5 t o 4 4 y e a r s
4 5 t o 5 4 y e a r s
5 5 t o 6 4 y e a r s
6 5 t o 7 4 y e a r s
7 5 t o 8 4 y e a r s
8 5 y e a r s a n d o . . .
Occupied housing
units278 100.0%
15 to 24 years 10 3.6%
25 to 34 years 37 13.3%
35 to 44 years 61 21.9%
45 to 54 years 54 19.4%
55 to 64 years 48 17.3%
65 to 74 years 44 15.8%
75 to 84 years 22 7.9%
85 years and older 2 0.7%
0
10
20
30
40
50
1 5 t o 2 4 y e a r s
2 5 t o 3 4 y e a r s
3 5 t o 4 4 y e a r s
4 5 t o 5 4 y e a r s
5 5 t o 6 4 y e a r s
6 5 t o 7 4 y e a r s
7 5 t o 8 4 y e a r s
8 5 y e a r s a n d o . . .
Clintonville BoroughAGE OF HOUSEHOLDER
Occupied housing
units215 100.0%
15 to 24 years 13 6.0%
25 to 34 years 41 19.1%
35 to 44 years 33 15.3%
45 to 54 years 37 17.2%
55 to 64 years 33 15.3%
65 to 74 years 23 10.7%
75 to 84 years 28 13.0%
85 years and older 7 3.3%
Emlenton BoroughAGE OF HOUSEHOLDER
Occupied housing
units319 100.0%
15 to 24 years 14 4.4%
25 to 34 years 43 13.5%
Population and Housing
Page 77 of 90
Page 78
8/3/2019 Volume IV Population and Housing
http://slidepdf.com/reader/full/volume-iv-population-and-housing 78/90
Venango County, PennsylvaniaComprehensive Development Plan
February 2004
0102030405060
1 5 t o 2 4 y e a r s
2 5 t o 3 4 y e a r s
3 5 t o 4 4 y e a r s
4 5 t o 5 4 y e a r s
5 5 t o 6 4 y e a r s
6 5 t o 7 4 y e a r s
7 5 t o 8 4 y e a r s
8 5 y e a r s a n d o . . .
35 to 44 years 56 17.6%
45 to 54 years 54 16.9%
55 to 64 years 49 15.4%
65 to 74 years 43 13.5%
75 to 84 years 38 11.9%
85 years and older 22 6.9%
0
50
100
150
200
1 5 t o 2 4 y e a r s
2 5 t o 3 4 y e a r s
3 5 t o 4 4 y e a r s
4 5 t o 5 4 y e a r s
5 5 t o 6 4 y e a r s
6 5 t o 7 4 y e a r s
7 5 t o 8 4 y e a r s
8 5 y e a r s a n d o . . .
French Creek TownshipAGE OF HOUSEHOLDER
Occupied housing
units662 100.0%
15 to 24 years 16 2.4%25 to 34 years 64 9.7%
35 to 44 years 165 24.9%
45 to 54 years 160 24.2%
55 to 64 years 113 17.1%
65 to 74 years 85 12.8%
75 to 84 years 43 6.5%
85 years and older 16 2.4%
Irwin TownshipAGE OF HOUSEHOLDER
020406080
100120140
1 5 t o 2 4 y e a r s
2 5 t o 3 4 y e a r s
3 5 t o 4 4 y e a r s
4 5 t o 5 4 y e a r s
5 5 t o 6 4 y e a r s
6 5 t o 7 4 y e a r s
7 5 t o 8 4 y e a r s
8 5 y e a r s a n d o . . .
Occupied housing
units494 100.0%
15 to 24 years 19 3.8%
25 to 34 years 75 15.2%
35 to 44 years 114 23.1%
45 to 54 years 117 23.7%
55 to 64 years 67 13.6%
65 to 74 years 64 13.0%
75 to 84 years 31 6.3%
85 years and older 7 1.4%
Mineral TownshipAGE OF HOUSEHOLDER
Occupied housingunits
208 100.0%
15 to 24 years 3 1.4%
25 to 34 years 26 12.5%
35 to 44 years 51 24.5%
45 to 54 years 49 23.6%
Population and Housing
Page 78 of 90
Page 79
8/3/2019 Volume IV Population and Housing
http://slidepdf.com/reader/full/volume-iv-population-and-housing 79/90
Venango County, PennsylvaniaComprehensive Development Plan
February 2004
0102030405060
1 5 t o 2 4 y e a r s
2 5 t o 3 4 y e a r s
3 5 t o 4 4 y e a r s
4 5 t o 5 4 y e a r s
5 5 t o 6 4 y e a r s
6 5 t o 7 4 y e a r s
7 5 t o 8 4 y e a r s
8 5 y e a r s a n d o . . .
55 to 64 years 34 16.3%
65 to 74 years 30 14.4%
75 to 84 years 10 4.8%
85 years and older 5 2.4%
Polk BoroughAGE OF HOUSEHOLDER
0
10
20
30
40
50
1 5 t o 2 4 y e a r s
2 5 t o 3 4 y e a r s
3 5 t o 4 4 y e a r s
4 5 t o 5 4 y e a r s
5 5 t o 6 4 y e a r s
6 5 t o 7 4 y e a r s
7 5 t o 8 4 y e a r s
8 5 y e a r s a n d o . . .
Occupied housing
units196 100.0%
15 to 24 years 7 3.6%25 to 34 years 33 16.8%
35 to 44 years 40 20.4%
45 to 54 years 45 23.0%
55 to 64 years 22 11.2%
65 to 74 years 21 10.7%
75 to 84 years 24 12.2%
85 years and older 4 2.0%
010203040
506070
1 5 t o 2 4 y e a r s
2 5 t o 3 4 y e a r s
3 5 t o 4 4 y e a r s
4 5 t o 5 4 y e a r s
5 5 t o 6 4 y e a r s
6 5 t o 7 4 y e a r s
7 5 t o 8 4 y e a r s
8 5 y e a r s a n d o . . .
Richland TownshipAGE OF HOUSEHOLDER
Occupied housing
units291 100.0%
15 to 24 years 7 2.4%
25 to 34 years 41 14.1%
35 to 44 years 57 19.6%
45 to 54 years 60 20.6%
55 to 64 years 43 14.8%
65 to 74 years 47 16.2%
75 to 84 years 26 8.9%
85 years and older 10 3.4%
Rockland TownshipAGE OF HOUSEHOLDER
Occupied housing
units556 100.0%
15 to 24 years 10 1.8%
25 to 34 years 53 9.5%
35 to 44 years 115 20.7%
45 to 54 years 120 21.6%
Population and Housing
Page 79 of 90
Page 80
8/3/2019 Volume IV Population and Housing
http://slidepdf.com/reader/full/volume-iv-population-and-housing 80/90
Venango County, PennsylvaniaComprehensive Development Plan
February 2004
020406080
100120140
1 5 t o 2 4 y e a r s
2 5 t o 3 4 y e a r s
3 5 t o 4 4 y e a r s
4 5 t o 5 4 y e a r s
5 5 t o 6 4 y e a r s
6 5 t o 7 4 y e a r s
7 5 t o 8 4 y e a r s
8 5 y e a r s a n d o . . .
55 to 64 years 95 17.1%
65 to 74 years 101 18.2%
75 to 84 years 53 9.5%
85 years and older 9 1.6%
0
50
100
150
200
250
1 5 t o 2 4 y e a r s
2 5 t o 3 4 y e a r s
3 5 t o 4 4 y e a r s
4 5 t o 5 4 y e a r s
5 5 t o 6 4 y e a r s
6 5 t o 7 4 y e a r s
7 5 t o 8 4 y e a r s
8 5 y e a r s
a n d o . . .
Sandy Creek Township
AGE OF HOUSEHOLDER
Occupied housing
units832 100.0%
15 to 24 years 14 1.7%
25 to 34 years 82 9.9%
35 to 44 years 174 20.9%
45 to 54 years 200 24.0%
55 to 64 years 154 18.5%
65 to 74 years 131 15.7%
75 to 84 years 62 7.5%
85 years and older 15 1.8%
Scrubgrass TownshipAGE OF HOUSEHOLDER
01020304050
607080
1 5 t o 2 4 y e a r s
2 5 t o 3 4 y e a r s
3 5 t o 4 4 y e a r s
4 5 t o 5 4 y e a r s
5 5 t o 6 4 y e a r s
6 5 t o 7 4 y e a r s
7 5 t o 8 4 y e a r s
8 5 y e a r s a n d o . . .
Occupied housing
units320 100.0%
15 to 24 years 9 2.8%
25 to 34 years 31 9.7%
35 to 44 years 76 23.8%
45 to 54 years 52 16.3%
55 to 64 years 56 17.5%
65 to 74 years 41 12.8%
75 to 84 years 45 14.1%
85 years and older 10 3.1%
Utica BoroughAGE OF HOUSEHOLDER
Occupied housingunits
79 100.0%
15 to 24 years 2 2.5%
25 to 34 years 12 15.2%
35 to 44 years 19 24.1%
45 to 54 years 20 25.3%
Population and Housing
Page 80 of 90
Page 81
8/3/2019 Volume IV Population and Housing
http://slidepdf.com/reader/full/volume-iv-population-and-housing 81/90
Venango County, PennsylvaniaComprehensive Development Plan
February 2004
0
5
10
15
20
25
1 5 t o 2 4 y e a r s
2 5 t o 3 4 y e a r s
3 5 t o 4 4 y e a r s
4 5 t o 5 4 y e a r s
5 5 t o 6 4 y e a r s
6 5 t o 7 4 y e a r s
7 5 t o 8 4 y e a r s
8 5 y e a r s a n d o . . .
55 to 64 years 9 11.4%
65 to 74 years 14 17.7%
75 to 84 years 3 3.8%
85 years and older 0 0.0%
Victory TownshipAGE OF HOUSEHOLDER
0102030405060
1 5 t o 2 4 y e a r s
2 5 t o 3 4 y e a r s
3 5 t o 4 4 y e a r s
4 5 t o 5 4 y e a r s
5 5 t o 6 4 y e a r s
6 5 t o 7 4 y e a r s
7 5 t o 8 4 y e a r s
8 5 y e a r s a n d o . . .
Occupied housing
units162 100.0%
15 to 24 years 6 3.7%25 to 34 years 19 11.7%
35 to 44 years 36 22.2%
45 to 54 years 48 29.6%
55 to 64 years 15 9.3%
65 to 74 years 24 14.8%
75 to 84 years 13 8.0%
85 years and older 1 0.6%
Population and Housing
Page 81 of 90
Page 82
8/3/2019 Volume IV Population and Housing
http://slidepdf.com/reader/full/volume-iv-population-and-housing 82/90
Venango County, PennsylvaniaComprehensive Development Plan
February 2004
SOUTHERN PLANNING UNIT TOTAL
B a r k e y v i l l e B o r o u g h
C l i n t o n T o w
n s h i p
C l i n t o n v i l l e B o r o u g h
E m l e n t o n B o
r o u g h
F r e n c h C r e e k T
o w n s h i p
I r w i n T o w n
s h i p
M i n e r a l T o w
n s h i p
P o l k B o r o u g h
R i c h l a n d T o w
n s h i p
R o c k l a n d T o w
n s h i p
S a n d y C r e e k T o w n s h i p
S c r u b g r a s s T o
w n s h i p
U t i c a B o r o
u g h
V i c t o r y T o w n s h i p
T O T A L
15 to
24
years
3 10 13 14 16 19 3 1 7 10 14 9 2 6 127
25 to
34
years11 37 41 43 64 75 26 33 41 53 82 31 12 19 568
35 to
44
years
17 61 33 56 165 114 51 40 57 115 174 76 19 36 1,014
45 to
54years
24 54 37 54 160 117 49 45 60 120 200 52 20 48 1,040
55 to64
years
7 48 33 49 113 67 34 22 43 95 154 56 9 15 745
65 to
74
years
16 44 23 43 85 64 30 21 47 101 131 41 14 24 684
75 to
84
years
12 22 28 38 43 31 10 24 26 53 62 45 3 13 410
85
years >1 2 7 22 16 7 5 4 10 9 15 10 0 1 109
TOTAL 91 278 215 319 662 494 208 190 291 556 832 320 79 162 4,697
Population and Housing
Page 82 of 90
Page 83
8/3/2019 Volume IV Population and Housing
http://slidepdf.com/reader/full/volume-iv-population-and-housing 83/90
.........
Venango County, Pennsylvania
Comprehensive Development Plan
October 2003
Pennsylvania
AGE OF HOUSEHOLDER
Occupied housing units 4,777,003 100.0%
15 to 24 years 193,732 4.1%
25 to 34 years 718,454 15.0%
35 to 44 years 1,026,107 21.5%
45 to 54 years 960,175 20.1%
55 to 64 years 664,011 13.9%
65 to 74 years 609,711 12.8%
75 to 84 years 473,841 9.9%
85 years and older 130,972 2.7%
Venango County
AGE OF HOUSEHOLDER
Occupied housing units 22,747 100.0%
15 to 24 years 834 3.7%
25 to 34 years 2,898 12.7%
35 to 44 years 4,707 20.7%45 to 54 years 4,743 20.9%
55 to 64 years 3,362 14.8%
65 to 74 years 3,347 14.7%
75 to 84 years 2,253 9.9%
85 years and older 603 2.7%
Armstrong County
AGE OF HOUSEHOLDER
Occupied housing units 29,005 100.0%
15 to 24 years 778 2.7%
25 to 34 years 3,708 12.8%
35 to 44 years 6,047 20.8%
45 to 54 years 5,781 19.9%
55 to 64 years 4,134 14.3%
65 to 74 years 4,148 14.3%
75 to 84 years 3,438 11.9%
85 years and older 971 3.3%
Butler County
AGE OF HOUSEHOLDER
Occupied housing units 65,862 100.0%
15 to 24 years 2,418 3.7%
25 to 34 years 9,809 14.9%
35 to 44 years 15,634 23.7%
45 to 54 years 13,973 21.2%
55 to 64 years 9,044 13.7%
65 to 74 years 7,405 11.2%
75 to 84 years 5,855 8.9%
85 years and older 1,724 2.6%
Clarion County
AGE OF HOUSEHOLDER
Occupied housing units 16,052 100.0%
15 to 24 years 1,269 7.9%
25 to 34 years 2,207 13.7%
35 to 44 years 3,035 18.9%45 to 54 years 3,072 19.1%
55 to 64 years 2,358 14.7%
65 to 74 years 2,130 13.3%
75 to 84 years 1,525 9.5%
85 years and older 456 2.8%
Crawford County
AGE OF HOUSEHOLDER
Occupied housing units 34,678 100.0%
15 to 24 years 1,396 4.0%
25 to 34 years 4,985 14.4%
35 to 44 years 7,052 20.3%
45 to 54 years 7,161 20.6%
55 to 64 years 5,170 14.9%
65 to 74 years 4,577 13.2%
75 to 84 years 3,384 9.8%
85 years and older 953 2.7%
Housing and Households
Page 83
Page 84
8/3/2019 Volume IV Population and Housing
http://slidepdf.com/reader/full/volume-iv-population-and-housing 84/90
.........
Venango County, Pennsylvania
Comprehensive Development Plan
February 2004
Erie County
AGE OF HOUSEHOLDER
Occupied housing units 106,507 100.0%
15 to 24 years 5,726 5.4%
25 to 34 years 16,576 15.6%
35 to 44 years 22,661 21.3%
45 to 54 years 21,890 20.6%
55 to 64 years 14,209 13.3%
65 to 74 years 12,677 11.9%
75 to 84 years 10,125 9.5%
85 years and older 2,643 2.5%
Forest County
AGE OF HOUSEHOLDER
Occupied housing units 2,000 100.0%
15 to 24 years 25 1.3%
25 to 34 years 187 9.3%35 to 44 years 348 17.4%
45 to 54 years 379 18.9%
55 to 64 years 410 20.5%
65 to 74 years 350 17.5%
75 to 84 years 246 12.3%
85 years and older 55 2.8%
Mercer County
AGE OF HOUSEHOLDER
Occupied housing units 46,712 100.0%
15 to 24 years 1,586 3.4%
25 to 34 years 6,222 13.3%
35 to 44 years 9,220 19.7%
45 to 54 years 9,179 19.7%
55 to 64 years 6,747 14.4%
65 to 74 years 6,785 14.5%
75 to 84 years 5,540 11.9%
85 years and older 1,433 3.1%
Warren County
AGE OF HOUSEHOLDER
Occupied housing units 17,696 100.0%
15 to 24 years 534 3.0%
25 to 34 years 2,357 13.3%35 to 44 years 3,696 20.9%
45 to 54 years 3,682 20.8%
55 to 64 years 2,798 15.8%
65 to 74 years 2,425 13.7%
75 to 84 years 1,754 9.9%
85 years and older 450 2.5%
Analysis by Planning Unit
According to U.S. Census statistics for the three (3) previous Census periods (Table 4-
1), the Northern Planning Unit communities experienced a total increase of 1,269 housing units
from 1980 to 2000. This represents a fifteen percent (15%) increase or about 9.75% annually
for the region. President Township’s housing unit total increased by almost 250% between 1980
and 1990 as 498 new housing units were developed. During the same decade, both
Pleasantville and Rouseville Boroughs lost 22 housing units. Between 1990 and the year 2000,
Allegheny Township (16.4%), Jackson Township (9.24%) and Oakland Township (9.55%)
experienced the most significant housing development.
In the Central Planning Unit, both Franklin and Oil City experienced decreases in
housing units during both decades, and about 7% of their respective totals (7.2% and 6.9%) for
the twenty year period. A call to the Census Bureau to discuss how a community actually
“loses” housing units did not clarify the statistic because of the wide parameters used to
determine when a structure is classified as a housing unit. In the end it is a subjective call by
the field enumerator. Both Cranberry Township and Sugarcreek Borough showed net gains in
total housing units during both decades.
Housing and Households
Page 84
Page 85
8/3/2019 Volume IV Population and Housing
http://slidepdf.com/reader/full/volume-iv-population-and-housing 85/90
.........
Venango County, Pennsylvania
Comprehensive Development Plan
February 2004
The Southern Planning Unit was a mixed bag of data in terms of net housing unit gains
and loses. Some municipalities gained units in one decade, but lost units in another. For
instance, between 1980 and 1990 French Creek Township lost 75 housing units, but during the
following decade, gained 50 back. Rockland Township saw a 149% increase in housing units,
between 1980 and 1990 and then a 4% decrease the following decade. Sandy Creek Township
added 39.2% more housing units to its total during the 1980’s and then lost 8.9% the following
decade. By contrast, Irwin Township’s housing stock expanded by 19.4% in the 1980’s and by
14.6% during the 1990’s.
As observed, almost half of all seasonal housing units in Venango County are located in
President Township in the Northern Planning Unit and Rockland Township in the Southern
Planning Unit. Overall, the Southern Planning Unit includes the highest number of seasonal
units (1,497), in comparison with the other two planning units. There is probably a link between
the high number of seasonal housing units in these communities and the location of several
State Game Lands within their boundaries, or in close proximity to these Townships. A
percentage of the total number of seasonal housing units are most likely smaller, hunting cabins
or vacation homes used during certain game seasons and the summer months.
Housing tenure denotes the status of the person or family occupying the housing unit. In
“bedroom communities” a figure of 90% or higher owner-occupied housing is typical. In the
case of the Northern Planning Unit and one community in the Southern Planning Unit,
percentages that high were reported. While the trend has been a steady increase in owner-
occupied housing Countywide, in the Central Planning Unit, both cities, Franklin (42.4%) and Oil
City (37.5%) exhibited a significant percentage of renter-occupied housing units, in the year
2000. This characteristic relates to the issue of property maintenance. Owner-occupied
housing is generally better maintained.
In the Northern Planning Unit, Rouseville Borough (21.1%) and Jackson Township
(18.5%) had the highest percentage of renter occupied housing units, while Oakland Township
(7.3%) had the lowest percentage. Sugarcreek Borough, in the Central Planning Unit, reported
16.2% of the total number of housing units, however, the combined total for all four (4)
communities in the Central Planning Unit (3,963) is six times the number of housing units in the
Northern Planning Unit and five times the number in the Southern Planning Unit. This
perspective permits the reader to appreciate the scale of the residential codes enforcement
activity in the two cities in the County.
According to the statistical data provided by the U.S. Census Bureau and the
Housing and Households
Page 85
Page 86
8/3/2019 Volume IV Population and Housing
http://slidepdf.com/reader/full/volume-iv-population-and-housing 86/90
.........
Venango County, Pennsylvania
Comprehensive Development Plan
February 2004
Pennsylvania Department of Community and Economic Development (Table 4-4), the great
majority of all housing in Venango County is valued at less than $100,000. In the Northern
Planning Unit, nearly 95% of the three (3) Borough’s housing stock is valued at less than
$100,000, as is Plum Township. Rouseville Borough (97.1%), Cooperstown Borough (96.4%),
and Pleasantville Borough (94.2%) have very few examples of housing units valued in excess of
$100,000. Only Cranberry Township in the Central Planning unit reported less than 90% of all
housing valued at $100,000. In the Southern Planning Unit, Clintonville borough (95.4%), Polk
Borough (98.3%), Utica Borough (100%) and Mineral Township (91.1%) each reported at least
90% of all housing as valued at $100,000 or less. In the case of Utica and Polk Borough,
virtually all housing units are valued at less than $100,000 except for a few in Polk. These
values have as much to do with when the housing units were built as the size and materials
used.
In terms of the chronology of settlement as it relates to housing development, the
Central Planning Unit communities experienced their formative years prior to 1960. Oil City’s
housing stock is not only the largest, but the oldest in Venango County with 83.9% of the total
housing units built prior to 1960. In all four (4) communities in the Central Planning Unit, the
majority of all housing was built prior to 1960. Two of the three Boroughs in the Northern
Planning Unit posted high percentages of housing built prior to 1960, Rouseville Borough (81%)
and Pleasantville Borough (66.2%). The same characteristics can be identified in the Southern
Planning Unit with Barkeyville Borough having 57.8% of all housing built before 1960, Polk
Borough at 65.5%, Utica Borough at 73.9% and Emlenton Borough at 75.5%. Only Clintonville
Borough had less than a majority of all housing built before 1960 with 46.7%.
Recent housing development has occurred in several municipalities also (Table 4-4). In
the Northern Planning Unit, three municipalities posted double digit percentages in the 1990’s.
Oakland Township at 12.3%, Oil Creek Township at 14.5%, and Cherry Tree Township at 14.9%
of each community’s total housing units, were built during the 1990’s. Two Townships, Victory
(23.1%) and Mineral (22.1%) saw more than 20% of their total housing units constructed during
the previous decade. In addition, Irwin Township (18.2%), French Creek Township (14.6%),
Clinton Township (13.1%), Scrubgrass Township (12.4%), Rockland Township (12.2%) and
Barkeyville Borough (12.8%) all reported housing development activity during the 1990’s.
In all three planning units, the great majority of housing is of the single-family detached
variety, as previously discussed. There are a greater number of multi-family structures as a
percentage of the total number of housing units in Franklin and Oil City, and both cities have the
Housing and Households
Page 86
Page 87
8/3/2019 Volume IV Population and Housing
http://slidepdf.com/reader/full/volume-iv-population-and-housing 87/90
.........
Venango County, Pennsylvania
Comprehensive Development Plan
February 2004
only garden apartments or high-rise apartment buildings in the County with the exception of one
in Clintonville Borough and one in Emlenton Borough, both in the Southern Planning Unit.
There are still homes using wood as a primary heating fuel in the County. The highest
percentages of the total housing units by municipality occurred in Northern Planning Unit
communities. Plum Township at 20.2%, Allegheny Township at 18%, and Canal Township at
15.5% led the list. Sugarcreek Borough led the list in the Central Planning Unit with 5.8% of all
housing using wood as a primary heating fuel. Southern Planning Unit communities such as
Irwin Township (16.2%), Rockland Township (15.2%) and Victory Township (13.9%) topped the
percentages. There were eight communities of the thirteen in the Northern Planning Unit which
reported double digit percentages of housing using wood as a primary heating fuel, as opposed
to five communities in the Southern Planning Unit of the fourteen.
The 45 to 54 year age cohort in the Northern Planning Unit is the range within which the
highest percentage of householders is requested in seven of the thirteen municipalities. In four
communities, the 35 to 44 year cohort has the highest percentage, while in President Township
the 55 to 64 year cohort is highest in terms of householders age, and in Rouseville Borough,
nearly 40% (39.2) of the householders are between ages 65 and 74.
In the Central Planning Unit, the 35 to 44 year cohort has the highest percentage of
householders in three of the four municipalities, while Franklin’s highest percentage of
householders fall into the 35 to 44 age cohort (20.6%) in Oil City. The next highest percentage
falls in the 45 to 54 year cohort (19.4%).
Eight communities in the Southern Planning Unit exhibited the highest percentage of
householder in the 45 to 54 age cohort in the year 2000. Another five (5) communities exhibited
higher percentages of householders in the age 35 to 44 cohort and one community in
Clintonville Borough, reported the highest percentage in the 25 to 34 age cohort.
In comparison to Pennsylvania and the eight surrounding Counties, Venango is one of
four Counties with similar householder age ranges (in the 45 to 54 year cohort). In two of the
four Counties, Mercer and Warren, the two cohorts 35 to 44 and 45 to 54 are almost identical in
number of housing units and percentages of the total. Pennsylvania’s highest percentage of
householders falls into the 35 to 44 year age cohort and Forest County’s highest percentage of
householders in occupied housing units, falls into the 55 to 64 year age cohort.
SUMMARY
Housing and Households
Page 87
Page 88
8/3/2019 Volume IV Population and Housing
http://slidepdf.com/reader/full/volume-iv-population-and-housing 88/90
.........
Venango County, Pennsylvania
Comprehensive Development Plan
February 2004
In 2000 Venango County had 26,904 total housing units, a -.21% decrease from26,961 units in 1990.
Housing growth slowed considerably since the 1980’s when the housing stock
increased by nearly 11% countywide.
There are 31 municipalities in Venango County of which 19 experiencedadditions to their housing stocks – fifteen (15) townships and four (4) boroughs.
Of these municipalities townships accounted for 477 of the 502 units of themunicipalities that increased their housing stock - growth areas of the countywere largely a product of suburban and rural housing starts.
Oil City and Franklin accounted for a majority of the unit losses.
Almost 40% of the County’s stock was built prior to 1939.
During the 1950's and 60's when many communities were experiencingconsistent 12-14% housing growths per decade, the County’s housing grew at ahigher pace for both decades.
Housing starts have continued through 1990’s, but the loss of older units hasoffset the growth of the total housing stock.
POLICY RECOMMENDATIONS
GOAL No. 4 - To provide equal opportunities for all residents to obtain safe, affordable,
housing. Affordable housing is defined as housing that annually costs no more thanthirty-five (35) percent of the median household income as defined in the most recentUnited States Census Information.
1. To encourage a variety of housing choices among the types of housingpermitted by local regulations.
Immediate PriorityDraft ordinance language for use by municipalities whichestablishes permitted locations for all types of housing in allmunicipalities. - Planning Commission
Short Term PriorityImprove the “Venango County Affordable Housing Trust Fund” toprovide financial assistance to low and moderate income personsto become homeowners. - County Commissioners and VenangoCounty Housing Authority.
2. To promote municipal regulations incorporating a variety of housing choicesavailable to the residents of Venango County.
Housing and Households
Page 88
Page 89
8/3/2019 Volume IV Population and Housing
http://slidepdf.com/reader/full/volume-iv-population-and-housing 89/90
.........
Venango County, Pennsylvania
Comprehensive Development Plan
February 2004
Immediate PriorityDraft ordinance language for use by municipalities to establishincentives for developers of major residential projects to provide apercentage of owner occupied affordable housing in their
development. - Planning Commission
3. To identify specifically designated growth areas for higher densitydevelopment where infrastructure can be extended and better utilized.
Immediate PriorityAmend zoning maps (where applicable) and establish designstandards to provide for higher density development in municipallyidentified Growth Areas. - Planning Commission and Municipal Governments.
4. To designate specific areas for low density rural housing, inhibiting the impactof strip development along local roads.
Immediate PriorityAmend zoning maps (where applicable) to reflect identified lowdensity rural housing locations. - Planning Commission and Municipal Governments.
5. To provide density bonus incentives to private developers who negotiateaffordable housing agreements with municipalities as part of the developmentapproval process.
Short Range PriorityDraft model ordinance language to provide a variety of types of density bonus incentives. - Planning Commission
6. To promote affordable housing in the regulations of municipalities whichpermit “Planned Residential Developments (PRD) or Traditional NeighborhoodDevelopments (TND).”
Short Range PriorityDraft model ordinance language to provide affordable housingincentives in PRD’s and TND’s. - Planning Commission
7. To encourage rental housing projects to provide up to twenty (20) percent of the units in the project that meet affordability criteria (35% of the annual mediangross income in the municipality for all housing expenses).
Short Range PriorityDevelop a variety of regulatory and financial incentives availableto private developers which would assist in creating affordablerental housing without subsidies. - Planning Commission
Housing and Households
Page 89
Page 90
8/3/2019 Volume IV Population and Housing
http://slidepdf.com/reader/full/volume-iv-population-and-housing 90/90
.........
Venango County, Pennsylvania
Comprehensive Development Plan
February 2004
8. To promote the preservation and adaptive reuse of properties of historic or cultural significance as an integral part of municipal land use regulations.
Immediate PriorityDraft model ordinance language which requires all major development projects to evaluate impacts on historic or culturallysignificant properties and includes measures to mitigate suchimpacts. - Planning Commission
Short Range PrioritySupport the implementation of the Oil Heritage Region’sManagement Action Plan to more fully utilize cultural resources inthe County such as museums, historic sites, etc. as an economicdevelopment resource. - Planning Commission and Oil Region
Alliance
9. To encourage municipalities to implement the recently adopted statewidebuilding codes, fire codes, and fair housing codes.
Short Range PriorityDraft model ordinance language, for use by municipalities, basedon local needs and conditions. - Planning Commission
10. To evaluate county and municipal land use regulations for their impact onhousing affordability and handicapped accessibility.
Short Range Priority
Hire an independent nongovernmental consultant to examine alllocal land use regulations and make recommendations to amendthem. - Planning Commission