Page 1
VPA Quarterly “Howgozit”
First Quarter 2011
July 1, 2010 – 30 September 2010
Metric Assessments of Key Operating AreasMetric Assessments of Key Operating Areas“If you’re not keeping score, you’re just
practicing”…..Vince Lombardi
Page 2
1st Quarter Update—2010-111st Quarter Update—2010-11
• Metrics to assess “how we’re doing”– Outcomes, measures of merit, completed tasks– Identify areas that need training, better guidance or
process changes– ‘Continuous Process Improvement’, mission
accomplishment and institutional effectiveness– Provide the data assessment for Program Review at
year’s end• Evaluate division level performance, where
possible– “Nothing personal….. just business”!
• Key Areas: – Classified Staffing (Requests for 2011 completed)– Finance/Budget—Update and metric review– Facilities and Support Services
Page 3
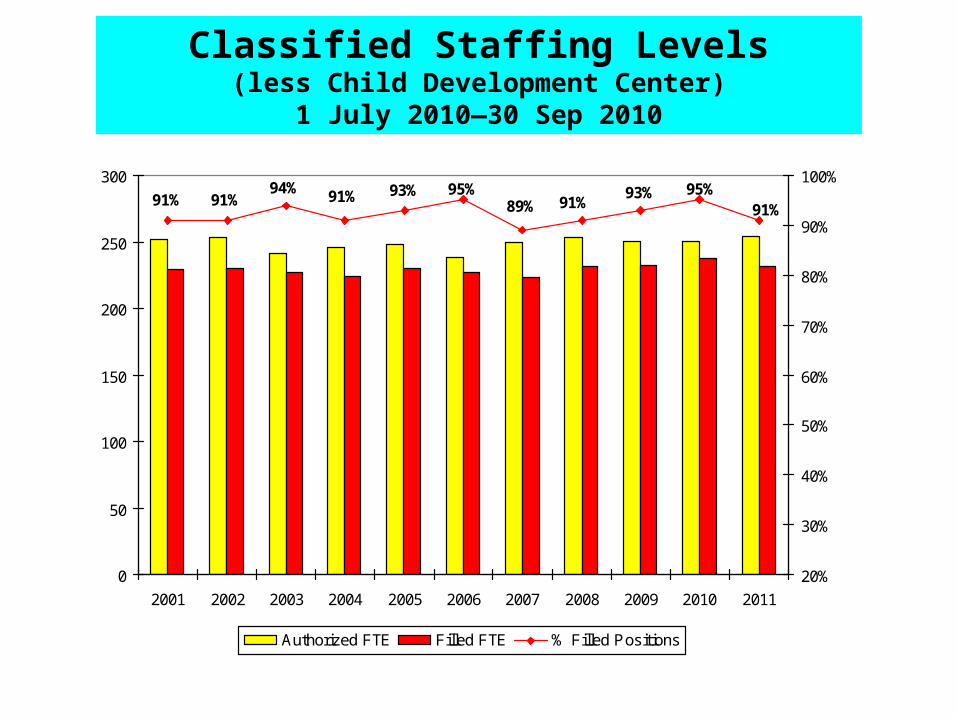
Classified Staffing Levels(less Child Development Center)
1 July 2010—30 Sep 2010
91%95%93%
91%89%95%93%91%94%
91%91%
0
50
100
150
200
250
300
2001 2002 2003 2004 2005 2006 2007 2008 2009 2010 2011
20%
30%
40%
50%
60%
70%
80%
90%
100%
Authorized FTE Filled FTE % Filled Positions
Page 4
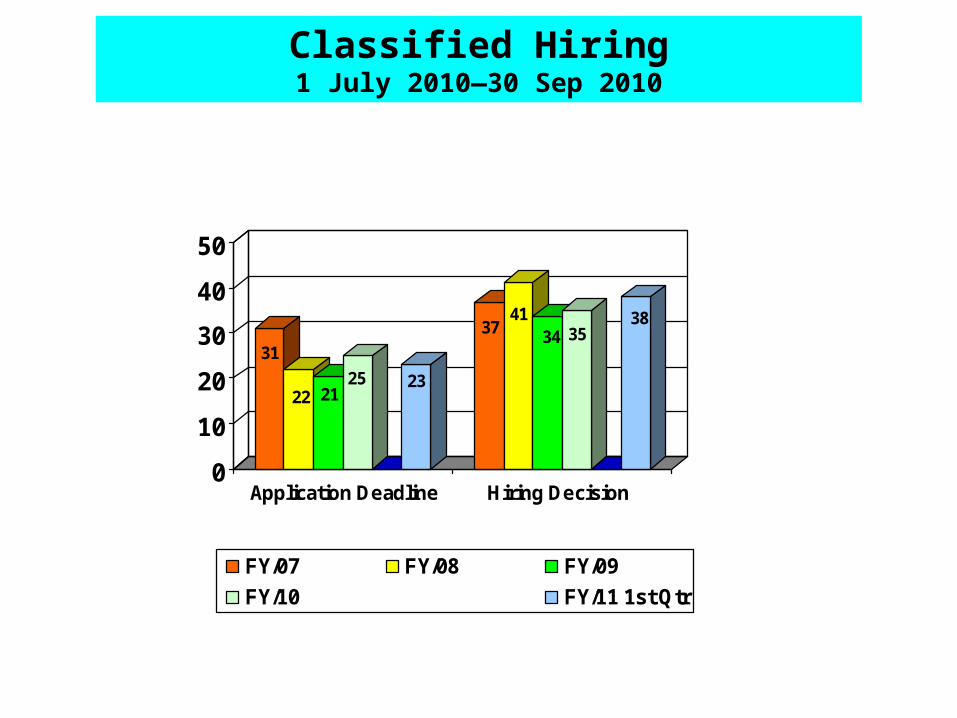
Classified Hiring1 July 2010—30 Sep 2010
31
22 2125 23
3741
34 3538
0
10
20
30
40
50
Application Deadline Hiring Decision
FY/07 FY/08 FY/09
FY/10 FY/11 1st Qtr
Page 5
29
18
26
20
35
29
26 21
0
5
10
15
20
25
30
35
Feb-07 Feb-08 Jan-09 Jan-10
Eligible to Attend Attended
4.9 4.94.5
4.8
0
1
2
3
4
5
Feb-07 Feb-08 Jan-09 Jan-10
Overall Program Quality
Good
Classified New Hires Orientation
Page 6
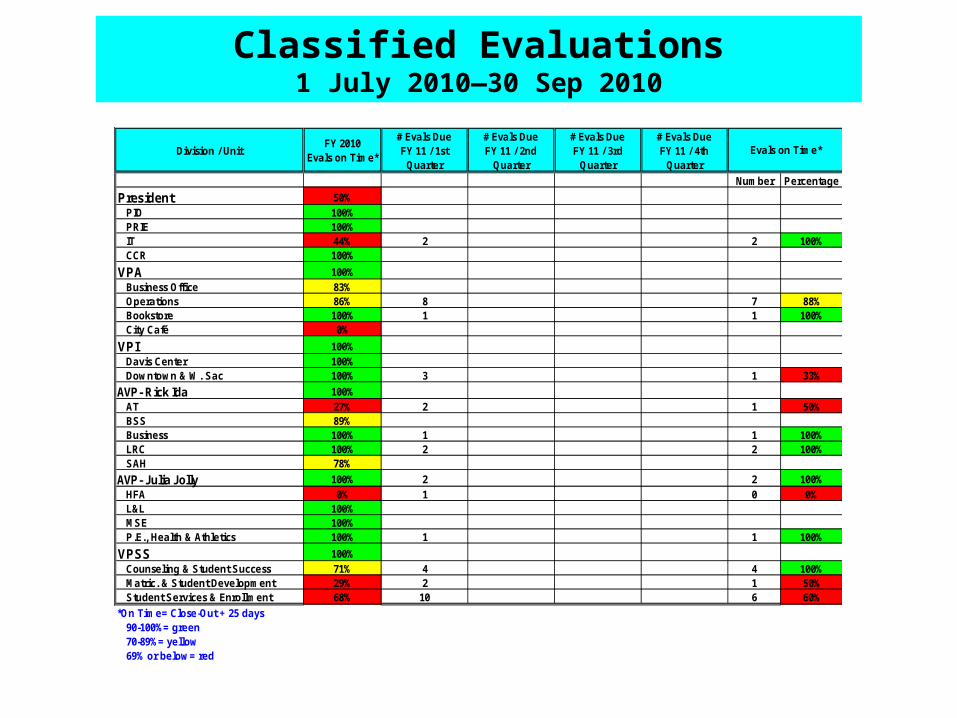
Classified Evaluations1 July 2010—30 Sep 2010
Division / Unit FY 2010
Evals on Time*
# Evals DueFY 11 / 1st
Quarter
# Evals DueFY 11 / 2nd
Quarter
# Evals DueFY 11 / 3rd
Quarter
# Evals DueFY 11 / 4th
Quarter
Number Percentage
President 50%PIO 100%PRIE 100%IT 44% 2 2 100%CCR 100%
VPA 100%Business Office 83%Operations 86% 8 7 88%Bookstore 100% 1 1 100%City Café 0%
VPI 100%Davis Center 100%Downtown & W. Sac 100% 3 1 33%
AVP- Rick Ida 100%AT 27% 2 1 50%BSS 89%Business 100% 1 1 100%LRC 100% 2 2 100%SAH 78%
AVP- Julia Jolly 100% 2 2 100%HFA 0% 1 0 0%L&L 100%MSE 100%P.E., Health & Athletics 100% 1 1 100%
VPSS 100%Counseling & Student Success 71% 4 4 100%Matric. & Student Development 29% 2 1 50%Student Services & Enrollment 68% 10 6 60%
*On Time= Close-Out + 25 days90-100%= green70-89%= yellow69% or below= red
Evals on Time*
Page 7
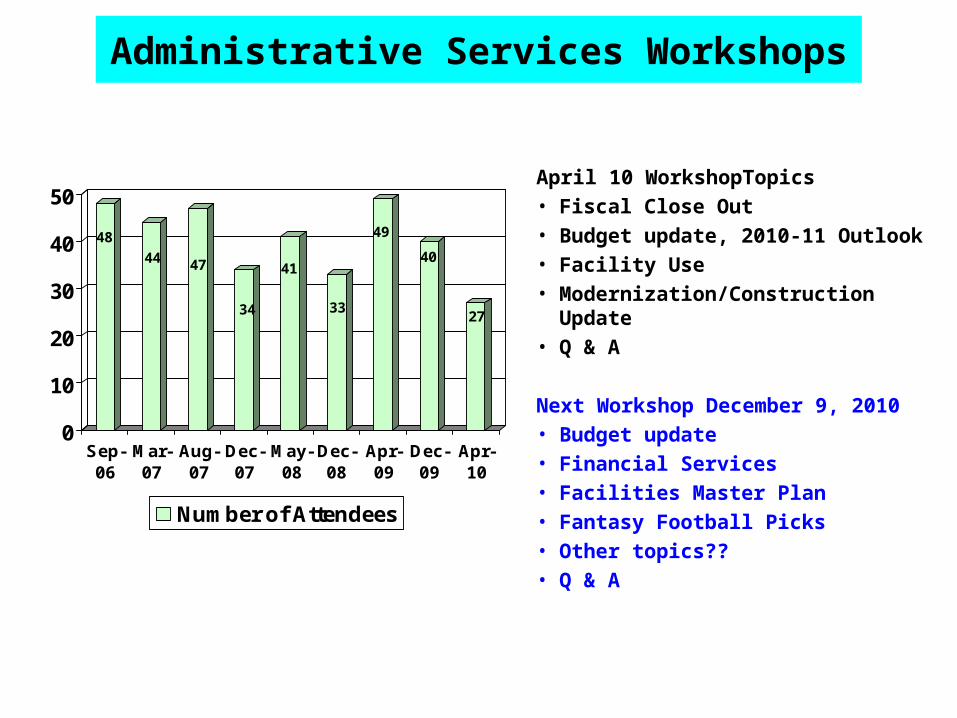
Administrative Services Workshops
48
44 47
34
41
33
49
40
27
0
10
20
30
40
50
Sep-06
Mar-07
Aug-07
Dec-07
May-08
Dec-08
Apr-09
Dec-09
Apr-10
Number of Attendees
April 10 WorkshopTopics• Fiscal Close Out• Budget update, 2010-11 Outlook• Facility Use• Modernization/Construction Update• Q & A
Next Workshop December 9, 2010 • Budget update• Financial Services• Facilities Master Plan • Fantasy Football Picks• Other topics?? • Q & A
Page 8
California State Budget CrisisCalifornia State Budget CrisisImpact on Los Rios CCD—2010-11Impact on Los Rios CCD—2010-11
General Purpose Reduction $ 8,690,000
Categorical Reduction $12,257,000
Total Reduction $-20,947,000
• FINALLY, State budget approved, but.......!
• Categorical and Grant Programs Pending for 2010-11
• College Planning based on these planning factors, plus...
Page 9
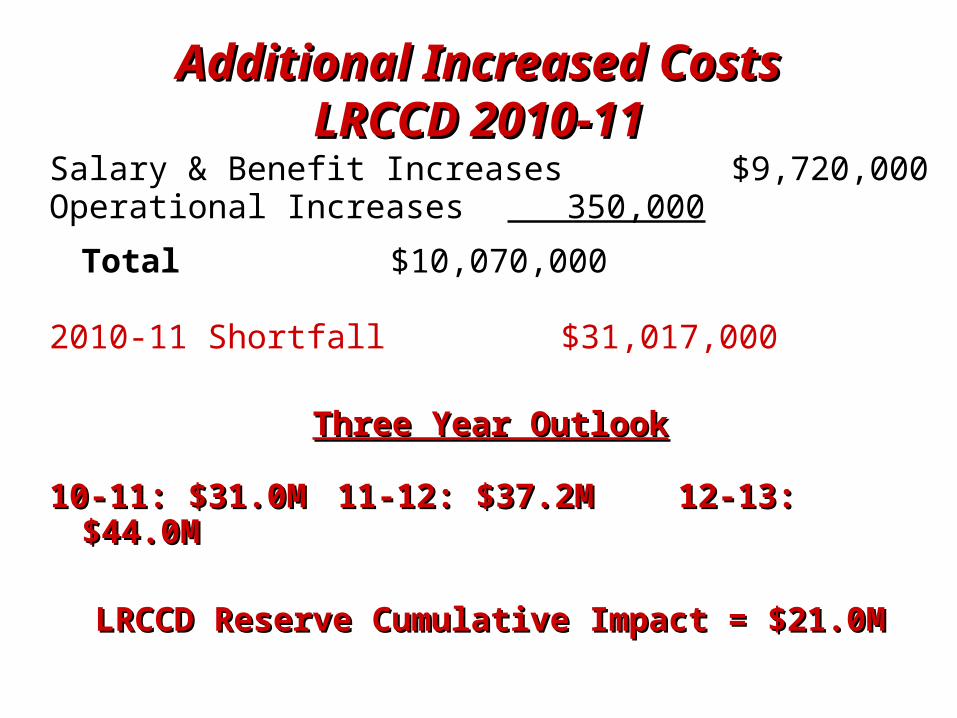
Additional Increased CostsAdditional Increased CostsLRCCD 2010-11LRCCD 2010-11
Salary & Benefit Increases $9,720,000Operational Increases 350,000
Total $10,070,000
2010-11 Shortfall $31,017,000
Three Year OutlookThree Year Outlook
10-11: $31.0M10-11: $31.0M 11-12: $37.2M11-12: $37.2M 12-13: $44.0M12-13: $44.0M
LRCCD Reserve Cumulative Impact = $21.0MLRCCD Reserve Cumulative Impact = $21.0M
Page 10
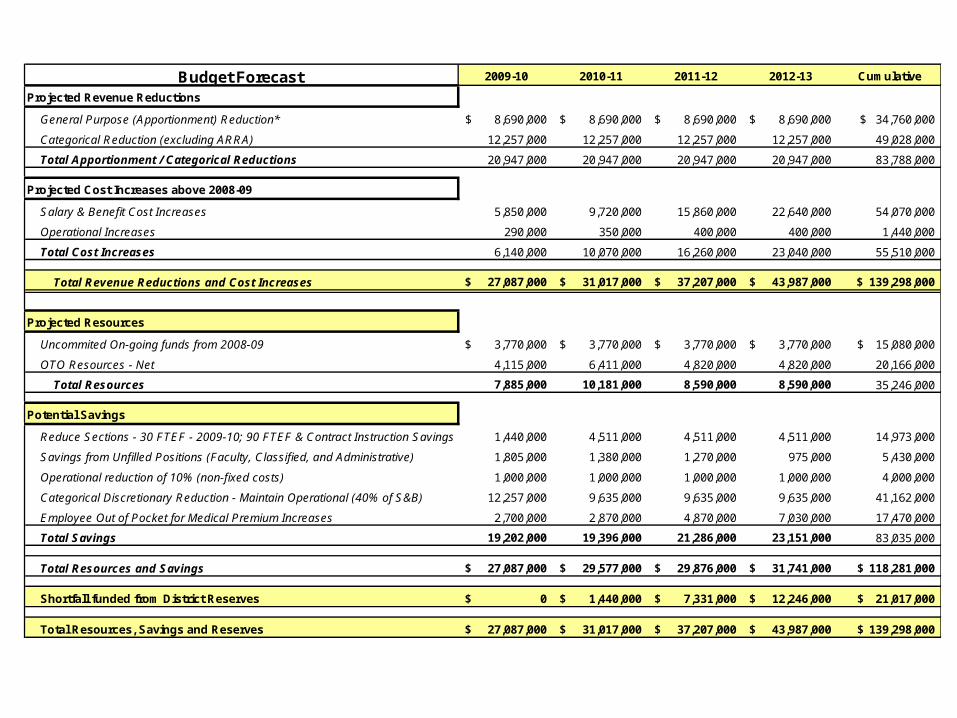
Budget Forecast 2009-10 2010-11 2011-12 2012-13 Cumulative
Projected Revenue Reductions
General Purpose (Apportionment) Reduction* 8,690,000$ 8,690,000$ 8,690,000$ 8,690,000$ 34,760,000 $
Categorical Reduction (excluding ARRA) 12,257,000 12,257,000 12,257,000 12,257,000 49,028,000
Total Apportionment / Categorical Reductions 20,947,000 20,947,000 20,947,000 20,947,000 83,788,000
Projected Cost Increases above 2008-09
Salary & Benefit Cost Increases 5,850,000 9,720,000 15,860,000 22,640,000 54,070,000
Operational Increases 290,000 350,000 400,000 400,000 1,440,000
Total Cost Increases 6,140,000 10,070,000 16,260,000 23,040,000 55,510,000
Total Revenue Reductions and Cost Increases 27,087,000$ 31,017,000$ 37,207,000$ 43,987,000$ 139,298,000 $
Projected Resources
Uncommited On-going funds from 2008-09 3,770,000$ 3,770,000$ 3,770,000$ 3,770,000$ 15,080,000$
OTO Resources - Net 4,115,000 6,411,000 4,820,000 4,820,000 20,166,000
Total Resources 7,885,000 10,181,000 8,590,000 8,590,000 35,246,000
Potential Savings
Reduce Sections - 30 FTEF - 2009-10; 90 FTEF & Contract Instruction Savings 1,440,000 4,511,000 4,511,000 4,511,000 14,973,000
Savings from Unfilled Positions (Faculty, Classified, and Administrative) 1,805,000 1,380,000 1,270,000 975,000 5,430,000
Operational reduction of 10% (non-fixed costs) 1,000,000 1,000,000 1,000,000 1,000,000 4,000,000
Categorical Discretionary Reduction - Maintain Operational (40% of S&B) 12,257,000 9,635,000 9,635,000 9,635,000 41,162,000
Employee Out of Pocket for Medical Premium Increases 2,700,000 2,870,000 4,870,000 7,030,000 17,470,000
Total Savings 19,202,000 19,396,000 21,286,000 23,151,000 83,035,000
Total Resources and Savings 27,087,000$ 29,577,000$ 29,876,000$ 31,741,000$ 118,281,000$
Shortfall funded from District Reserves 0$ 1,440,000$ 7,331,000$ 12,246,000$ 21,017,000$
Total Resources, Savings and Reserves 27,087,000$ 31,017,000$ 37,207,000$ 43,987,000$ 139,298,000$
Page 11
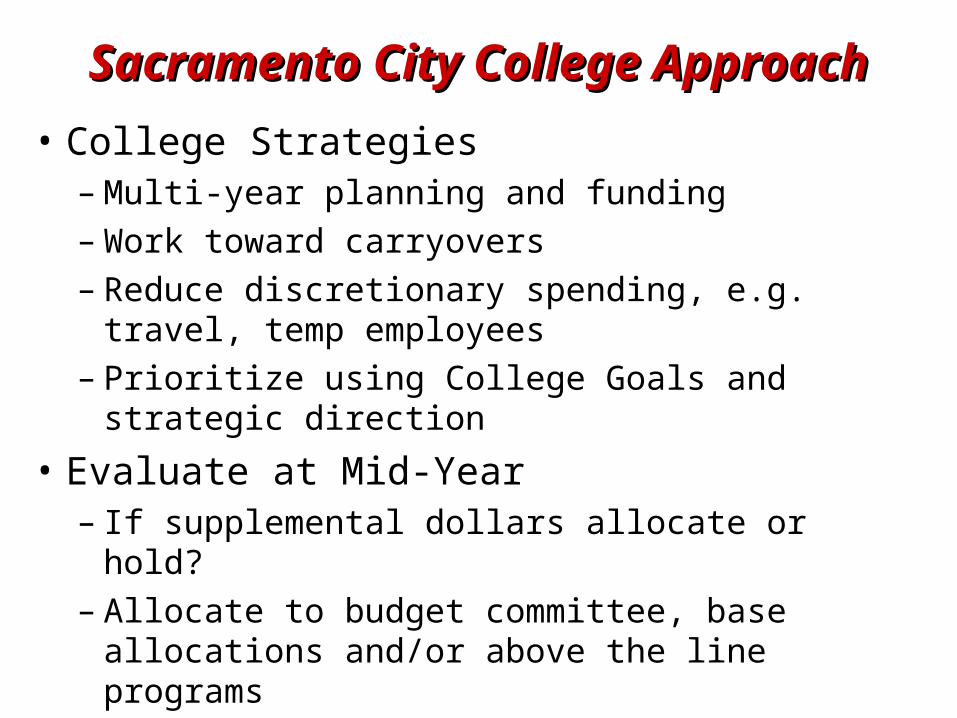
Sacramento City College ApproachSacramento City College Approach
• Utilize Strategic Planning SystemUtilize Strategic Planning System– Financial Resource Allocation Plan for guidance and Financial Resource Allocation Plan for guidance and
processprocess
• President’s Budget Memorandum, 11 Jan 2010– Budget Committee Recommendations approved– 2010-11 plan being executed– 2011-13 outlook included, pending update
• Categorical Programs: Expect allocations similar to 2009-10 for 2010-11– Small ARRA Funds ($5M); District reserves planned $1.4M– Objective: ~40% operational or students served – Selected programs: $587.4K (DSPS, EOPS, MATRIC)
Page 12
Sacramento City College ApproachSacramento City College Approach
• College Strategies– Multi-year planning and funding– Work toward carryovers– Reduce discretionary spending, e.g. travel, temp
employees– Prioritize using College Goals and strategic
direction
• Evaluate at Mid-Year– If supplemental dollars allocate or hold?– Allocate to budget committee, base allocations
and/or above the line programs
Page 13
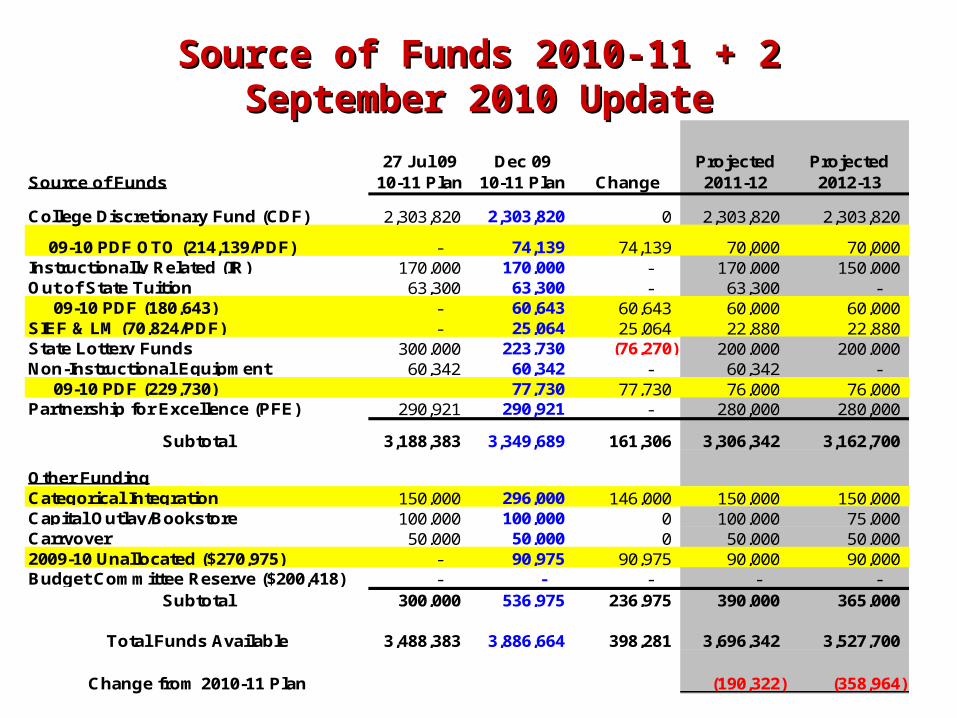
Source of Funds 2010-11 + 2Source of Funds 2010-11 + 2September 2010 UpdateSeptember 2010 Update
Source of Funds27 Jul 09
10-11 PlanDec 09
10-11 Plan ChangeProjected 2011-12
Projected 2012-13
College Discretionary Fund (CDF) 2,303,820 2,303,820 0 2,303,820 2,303,820
09-10 PDF OTO (214,139/PDF) - 74,139 74,139 70,000 70,000 Instructionally Related (IR) 170,000 170,000 - 170,000 150,000 Out of State Tuition 63,300 63,300 - 63,300 - 09-10 PDF (180,643) - 60,643 60,643 60,000 60,000 SIEF & LM (70,824/PDF) - 25,064 25,064 22,880 22,880 State Lottery Funds 300,000 223,730 (76,270) 200,000 200,000 Non-Instructional Equipment 60,342 60,342 - 60,342 - 09-10 PDF (229,730) 77,730 77,730 76,000 76,000 Partnership for Excellence (PFE) 290,921 290,921 - 280,000 280,000
Subtotal 3,188,383 3,349,689 161,306 3,306,342 3,162,700
Other FundingCategorical Integration 150,000 296,000 146,000 150,000 150,000 Capital Outlay/Bookstore 100,000 100,000 0 100,000 75,000 Carryover 50,000 50,000 0 50,000 50,000 2009-10 Unallocated ($270,975) - 90,975 90,975 90,000 90,000 Budget Committee Reserve ($200,418) - - - - -
Subtotal 300,000 536,975 236,975 390,000 365,000
Total Funds Available 3,488,383 3,886,664 398,281 3,696,342 3,527,700
Change from 2010-11 Plan (190,322) (358,964)
Page 14
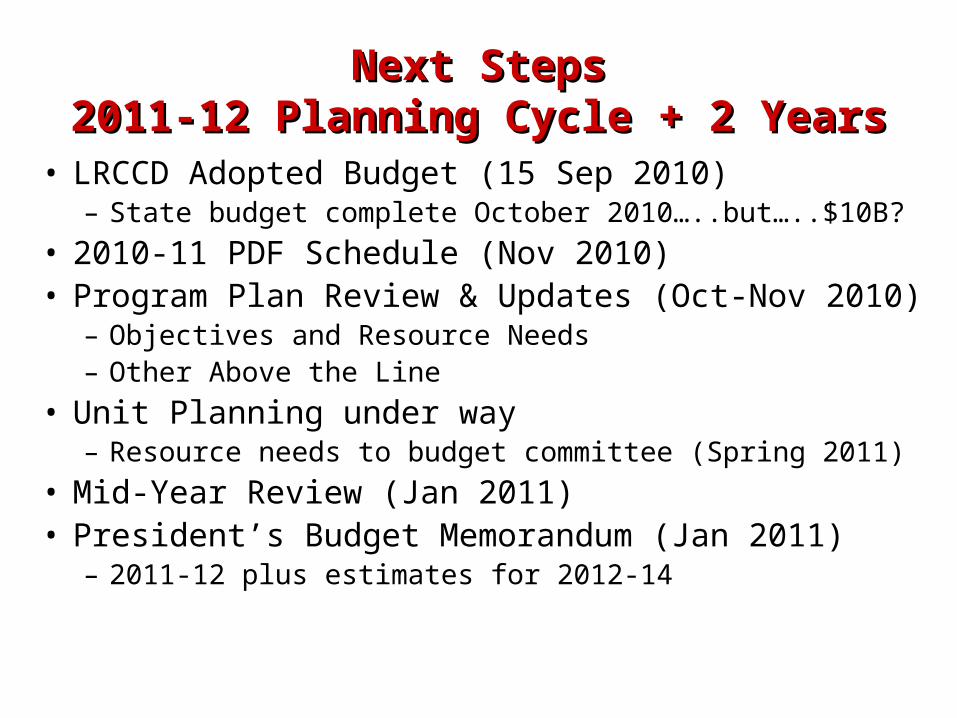
Next StepsNext Steps2011-12 Planning Cycle + 2 Years2011-12 Planning Cycle + 2 Years
• LRCCD Adopted Budget (15 Sep 2010)– State budget complete October 2010…..but…..$10B?
• 2010-11 PDF Schedule (Nov 2010)• Program Plan Review & Updates (Oct-Nov 2010)
– Objectives and Resource Needs– Other Above the Line
• Unit Planning under way– Resource needs to budget committee (Spring 2011)
• Mid-Year Review (Jan 2011)• President’s Budget Memorandum (Jan 2011)
– 2011-12 plus estimates for 2012-14
Page 15
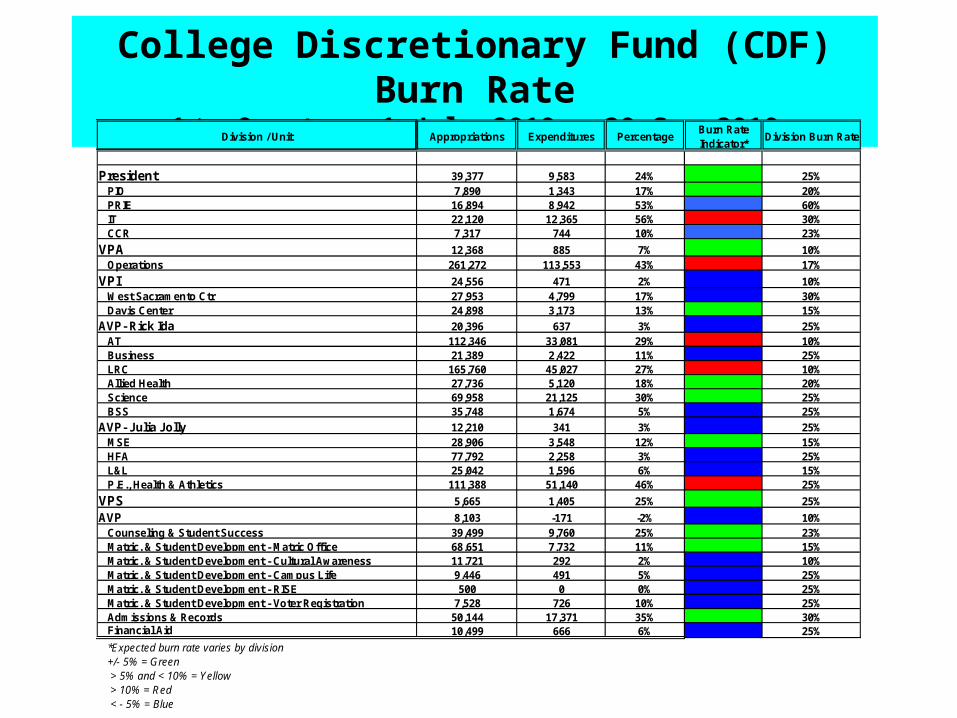
College Discretionary Fund (CDF) Burn Rate1st Quarter: 1 July 2010 – 30 Sep 2010
Division / Unit Appropriations Expenditures PercentageBurn Rate Indicator*
Division Burn Rate
President 39,377 9,583 24% 25%PIO 7,890 1,343 17% 20%PRIE 16,894 8,942 53% 60%IT 22,120 12,365 56% 30%CCR 7,317 744 10% 23%
VPA 12,368 885 7% 10%Operations 261,272 113,553 43% 17%
VPI 24,556 471 2% 10%West Sacramento Ctr 27,953 4,799 17% 30%Davis Center 24,898 3,173 13% 15%
AVP- Rick Ida 20,396 637 3% 25%AT 112,346 33,081 29% 10%Business 21,389 2,422 11% 25%LRC 165,760 45,027 27% 10%Allied Health 27,736 5,120 18% 20%Science 69,958 21,125 30% 25%BSS 35,748 1,674 5% 25%
AVP- Julia Jolly 12,210 341 3% 25%MSE 28,906 3,548 12% 15%HFA 77,792 2,258 3% 25%L&L 25,042 1,596 6% 15%P.E., Health & Athletics 111,388 51,140 46% 25%
VPS 5,665 1,405 25% 25%
AVP 8,103 -171 -2% 10%Counseling & Student Success 39,499 9,760 25% 23%Matric. & Student Development - Matric Office 68,651 7,732 11% 15%Matric. & Student Development - Cultural Awareness 11,721 292 2% 10%Matric. & Student Development - Campus Life 9,446 491 5% 25%Matric. & Student Development - RISE 500 0 0% 25%Matric. & Student Development - Voter Registration 7,528 726 10% 25%Admissions & Records 50,144 17,371 35% 30%Financial Aid 10,499 666 6% 25%
*Expected burn rate varies by division+/- 5% = Green > 5% and < 10% = Yellow > 10% = Red < - 5% = Blue
Page 16
Expenditure Comparison1st Qtr 1 July 2010—30 Sep 2010
Budget Year Fund 11 Fund 12 Fund 11 Fund 12 Fund 11 Fund 12 Total
%
Change
2011 21,051 10,476 45,335 51,557 46,954 30,359 205,733
2010 9,995 13,535 35,531 67,098 51,527 40,388 218,073
Increase/(Decrease) 11,057 (3,059) 9,804 (15,541) (4,573) (10,029) (12,341) -6%
Travel Classified Temp Student Help
Page 17
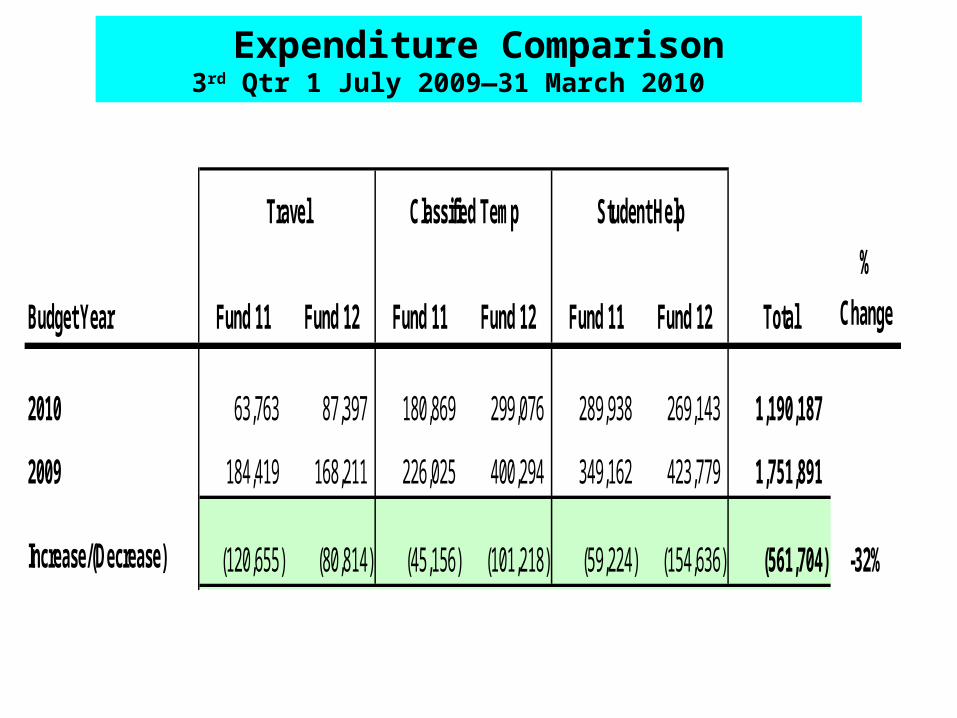
Expenditure Comparison3rd Qtr 1 July 2009—31 March 2010
Budget Year Fund 11 Fund 12 Fund 11 Fund 12 Fund 11 Fund 12 Total
%
Change
2010 63,763 87,397 180,869 299,076 289,938 269,143 1,190,187
2009 184,419 168,211 226,025 400,294 349,162 423,779 1,751,891
Increase/(Decrease) (120,655) (80,814) (45,156) (101,218) (59,224) (154,636) (561,704) -32%
Travel Classified Temp Student Help
Page 18
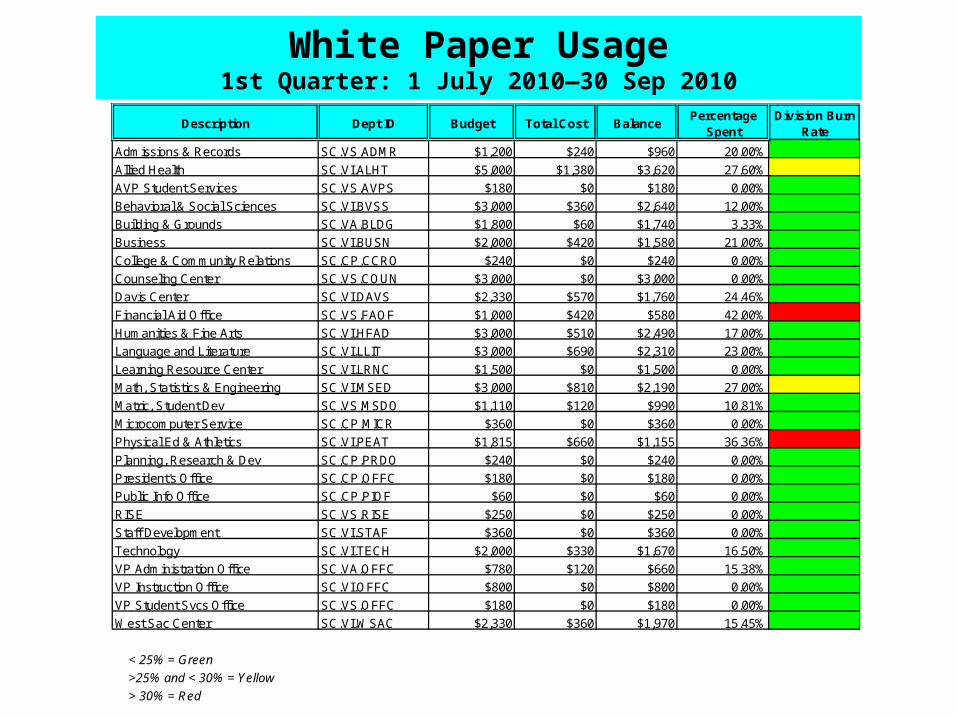
White Paper Usage1st Quarter: 1 July 2010—30 Sep 2010
Description Dept ID Budget Total Cost BalancePercentage
SpentDivision Burn
Rate
Admissions & Records SC.VS.ADMR $1,200 $240 $960 20.00%
Allied Health SC.VI.ALHT $5,000 $1,380 $3,620 27.60%
AVP Student Services SC.VS.AVPS $180 $0 $180 0.00%
Behavioral & Social Sciences SC.VI.BVSS $3,000 $360 $2,640 12.00%
Building & Grounds SC.VA.BLDG $1,800 $60 $1,740 3.33%
Business SC.VI.BUSN $2,000 $420 $1,580 21.00%
College & Community Relations SC.CP.CCRO $240 $0 $240 0.00%
Counseling Center SC.VS.COUN $3,000 $0 $3,000 0.00%
Davis Center SC.VI.DAVS $2,330 $570 $1,760 24.46%
Financial Aid Office SC.VS.FAOF $1,000 $420 $580 42.00%
Humanities & Fine Arts SC.VI.HFAD $3,000 $510 $2,490 17.00%
Language and Literature SC.VI.LLIT $3,000 $690 $2,310 23.00%
Learning Resource Center SC.VI.LRNC $1,500 $0 $1,500 0.00%
Math, Statistics & Engineering SC.VI.MSED $3,000 $810 $2,190 27.00%
Matric, Student Dev SC.VS.MSDO $1,110 $120 $990 10.81%
Microcomputer Service SC.CP.MICR $360 $0 $360 0.00%
Physical Ed & Athletics SC.VI.PEAT $1,815 $660 $1,155 36.36%
Planning, Research & Dev SC.CP.PRDO $240 $0 $240 0.00%
President's Office SC.CP.OFFC $180 $0 $180 0.00%
Public Info Office SC.CP.PIOF $60 $0 $60 0.00%
RISE SC.VS.RISE $250 $0 $250 0.00%
Staff Development SC.VI.STAF $360 $0 $360 0.00%
Technology SC.VI.TECH $2,000 $330 $1,670 16.50%
VP Administration Office SC.VA.OFFC $780 $120 $660 15.38%
VP Instruction Office SC.VI.OFFC $800 $0 $800 0.00%
VP Student Svcs Office SC.VS.OFFC $180 $0 $180 0.00%
West Sac Center SC.VI.WSAC $2,330 $360 $1,970 15.45%
< 25% = Green
>25% and < 30% = Yellow
> 30% = Red
Page 19
Instructionally-Related Fund (IR) Burn Rate1st Quarter: 1 July 2010 – 30 Sep 2010
Division/Unit 2011 Approp.Prior Year Carryover
2011 Total Budget Expenditures Percentage
Division Burn Rate
Burn Rate Indicator*
Counseling 6,285 0 6,285 674 11% 15%Davis Center 300 0 300 0 0% 0%Campus Development 2,000 2,942 4,942 0 0% 0%Financial Aid 434 0 434 78 18% 25%Humanities & Fine Arts 31,834 5,274 37,108 5,446 15% 20%Language & Literature 16,407 2,155 18,562 648 3% 20%Math Science Engineering 218 156 374 0 0% 25%Multicultural Activities 23,931 822 24,753 2,416 10% 20%P.E., Health, & Athletics 76,395 0 76,395 21,779 29% 25%Student Development 11,696 1,557 13,253 254 2% 25%West Sacramento Center 500 30 530 0 0% 40%
Totals 170,000 12,936 182,936 31,295 17% 18%
+/- 5% = Green +/- 10% = Yellow +/- > 10% = Red
Page 20
Lottery Burn Rate1st Quarter: 1 July 2010—30 Sep 2010
Division Appropriations Expenditures PercentageBurn Rate Indicator*
Division Burn Rate
AT 37,208 5,270 14% 10%BSS 6,170 0 0% 25%HFA 31,273 15,035 48% 15%IT 3,207 2,500 78% 100%L & L 146 20 14% 25%MSE 33 0 0% 25%P.E., Health & Athletics 77,000 31,938 41% 25%Science 61,694 18,042 29% 75%West Sacramento Ctr 1,174 0 0% 25%
*Expected burn rate varies by division+/- 5% = Green > 5% and < 10% = Yellow > 10% = Red < - 5% = Blue
Page 21
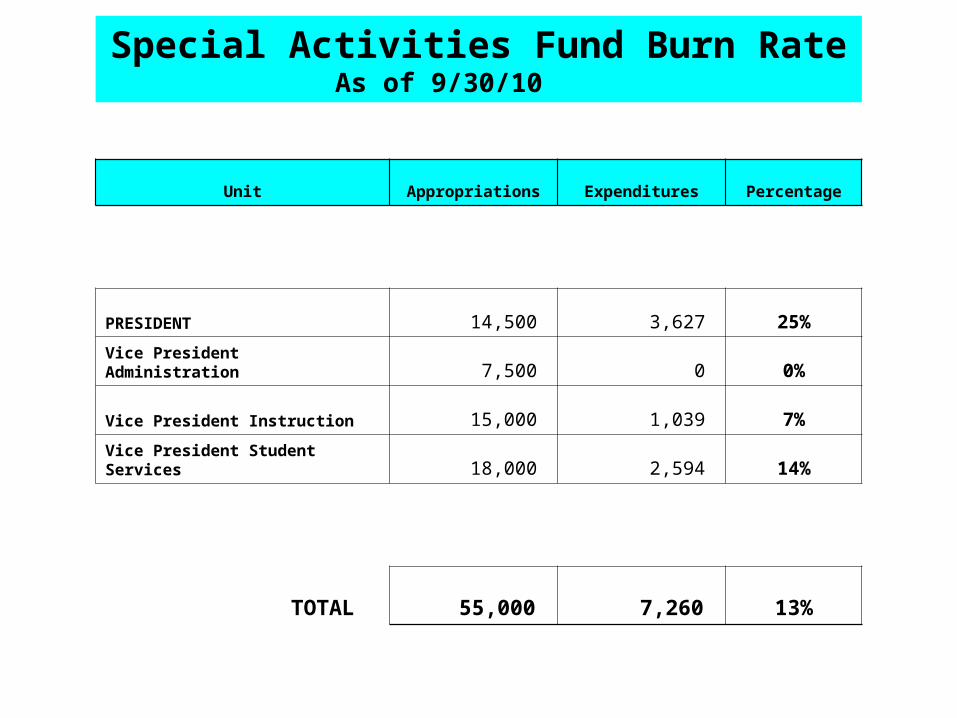
Special Activities Fund Burn RateAs of 9/30/10
Unit Appropriations Expenditures Percentage
PRESIDENT 14,500 3,627 25%
Vice President Administration 7,500 0 0%
Vice President Instruction 15,000 1,039 7%
Vice President Student Services 18,000 2,594 14%
TOTAL 55,000 7,260 13%
Page 22
Categorical Program Burn Rate1st Quarter: 1 July 2010 – 30 Sep 2010
CategoricalProject Grant
OPR Appropriations Expenditures PercentageBurn Rate Indicator*
Division Burn Rate
DOL GreenForce Initiative 340A AT 339,531 62,759 18% 8%Basic Skills 09-10 575x AVPI 255,903 17,713 7% 25%Basic Skills 10-11 576x AVPI 176,318 0 0% 25%Regional Cons VTEA IB 334A AVPI 6,615 690 10% 25%VTEA 316x AVPI 1,016,213 223,080 22% 25%Matriculation 597C SSE 686,819 183,630 27% 25%ARRA-SETA-HS Career Pathways 365C BSS 37,608 9,393 25% 100%TANF Child Dev Careers Program 381M BSS 16,700 0 0% 25%CAHSEE Prep Year 3 454R LR 42,243 16,499 39% 50%MESA/CCP 589A MSE 50,568 3,333 7% 25%MESA/CCP Extension 589D MSE 25,523 2,289 9% 50%Natl Science Fdn - STEM Scholarship 390M MSE 2,015 0 0% 25%ARRA - Dental Hygiene 370H SAH 235,299 13,217 6% 25%Health Occup Prep & Ed (HOPE) Yr 2 462B SAH 64,054 28,142 44% 34%Health Occup Prep & Ed (HOPE) Yr 3 462A SAH 275,862 64,477 23% 25%Nursing Retention Yr 2 453H SAH 43,023 8,248 19% 34%Responsive Training Fund 450X SAH 365,217 247,402 68% 50%BOG BFAP 438A SSE 847,531 189,768 22% 25%BOG BFAP Extension 438B SSE 59,291 59,291 100% 100%CalWORKs 592x SSE 382,440 119,333 31% 25%CARE 411A SSE 164,510 0 0% 25%CARE Extension 411D SSE 2,684 2,684 100% 100%DSPS 428A/B/H SSE 953,840 225,638 24% 25%DSPS Extension 428D/E/I SSE 11,722 11,722 100% 100%EOPS 408A/B SSE 824,394 186,640 23% 25%EOPS Extension 408E SSE 21,978 21,978 100% 100%TANF 590A SSE 85,030 67 0% 25%WorkAbility 381F SSE 211,465 49,285 23% 25%ARRA - Workability 381H SSE 26,862 0 0% 50%
*Expected burn rate varies by division+/- 5% = Green > 5% and < 10% = Yellow > 10% = Red < - 5% = Blue
Page 23
Categorical Program Burn Rate1st Quarter: 1 July 2010 – 30 Sep 2010
Categorical OPR Appropriations Expenditures PercentageBurn Rate Indicator*
Division Burn Rate
Basic Skills 09-10 AVPI 255,903 17,713 7% 25%VTEA AVPI 1,016,213 223,080 22% 25%CalWORKs/TANF SSE 467,470 119,400 26% 25%DSPS SSE 953,840 225,638 24% 25%Matriculation SSE 686,819 183,630 27% 25%BOG BFAP SSE 847,531 189,768 22% 25%CARE SSE 164,510 0 0% 25%EOPS SSE 824,394 186,640 23% 25%
*Expected burn rate varies by division+/- 5% = Green > 5% and < 10% = Yellow > 10% = Red < - 5% = Blue
Page 24
VTEAAVP
Categorical Program Burn Rate1st Quarter: 1 July 2010—30 Sep 2010
Division Budgeted Encumbered Expended Total Burn Rate
Advanced Technology 151,457.00 0.00 13,818.78 13,818.78 9%
Business 241,217.00 723.38 131,643.85 132,367.23 55%
Behavioral and Social Sciences 82,214.00 0.00 9.99 9.99 0%
Counseling 71,820.00 0.00 15,292.28 15,292.28 21%
Learning Resources 196,185.00 114.64 22,065.59 22,180.23 11%
Matriculation and Student Development 115,991.00 0.00 28,944.05 28,944.05 25%
Science and Allied Health 59,752.00 0.00 10,467.67 10,467.67 18%
Budget Committee/Reserve 97,577.00 0.00 0.00 0.00 0%
Total 1,016,213.00 838.02 222,242.21 223,080.23 22%
Page 25
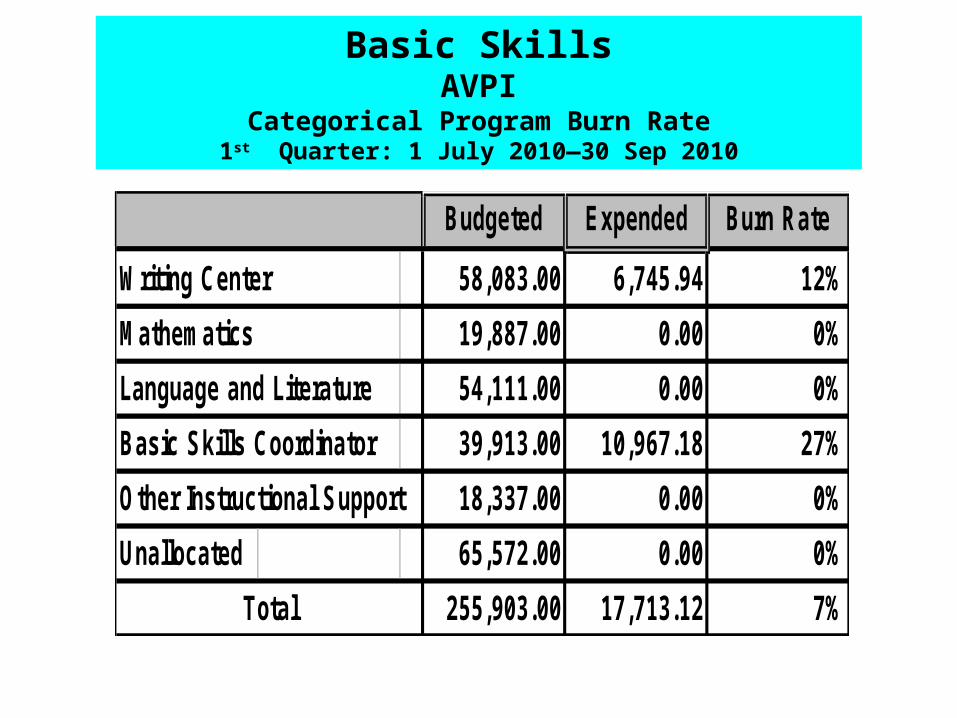
Basic SkillsAVPI
Categorical Program Burn Rate1st Quarter: 1 July 2010—30 Sep 2010
Budgeted Expended Burn Rate
Writing Center 58,083.00 6,745.94 12%
Mathematics 19,887.00 0.00 0%
Language and Literature 54,111.00 0.00 0%
Basic Skills Coordinator 39,913.00 10,967.18 27%
Other Instructional Support 18,337.00 0.00 0%
Unallocated 65,572.00 0.00 0%
Total 255,903.00 17,713.12 7%
Page 26
Absence ReportsYear to Date 30 Sep 2010
Division
Submit'd 1st Qtr
Late 2nd Qtr
Late 3rd Qtr
Late 4th Qtr
Late Late Rate
Late Indicator*
President 6 0 0%PIO 6 0 0%PRIE 12 0 0%IT 48 0 0%CCR 12 0 0%
President Totals 84 0 0 0 0 0%VPA 18 0 0% Bookstore 24 0 0%
Business Office 18 0 0%Café 22 8 36%Operations 137 0 0%
VPA Totals 219 8 0 0 0 4%VPI 9 0 0%
Davis Center 9 0 0%West Sacramento 22 0 0%
AVP- Rick Ida 12 0 0%AT 22 0 0%BVSS 39 2 5%Business 22 0 0%LRC 69 0 0%SAH 35 0 0%
AVP- Julia Jolly 12 0 0%HFA 23 1 4%L&L 11 0 0%MSE 14 0 0%P.E., Health & Athletics 20 0 0%
VPI Totals 319 3 0 0 0 1%VPSS 6 0 0%AVP 0 0 0%Student Services & Enrollment 110 20 18%Counseling & Student Success 47 5 11%Matriculation & Student Development 72 4 6%
VPSS Totals 235 29 0 0 0 12%
TOTALS 857 40 0 0 0 5%
*Expected error rate =0%+/- 5% = Green+/- 10% = Yellow+/- > 10% = Red
Page 27
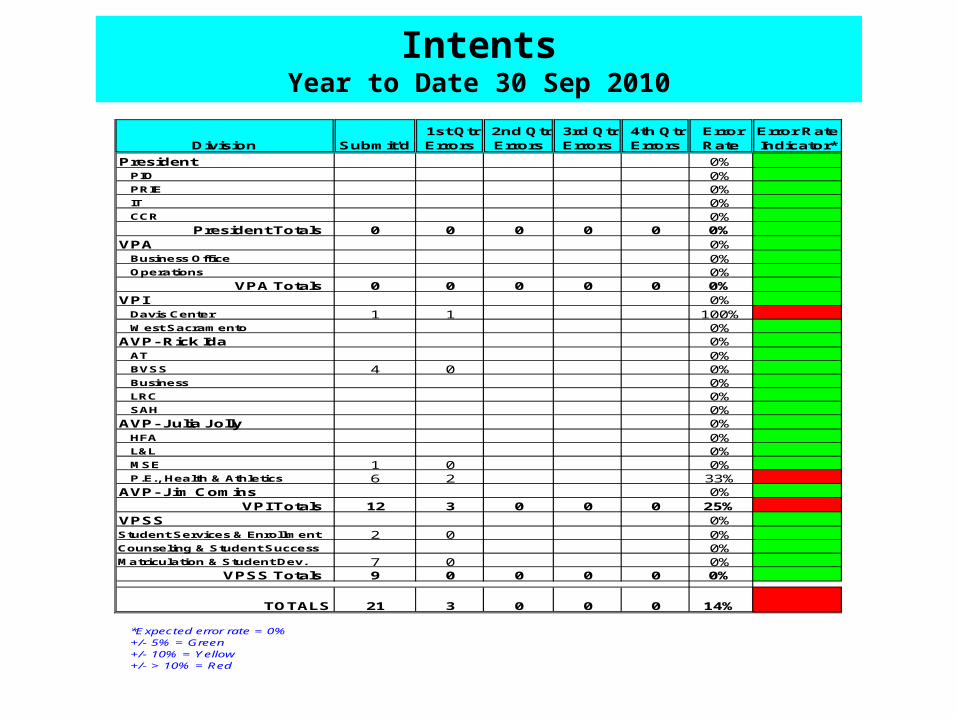
IntentsYear to Date 30 Sep 2010
Division
Submit'd 1st Qtr Errors
2nd Qtr Errors
3rd Qtr Errors
4th Qtr Errors
Error Rate
Error Rate Indicator*
President 0%PIO 0%PRIE 0%IT 0%CCR 0%
President Totals 0 0 0 0 0 0%VPA 0%
Business Office 0%Operations 0%
VPA Totals 0 0 0 0 0 0%VPI 0%
Davis Center 1 1 100%West Sacramento 0%
AVP- Rick Ida 0%AT 0%BVSS 4 0 0%Business 0%LRC 0%SAH 0%
AVP- Julia Jolly 0%HFA 0%L&L 0%MSE 1 0 0%P.E., Health & Athletics 6 2 33%
AVP- Jim Comins 0%VPI Totals 12 3 0 0 0 25%
VPSS 0%Student Services & Enrollment 2 0 0%Counseling & Student Success 0%Matriculation & Student Dev. 7 0 0%
VPSS Totals 9 0 0 0 0 0%
TOTALS 21 3 0 0 0 14%
*Expected error rate = 0%+/- 5% = Green+/- 10% = Yellow+/- > 10% = Red
Page 28
Travel AuthorizationsYear to Date 30 Sep 2010
Division Submit'd 1st Qtr Errors
2nd Qtr Errors
3rd Qtr Errors
4th Qtr Errors
Error Rate
Error Rate Indicator*
President 2 0 0%PIO 0%PRIE 3 0 0%IT 2 0 0%CCR 0%
President Totals 7 0 0 0 0 0%VPA 1 0 0%
Business Office 0%Operations 0%
VPA Totals 1 0 0 0 0 0%VPI 2 0 0%
Davis Center 0%West Sacramento 3 0 0%
AVP- Rick Ida 7 0 0%AT 2 0 0%BVSS 14 4 29%Business 4 0 0%LRC 1 0 0%SAH 6 0 0%
AVP- Julia Jolly 4 1 0%HFA 2 0 0%L&L 1 0 0%MSE 11 1 9%P.E., Health & Athletics 1 0 0%
AVP- Jim Comins 0%VPI Totals 58 6 0 0 0 10%
VPSS 0%AVP 0%Student Services & Enrollment 14 1 7%Counseling & Student Success 5 1 20%Matriculation & Student Dev 0%
VPSS Totals 19 2 0 0 0 11%
TOTALS 85 8 0 0 0 9%
*Expected error rate = 0%+/- 5% = Green+/- 10% = Yellow+/- > 10% = Red
Page 29
Budget EntriesYear to Date 30 Sep 2010
Division Submitted 1st Qtr Errors
2nd Qtr Errors
3rd Qtr Errors
4th Qtr Errors
Error Rate
Error Rate
Indicator
President 1 0 0%PIO 0%PRIE 0%IT 6 0 0%CCR 2 0 0%
President Totals 9 0 0 0 0 0%VPA 89 0 0%
Business Office 0%Operations 3 0 0%
VPA Totals 92 0 0 0 0 0.0%VPI 2 0 0%
Davis Center 0%West Sacramento 2 0 0%
AVP- Rick Ida 2 0 0%AT 25 1 4%BVSS 2 0 0%Business 4 0 0%LRC 6 0 0%SAH 7 0 0%
AVP- Julia Jolly 1 0 0%HFA 7 0 0%L&L 0%MSE 5 0 0%P.E., Health & Athletics 7 0 0%
AVP- Jim Comins 0%VPI Totals 70 1 0 0 0 1%
VPSS 1 0 0%AVP 0%Student Services & Enrollment 14 3 21%Counseling & Student Success 3 1 33%Matriculation & Student Devel. 1 1 100%
VPSS Totals 19 5 0 0 0 26%
TOTALS 190 6 0 0 0 3%
*Expected error rate = 0%+/- 5% = Green+/- 10% = Yellow+/- > 10% = Red
Page 30
RequisitionsYear to Date 30 Sep 2010
Division
Submit'd 1st Qtr Errors
2nd Qtr Errors
3rd Qtr Errors
4th Qtr Errors
Error Rate
Error Rate Indicator*
President 3 1 33%PIO 0%PRIE 3 0%IT 30 0 0%CCR 0%
President Totals 36 1 0 0 0 3%VPA 8 0 0%
Business Office 0%Operations 91 0 0%
VPA Totals 99 0 0 0 0 0%VPI 3 0 0%
Davis Center 5 0 0%West Sacramento 9 2 22%
AVP- Rick Ida 0%AT 45 3 7%BVSS 15 0 0%Business 9 0 0%LRC 48 0 0%SAH 110 6 5%
AVP- Julia Jolly 0%HFA 32 2 6%L&L 1 1 100%MSE 6 0 0%P.E., Health & Athletics 35 3 9%
AVP- Jim Comins 6 0 0%VPI Totals 324 17 0 0 0 5%
VPSS 0%AVP 0%Student Services & Enrollment 47 0 0%Counseling & Student Success 12 0 0%Matriculation & Student Dev 5 2 40%
VPSS Totals 64 2 0 0 0 3%
TOTALS 523 20 0 0 0 4%
*Expected error rate = 0%+/- 5% = Green+/- 10% = Yellow+/- > 10% = Red
Page 31
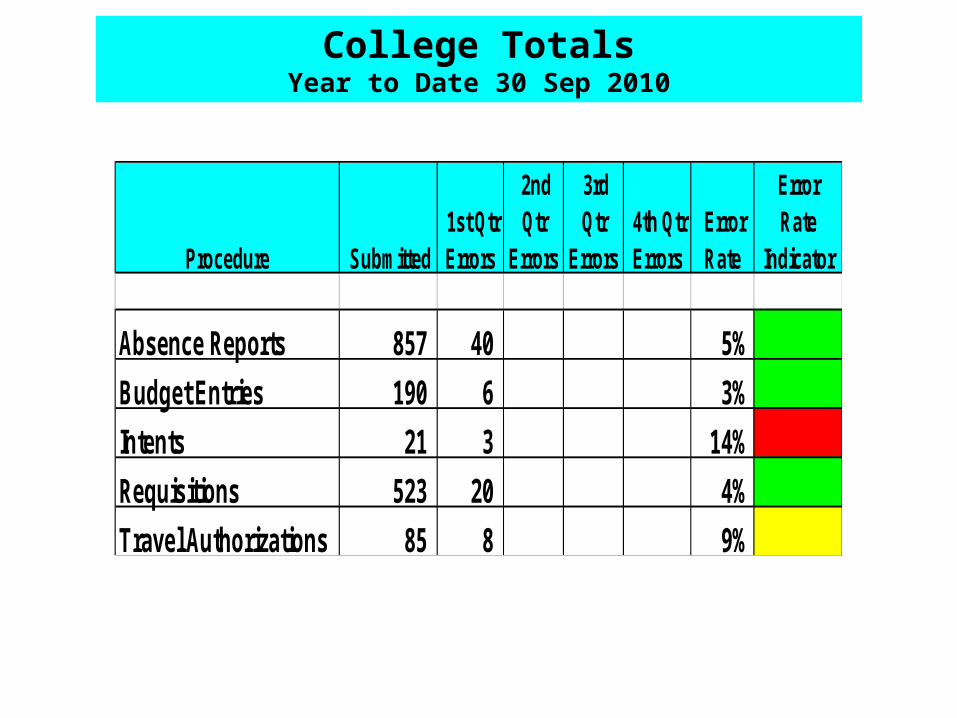
College TotalsYear to Date 30 Sep 2010
Procedure Submitted 1st Qtr Errors
2nd Qtr
Errors
3rd Qtr
Errors 4th Qtr Errors
Error Rate
Error Rate
Indicator
Absence Reports 857 40 5%
Budget Entries 190 6 3%
Intents 21 3 14%
Requisitions 523 20 4%
Travel Authorizations 85 8 9%
Page 32
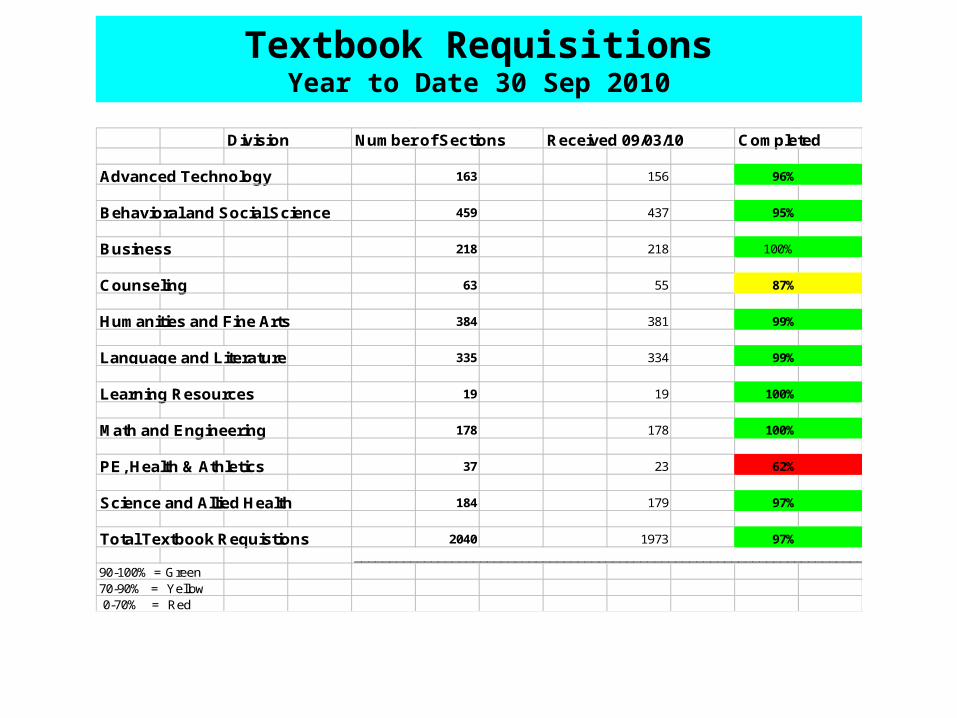
Textbook RequisitionsYear to Date 30 Sep 2010
Division Number of Sections Received 09/03/10 Completed
Advanced Technology 163 156 96%
Behavioral and Social Science 459 437 95%
Business 218 218 100%
Counseling 63 55 87%
Humanities and Fine Arts 384 381 99%
Language and Literature 335 334 99%
Learning Resources 19 19 100%
Math and Engineering 178 178 100%
PE, Health & Athletics 37 23 62%
Science and Allied Health 184 179 97%
Total Textbook Requistions 2040 1973 97% _________________________________________________________________________90-100% = Green70-90% = Yellow 0-70% = Red
Page 33
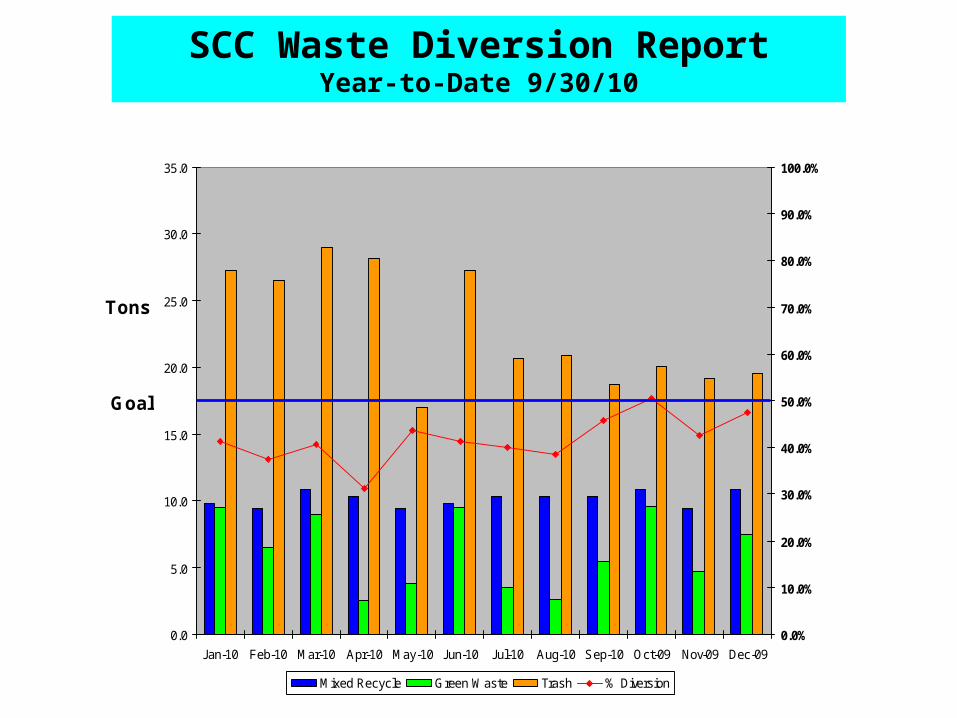
0.0
5.0
10.0
15.0
20.0
25.0
30.0
35.0
Jan-10 Feb-10 Mar-10 Apr-10 May-10 Jun-10 Jul-10 Aug-10 Sep-10 Oct-09 Nov-09 Dec-09
Tons
0.0%
10.0%
20.0%
30.0%
40.0%
50.0%
60.0%
70.0%
80.0%
90.0%
100.0%
Goal
Mixed Recycle Green Waste Trash % Diversion
SCC Waste Diversion ReportYear-to-Date 9/30/10
Page 34
SCC Copier UsageApr 09 - Sep 09 vs Apr 10 - Sep 10
DEPARTMENTOPTIMAL IMPRESSIONS
PER MONTH Apr-09 May-09 Jun-09 Jul-09 Aug-09 Sep-09 Apr-10 May-10 Jun-10 Jul-10 Aug-10 Sep-10
ADMISSIONS 32K 4,314 6,172 5,740 6,197 6,661 3,353 2,777 3,764 3,627 2,807 4,158 2,161
ADV TECHNOLOGY 70K 10,843 13,046 9,572 1,768 9,417 10,032 11,133 9,842 5,725 4,908 18,399 9,929
ALLIED HEALTH-NURSING 45K 28,719 33,074 18,684 22,471 10,537 20,779 22,906 20,582 19,182 16,682 19,788 34,139
ASSESMENT 45K 7,044 6,788 5,729 3,907 4,299 747 2,038 3,386 1,838 1,666 2,685 1,993
ATHLETICS-NORTH 70K 11,333 10,028 9,106 4,946 12,252 12,702 12,072 12,303 7,665 6,500 11,508 13,599
ATHLETICS-SOUTH 60K 7,429 7,000 4,659 3,317 3,520 10,067 8,023 6,937 8,329 6,079 10,998 7,754
AVPSS 32K 1,632 216 284 193 147 108 197 200 0 0 0 0
BEHAV & SOC SCI 70K 68,694 52,545 36,083 41,814 19,866 30,889 30,710 32,823 23,758 21,658 30,621 36,730
BUSINESS DIVISION 70K 27,753 21,609 8,051 11,815 12,294 11,089 27,834 21,305 13,664 19,272 18,320 27,135
BUSINESS OFFICE 60K 0 2,827 2,114 1,428 2,236 1,670 3,258 2,347 1,942 1,966 1,282 1,419
CAMPUS POLICE 40K 2,065 3,127 2,478 2,923 2,157 2,342 2,767 2,218 3,136 2,137 1,929 1,943CDC-FRONT OFFICE 36K 0 4,169 3,253 2,620 4,450 6,731 4,843 4,323 3,689 2,334 5,021 4,460
COLLEGE RELATIONS 30K 780 654 581 551 375 467 270 387 548 342 395 433
COUNSELING 100K 11,736 7,011 6,472 4,297 9,596 9,796 23,901 19,166 13,164 15,599 20,997 21,557
DAVIS OUTREACH 110K 40,942 36,299 18,656 27,762 16,287 29,078 25,844 20,511 12,499 20,256 6,815 40,754
DISABILITY RESOURCES CTR. 110K 0 10,310 7,807 8,333 14,060 7,353 2,601 2,703 2,706 2,253 2,322 2,052
DOWNTOWN CTR. 45K 8,166 4,679 3,155 5,403 2,702 7,877 0 0 0 0 0 0
DUPLICATING ( 2 MACHINES) 1M 328,883 343,781 352,090 266,958 567,514 623,222 267,869 429,367 296,988 357,788 500,366 326,688
EOPS 75K 0 7,436 5,630 8,493 10,336 5,129 4,121 4,070 2,347 3,307 9,301 2,823
EWD (Inst. Related Grants) 32K 236 1,223 195 127 107 992 165 71 0 0 0 0
FINANCIAL AID 60K 0 1,665 3,096 1,504 1,607 1,032 986 2,039 1,282 1,686 1,268 1,736
HUMANTIES & FINE ARTS 60K 41,735 45,911 22,294 25,058 24,481 43,403 42,616 37,796 20,605 27,466 36,153 38,936
LANGUAGE & LIT. DIVISION 70K 55,836 41,999 30,699 31,376 16,981 44,860 61,919 46,144 23,632 27,318 46,159 66,762
LEARNING DISABILTIY CTR. 110K 4,757 6,083 4,451 2,152 8,727 4,995 1,977 7,331 1,824 3,118 7,925 7,983
LEARNING RESOURCES 32K 7,217 6,270 2,499 1,465 2,116 3,624 6,300 6,438 4,469 2,725 6,713 6,585
MATH WORKROOM 110K 63,637 65,383 55,868 70,644 19,914 44,034 33,674 43,889 41,404 50,390 31,635 51,601
MATH/STAT/ENG 45K 21,359 22,360 6,564 6,860 4,559 17,780 26,830 14,446 13,048 8,742 11,980 23,853
ONE STOP/ CALWORKS 100K 13,011 12,472 12,100 12,547 14,041 5,633 5,396 8,326 19,068 0 5,527 3,574
OPERATIONS 40K 3,481 2,324 2,980 1,904 2,105 2,341 1,887 2,968 389 2,279 3,038 1,654
ORIENTATION (B&W only) 80K 7,604 6,814 5,027 6,083 4,248 4,082 0 0 0 0 0 625
SCC PRES. COPY RM 250K 0 10,763 4,198 4,694 4,776 8,167 7,750 7,234 4,043 6,797 2,803 8,944
SCIENCE & ALLIED HEALTH 110K 89,896 75,001 42,052 43,898 18,252 42,845 68,847 74,314 23,886 31,538 66,016 75,021
SLD 36K 0 48,760 49,107 1,601 236 0 3,373 1,359 285 0 0 0
STAFF RESOURCE CTR. (Toshiba) 60K 0 5,042 967 1,380 222 1 0 0 0 0 0 0
STAFF RESOURCE CTR. (Ricoh) 50K 0 0 0 0 0 0 2,176 1,987 2,993 2,092 3,445 3,074
STUDENT DEV (2 MACHINES) 240K 49,532 41,890 25,945 36,676 42,364 18,038 19,562 0 0 0 0 0
STUDENT DEV (1 MACHINES) 240K 0 0 0 0 0 0 0 7,782 1,904 8,231 18,650 5,738
VP ADMINISTRATION SERVICES 30K 601 712 1,100 900 601 753 483 441 580 725 559 581
WEST SACRAMENTO CTR 100K 29,862 22,337 14,754 16,102 12,516 12,326 34,416 26,869 18,009 24,816 15,827 42,515
TOTAL 949,097 987,780 784,040 690,167 886,559 1,048,337 771,521 885,668 598,228 683,477 922,603 874,751
0% to 10% Over/Under Max Usage
>10% Over Max Usage
Page 35
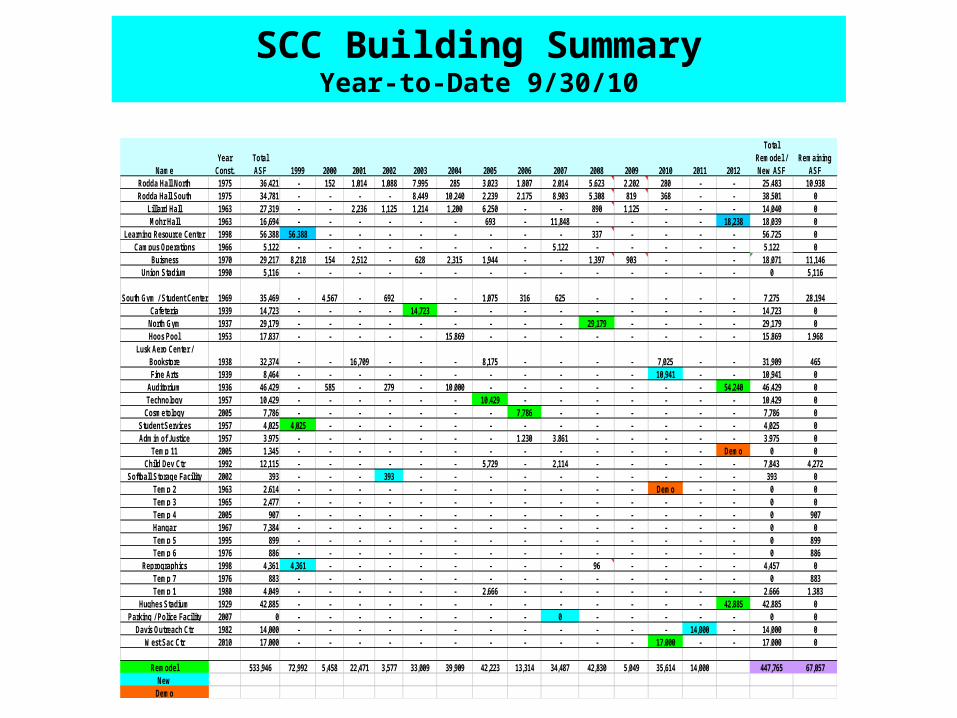
SCC Building SummaryYear-to-Date 9/30/10
NameYear
Const.TotalASF 1999 2000 2001 2002 2003 2004 2005 2006 2007 2008 2009 2010 2011 2012
Total Remodel / New ASF
RemainingASF
Rodda Hall North 1975 36,421 - 152 1,014 1,088 7,995 285 3,023 1,807 2,014 5,623 2,202 280 - - 25,483 10,938Rodda Hall South 1975 34,781 - - - - 8,449 10,240 2,239 2,175 8,903 5,308 819 368 - - 38,501 0
Lillard Hall 1963 27,319 - - 2,236 1,125 1,214 1,200 6,250 - - 890 1,125 - - - 14,040 0Mohr Hall 1963 16,694 - - - - - - 693 - 11,848 - - - - 18,238 18,039 0
Learning Resource Center 1998 56,388 56,388 - - - - - - - - 337 - - - - 56,725 0Campus Operations 1966 5,122 - - - - - - - - 5,122 - - - - - 5,122 0
Buisness 1970 29,217 8,218 154 2,512 - 628 2,315 1,944 - - 1,397 903 - - 18,071 11,146Union Stadium 1990 5,116 - - - - - - - - - - - - - - 0 5,116
South Gym / Student Center 1969 35,469 - 4,567 - 692 - - 1,075 316 625 - - - - - 7,275 28,194Cafeteria 1939 14,723 - - - - 14,723 - - - - - - - - - 14,723 0
North Gym 1937 29,179 - - - - - - - - - 29,179 - - - - 29,179 0Hoos Pool 1953 17,837 - - - - - 15,869 - - - - - - - - 15,869 1,968
Lusk Aero Center / Bookstore 1938 32,374 - - 16,709 - - - 8,175 - - - - 7,025 - - 31,909 465Fine Arts 1939 8,464 - - - - - - - - - - - 10,941 - - 10,941 0
Auditorium 1936 46,429 - 585 - 279 - 10,000 - - - - - - - 54,240 46,429 0Technology 1957 10,429 - - - - - - 10,429 - - - - - - - 10,429 0
Cosmetology 2005 7,786 - - - - - - - 7,786 - - - - - - 7,786 0Student Services 1957 4,025 4,025 - - - - - - - - - - - - - 4,025 0Admin of Justice 1957 3,975 - - - - - - - 1,230 3,861 - - - - - 3,975 0
Temp 11 2005 1,345 - - - - - - - - - - - - - Demo 0 0Child Dev Ctr 1992 12,115 - - - - - - 5,729 - 2,114 - - - - - 7,843 4,272
Softball Storage Facility 2002 393 - - - 393 - - - - - - - - - - 393 0Temp 2 1963 2,614 - - - - - - - - - - - Demo - - 0 0Temp 3 1965 2,477 - - - - - - - - - - - - - - 0 0Temp 4 2005 907 - - - - - - - - - - - - - - 0 907Hangar 1967 7,384 - - - - - - - - - - - - - - 0 0Temp 5 1995 899 - - - - - - - - - - - - - - 0 899Temp 6 1976 886 - - - - - - - - - - - - - - 0 886
Reprographics 1998 4,361 4,361 - - - - - - - - 96 - - - - 4,457 0Temp 7 1976 883 - - - - - - - - - - - - - - 0 883Temp 1 1980 4,049 - - - - - - 2,666 - - - - - - - 2,666 1,383
Hughes Stadium 1929 42,885 - - - - - - - - - - - - - 42,885 42,885 0Parking / Police Facility 2007 0 - - - - - - - - 0 - - - - - 0 0
Davis Outreach Ctr 1982 14,000 - - - - - - - - - - - - 14,000 - 14,000 0West Sac Ctr 2010 17,000 - - - - - - - - - - - 17,000 - - 17,000 0
Remodel 533,946 72,992 5,458 22,471 3,577 33,009 39,909 42,223 13,314 34,487 42,830 5,049 35,614 14,000 447,765 67,057New
Demo
Page 36
Summary & Closing Thoughts• Continuous Process improvement is the goal
– Metric data provides the feedback loop that lets us target the improvement effort
– Your feedback is important and welcomed• Budget challenges remain, but….
– SCC trends are positive, encouraging– Management effort evident in controlling costs Management effort evident in controlling costs
and working with the financial constraints—and working with the financial constraints—BRAVO!!BRAVO!!
• Building the 2010-11 Budget Plan Plus 2– Utilize the Financial Resource Plan– Dependent on State Budget and District inputs
• Keep up the Great Work! Keep up the Great Work!