The copyright of this thesis rests with the University of Cape Town. No quotation from it or information derived from it is to be published without full acknowledgement of the source. The thesis is to be used for private study or non-commercial research purposes only. University of Cape Town
Transcript
The copyright of this thesis rests with the University of Cape Town. No
quotation from it or information derived from it is to be published
without full acknowledgement of the source. The thesis is to be used
for private study or non-commercial research purposes only.
Univers
ity of
Cap
e Tow
n
University of Cape Town
GROWTH OF HIV EXPOSED AND UNEXPOSED INFANTS:
a prospective cohort study in three different settings in South Africa
Student: Vundli Ramokolo
Student number: RMKVUN001
May 2010
A mini dissertation submitted to the University of Cape Town School of Public
Health in partial fulfilment of the requirements for a Masters Degree in Public
Health (Epidemiology)
Univers
ity O
f Cap
e Tow
n
ACKNOWLEDGEMENTS
I would love to thank: Supervisors Tanya, Debra, and David- Thank you very much for guiding and supporting me from the
conception through to the completion of this work. I would also like to thank you for the
countless hours you have spent reviewing my work.
Family & friends
Family - Thank you for your support during this season
Shala: Thank you for always believing in me
Friends- Thank you for your encouragement
Selamawit- I treasure your insightful input
Lord Jesus
I really appreciate Your presence in my life. Ububele Bakho buyangigcina ngci.
Univers
ity O
f Cap
e Tow
n
ii
DECLARATION
UNIVERSITY OF CAPE TOWN
PLAGIARISM
Declaration
1. I know that plagiarism is wrong. Plagiarism is to use another’s work and pretend that it is one’s own. 2. I have used the …HARVARD………………………… convention for citation and referencing. Each contribution to, and quotation in, this essay/report/project/……………… from the work(s) of other people has been attributed, and has been cited and referenced.
3. This essay/report/project/…THESIS……………….. is my own work. 4. I have not allowed, and will not allow, anyone to copy my work with the intention of passing it off as his or her own work.
HAND-IN SLIP CON …………….. CEM Signature: ………………………... Lectures Name: ………………………………… Student Name: VUNDLI RAMOKOLO………………………………. Date: …………………………………………….
Univers
ity O
f Cap
e Tow
n
iii
EXECUTIVE SUMMARY
BACKGROUND AND OBJECTIVES
Malnutrition, which is widespread in many parts of South Africa, is a problem that affects child
growth and predisposes children to early death. Another driver of child mortality in South
Africa is the HIV/AIDS epidemic. An understanding of the interactions between malnutrition
and HIV is therefore important, especially for vulnerable groups such as infants. This study is
aimed to report on growth, in the first 36 weeks of life, of infants in three cohorts of mother-
infant pairs: those infected by their HIV-positive mothers (infected), HIV-negative infants born
to HIV-positive mothers (uninfected), and HIV-negative infants born to HIV-negative mothers
(unexposed). Infant growth was also compared between the three different settings in South
Africa.
METHODS
A prospective cohort study, called the Good Start Study, was conducted in three different
settings in South Africa. Mothers were recruited at 28-36 weeks of pregnancy and followed up
until the 36 weeks post delivery. Infant growth measurements were taken at 3, 24 and 36
weeks during scheduled home visits. The work presented in this document was a secondary
analysis of data collected during the Good Start Study. Mean z-scores were calculated for
length-for-age (LAZ), weight-for-age (WAZ) and weight-for-length (WLZ), and if they were
below minus two, the infant was considered as moderately stunted, underweight and wasted,
respectively. Mean z-scores, stratified by infant HIV exposure and infection status at three
weeks, were plotted against infant age to assess growth over time.
RESULTS
The final sample included 98 infected, 386 uninfected and 193 unexposed infants. Although
these infants differed significantly with regard to some demographic characteristics, these
differences were minor. Infected infants had significantly lower mean WAZ (-1.11) compared to
uninfected (-0.55) and unexposed (-0.55) infants at the three week (P<0.01) and subsequent
Univers
ity O
f Cap
e Tow
n
iv
visit times (P<0.01). Infected infants had significantly (P< 0.01) lower mean WLZ (0.02) than
uninfected (0.72) and unexposed (0.52) infants at 24 weeks. Infected infants had a
significantly lower mean LAZ (-1.09) compared to uninfected (-0.29) and unexposed (-0.44)
infants at 24 week visit (P< 0.01), as well as at the 36 week (P< 0.01), but not the three week
visit (P=0.50). No significant difference (P>0 05) in all mean z-scores was observed between
uninfected infants and unexposed infants. Results from the multivariate analysis showed a
significant (P=0.01) effect of time on the difference in mean WAZ between uninfected infants
and unexposed infants between the 3 and 24 week visit times. Uninfected infants had a
steeper growth trajectory compared to unexposed infants. Infants living in Rietvlei were
significantly (P<0.01) more stunted compared to infants in the wealthier sites of Umlazi and
Paarl.
CONCLUSION
HIV-infected infants in this study were significantly more malnourished compared to uninfected
or unexposed infants. The growth of uninfected infants did not differ significantly from that of
unexposed infants. Early HIV infection and not exposure placed infants at increased risk of
growth failure. Prevention of mother-to-child transmission of HIV and prompt diagnosis of
infant infection at around 6 weeks, with appropriate care including assessment for eligibility for
ARV’s, is critical to prevent malnutrition in HIV-infected children.
Univers
ity O
f Cap
e Tow
n
v
CONTENTS
TABLE OF CONTENTS
ABBREVIATIONS ................................................................................................................................. viii
DEFINITIONS ........................................................................................................................................... ix
Appendix a: Ethics Approval for Good Start Study ............................................................................. 77
Appendix b: Ethics Approval for secondary study ............................................................................... 78
Univers
ity O
f Cap
e Tow
n
vi
LIST OF TABLES
Table 1: Dummy table of mixed effect model .................................................................................... 32
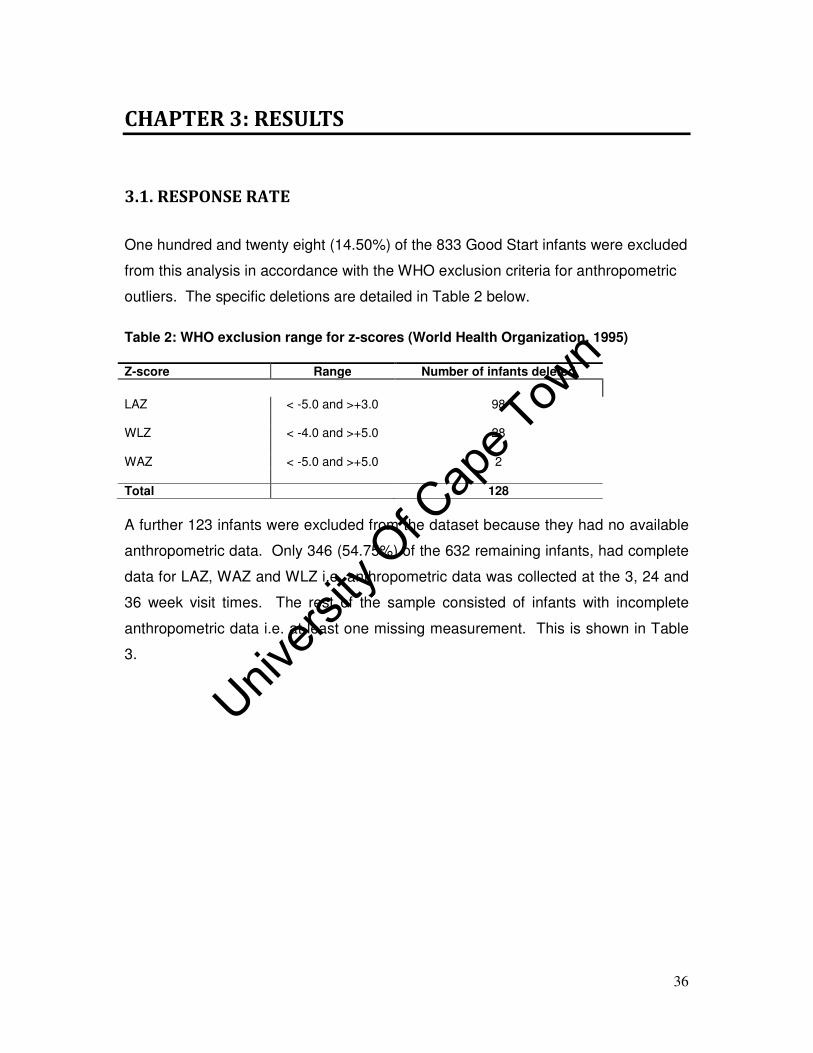
Table 2: WHO exclusion range for z-scores (World Health Organization, 1995) ........................ 36
Table 3: Distribution of anthropometric data ...................................................................................... 37
Table 4: Participant characteristics by anthropometric data availability ........................................ 37
Table 5: Participant characteristics by site ......................................................................................... 39
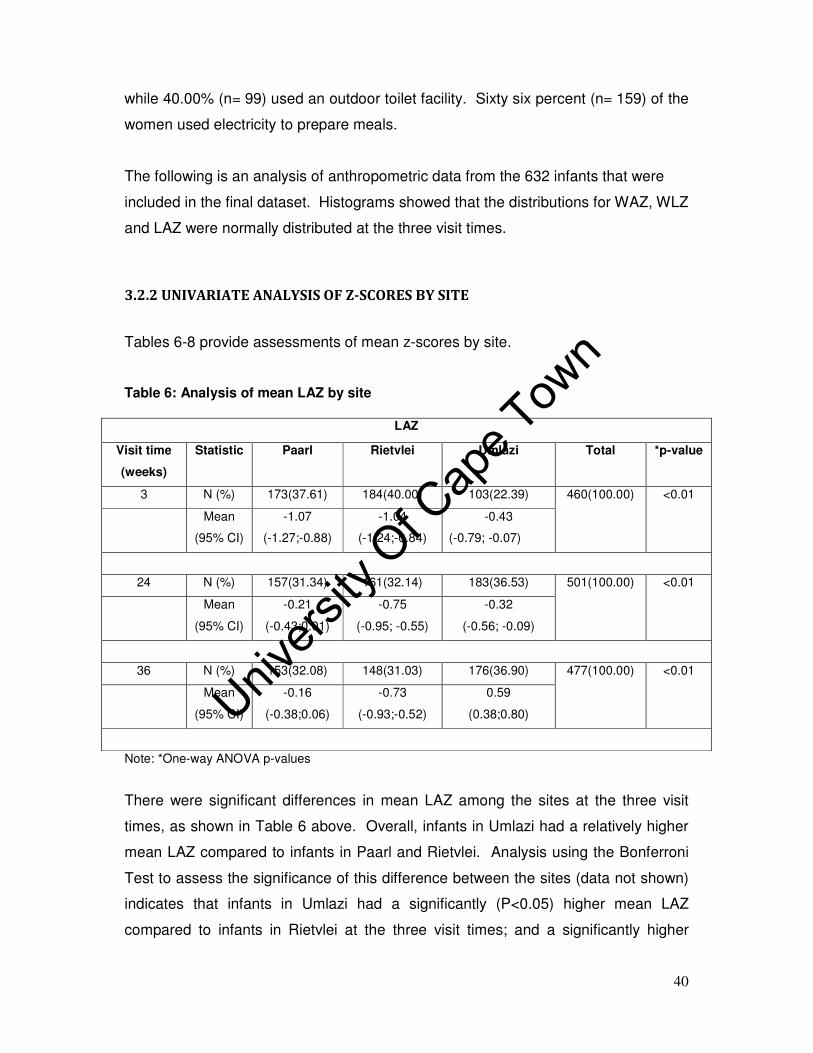
Table 6: Analysis of mean LAZ by site ............................................................................................... 40
Table 7: Analysis of mean WAZ by site .............................................................................................. 41
Table 8: Analysis of mean WLZ by site .............................................................................................. 42
Table 9: Participant characteristics by group ..................................................................................... 43
Table 10: Proportion of underweight (WAZ < -2) infants by group ................................................. 46
Table 11: Summary statistics of WAZ data by group ....................................................................... 46
Table 12: Mixed effect model (adjusted for low birth weight) of longitudinal relationship
between infant HIV status and childhood underweight during the three week and 24 week visit
times ......................................................................................................................................................... 48
Table 13: Mixed effect model (adjusted for low birth weight) of longitudinal relationship
between infant HIV status and childhood underweight during the 24 week and 36 week visit
times ......................................................................................................................................................... 49
Table 14: Proportion of wasted (WLZ < -2) infants by group .......................................................... 51
Table 15: Summary statistics of WLZ data by group ........................................................................ 51
Table 16: Mixed effect model (adjusted for low birth weight) of longitudinal relationship
between infant HIV status and wasting during the three week and 24 week visit times ............ 52
Table 17: Mixed effect model (adjusted for low birth weight) of longitudinal relationship
between infant HIV status and wasting during the 24 week and 36 week visit times ................. 53
Table 18: Proportion of stunted (LAZ < -2 ) infants by group .......................................................... 55
Table 19: Summary statistics of LAZ data by group ......................................................................... 56
Table 20: Mixed effect model (adjusted for low birth weight) of longitudinal relationship
between infant HIV status and stunting during the three week and 24 week visit times ............ 57
Table 21: Mixed effect model (adjusted for low birth weight) of longitudinal relationship
between infant HIV status and stunting during the 24 week and 36 week visit times ................. 58
Univers
ity O
f Cap
e Tow
n
vii
LIST OF FIGURES
Figure 1: UNICEF conceptual framework for the causes of malnutrition ........................................ 8
Figure 2: Cycle of malnutrition and infection in people living with HIV .......................................... 10
Figure 3: Cycle of malnutrition, immunity and infection and poverty ............................................. 15
Figure 4: Data collection schematic diagram ..................................................................................... 21
Figure 5: Infant being weighed during a home visit in the Good Start Study ............................... 22
Figure 6: Infant length measurement taken during a home visit in the Good Start Study .......... 23
Figure 7: Different intercepts for different groups ............................................................................. 32
Figure 8: Different gradients for different groups .............................................................................. 33
Figure 9: Box and Whisker plot of gestational age ........................................................................... 38
Figure 10: Box and Whisker plot of number of live births ................................................................ 38
Figure 11: Childhood underweight mean z-scores versus visit time .............................................. 50
Figure 12: Wasting mean z-scores versus visit time ........................................................................ 54
Figure 13: Stunting mean z-scores versus visit time ........................................................................ 59
Univers
ity O
f Cap
e Tow
n
viii
ABBREVIATIONS
AIDS: Acquired Immune Deficiency Syndrome
ANC: Antenatal care Clinic
ANOVA: Analysis of Variance
ARV: Anti Retroviral
CD4: Cluster of differentiation four
Child PIP: Child Healthcare Problem Identification Programme
CHW: Community Health Worker
HAART: Highly Active Anti-Retroviral Treatment
HIV: Human Immunodeficiency Virus
INP: Integrated Nutritional Programme
LAZ: Length-for-age z-score
Lcl: Lower confidence limit
MDG: Millennium Development Goal
MTCT: Mother-To-Child Transmission
NDoH: National Department of Health
PLHIV: People Living with HIV
PMTCT: Prevention of Mother-To-Child Transmission
PPP: Purchasing Power Parity
SAVACG: South African Vitamin A Consultative Group
SD: Standard Deviation
SOP: Standard Operating Procedures
TALC: Teaching Aids at Low Cost
Ucl: upper confidence limit
UNAIDS: Joint United Nations Programme on HIV/AIDS
UNICEF: United Nations Children’s Fund
VCT: Voluntary Counselling and Testing
WAZ: Weight-for-age z-score
WHO: World Health Organisation
WLZ: Weight-for-length z-score
Univers
ity O
f Cap
e Tow
n
ix
DEFINITIONS
Early Postnatal Transmission: Postnatal vertical transmission before 3 weeks of age
EBF: Feeding only breast milk, without any complementary liquid or solid foods (except
medicines ordered by medical doctors)
EFF: Feeding infant’s only formula milk
Infected infants: HIV infected infants born to HIV positive mothers
MBF: Feeding infants with breast milk in addition to other solids and liquids
MFF: Feeding infants formula milk with additional solids and liquids, but not breast milk
Stunting: Length-for-age z-score less than - 2.0
Underweight: Weight-for-age z-score less than - 2.0
Unexposed infants: HIV-negative infants born to HIV-negative mothers
Uninfected infants: HIV-negative infants born to HIV-positive mothers
Wasting: Weight-for-length z-score less than - 2.0
Univers
ity O
f Cap
e Tow
n
1
CHAPTER 1: INTRODUCTION
1.1 PROBLEM STATEMENT & STUDY JUSTIFICATION
• Malnutrition affects child growth and predisposes children to premature death. It
has a synergistic role in diarrhoea, acute lower respiratory infections and other
infectious diseases and contributes to the burden of low birth weight (Bradshaw
et al., 2003, Sanders et al., 2007) . Child malnutrition is prevalent in many parts
of South Africa, despite efforts by the government, non-governmental
Organisations and other interest groups. The prevalence of malnutrition,
especially stunting, varies according to socio-economic status (SES). The 2005
National Food Consumption Survey reported less stunting in urban (16.00%)
compared to rural (20.00%) children in South Africa (Labadarios, 2008) .
Malnutrition is a complex phenomenon with numerous risk factors. These risk
factors vary between and within countries. The devastating effect of the HIV
epidemic on the health of the nation has made this disease one of the leading
risks for poor health in South Africa. There is, therefore, a need for research on
the association between HIV and malnutrition, especially in vulnerable groups
such as women and children. Findings from studies done in some African
countries indicate that HIV infection impairs early childhood growth. These
studies assessed child growth cross-sectionally, at different points in time. Based
on the premise that infant growth is a time-dependent phenomenon, this current
study went a step further and assessed the longitudinal relationship between
infant growth and HIV exposure and/or infection.
Univers
ity O
f Cap
e Tow
n
2
1.2 LITERATURE REVIEW
It is estimated that 14 million children in Europe were overweight in 2004. Three
million of these children suffered from obesity (The Lancet, 2006) . While many
developed countries have a high burden of lifestyle diseases such as obesity in
children, numerous low-to-middle-income countries still struggle to adequately feed
their young. Diseases of deprivation such as low birth weight (birth weight below
2500g), diarrhoeal diseases and acute lower respiratory infections (pneumonia,
bronchiolitis and bronchitis) remain widespread in these low-to-middle-income
countries. The latest regional estimates of low birth weight range from 6.00% in the
East Asian and Pacific region to 27.00% in the South Asian region. The percentage
of infants with low birth weight is estimated to be 15.00% in the Sub-Saharan African
region (UNICEF, 2009). Diarrhoea and acute lower respiratory infections are
estimated to have accounted for between 15.00% and 18.00% of child deaths,
respectively, in developing countries in 2002(UNICEF, 2004).
Malnutrition, which refers to both under-nutrition and over-nutrition, is also rampant
in developing countries. Under-nutrition involves both protein-energy malnutrition
and micronutrient (iron, zinc, vitamin A and iodine) deficiencies. Over-nutrition is the
excessive intake of energy and/or macronutrients(Faber and Wenhold, 2007).
Malnutrition can also arise due to the consumption of food with inadequate nutrients,
calories and protein, for growth and maintenance, and when individuals have
decreased intake or are not able to absorb and metabolise food because of
infections such as diarrhoea (secondary malnutrition)(World Health Organization,
2008) .
Poor growth in infants and children is one of the first signs of nutrition deprivation.
Anthropometry, which compares the growth measurements of the child against that
of a healthy reference population, can be used to evaluate the nutritional status of
the child. The extent of malnutrition in a population can also be assessed by dietary,
biochemical and clinical methods.
Univers
ity O
f Cap
e Tow
n
3
1.2.1 MEASURING MALNUTRITION
Anthropometry is commonly used to assess malnutrition because it is not only an
objective measure of malnutrition but is also non-invasive and more cost-effective
compared to expensive biochemical methods. The key variables used in
anthropometry are age, sex, height and weight providing weight-for-age (WAZ),
length-for-age (LAZ) or height-for-age (HAZ) and weight-for-length (WLZ) or weight-
for-height (WHZ) measures. These indices classify different nutrition related
conditions in infants and children(Cogill, 2003).
• Low WAZ indicates underweight for that specific age. This index reflects both
stunting (chronic malnutrition) and/or wasting (acute malnutrition) but does not
distinguish between the two. It can therefore be used to capture changes in
the magnitude of malnutrition over time(Cogill, 2003).
• Low HAZ (for children above 2 years of age) and low length-for–age (for
children below 2 years of age) are good measures of past or chronic
malnutrition. They however cannot measure short-term effects of mal-
nutrition. A child with a low HAZ is stunted for that specific age group and this
is a sign of past growth failure(Cogill, 2003).
• Low WHZ (for children above 2 years of age) and low WLZ (for children
younger than 2 years of age) identify acute malnutrition or wasting which often
results from seasonal shortages of food in households(Cogill, 2003).
1.2.2 GLOBAL MALNUTRITION
Malnutrition is the primary cause of death in 50.00% of children under five years of
age. In 2006 approximately 9.7 million children died before their fifth
birthday(UNICEF, 2007). The global prevalence of childhood underweight is
projected to decline by 34.00% (95%CI= –43.00%; –23.00%), from 27.00% in 1990
to 18.00% in 2015. The same trend is expected in developing regions where
childhood underweight is estimated to decrease by 36.00% (95% CI= -45.00%; -
Univers
ity O
f Cap
e Tow
n
4
26.00%) from 30.00% to 19.00%. In Africa however, prevalence of childhood
underweight is forecasted to increase by 12.00% (95% CI= 8.00%; 16.00%), from
24.00% in 1990 to 26.00% in 2015(De Onis et al., 2004).
In 2005, about 20.00% of children living in developing countries were moderately
underweight and 32.00% were stunted. The majority of these children lived in Africa
and Asia. The Southern African sub-region had 30.00% of its child population being
stunted and 11.00% were underweight (Black et al., 2008).
Poor anthropometric outcomes were also prominent in the eastern African sub-
region. Half (24.40 million) of the child population was stunted while 28.00% was
underweight (Black et al., 2008).
The south-central Asian sub-region was one of the worst areas with 33.00% of its
population of children under 5 years of age being moderately underweight and
41.00% were stunted. India, situated in that sub-region, had about 51.00% of its
child population being stunted. This translates to 34.00% of the global prevalence
for stunting and is a cause for concern (Black et al., 2008).
Wasting was less prevalent in comparison to stunting and underweight as only
10.00% of children were wasted globally. Yet again, the south-central Asian sub-
region was one of the most affected areas. The prevalence of wasting was
estimated to be 16.00% in that sub-region and this was the highest globally (Black et
al., 2008).
1.2.3 MILLENNIUM DEVELOPMENT GOALS
The effects of poverty on human health are devastating, and the global community
committed itself to reducing extreme hunger and poverty in the Millennium
Declaration. The Declaration included eight Millennium Development Goals (MDGs)
and 16 targets that address poverty reduction, access to education, gender equality,
health and environmental sustainability. This Millennium Declaration was endorsed
by 189 countries, including South Africa, in September 2000 (United Nations, 2000).
Univers
ity O
f Cap
e Tow
n
5
MDG one, which has two measurable targets, focuses on the eradication of extreme
poverty and hunger. The first target focuses on halving the proportion of people
whose income is less than one dollar a day between 1990 and 2015. Progress
towards achieving this target is monitored by looking at the 1) proportion of the
population whose income is below $1 purchasing power parity (PPP) per day, 2) the
poverty gap ratio [incidence x depth of poverty] and 3) the share of poorest quintile in
national consumption. The second target is to halve, between 1990 and 2015, the
proportion of people who suffer from hunger. Indicator four and five, which measure
the prevalence of underweight children under five years of age and the proportion of
the population below minimum level of dietary energy consumption, respectively, are
used to monitor progress towards this target (United Nations, 2000).
The 2005 South African MDGs country progress report indicated that the proportion
of the population that is living below the international poverty line of US$1 per day
was 7.60% while the proportion of the population living below international poverty
line of US$2 per day was 30.90%. The Gini-coefficient measures the level of income
inequality in a society. It varies between 0 and 1 with the lower numbers (0.0-0.40)
being most desirable as they represent a more equal distribution of income within a
society. The closer to 1 the Gini coefficient is, the more unequal the distribution of
income is in that society (World Bank, 2009). The Gini-coefficient was 0.69 in South
Africa in 2006, indicating an unequal distribution of income in the society. The
overall increase in this coefficient between 1993 and 2006 indicates that the gap
between the rich and the poor is still widening (Government of South Africa and
United Nations, 2005)
1.2.4 MALNUTRITION IN SUB-SAHARAN AFRICA
More than 33.00% of child deaths are attributable to maternal and child under-
nutrition in the sub-Saharan African region(UNICEF, 2007). This region was
forecasted to experience an increase in the number of underweight children. Chopra
and Darnton-Hill (2006) and de Onis (2004) forecasted that the prevalence of
childhood underweight will increase by 9.00% from 26.80% in 1990 to 29.20% in
2015.
Univers
ity O
f Cap
e Tow
n
6
Poor anthropometric outcomes are still prevalent in the sub-Saharan region. About
28.00% of children under five years of age, living in this region, were underweight
between 2000 and 2006(UNICEF, 2007). The Southern African sub-region had
23.00% of its children being underweight (UNICEF, 2007).
Stunting was the most prevalent anthropometric outcome in the sub-Sahara African
region indicating that chronic malnutrition was a serious problem in this region. The
Southern African sub-region had a prevalence of 41.00% between 2000 and 2006
(UNICEF, 2007).
Wasting was the least prevalent anthropometric outcome in sub-Saharan Africa
between 2000 and 2006. The prevalence was least (6.00%) in the Southern African
sub-region. (UNICEF, 2007).
1.2.5 MALNUTRITION IN SOUTH AFRICA
Malnutrition is on a rise in the Sub-Saharan region and in South Africa. Thirty
percent of child deaths in South Africa are attributed to malnutrition(Bradshaw et al.,
2003). The increase in malnutrition in South Africa is strongly associated with the
HIV/AIDS pandemic (Academy of Science of South Africa, 2007) .
1.2.5.1 ANTHROPOMETRIC STATUS OF SOUTH AFRICAN CHILDREN
The latest National Food Consumption Survey estimated that 18.00% of South
African children aged 1-9 years are affected by stunting. Wasting and underweight
affect one in twenty and one in ten South African children, respectively (Labadarios,
2008). Stunting is the most common form of malnutrition in South African children.
Anthropometric outcomes in children vary between the nine provinces in South
Africa. Wasting, in children aged 6-71 months, ranges from 0.70% in Kwa-Zulu
Natal to 3.50% in the Limpopo province. The proportion of stunted children aged
between 6 and 71 months ranges from 11.50% in Gauteng to 34.20% in Limpopo.
Childhood underweight in females ranges from 3.00% in Kwa-Zulu Natal to 12.20%
Univers
ity O
f Cap
e Tow
n
7
in the Northern Cape. It ranges from 3.90% in Kwa-Zulu Natal to 25.70% in the
Northern Cape in males of the same age group(Day and Gray, 2007). According to
the 2005 National Food Consumption Survey, children living in urban settings are the
least (16.00%) affected by stunting. The prevalence stunting varies within these
urban settings with children living in informal urban areas (18.50%) being more
affected by stunting compared to those living in formal urban areas (15.60%)
(Labadarios, 2008). In rural areas, stunting was more pronounced in children (aged
1- 8.9 years) living on commercial farms, according to results from the 1999 National
Food Consumption Survey. Childhood underweight was more prevalent in children
(aged 1- 3 years) living in rural areas, especially those on commercial farms,
compared to urban areas. Wasting, on the other hand, was most pronounced in
children living in urban areas (Steyn et al., 2005)
1.2.5.2 MICRONUTRIENT DEFICIENCIES: THE HIDDEN HUNGER
Hidden hunger, a phenomenon that describes an individual who is deficient of one or
more micronutrients, has a synergistic relationship with infection(Academy of
Science of South Africa, 2007). A child suffering from hidden hunger is seldom
deficient in only one micronutrient. In most cases a child is deficient in two or more
micronutrients which further compromises immune function(Faber and Wenhold,
2007).
1.2.6 DETERMINANTS OF MALNUTRITION
In 1990, UNICEF proposed a strategy for addressing child malnutrition in developing
countries. The two major components of this strategy were 1) a method of
assessment, analysis and action and 2) a conceptual framework for assessing the
determinants of malnutrition in a specific setting (UNICEF, 1998)
The South African Government has a number of programmes that are concerned
with the eradication of malnutrition. A new and more comprehensive, compared to
the previous fragmented food-based programmes, Integrated Nutritional Programme
(INP) was established in 1997. The INP is partly based on 1) the UNICEF
conceptual framework of the causes of malnutrition and 2) their triple A approach of
Univers
ity O
f Cap
e Tow
n
8
accessing a problem such as malnutrition, analyzing its causes and taking action
based on the analysis (National Department of Health, 2009).
Malnutrition is a very complex phenomenon with many causes (see Figure 1). The
United Nations has divided these causes into three main groups, namely, immediate,
underlying and basic causes of malnutrition.
Figure 1: UNICEF conceptual framework for the causes of malnutrition
OUTCOMES
IMMEDIATE CAUSES
UNDERLYING CAUSES
BASIC CAUSES
Univers
ity O
f Cap
e Tow
n
9
1.2.6.1 IMMEDIATE CAUSE OF MALNUTRITION
The two immediate causes of malnutrition, which operate at the individual level, are
inadequate food intake and infection(UNICEF, 1998). Malnutrition has a synergistic
interaction with infections. Therefore, the combined effect of malnutrition and
infection is more intense compared to the sum of the effects of malnutrition and
infection alone (Scrimshaw et al., 1968) . Malnutrition, especially generalised protein
energy malnutrition (PEM), makes one more susceptible to infections because it
interferes with several defence mechanisms such as the production of antibodies,
cell mediated immunity and non-specific defence mechanisms (Scrimshaw and
SanGiovanni, 1997) . PEM also causes atrophy of lymphoid tissue (especially
around the T-lymphocyte areas) and this is particularly seen in children. This
reduces the blood counts of lymphocytes and eosinophils. The various
immunological dysfunctions resulting from malnutrition are collectively termed
male gender (RR= 1.40, 95% CI= 1.05-1.87). Both infant HIV-infection (RR=3.32,
95% CI= 1.96-5.61) and presence of adenopathy (RR=2.26, 95% CI= 1.34-3.83)
were predictors of wasting. Thus HIV-infection and HIV-associated illnesses were
risk factors for poor anthropometric outcomes(Bailey et al., 1999). Regression
analysis showed an odds of falling below minus two z-scores by 20 months for LAZ,
Univers
ity O
f Cap
e Tow
n
12
WAZ and WLZ for HIV-infected infants compared to uninfected infants of 2.10, 2.84
and 2.56 respectively. No maternal variables (age, place and type of residence,
marital status, material possessions, CD4 count and WHO HIV stage), except
maternal stature, were associated with infant growth retardation. Bettylou et al.
(2000) found no significant difference in maternal socio-demographic variables, child
care, hygiene practices, child feeding practices and child growth indices was
reported between HIV-infected infants and HIV-uninfected infants in a study they did
in Nairobi, Kenya. They also reported no significant difference in the growth pattern
of HIV-infected infants and HIV-uninfected infants. Linear growth retardation in HIV-
infected infants has been shown to be associated with viral load (Pollock et al.,
1997). An increase in the viral load of HIV-infected infants corresponds to a decline
in linear growth, but not in weight. Growth faltering among HIV-infected children has
also been shown to be age-dependent. Childhood underweight was more
pronounced between 12 and 36 months of age in a cohort of HIV-infected Rwandan
children. Stunting was most prevalent after 9 months of age(Lepage et al., 1996).
Infant growth has also been explored by maternal HIV infection status. Masaka et al.
(2007) compared the growth of infants born to HIV-infected mothers (HIV-exposed
infants) against that of infants born to HIV-uninfected mothers (HIV-unexposed
infants) in a Zambian based cohort study. Infant HIV status was not assessed due to
ethical reasons. Results showed significantly (p=0.04) lower z-scores for WAZ and
LAZ in HIV-exposed infants compared to HIV-unexposed infants at 6 weeks
postpartum. No significant difference in WLZ was observed between the infant
groups. Patel et al. (2010) compared the growth of HIV-uninfected infants against
that of a reference group of HIV-unexposed infants. These infants were part of the
Vertical Transmission Study (VTS), a cohort study that took place between 2001 and
2004 in the Kwa-Zulu Natal region of South Africa. Results from this study showed
no significant difference in growth between HIV-uninfected infants and HIV-
unexposed infants. WAZ of the HIV-infected infants were below those of the
reference group.
Univers
ity O
f Cap
e Tow
n
13
1.2.6.2 UNDERLYING CAUSES OF MALNUTRITION
The underlying causes of malnutrition operate at the household or family level. They
are divided into the following three subgroups: inadequate access to food;
inadequate care for mothers and children; insufficient health services and unhealthy
environment. These causes lead to inadequate food intake and infection (UNICEF,
1998) .
1.2.6.2.1 INADEQUATE ACCESS TO FOOD
UNICEF defines household food security as the sustainable access to safe and
sufficient (in quality and quantity) food so as to ensure an adequate intake of food for
a healthy life, for all members of the household (UNICEF, 1998). Household food
security depends on the accessibility of food rather than the availability of food.
Food needs to be consistently accessible, both financially and physically, in order for
a family to have food security(UNICEF, 1998).
1.2.6.2.2 INSUFFICIENT HEALTHCARE SERVICES AND AN UNHEALTHY
ENVIRONMENT
Preventative and curative healthcare services are essential in reducing the incidence
and prevalence of diseases which lead to malnutrition. Access to these healthcare
services is therefore important. In terms of curative care, factors such as user fees
and lack of transport to healthcare facilities often deter people from seeking
healthcare. Preventative care addresses several environmental issues that
predispose people to infections, diarrhoea and ultimately malnutrition. These include
poor sanitary conditions, lack of access to safe drinking water and the unhygienic
handling of food (UNICEF, 1998).
1.2.6.2.3 INADEQUATE CARE TO MOTHERS AND INFANTS
In terms of nutrition, care takes into consideration all the household behaviours that
bring about optimum child growth and development using the available food and
Univers
ity O
f Cap
e Tow
n
14
healthcare services. These caring behaviours include appropriate feeding practices,
support for the mother, cognitive stimulation for the child and protecting the child’s
health through preventative measures such as immunization (UNICEF, 1998). Poor
infant weaning practices (OR 3.0, 95%CI 2.0-4.6) and parental death
(OR 38.8, 95%CI 3.8-385.3) were found to be risk factors for severe malnutrition, in
a case control study that took place in the Bushbuckridge District of South Africa.
Factors such as the child support grant (OR 0.44, 95%CI 0.20-0.97) and a diverse
intake of food (OR 0.53, 95%CI 0.41-0.67) were protective against severe
malnutrition (Saloojee and De Maayer, 2007).
1.2.6.3 BASIC CAUSES OF MALNUTRITION
Basic causes of malnutrition operate at the societal level. Cultural, economic,
political and legal factors affect the extent to which a household can provide
adequate nutrition and care for its children (UNICEF, 1998)
1.2.6.3.1 MALNUTRITION AND SOCIO-ECONOMIC FACTORS
The synergism between malnutrition, particularly stunting, and infection is associated
with SES factors and most commonly occurs among poorer communities (Taylor,
1983). Proxy indicators of SES such as ownership of an indoor flush toilet, a
television and maternal education were found to be predictors of stunting in a cohort
of 1 year old Filipino infants (Jones et al., 2008)
Zere and McIntyre (2003)found stunting to be the most prevalent form of malnutrition
in a sample of 8848 South African households. This evidence is supported by the
2005 National Food Consumption Survey which also reported that stunting as the
most common form of malnutrition in South African children. Zere and McIntyre
(2003)also reported an inequitable distribution of stunting within the country. The
Eastern Cape and Northern Province, which are amongst the poorest provinces in
South Africa, had higher rates of stunting compared to other provinces.
Univers
ity O
f Cap
e Tow
n
15
In their paper, (Schaible and Kaufmann, 2007) describe the downward spiral of
malnutrition, infection, diseases and poverty. As illustrated in Figure 3, diseases
result in an energy loss in the individual which leads to a decline in productivity and
development at the community level (Schaible and Kaufmann, 2007) . Populations
with a high burden of infectious diseases, such as malaria, are more likely to lack the
physical capacity to engage in agricultural and industrial labour (Scrimshaw et al.,
1968). The inability to secure employment in these sectors has dire consequences
for poor, illiterate communities that cannot enter the formal job sector. The lack of
employment in these communities leads to more poverty and malnutrition which
spirals back to an increase in disease (Schaible and Kaufmann, 2007).
Figure 3: Cycle of malnutrition, immunity and infection and poverty (Adapted from Schaible and Kaufmann, 2007)
Univers
ity O
f Cap
e Tow
n
16
1.3 HYPOTHESIS
This study aimed to test the hypothesis that infants with early (3 weeks) HIV-infection
have poorer growth in the first 36 weeks of life compared to uninfected infants (born
to HIV positive mothers but remain negative) as well as unexposed infants (born to
HIV-negative mothers). Infant growth was also expected to differ between three
different settings in South Africa namely Paarl, Rietvlei and Umlazi. Infants from
more impoverished households were also expected to have poorer growth outcomes
compared to infants from more well-to-do households.
1.4 AIMS
The aims of this study were:
• To compare growth, in the first 36 weeks of life, of infants in three cohorts of
mother-infant pairs: those infected by their HIV positive mothers (infected), HIV-
negative infants born to HIV-positive mothers (uninfected), and HIV-negative
infants born to HIV-negative mothers (unexposed)
• To compare the anthropometric outcomes of infants living in three different
settings
1.5 OBJECTIVES
The objectives were:
• To compare the anthropometric outcomes of infected infants with those of
uninfected infants and unexposed infants, keeping other variables constant
• To report on the frequency of stunting, wasting and childhood underweight in
three cohorts: infected infants, uninfected infants and unexposed infants
• To compare the anthropometric outcomes of infants living in Paarl, Rietvlei
and Umlazi, while keeping other variables constant
Univers
ity O
f Cap
e Tow
n
17
CHAPTER 2: METHODOLOGY
This current study is a secondary analysis of data collected during the Good Start
Study. It reports on infant growth up to 36 weeks of age in three cohorts with: HIV-
infected infants born to HIV-positive mothers (infected), HIV-negative infants born to
HIV-positive mothers (uninfected), and infants born to HIV-negative mothers
(unexposed).
2.1. PRIMARY STUDY: GOOD START STUDY
In 2001, a National PMTCT Programme was launched in 18 pilot sites in South
Africa. A prospective cohort study was commissioned in 2002 by the National
Department of Health to assess the operational effectiveness, as measured by HIV-
free survival at 36 weeks post-delivery, of this programme. This prospective cohort
study, called the Good Start Study, was conducted in three of the 18 pilot sites
namely Paarl, Rietvlei and Umlazi. The study sites are described in detail below.
The primary outcomes were infant death and HIV transmission from mother to child
by 36 weeks postpartum (Jackson et al., 2007b)
2.1.1 STUDY SITES
The study sites were purposively selected to evaluate PMTCT programme
effectiveness in three South African areas with different socio-economic
circumstances and antenatal HIV prevalence rates(Jackson et al., 2007b). Paarl, in
the Western Cape Province, is a peri-urban/rural area situated 60 km from Cape
Town in the heart of the Cape Winelands district. All deliveries are done at Paarl
Regional Hospital. This area was selected because it had a well resourced PMTCT
programme at the time of the study and was therefore likely to demonstrate good
programme effectiveness. The antenatal HIV sero-prevalence in the area was
9.00% in 2004(Barron et al., 2005). Rietvlei is a rural area situated in the Umzimkulu
sub-district within the Alfred Nzo district, one of the poorest districts in South Africa.
Univers
ity O
f Cap
e Tow
n
18
At the time of the study Alfred Nzo was part of the Eastern Cape Province; it is now
part of Kwa-Zulu Natal province. A community survey in 2001 in the neighbouring
Mount Frere district showed that 40.00% of mothers delivered their last child at
home(The EQUITY Project, 2001). The antenatal HIV prevalence in the Rietvlei
area was 28.00% in 2004(Barron et al., 2005). Rietvlei was chosen to evaluate the
effectiveness of the PMTCT programme in a poor rural area with a high HIV
prevalence. Umlazi, in the Kwa-Zulu Natal Province, is a peri-urban formal township
with both formal and informal settlements situated 20 km southwest of Durban in the
Durban-eThekwini district. There is one regional hospital, Prince Mshiyeni Memorial
Hospital, which serves as a referral hospital for the surrounding feeder clinics.
Delivery services are available at the hospital. The antenatal HIV prevalence in the
Umlazi area was 47.00% in 2004(Barron et al., 2005).
2.1.2 STUDY DESIGN
A prospective cohort design was used to collect data. This design was appropriate
for collecting data on HIV transmission rates, infant deaths, malnutrition, infant
feeding practices, etc.
2.1.3 SAMPLING
2.1.3.1 COMMUNITY AWARENESS
Community health workers (CHWs) and field researchers informed local
communities (both residents and leaders) about the Good Start Study. Study flyers
were also distributed in the communities (Good Start Study Group, 2002).
Univers
ity O
f Cap
e Tow
n
19
2.1.3.2 SENSITISATION AT LOCAL HEALTH FACILITIES
Pregnant women who attended ANC and VCT counselling in the selected local
healthcare facilities were given verbal information about the study. These women
were also given the study flyers (Good Start Study Group, 2002).
2.1.3.3 PARTICIPANT RECRUITMENT
Field researchers recruited eligible women at the respective local hospital or clinic
offering the PMTCT programme. Recruitment either took place antenatally (between
34-36 weeks) at the ANC clinics or postnatally at the postpartum hospital wards.
This recruitment took place between 2002 and 2003 and women were recruited
every day (Monday- Friday) of the week (Good Start Study Group, 2002).
2.1.3.4 INCLUSION CRITERIA
Consecutive women receiving antenatal care at the three study sites (that had
undergone antenatal VCT and tested HIV positive) were recruited for the primary
study. These women were only included in the study if they had signed the informed
consent form and both mother and infant were alive on discharge from delivery
facility. For every three HIV-positive women identified during routine ANC/PMTCT
services, one HIV-negative woman was recruited as a control. This control group of
HIV-negative women was recruited to: 1) allow for comparisons between HIV-
positive and negative women, and 2) to provide an estimate of baseline community
infant feeding patterns in the absence of HIV(Good Start Study Group, 2002).
2.1.3.5 EXCLUSION CRITERIA
Participants were excluded if:
1) The mother had not signed the informed consent form,
2) The mother and/or infant were not alive on discharge from delivery facility,
3) The infant was born with congenital malformations, or
Univers
ity O
f Cap
e Tow
n
20
4) the woman was deemed not mentally competent to provide adequate informed
consent (Good Start Study Group, 2002)
2.1.3.6 STUDY PARTICIPANT RETENTION
Every attempt was made to aid the ability to follow up. During the postpartum
interviews, participants provided detailed directions to their homes. This information
was used by CHWs to locate and follow-up the participants in their respective
communities. Participants that moved from one area to another, within the study
catchment area, were transferred to the CHW working in that area. A participant
loss form was only completed when a participant; 1) moved out of the study area, 2)
was lost to follow-up, or 3) died.
Women that participated in this study were compensated for their participation in the
study and this compensation was based on local norms. The participants were given
food vouchers, cash vouchers and food parcels to the value of R40.00 (Rands) in all
site areas.
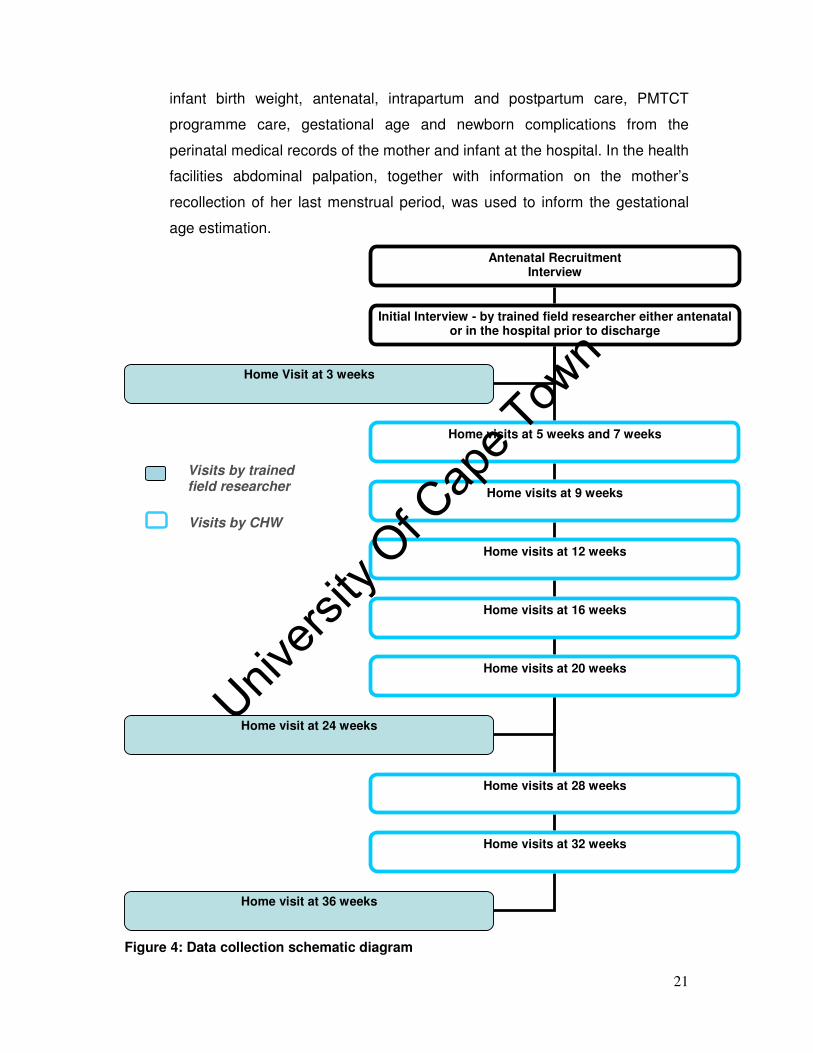
2.1.3.7 DATA COLLECTION
• Data was collected between October 2002 and November 2004. HIV positive
and negative pregnant women (and their infants) were followed up until 36
weeks post-delivery. Semi-structured interviews in the participants’ preferred
language (Xhosa, Zulu, Afrikaans or English) were used to collect data at the
participants’ homes. Data was collected during home visits by a field
researcher (at 3, 24 and 36 weeks post-delivery) and by a CHW (at 5, 7, 9 12,
16, 20, 28 and 32 weeks post-delivery). This data collection schedule is
illustrated in Figure 4. The CHWs collected information on infant diet, infant
health and on visits to the health facilities (Good Start Study Group, 2002).
The field researchers collected data on the following: health care seeking
behaviour (both formal and traditional), infant feeding practices during the
previous four days, influences on decisions around infant feeding choices,
child care practices, maternal and infant morbidity, socio-demographic profile,
matters related to disclosure and family support. They also extracted data on
Univers
ity O
f Cap
e Tow
n
21
infant birth weight, antenatal, intrapartum and postpartum care, PMTCT
programme care, gestational age and newborn complications from the
perinatal medical records of the mother and infant at the hospital. In the health
facilities abdominal palpation, together with information on the mother’s
recollection of her last menstrual period, was used to inform the gestational
age estimation.
Figure 4: Data collection schematic diagram
Antenatal Recruitment Interview
Initial Interview - by trained field researcher either antenatal or in the hospital prior to discharge
Home visits at 5 weeks and 7 weeks
Home visits at 9 weeks
Home visits at 12 weeks
Home visits at 16 weeks
Home visits at 20 weeks
Home visits at 28 weeks
Home visits at 32 weeks
Visits by CHW
Home Visit at 3 weeks
Home visit at 24 weeks
Home visit at 36 weeks
Visits by trained field researcher
Univers
ity O
f Cap
e Tow
n
22
Infants were also assessed for weight and recumbent length measurements during
the field researcher home visits. All sites used the same scales and length boards.
The scales were calibrated with a 2.00 kg weight approximately weekly. Infants were
weighted with minimum clothing e.g. wearing a vest only, on a calibrated Masskot
electronic pan style scale as seen in Figure 5. The weight measurements were then
plotted on the Road to Health Card in order to monitor the child’s growth. Infants
that faltered in growth were referred to the local health facility for further assistance.
Figure 5: Infant being weighed during a home visit in the Good Start Study Recumbent length measurements were obtained using a roller meter (TALC). The
infant was placed on the roller meter on his/her back with the crown of the head
touching the fixed headboard and the shoulders touching the base of the roller
meter. The field researcher then ensured that the infant’s legs were straight and slid
the movable foot board against the soles of the infant’s feet. The recumbent length
reading was then taken as shown in Figure 6.
Univers
ity O
f Cap
e Tow
n
23
Figure 6: Infant length measurement taken during a home visit in the Good Start Study
In order to: a) improve validity and, b) reduce inter and intra-observer bias, the
anthropometry data collection was validated in accordance with the validation SOP.
An initial validation exercise took place during the training of data collectors at local
well baby clinics. The data collector supervisor (DCS) acted as the gold standard as
they had the most experience in weighing and taking the length of infants. The DCS
and a data collector would each weigh and measure an infant waiting for
immunizations. They would each record the measurements without seeing each
other’s results. The mother would then take the baby to the nurse for immunizations.
Following the session with the nurse the baby would again be weighed measured by
both the DCS and the data collector. This process would continue until each data
collector had weighed and measured 10-20 children twice. Disagreements in
measurements were to be discussed and any identified problems addressed through
further training. During the study, validation took the form of double measurements
in the home where two data collectors went together on some visits and both
Univers
ity O
f Cap
e Tow
n
24
weighed and measured length of the infants. Antenatal and hospital records were
also reviewed for antenatal, intra-partum, post-partum and PMTCT programme care
information during all home visits (Good Start Study Group, 2002)
2.1.3.8 LAB METHODS: HIV TEST
Information on the maternal HIV status was obtained from the routine PMTCT
medical records. Infants born to HIV-positive mothers were tested for HIV at 3, 24
and 36 weeks post-delivery. Their HIV status was determined from dried blood
spots using a HIV-1 DNA polymerase chain reaction assay (Amplicor HIV-1 Monitor,
version 1.5; Roche Molecular Systems, Branchburg, New Jersey, USA) (Jackson et
al., 2007b).
2.1.3.9 METHODOLOGY FOR ASSESSING ANTHROPOMETRY
Anthropometric measurements are often reported as standard normal deviations
(SD) or z-scores. The z-score or standard deviation unit is described as the
difference between the value for an individual and the median value of the reference
population for the same age or height, divided by the standard deviation of the
reference population (World Health Organization, 1995).
Median birth weight differed significantly (P<0.01) between the groups.
There was a significant difference in median birth weight between infected infants
and uninfected infants (Two-sample Wilcoxon rank-sum Test, P<0.01). The median
birth weight of infected infants was also significantly different from that of unexposed
infants (Two-sample Wilcoxon rank-sum Test, P<0.01). The median birth weight of
infected infants (3000g) was significantly lower than that of uninfected infants
Univers
ity O
f Cap
e Tow
n
45
(3100g) and unexposed infants (3055g). No significant difference in birth weight was
evident between unexposed infants and uninfected infants (Two-sample Wilcoxon
rank-sum Test, P=0.82).
The groups did not differ significantly with respect to median gestational age
(P=0.42). They also did not differ significantly with respect to the following maternal
characteristics: type of toilet used (Pearson Chi Squared Test, P=0.26), source of
drinking water (Pearson Chi Squared Test, P=0.76-) and source of cooking fuel
(Pearson Chi Squared Test , P=0.78).
3.3 UNIVARIATE AND MULTIVARIATE ANALYSIS OF Z-SCORES BY GROUP
3.3.1 WAZ BY INFECTION AND EXPOSURE STATUS
The main objective of this study was to compare the growth outcomes of three
groups: HIV-positive infants born to HIV-positive mothers (infected), HIV-negative
infants born to HIV-positive mothers (uninfected) and HIV-negative infants born to
HIV-negative mothers (unexposed). Table 10 summarises the number of infants that
were assessed for WAZ at the three visit times. It also shows the percentage of
infants that were underweight in each group. It is followed by the univariate analysis
of mean WAZ by group (Table 11) and the multivariate analysis which is adjusted for
low birth weight (tables 12 and 13). This sub-section then concludes with a graphical
representation of the analysis (see Figure 11). This data analysis approach was
repeated for WLZ (see Tables 14-17) and LAZ (see Tables 18-21).
Univers
ity O
f Cap
e Tow
n
46
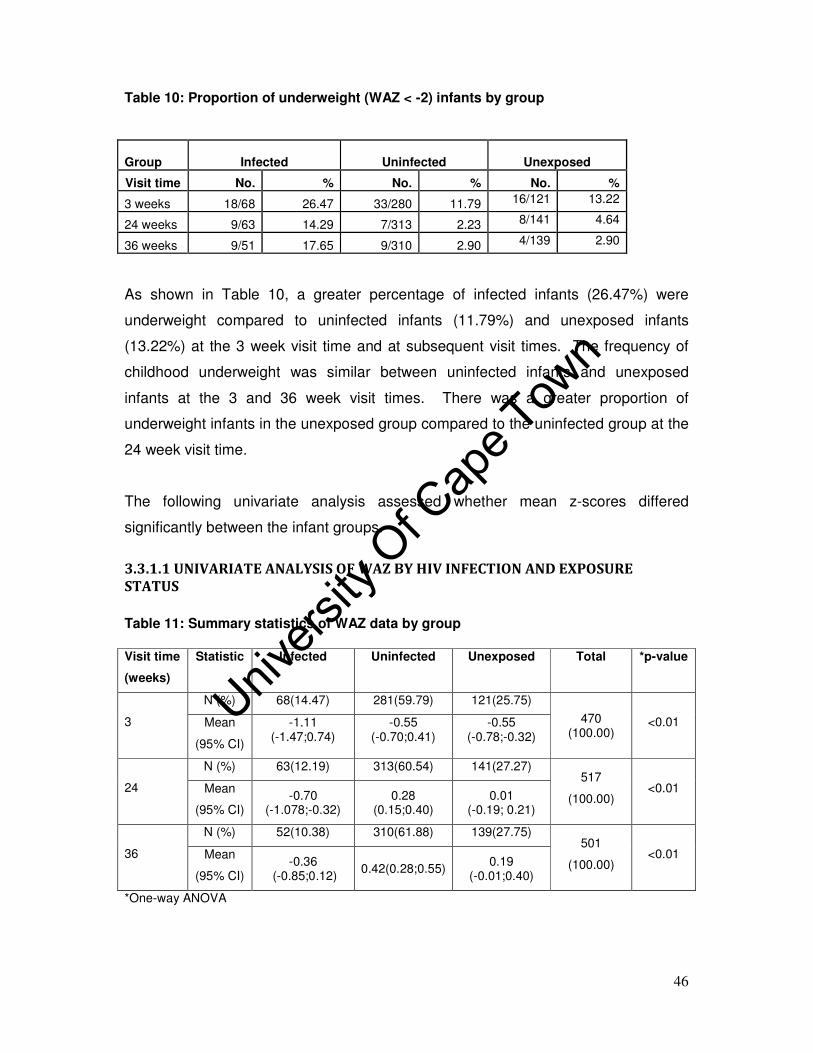
Table 10: Proportion of underweight (WAZ < -2) infants by group
Group Infected Uninfected
Unexposed
Visit time No. % No. % No. %
3 weeks 18/68 26.47 33/280 11.79 16/121 13.22
24 weeks 9/63 14.29 7/313 2.23 8/141 4.64
36 weeks 9/51 17.65 9/310 2.90 4/139 2.90
As shown in Table 10, a greater percentage of infected infants (26.47%) were
underweight compared to uninfected infants (11.79%) and unexposed infants
(13.22%) at the 3 week visit time and at subsequent visit times. The frequency of
childhood underweight was similar between uninfected infants and unexposed
infants at the 3 and 36 week visit times. There was a greater proportion of
underweight infants in the unexposed group compared to the uninfected group at the
24 week visit time.
The following univariate analysis assessed whether mean z-scores differed
significantly between the infant groups.
3.3.1.1 UNIVARIATE ANALYSIS OF WAZ BY HIV INFECTION AND EXPOSURE
STATUS
Table 11: Summary statistics of WAZ data by group
Visit time
(weeks)
Statistic Infected
Uninfected
Unexposed
Total *p-value
3
N (%) 68(14.47) 281(59.79) 121(25.75)
470 (100.00)
<0.01 Mean
(95% CI)
-1.11 (-1.47;0.74)
-0.55 (-0.70;0.41)
-0.55 (-0.78;-0.32)
24
N (%) 63(12.19) 313(60.54) 141(27.27) 517
(100.00) <0.01 Mean
(95% CI) -0.70
(-1.078;-0.32) 0.28
(0.15;0.40) 0.01
(-0.19; 0.21)
36
N (%) 52(10.38) 310(61.88) 139(27.75) 501
(100.00) <0.01 Mean
(95% CI) -0.36
(-0.85;0.12) 0.42(0.28;0.55)
0.19 (-0.01;0.40)
*One-way ANOVA
Univers
ity O
f Cap
e Tow
n
47
Infected infants had significantly (Bonferroni Test, P<0.01) lower mean WAZ
compared to uninfected infants at the 3 week visit time. The mean WAZ of infected
infants was also significantly (Bonferroni Test, P=0.01) lower than that of unexposed
infants. There was no significant difference (Bonferroni Test, P=1.00) in mean WAZ
between uninfected infants and unexposed infants.
The mean WAZ of infected infants was significantly (Bonferroni Test, P<0.01) lower
than that of uninfected infants at the 24 week visit time. The mean WAZ of infected
infants was also significantly (Bonferroni Test, P<0.01) lower than that of unexposed
infants. There was no significant difference (Bonferroni Test, P=0.08) in mean WAZ
between uninfected infants and unexposed infants.
Infected infants had a significantly lower mean WAZ compared to uninfected infants
(Bonferroni Test, P<0.01) and unexposed infants (Bonferroni Test, P=0.02) at the 36
week visit time. There was no significant difference (Bonferroni Test, P=0.26) in
mean WAZ between uninfected infants and unexposed infants.
Univers
ity O
f Cap
e Tow
n
48
3.3.1.2 MULTIVARIATE ANALYSIS OF WAZ BY INFECTION AND EXPOSURE STATUS
Table 12: Mixed effect model (adjusted for low birth weight) of longitudinal relationship between infant HIV status and childhood underweight during the three week and 24 week visit times
WAZ Coefficient 95% CI P value
Uninfected -0.08 -0.32;0.16 0.54
Infected -0.41 -0.75;-0.08 0.02
Visit time 0.02 0.01;0.04 <0.01
Uninfected* visit time 0.02 0.00;0.03 0.01
Infected* visit time -0.01 -0.03;0.01 0.35
Low birth weight -1.53 -1.77;-1.29 <0.01
Constant -0.32 -0.53; -0.12 <0.01
Note: Mixed effect model using the unexposed group and the 3 week visit time as reference
categories
Infected: The mean difference (-0.41) in WAZ between infected infants and
unexposed infants was statistically significant (P=0.02) at the 3 week visit time.
24 week visit time: The difference in the mean WAZ between the 3 and 24 week
visit time was statistically significant (P<0.01) for unexposed infants.
Uninfected* 24week visit time: The significant (P=0.01) interaction between the
uninfected group and the 24 week visit time indicates that the mean difference in
WAZ, between uninfected infants and unexposed infants, depends on the visit time.
The beta-coefficient (0.02) represents the degree to which the mean difference in
WAZ between uninfected and unexposed infants changes when the 3 week visit time
is compared to 24 week visit time.
Low birth weight: Infants with low birth weight had significantly (P<0.01) lower WAZ
compared to infants with normal birth weight at the 3 week visit time.
The beta coefficients for the uninfected group and the interaction term (infected
group * 24 week visit time) were not statistically significant (P>0.05).
Univers
ity O
f Cap
e Tow
n
49
Table 13: Mixed effect model (adjusted for low birth weight) of longitudinal relationship between infant HIV status and childhood underweight during the 24 week and 36 week visit times
WAZ Coefficient 95% CI P value
Uninfected 0.24 -0.01;0.48 0.05
Infected -0.70 -1.05;-0.34 <0.01
Visit time 0.01 0.00;0.02 0.03
Uninfected* visit time -0.00 -0.01;0.01 0.93
Infected* visit time 0.00 -0.02;0.02 0.77
Low birth weight -1.02 -1.32;-0.73 <0.01
Constant 0.16 -0.04;0.36 0.12
Note: Mixed effect model using the unexposed group and the 24 week visit time as reference
categories
Uninfected: The mean difference (0.24) in WAZ between uninfected infants and
unexposed infants was statistically significant (P=0.045) at the 24 week visit time.
Infected: The mean difference (-0.70) in WAZ between infected infants and
unexposed infants was statistically significant (P<0.01) at the 24 week visit time.
36 week visit time: The mean difference in WAZ between the 24 week and 36 week
visit time was statistically significant (P=0.02) for unexposed infants.
Low birth weight: Infants with low birth weight had significantly lower WAZ
compared to infants with normal birth weight (P<0.01) at the 24 week visit time.
The beta coefficients for the uninfected group and the interaction term (infected
group * 36 week visit time) were not statistically significant (P>0.05).
Univers
ity O
f Cap
e Tow
n
50
-1.5
-1-.
50
.5M
ean
(W
AZ
)
3 24 36Visit time (weeks)
lcl/ucl lcl/ucl lcl/ucl
Infected Uninfected (Unexposed)
Figure 11: Childhood underweight mean z-scores versus visit time Note: lcl is the lower confidence level; ucl is the upper confidence level Table 11 shows a comparison of the mean WAZ of three groups of infants: the
unexposed, infected and uninfected. This comparison is graphically illustrated in
Figure 11. In summary, infected infants had a lower mean WAZ compared to
uninfected infants and unexposed infants at the three visit times. The mean
difference in WAZ was not significant between unexposed infants and uninfected
infants at the three visit times. Results from the multivariate analysis showed a
significant effect of time on the difference in mean WAZ between uninfected infants
and unexposed infants. This group*-time interaction is illustrated by the gradients of
the line plots in the figure above. As is evident in the figure, uninfected infants had a
steeper gradient i.e. the growth trajectory which is the change in growth over time,
compared to unexposed infants between the 3 and 24 week visit times. The growth
trajectory of uninfected infants was not significantly different from that of unexposed
infants between the 24 and 36 week visit times. This is illustrated by the parallel
growth trajectories of these two groups between the 24 and 36 week visit times (see
Figure 11).
Univers
ity O
f Cap
e Tow
n
51
3.3.2 WLZ BY HIV INFECTION AND EXPOSURE STATUS
Table 14: Proportion of wasted (WLZ < -2) infants by group
Group Infected Uninfected
Unexposed
Visit time No. % No. % No. %
3 weeks 12/63 19.05 30/271 11.07 15/119 12.61
24 weeks 7/60 11.67 7/299 2.34 9/141 6.38
36 weeks 6/51 11.77 10/290 3.45 8/133 6.02
Table 14 shows the univariate analysis of mean WLZ by group. This is followed by
the multivariate analysis in Tables 15 and 16, which is adjusted for low birth weight.
Figure 12 is a graphical representation of mean WLZ stratified by group.
3.3.2.1 UNIVARIATE ANALYSIS OF WLZ BY HIV INFECTION AND EXPOSURE
STATUS
Table 15: Summary statistics of WLZ data by group
Visit time
(weeks)
Statistic Infected
Uninfected
Unexposed
Total *p-value
3
N (%) 63(13.91) 271(59.82) 119(26.27) 453
(100.00) 0.16 Mean
(95% CI)
-0.22
(-0.66;0.22)
0.18
(-0.00;0.35)
0.19
(-0.10;0.47)
24
N (%) 60(11.98) 300(59.88) 141(28.14) 501
(100.00) <0.01 Mean
(95% CI)
0.02
(-0.38;0.41)
0.72
(0.57;0.87)
0.52
(0.30;0.75)
36
N (%) 51(10.76) 290(61.18) 133(28.060) 474
(100.00) 0.12 Mean
(95% CI)
0.23
(-0.26;0.73)
0.59
(0.44;0.74)
0.43
0.18;0.69
*One-way ANOVA
There was no significant difference in mean WLZ between the groups at the three
week (P=0.16) and 36 week (P=0.20) visit times.
Univers
ity O
f Cap
e Tow
n
52
There was a significant difference (P<0.01) in mean WLZ between the groups at the
24 week visit time. Infected infants had a significantly lower mean WLZ compared to
uninfected infants (Bonferroni Test, P<0.01) and unexposed infants (Bonferroni Test,
P=0.05). There was no significant difference in mean WLZ between uninfected
infants and unexposed infants (Bonferroni Test, P=0.46).
3.3.2.2 MULTIVARIATE ANALYSIS OF WLZ BY HIV AND EXPOSURE STATUS
Table 16: Mixed effect model (adjusted for low birth weight) of longitudinal relationship between infant HIV status and wasting during the three week and 24 week visit times
WLZ Coefficient 95% CI P value
Uninfected -0.03 -0.35;0.28 0.84
Infected -0.29 -0.73;0.15 0.20
Visit time 0.02 0.00;0.03 0.05
Uninfected* visit time 0.01 -0.01;0.03 0.22
Infected* visit time -0.01 -0.03;0.02 0.61
Low birth weight -0.90 -1.20;-0.60 <0.01
Constant 0.28 0.02;0.55
0.04
Note: Mixed effect model using the unexposed group and the three week visit time as
reference categories
Low birth weight: Infants with low birth weight had significantly lower WLZ
compared to infants with normal birth weight (P<0.01) at the three week visit time.
Univers
ity O
f Cap
e Tow
n
53
Table 17: Mixed effect model (adjusted for low birth weight) of longitudinal relationship between infant HIV status and wasting during the 24 week and 36 week visit times
WLZ Coefficient 95% CI P value
Uninfected 0.21 -0.07;0.49 0.14
Infected -0.40 -0.81;0.02 0.07
Visit time -0.01 -0.03;0.00 0.19
Uninfected* visit time -0.00 -0.03;0.02 0.81
Infected* visit time 0.01 -0.03;0.04 0.65
Low birth weight -0.86 -1.18;-0.55 0.00
Constant 0.63 0.40;0.86 0.00
Note: Mixed effect model using the unexposed group and the 24 week visit time as reference
categories
Low birth weight: Infants with low birth weight had significantly decreased WLZ
compared to infants with normal birth weight (P<0.01) at the 24 week visit time.
The beta coefficients for the group effects (both uninfected and infected groups) and
those for the interaction terms (the uninfected* week visit time and the infected*
week visit time) were not statistically significant (P>0.05). This was evident between
the three week and 24 week visit times and between the 24 week and 36 week visit
times (as seen in Tables 16 and 17). The mean differences in WLZ between
infected infants and unexposed infants and between uninfected infants and
unexposed infants were therefore not statistically significant (P>0.05).
Univers
ity O
f Cap
e Tow
n
54
-1-.
50
.51
me
an
(W
LZ
)
3 24 36Visit time (weeks)
lcl/ucl lcl/ucl lcl/ucl
Infected Uninfected Unexposed
Figure 12: Wasting mean z-scores versus visit time Note: lcl is the lower confidence level; ucl is the upper confidence level A comparison of the mean WLZ between the three infant groups is shown in Table
15. This comparison is graphically illustrated in Figure 12 above. As shown in the
figure, there were no significant differences in mean WLZ between the groups at the
three week visit time. The Bonferroni Test shows a significant difference (P=0.05) in
mean WLZ at the 24 week visit time between infected and unexposed infants.
Infected infants had lower mean WLZ compared to unexposed infants. Both the
univariate and multivariate analyses show no significant difference in mean WLZ
between uninfected and unexposed infants at the 24 week visit time. There is no
significant difference in mean WLZ between uninfected and unexposed infants and
between infected and unexposed infants at the 36 week visit time. This result is also
evident in Table 15 above.
The growth trajectories of the groups were not statistically different from each other
and this is indicated by the insignificant interaction terms in Table 16 and Table 17.
Univers
ity O
f Cap
e Tow
n
55
3.3.3 LAZ BY HIV INFECTION AND EXPOSURE STATUS
As was previously done with the other two z-scores, mean LAZ were compared
between the groups using one-way ANOVA. Mixed effect models were also
performed to assess this comparison adjusted for low birth weight. Figure 13 is a
graphical representation of the mean LAZ, at the three time points, stratified by
group.
Table 18: Proportion of stunted (LAZ < -2 ) infants by group
Group Infected Uninfected
Unexposed
Visit time No. % No. % No. %
3 weeks 17/63 26.98 59/272 21.69 20/122 16.39
24 weeks 18/60 30.00 34/299 11.37 19/139 13.67
36 weeks 15/51 29.41 16/292 5.48 19/131 14.50
Univers
ity O
f Cap
e Tow
n
56
3.3.3.1 UNIVARIATE ANALYSIS OF LAZ BY HIV INFECTION AND EXPOSURE STATUS
Table 19: Summary statistics of LAZ data by group
Visit time
(weeks)
Statistic Infected
Uninfected
Unexposed
Total *p-value
3
N (%) 63(13.79) 272(59.52) 122(26.70) 457
(100.00) 0.50
Mean
(95% CI)
-1.12
(-1.53;-0.72)
-0.90
(-1.07;-0.72)
-0.86
(-1.11;-0.61)
24
N (%) 60(12.05) 299(60.04) 139(27.91) 498 (100.00)
<0.01 Mean
(95% CI)
-1.09
(-1.49; 0.69)
-0.29
(-0.46;-0.13)
-0.44
(-0.68;0.20)
36
N (%) 51(10.76) 292(61.60) 131(27.64) 474
(100.00) <0.01
Mean
(95% CI)
-0.79 (-1.29;-0.30)
0.09
(-0.07;0.24)
-0.11
(-0.37;0.15)
*One-way ANOVA
There was no overall significant difference (P=0.50) between the groups at the
3 week visit time.
There was a significant difference (P<0.01) in mean LAZ between the groups at the
24 week visit time. Infected infants had a significantly lower mean LAZ compared to
uninfected infants (Bonferroni Test, P<0.01) and unexposed infants (Bonferroni Test,
P=0.01). There was no significant difference in mean LAZ between uninfected
infants and unexposed infants (Bonferroni Test, P=0.96).
There was a significant difference (P<0.01) in mean LAZ between the groups at the
36 week visit time. Infected infants had a significantly lower mean LAZ compared to
uninfected infants (Bonferroni Test, P<0.01) and unexposed infants (Bonferroni Test,
P<0.01). There was no significant difference in mean LAZ between uninfected
infants and unexposed infants mean LAZ (Bonferroni Test, P=0.56).
Univers
ity O
f Cap
e Tow
n
57
3.3.3.2 MULTIVARIATE ANALYSIS OF LAZ BY HIV INFECTION AND EXPOSURE
STATUS
Table 20: Mixed effect model (adjusted for low birth weight) of longitudinal relationship between infant HIV status and stunting during the three week and 24 week visit times
Note: Mixed effect model using the unexposed group and the three week visit time as
reference categories
24 week visit time: The difference in mean LAZ between the 3 and 24 week visit
time is statistically significant (P=0.01) in unexposed infants.
Low birth weight: Infants with low birth weight had significantly lower LAZ
compared to infants with normal birth weight (P<0.01) at the 3 week visit time.
The beta coefficients for the group effects (both uninfected and infected groups) and
those for the interaction terms (the uninfected* 24 week visit time and the infected*
24 week visit time) were not statistically significant (P>0.05). The mean differences
in LAZ between infected infants and unexposed infants and between uninfected
infants and unexposed infants were therefore not statistically significant (P>0.05).
LAZ Coefficient 95% CI P value
Uninfected -0.11 -0.41;0.20 0.50
Infected -0.23 -0.66;0.20 0.29
Visit time 0.02 0.00;0.03 0.01
Uninfected* visit time 0.01 -0.01;0.03 0.26
Infected* visit time -0.02 -0.04;0.010 0.23
Low birth weight -1.12 -1.40;-0.81 <0.01
Constant -0.68 -0.94;-0.42 <0.01
Univers
ity O
f Cap
e Tow
n
58
Table 21: Mixed effect model (adjusted for low birth weight) of longitudinal relationship between infant HIV status and stunting during the 24 week and 36 week visit times
Note: Mixed effect model using the unexposed group and the 24 week visit time as reference
categories
Infected: The mean difference (-0.61) in LAZ between infected infants and the
unexposed infants was statistically significant (P=0.01) at the 24 week visit time.
36 week visit time: The mean LAZ of unexposed infants increased by 0.03 between
the 24 and 36 week visit time and this increase was statistically significant (P<0.01).
Low birth weight: Infants with low birth weight had significantly lower LAZ
compared to infants with normal birth weight (P<0.01) at the 24 week visit time.
The beta coefficients for the uninfected group effect and those for the interaction
terms (the uninfected* 36 week visit time and the infected* 36 week visit time) were
not statistically significant (P>0.05). The mean difference in LAZ between uninfected
infants and unexposed infants was therefore not statistically significant (P>0.05).
LAZ Coefficient 95% CI P value
Uninfected 0.15 -0.14;0.44 0.32
Infected -0.61 -1.05;-0.17 0.01
Visit time 0.03 0.01;0.05 <0.01
Uninfected* visit time 0.00 -0.02;0.03 0.75
Infected* visit time -0.01 -0.04;0.03 0.69
Low birth weight -0.65 -0.99;-0.32 <0.01
Constant -0.36 -0.61;-0.12 <0.01
Univers
ity O
f Cap
e Tow
n
59
-1.5
-1-.
50
.5m
ean
(L
AZ
)
3 24 36Visit time (weeks)
lcl/ucl lcl/ucl lcl/ucl
Infected Uninfected Unexposed
Figure 13: Stunting mean z-scores versus visit time
Note: lcl is the lower confidence level; ucl is the upper confidence level The mean LAZ for unexposed, infected and uninfected infants are compared in
Table 19. This comparison is graphically illustrated in Figure 13 above. At all the
visit times, exposed infants and unexposed infants did not differ significantly in their
mean LAZ. This result is evident in both the univariate and multivariate analysis.
Infected infants had a significantly lower mean LAZ compared to unexposed infants
at the 24 and 36 week visit times. Although mean differences in z-scores differed
between some groups, growth trajectories did not differ significantly by group. This
is indicated by the non-significant interaction terms in Table 20 and Table 21
Univers
ity O
f Cap
e Tow
n
60
CHAPTER 4: DISCUSSION
The following three sub-sections discuss the main findings in the context of other
literature, using the study objectives as a framework.
4.1.1 MATERNAL AND INFANT CHARACTERISTICS
Infants with missing anthropometric data differed significantly from those with
complete data with respect to parity and gestational age. Although the median parity
was the same between the two groups, the standard deviation of the parity was not.
The median gestational ages of the two groups were the same. Although the
medians (measure of central tendency) of the gestational ages of these two groups
were the same, the distributions were not. The missing group had six outlying
values for gestational age as compared to three outliers in the non-missing group.
These values skew the distribution of the data towards one side. The more skewed
nature of the missing data, together with the wider inter-quartile range of the missing
data compared to the non-missing group, may partly explain why the distributions
between the two groups were significantly different from each other.
These results indicate that infants with missing anthropometric data may have been
systematically different from infants with complete anthropometric data with respect
to parity and gestational age.
Univers
ity O
f Cap
e Tow
n
61
4.1.2 INFANT GROWTH AND HIV
The first objective of this study was to assess growth outcomes of HIV-exposed
infants and unexposed infants. The analysis involved both univariate and
multivariate statistical methods.
Results from the univariate analysis, which assessed the point prevalence of
malnutrition, showed significant differences in mean z-scores between some of the
groups. A comparison of the mean z-scores showed significantly lower mean WAZ
in HIV-infected infants compared to uninfected infants at the three visit times. HIV-
infected infants were therefore lighter compared to uninfected infants. This result is
consistent with findings from other studies (Bailey et al., 1999, Bobat et al., 2001,
Lepage et al., 1996, Patel et al., 2009). The loss of weight in people infected with
HIV is reported to be associated with an increase in resting energy expenditure and
protein turnover (Academy of Science of South Africa, 2007).
Mean LAZ was not significantly different between infected infants and unexposed
infants at the 3 week visit time but was significant at the 24 and 36 week visit times.
Bobat et al. (2001) and Patel et al. (2009) also reported no significant difference in
mean LAZ between infected infants and unexposed infants at birth but a significant
difference from 3 months onwards. The mean LAZ of infected infants was
significantly lower than that of unexposed infants indicating that the infected infants
were shorter in stature.
HIV-infected infants were significantly more wasted compared to uninfected infants
at the 24 week visit time. No significant difference in mean WLZ was evident
between HIV-infected infants and uninfected infants at the 3 and 36 week visit times.
Similarly, the mean WLZ of infected infants was not consistently lower than that of
uninfected infants in the Lepage et al. (1996) study. A significant difference in
wasting was observed at ages 3, 6, 24 and 36 months. No significant difference was
evident at ages 9, 12, 18, 21, 24, 27, 30, 33, 39 and 45 months (Lepage et al.,
1996). It is suggested that HIV-infected infants could have experienced proportional
declines in length and weight during these instances, resulting in them having WLZ
similar to those of uninfected infants (Isanaka et al., 2009).
Univers
ity O
f Cap
e Tow
n
62
The univariate analysis revealed no significant difference in mean z-scores between
uninfected infants and unexposed infants at the three visit times. The growth of
uninfected infants was therefore comparable to that of unexposed infants at the three
visit times, confirming results observed in other studies (Bailey et al., 1999, Lepage
et al., 1996, Patel et al., 2009). This suggests that HIV infection, and not exposure,
affects infant growth. The multivariate analysis, however, showed a striking
difference in mean WAZ between uninfected infants and unexposed infants between
the 3 and 24 week visit times. Uninfected infants had a steeper growth trajectory
compared to unexposed infants. The greater rate of change in growth through time
in uninfected infants compared to unexposed infants could be related to differences
in infant feeding practices between HIV positive mothers and HIV negative mothers.
Literature shows that mixed breast feeding (MBF), which involves feeding the infant
breast milk together with other liquids and solids, was common among the HIV-
negative Good Start Study mothers throughout the study period (Goga et al., [In
Press]). Exclusive breastfeeding was uncommon amongst this group. Avoiding
breast feeding was more (47.00%) common among the HIV-positive mothers
compared to exclusive breast feeding (22.00%) at the 3 week visit time (Goga et al.,
[In Press]). Mothers who avoided breast feeding fed their infants commercial
formula milk together with other nutritive and non-nutritive liquids and solids. This
feeding practice is defined as mixed formula feeding (MFF) and was also observed
at the 24 and 36 week visit times (Goga et al., [In Press]). This formula feeding of
HIV uninfected infants could have resulted in the faster rate of growth of these
infants compared to unexposed infants. Previously published studies have reported
greater weight gain in formula fed infants compared to breastfed infants (Dewey et
al., 1992, Dewey et al., 1993, Dewey, 1998a, Dewey, 1998b). This is mainly
attributed to the higher intakes of both energy and protein by formula fed infants
compared to breastfed infants (Heinig et al., 1993).
4.1.3 FREQUENCY OF MALNUTRITION
The second objective was to report on the frequency of stunting, wasting and
childhood underweight in the three groups. Stunting, wasting and childhood
Univers
ity O
f Cap
e Tow
n
63
underweight were more pronounced in HIV-infected infants. These infants remained
more malnourished compared to uninfected infants and unexposed infants
throughout the study period. Research has found that HIV-infected infants do not
catch-up in growth outside of interventions such as ARV treatment(Academy of
Science of South Africa, 2007). None of the infants in this study were on ARV
treatment as the study was conducted before paediatric ARV treatment became
available.
4.1.4 INFANT GROWTH AND SITE
The third objective of this study was to compare the anthropometric outcomes of
infants living in Paarl, Rietvlei and Umlazi. Results showed that stunting was most
common amongst infants from Rietvlei, which was the least developed of the Good
Start sites. Households in this area generally drank non-piped water, did not have
an indoor flush toilet and used wood as a source of cooking fuel. A study by (Jones
et al., 2008) showed that access to an indoor flush toilet was a predictor of stunting
in a cohort of 1 year old Filipino infants. This could be due to the fact that infants
living in environments with poor sanitation, such as those with no indoor flush toilet,
are likely to get infections which have been shown to have a synergistic relationship
with stunting(Jones et al., 2008).
Stunting was least prevalent in Umlazi, a peri-urban township area in Kwa-Zulu
Natal. All the participants sampled in Umlazi drank piped water. The majority of
these participants had access to an indoor flush toilet and used electricity to prepare
meals. Infants in Umlazi were significantly longer (greater LAZ) than those in Paarl
and Rietvlei. Their weight (WAZ) was between that of infants in Paarl and Rietvlei.
When their LAZ and WAZ were combined into the WLZ measurements, these infants
had the lowest WLZ. As is widely known, length measurements are less reliable
compared to weight measurements. While it was not examined it specifically, no
indication was seen over the course of the study to indicate that length was less
reliably measured in Umlazi compared to the other two sites. Therefore poor
measurement of infants in Umlazi is not a likely explanation for the above-mentioned
results. Another possible explanation could be missing data. Infants in Umlazi had
Univers
ity O
f Cap
e Tow
n
64
significantly (Pearson chi, P<0.01) more missing anthropometric data (n=78)
compared to infants in Paarl (n=9) and Rietvlei (n=36).
Infants in Paarl, a peri-urban farming area, were more stunted compared to infants in
Umlazi. These results are consistent with data from the latest National Food
Consumption Survey which showed that stunting is more prevalent in rural formal
areas (commercial farms) compared to urban formal areas (Labadarios, 2008) . This
partly explains why stunting was more prevalent in Paarl, which is partially
comprised of a farming population, compared to Umlazi. (Jackson et al.,
2007a)propose that stunting in Paarl children could be associated with the high
(>20.00% compared to a national prevalence of 15.00%) rate of low birth weight in
that region. This low birth weight rate is largely attributable to intrauterine growth
restriction from high smoking and alcohol use in pregnancy, which puts infants at risk
of being stunted in childhood.
4. 2 STRENGTHS OF THIS STUDY
The repeated measures taken in longitudinal studies require data analysis
methods that adjust for the correlation that exists between these repeated
measures (Isanaka et al., 2009). The mixed effects (random coefficients)
analysis was used in this study to account for this correlation. The use of
mixed effect modelling to assess the relationship between HIV infection
and/or exposure and infant growth makes this study particularly unique from
previously published research (Bailey et al., 1999, Bakaki et al., 2001, Bobat
et al., 2001, Lepage et al., 1996). The modelling allowed for a comparison of
growth cross-sectionally at the three time points and longitudinally by
comparing the growth trajectories. The longitudinal data analysis not only
allowed the comparison of point prevalence of malnutrition at the three visit
times, but also enabled an assessment of the rates of growth between the
groups.
Univers
ity O
f Cap
e Tow
n
65
• To my knowledge, this study is one of the first to compare the growth of three
groups of South African infants: 1) HIV-infected infants; 2) uninfected infants
that were exposed to HIV and 3) unexposed infants born to HIV-negative
mothers. Patel et al. (2009)also compared growth patterns amongst three
group of infants in South Africa. Their comparison was however restricted to
differences in weight gain. They did not assess differences in linear growth
between the infant groups. This work is also different from the analysis done
by Bobat et al.(2001). Their work was restricted to infants born to a cohort of
HIV-positive South African women. A comparison group of infants born to
HIV-negative mothers was not included in the study.
• The growth patterns of the infected infants were compared against those of
uninfected infants in the univariate analysis of this study. Seeing that these
infants were all born of HIV-infected mothers, this comparison assessed infant
growth while controlling for socio-economic differences that may have existed
between infants of HIV-positive mothers and those of HIV-negative mothers.
Including a group of unexposed infants in the current study enabled
comparison of growth of HIV exposed infants against that of a population-
based control group of unexposed infants. Therefore infant growth was also
explored by HIV exposure status.
4.3 STUDY LIMITATIONS
• This study involved a secondary analysis of data collected during the Good
Start Study. One disadvantage of doing secondary analysis is that one uses
data that were collected for another purpose. The sampling frame, research
questions, and data collection process were designed to address the objective
of the primary study (Coyer and Gallo, 2005). Unlike in the primary study, the
main objective of this secondary analysis was to assess malnutrition in three
infant cohorts at three time points. A change in the study objective affects the
extent to which the existing data can be used to address new questions. The
current analysis was limited to drawing conclusions about associations and
was not used to assess causality. Another disadvantage of secondary data
Univers
ity O
f Cap
e Tow
n
66
analysis is that the researcher has no influence over the data collection
process (Coyer and Gallo, 2005). The secondary analysis is therefore often
limited by data availability and quality. Anthropometric data quality was
addressed according to the WHO guidelines in this study and this is detailed
in sub-section 2.2.2.1 below. Secondary analysis was performed on all
available information subsequent to data cleaning. A sample size estimation
for this analysis would therefore be hypothetical and would not be a true
reflection of the rigour of the analysis. Nevertheless secondary analyses are
considered a valid design when source data used in the analyses are seen to
have been validly collected as was the case in the Good Start Study.
Not all of the anthropometric data were available for analysis. As mentioned
before, a total of 883 infants were recruited in the Good Start study. One
hundred and twenty eight (14.50%) of the 833 Good Start infants were
excluded from this analysis in accordance with the WHO exclusion criteria for
anthropometric outliers. A further 123 infants were excluded from the dataset
because they had missing anthropometric data. The remaining 632 (71.57%)
infants had anthropometric data for some of the visit times i.e. at least one
missing measurement. This attrition, referred to as intermittent missing data,
was for the most part at random in this sample (Twisk, 2003). Only 346
(54.75%) of these 632 infants had complete anthropometric data. This data
quality issue is not unique to this study as it is a known limitation of
longitudinal studies. Patel et al. (2010) also reported similar data quality
issues. They assessed child growth by maternal and child HIV status in a
cohort of South African children. A total of 1498 children were born to HIV-
infected mothers. Thirty-six pairs of twins and 43 children with reported
extreme gestational ages were excluded from the total. A further 122 children
were excluded from the dataset leaving 1261 children (84.18%), with at least
one weight measurement after birth, for analysis. A total of 1432 children
were born to HIV-uninfected mothers. Of these, 1061 (74.09%) were
considered in the analysis. Hence the current study is consistent with losses
seen in similar anthropometry studies and could be considered valid in the
context of current literature.
Univers
ity O
f Cap
e Tow
n
67
• The current study assessed associations between HIV (infection or exposure)
and infant growth and did not explore causal relationships. Seeing that both
infant growth and HIV status are time varying variables, results from this study
may be subject to temporality. One cannot establish from results in this study
whether poor growth predisposed the infant to HIV infection or whether HIV
infection leads to poor growth. However, given that the infants were infected
by three weeks of age it is unlikely that the poor growth predisposed the
infants to infection and many of the relationships between infection status and
growth remained significant after adjusting for low birth weight.
• Another limitation is that some infants, that were HIV negative at the 3 week
visit time, could have sero-converted during the follow-up period.
Nevertheless, early transmission has consistently been seen in the literature
to be the strongest predictor of child morbidity and mortality (UNAIDS, 2010)
so we have also concentrated on this factor in this analysis.
• As is common in observational cohort studies, this study is subject to bias.
Bias could have been introduced through self-selection of participants into the
infant feeding groups. In randomized controlled trials this problem is resolved
by blind-selecting the participants and assigning them into an exposure group.
Randomization is used to control for both known and unknown confounders.
To control for the potential confounding effect of birth weight, we adjusted for
this variable in the mixed effect models. We however did not adjust for other
confounders that are associated with infant growth e.g. gestational age. Low
Birth Weight and gestational age are highly correlated so including both in the
models may have led to collinearity issues and it was felt that low birth weight
was the more direct measure being an anthropometric indicator.
• Single anthropometric measurements were taken by individual data collectors.
These measurements are therefore subject to measurement error and intra-
observer bias, even though validity checks were performed periodically to
improve the validity of the data. The validity of the measurements, especially
the less reliable length measurements, could have been improved by
Univers
ity O
f Cap
e Tow
n
68
averaging the length or weight measurements of two independent data
collectors. Dual measurement however was not practical in this setting and
validity checks during the study suggest current data is reasonably valid and
reliable.
• The infants with complete anthropometric data differed significantly from those
with missing anthropometric data with respect to parity and gestational age.
The median gestational age was similar between the two groups but the
distribution of the gestational ages differed significantly. The difference in the
distributions can be attributed to the influence of extreme gestational age
values, depicted in the box and whisker plots, on the spread of the data.
Gestational age was approximated using information on the date of the last
menstrual period and by abdominal palpation, methods of estimation are
subject to measurement error. This may have resulted in the extreme
gestational age values being calculated. Infants with extreme gestational ages
were not excluded from the analysis. Gestational age was not adjusted for in
the analysis and the rational for this is noted above.
• Another limitation is the poor adherence to exclusive infant feeding amongst
both HIV-positive and HIV-negative women in the Good Start sample. The
homogeneity of feeding practices, due to the majority of the mothers mixed
feeding, limited the extent to which differences in growth could be assessed
across different infant feeding practices.
4.4 GENERALISABILITY OF RESULTS
The generalisability of the study findings is limited to other South African settings
with similar characteristics (social, demographic, economic and HIV prevalence) as
Paarl, Rietvlei and Umlazi.
Univers
ity O
f Cap
e Tow
n
69
4.5 RECOMMENDATIONS
4.5.1 EARLY IDENTIFICATION OF HIV-INFECTED INFANTS
• The results from this study show that HIV-infected infants have poorer growth
outcomes compared to uninfected infants. This therefore emphasizes the
importance of early infant HIV diagnosis to identify these high risk infants and
rapid commencement of appropriate care and treatment. Early and continued
infant growth monitoring, particularly in HIV exposed infants is also critical as
growth retardation can be used as a marker of vertical transmission in the
absence of DNA PCR confirmation.
4.5.2 EARLY INITIATION OF ARV THERAPY & TREATMENT OF OPPORTUNISTIC
INFECTIONS
• HIV-infected infants in this study remained more malnourished compared to
uninfected infants. Early identification of HIV positive infants at or before 6
weeks is therefore important as it will facilitate the timely placement of eligible
infants on ARV therapy, which has been shown to have a positive effect on
growth(Violari et al., 2008). The new national PMTCT protocol to be
implemented from April 1st 2010 (The Presidency, 2009) recommends that all
infants diagnosed HIV positive before one year of age should be started on
ARV treatment immediately. This should have a notable impact on the growth
of these infants.
• In addition, an improvement in the prevention and treatment of opportunistic
infections through provision of Cotrimoxazole prophylaxis in HIV-positive infants
can contribute to the reduction of malnutrition considering that illness affects both
the intake and absorption of nutrients (Academy of Science of South Africa,
2007). Data from the Good Start study has shown that coverage of
Cotrimoxazole was low in both Umlazi and Rietvlei sites(Jackson et al., 2007b)
Univers
ity O
f Cap
e Tow
n
70
4.5.3 STRENGTHNING OF NDoH PROGRAMMES
Malnutrition has a synergistic relationship with infections. An infant infected with
HIV, which is a chronic infection, has a high chance of not catching up in growth and
of dying. Research shows that HIV-infected infants who are not on ARV treatment
do not catch-up in growth even if food intake is adequate. Malnutrition was more
common among HIV-infected infants in this study. The majority of the paediatric HIV
infections in South Africa are either acquired perinatally, during labour, or postnatally
due to poor feeding practices(Academy of Science of South Africa, 2007).
Therefore, prevention of HIV infection needs to be intercepted at these three points.
The role out of ARV prophylaxis through PMTCT in South Africa has made it
possible for many infants, born to HIV-positive mothers, to remain HIV-negative.
The new PMTCT regimen with HAART for women with CD4 counts below 350 and
dual prophylaxis for those with CD4 counts above 350 needs to be scaled up as this
should dramatically reduce HIV infection and therefore malnutrition in infants and
children.
An analysis of the frequency of malnutrition showed that malnutrition was still
prevalent amongst uninfected infants at the time of the study. Malnutrition is
therefore still a reality in the absence of the HIV epidemic. More effort needs to be
fuelled into reducing the prevalence of malnutrition in the general child population in
South Africa. The prevalence of malnutrition can also be reduced through the
strengthening of other programmes adopted by the NDoH. These include the
Integrated Nutrition Programme (INP), Expanded Program on Immunization (EPI),
Integrated Management of Childhood Illnesses (IMCI) and the WHO 10 STEPS for
management of severe malnutrition.
4.5.4 PROMOTE EXCLUSIVE INFANT FEEDING
• Universal coverage with exclusive breastfeeding (EBF) and continued
breastfeeding (BF) – i.e. breast milk and complementary foods - up to one
year may prevent 13.00% of under-five deaths globally, even in the presence
of HIV. Exclusive infant feeding rates were low in the Good Start sample.
Univers
ity O
f Cap
e Tow
n
71
Mixed feeding, which increases the risk of vertical transmission, was the
predominant infant feeding practice. There is therefore an urgent need to
improve the promotion of exclusive infant feeding practices.
4.5.5 IMPROVE SURVEILLANCE OF INFANT GROWTH OUTCOMES
• Surveillance of malnutrition rates at the national level needs to be more
frequent. Current malnutrition rates are based on the South African
Demographic and Health Survey (DHS) from 1998. National wasting and
stunting statistics for the 6-71 months age bracket are derived from the 1999
SAVACG Survey. National statistics for childhood under weight, stunting and
wasting for both the 12-71 month and 1-9 years age brackets are taken from
the 1998 DHS. An increase in childhood malnutrition can be used as an
indicator of underlying events such as the increase in diarrheal diseases in
infants or the malfunctioning of PMTCT programmes resulting in an increase
in MTCT and a subsequent increase in malnutrition. An improvement in the
monitoring of malnutrition can therefore enable the government and other
interest groups to identify and to respond to such events more effectively.
• There is also a need for national malnutrition statistics for infants younger
than 6 months so that the impact of programmes such as the INP and PMTCT
can be monitored. In resource poor settings with poor sanitary conditions and
lack of clean water, formula fed infants are at a greater risk of diarrheal
diseases which may lead to malnutrition. Breastfeeding is a more preferable
feeding option in such environments. The impact of interventions such as
exclusive breastfeeding on the prevalence of malnutrition can only be seen if
malnutrition indicators are also collected for infants less than 6 months.
4.6 FUTURE RESEARCH
• The current study assessed associations between HIV (infection or exposure)
and infant growth and did not explore causal relationships. Further
exploration of the direction and magnitude of the association between these
variables is needed.
Univers
ity O
f Cap
e Tow
n
72
• The comparison of infants by feeding mode was limited by the high levels of
mixed feeding in the cohort. Mixed feeding is associated with an increased
risk of MTCT which ultimately puts the infant as risk of malnutrition. Therefore
studies assessing the relationship between growth and exclusive infant
feeding practices amongst HIV-infected and uninfected infants are needed.
Univers
ity O
f Cap
e Tow
n
73
REFERENCES
ACADEMY OF SCIENCE OF SOUTH AFRICA 2007. HIV/AIDS, TB and nutrition: Scientific inquiry into the nutritional influences on human immunity with special reference to HIV infection and active TB in South Africa. Pretoria: Academy of Science of South Africa
BAILEY, R. C., KAMENGA, M. C., NSUAMI, M. J., NIEBURG, P. & ST LOUIS, M. E. 1999. Growth of children according to maternal and child HIV, immunological and disease characteristics: a prospective cohort study in Kinshasa, Democratic Republic of Congo. International Journal Epidemiology, 28, 532-540.
BAKAKI, P., KAYITA, J., MOURA, M., JORGE, E., COULTER, J. B. S., TINDYEBWA, D., NDUGWA, C. M. & HART, C. A. 2001. Epidemiologic and clinical features of HIV-infected and HIV-uninfected Ugandan children younger than 18 months. Journal
of Acquired Immunodeficiency Syndrome, 28, 35-42. BARRON, P., DAY, C., LOVEDAY, M. & MONTICELLE, F. 2005. The district health
barometer year 1: January-December 2004. Durban: Health Systems Trust. BEISEL, W. R. 1996. Nutrition and immune function: overview. The journal of nutrition,
126, 2116S-2615S. BETTYLOU, S., EMBREE, J. E., MEI, Z., NDIYA-ACHOLA, J., NJENGA, S.,
MUCHUNGA, E. R., BETT, J. & PLUMMER, F. A. 2000. Sociodemographic characteristics, care, feeding practices ad growth of cohorts of children born to HIV-1 seropositive and seronegative mothers in Nairobi, Kenya. Tropical Medicine and
International Health, 5, 678-686. BLACK, R. E., ALLEN, H. L., BHUTTA, A. Z., CAULFIELD, E. L., DE ONIS, M.,
EZZATI, M., MATHERS, C. & RIVERA, J. 2008. Maternal and child undernutrition: global and regional exposures and health consequences. The Lancet, 371, 243-260.
BLAND, J. & ALTMAN, D. 1995. Multiple significance tests: the Bonferroni method. British Medical Journal, 310, 170.
BOBAT, R., COOVADIA, H., MOODLEY, D., COUTSOUDIS, A. & GOUWS, E. 2001. Growth in early childhood in a cohort of children born to HIV-1 infected women from Durban, South Africa. Annals of Tropical Paediatrics, 21, 203-210.
BOX, G. E. P. 1953. Non-normality and tests on variances. Biometrika, 40, 318-335. BRADSHAW, D., BOURNE, D. & NANNAN, N. 2003. What are the leading causes of
death among South African children? . Cape Town: Medical Research Council. CHOPRA, M. & DARNTON-HILL, I. 2006. Responding to the crisis in sub-Saharan Africa:
The role of nutrition. Public Health Nutrition, 9, 544-550. CHOPRA, M., DAVIAUD, E., PATTISON, R., FONN, S. & LAWN, J. E. 2009. Saving the
lives of South Africa's mothers, babies, and children: can the health system deliver? Lancet, 374, 835-46.
COGILL, B. 2003. Anthropometric indicators measurement guide. Food and nutritional
technical assistance project. Washington D.C.: Academy for Educational Development.
CONOVER, W. J. 1971. Practical nonparametric statistics, New York, London, Sydney, Toronto, John Wiley and Sons Inc.
DAY, C. & GRAY, A. 2007. Health and related indicators. In: South African Health Review
2007, Durban, Health Sytems Trust. DE ONIS, M., BLÖSSNER, M., BORGHI, E., FRONGILLO, E. A. & MORRIS, R. 2004.
Estimates of global prevalence of childhood underweight in 1990 and 2015. JAMA, 291, 2600-2606.
Univers
ity O
f Cap
e Tow
n
74
FABER, M. & WENHOLD, F. 2007. Nutrition in contemporary South Africa. Water SA, 33, 393-399.
FAMILY HEALTH INTERNATIONAL. 2007. HIV, Nutrition, and Food: A practical guide for technical staff and clinicians. North Carolina: Family Health International.
GOGA, A. E., COLVIN, M., DOHERTY, T., JACKSON, D. J., SANDERS, D., CHOPRA, M. & KUHN, L. [In Press]. Poor feeding practices at routine PMTCT sites, but more exclusive feeding amongst HIV-positive women compared with negative women. Journal of Nutrition.
GOOD START STUDY GROUP 2002. Good Start Study: National PMTCT Cohort Study Protocol. Health Systems Trust, University of the Western Cape, Medical Research Council, University of KwaZulu-Natal, National Department of Health, CADRE.
GOSSET, W. S. 1908. The probable error of a mean student. Biometrika, 6, 1-25. GOVERNMENT OF SOUTH AFRICA & UNITED NATIONS 2005. South Africa:
millennium development goals country report. Pretoria: National Department of Health.
HAIR, J. F., BLACK, B., BABIN, B., ANDERSON, R. E. & TATHAM, R. L. 2006. Multivariate Data Analysis (6th Edition) Prentice Hall
HEINIG, M. J., NOMMSEN, L. A., PEERSON, J. M., LONNERDAL, B. & DEWEY, K. G. 1993. Energy and protein intakes of breast-fed and formula-fed infants during the first year of life and their association with growth velocity: the DARLING Study. The
American Journal of Clinical Nutrition, 58, 152-161. ISANAKA, S., DUGGAN, C. & FAWZI, W. W. 2009. Patterns of postnatal growth in HIV-
infected and HIV-exposed children. Nutrition Review, 67, 343-359. JACKSON, D., BATISTE, E. & RENDALL-MKOSI, K. 2007a. Additive effect of smoking
and alcohol use during pregnancy on the occurrence of low birthweight in a farming region in South Africa. Paediatric and Perinatal Epidemiology 21, 432-440.
JACKSON, D., CHOPRA, M. D., TANYA M, COLVIN, M. S. E., LEVIN, J. B., WILLUMSEN, J. F., GOGA, A. E. & MOODLEY, P. 2007b. Operational effectiveness and 36 week HIV-free survival in the South African programme to prevent mother-to-child transmission of HIV-1. AIDS, 21, 509-516.
JONES, L. L., GRIFFITHS, P. L., ADAIR, L. S., NORRIS, S. A., RICHTER, L. M. & CAMERON, N. 2008. A comparison of the socio-economic determinants of growth retardation in South Africa and Filipino infants. Public Health Nutrition, 11, 1220-1228.
KRUSKAL, W. H. & WALLIS, W. 1952. Use of ranks in one-criterion variance analysis. Journal of the American Statistical Association, 47, 583–621.
LABADARIOS, D. 2008. National Food Consumption Survey: Fortification Baseline
(NFCS-FB)South Africa, 2005. Pretoria: National Department of Health, South Africa.
LEPAGE, P., MSELLATI, P., HITIMANA, D.-G., BAZUBAGIRA, A., VAN GOETHEM, C., SIMONON, A., KARITA, E., DEQUAE-MERCHADOU, L., VAN DE PERRE, P. & DABIS, F. 1996. Growth of human immunodeficiency type-1 infected and uninfected children: a prospective cohort study in Kigali, Rwanda, 1988 to 1993. The
Pediatric Infectious Disease Journal, 15, 479-485. LITTLE, R. J. A. & RUBIN, D. B. 1987. Statistical analysis with missing data, New York,
Wiley. MASAKA, M., KASONGA, L., CHISENGA, M., SINKALA, M., CHINTU, C., TOMKINS,
A. & FILTEAU, S. 2007. Early growth of infants of HIV-infected and uninfected Zambian women. Tropical Medicine and International Health, 12, 594-601.
Univers
ity O
f Cap
e Tow
n
75
MCCOY, D., BESSER, D. & CHOPRA, M. 2002. Good Start Study protocol. Cape Town: Health Systems Trust and University of the Western Cape.
MCMURRAY, C. 1996. Cross-sectional anthropometry: what can it tell us about the health of young children? . Health Transition Review, 6, 147-168.
NATIONAL DEPARTMENT OF HEALTH. 2009. Integrated nutrition programme
[Online]. Available: http://www.doh.gov.za/programmes/inp/status.htm [Accessed August 2009,].
PATEL, D., BLAND, R., COOVADIA, H., ROLLINS, N., COUTSOUDIS, A. & NEWELL, M.-L. 2009. Breastfeeding, HIV status and weights in South African children: a comparison of HIV-exposed and unexposed children AIDS, 24, 1-9.
PATEL, D., BLAND, R., COOVADIA, H., ROLLINS, N., COUTSOUDIS, A. & NEWELL, M.-L. 2010. Breastfeeding, HIV status and weights in South African children: a comparison of HIV-exposed and unexposed children AIDS, 24, 1-9.
PHILLIPS, R. S., ENWONWU, C. O., OKOLO, S. & HASSAN, A. 2004. Metabolic effects of acute measles in chronically malnourished Nigerian children. The journal of
nutritional biochemistry, 15, 281-288. POLLOCK, H., GLASBERG, H., LEE, E., NIRENBERG, A., DAVID, R., KRASINKI, K.,
BARKOWSKY, W. & OBERFIELD, S. 1997. Impaired early growth of infants perinatally infected with human immunodeficiency virus: correlation with viral load. The Journal of Pediatrics, 130, 915-922.
RAO, J. N. K. & SCOTT, A. J. 1981. The Analysis of Categorical Data From Complex Sample Surveys: Chi-Squared Tests for Goodness of Fit and Independence in Two-Way Tables. Journal of the American Statistical Association, 76, 221-230
SALOOJEE, H. & DE MAAYER, T. 2007. What's new? Investigating risk factors for severe childhood malnutrition in a high HIV prevalence South African setting. Scandinavian
Journal of Public Health, 35, 96-106. SANDERS, D., REYNOLDS, L., ELEY, B., KROON, M., ZAR, H., DAVIES, M.,
WESTWOOD, T., NONGENA, P. & VAN HEERDEN, T. 2007. Decreasing the Burden of Childhood Disease. Western Cape Burden of Disease Reduction Project.
SCHAIBLE, U. E. & KAUFMANN, S. H. E. 2007. Malnutrition and infection: complex mechanisms and global impacts. PLos Medicine, 4, 806-812.
SCRIMSHAW, N. S. & SANGIOVANNI, J. P. 1997. Synergism of nutrition, infection and immunity: an overview. The American Journal of Clinical Nutrition 66, 464S-77S
SCRIMSHAW, N. S., TAYLOR, C. E. & GORDON, J. E. 1968. Interactions of nutrition and infection.Monograph. Geveva: World Health Organisation.
SIEGEL, S. & CASTELLAN, J. 1988. Two independent samples. In: ANKER, A. D. (ed.) Nonparametric statistics for the behavioral sciences: second edition. McGraw-Hill Book Company.
STEYN, N. P., LABADARIOS, D., MAUNDER, E., NEL, J. & LOMBARD, C. 2005. Secondary anthropometric data analysis of the national food consumption survey in South Africa: The double burden Nutrition, 21, 4-13.
TAYLOR, C. E. 1983. Synergy among mass infections, famines and poverty. Journal of
interdisciplinary history, 14, 2483-501. THE EQUITY PROJECT 2001. Primary health care in the Eastern Cape Province: 1997-200.
Pretoria: The EQUITY Project. THE LANCET 2006. Global child malnutrition. The Lancet, 367, 1459. THE PRESIDENCY. 2009. Address by President Jacob Zuma on the occasion of World
AIDS Day, Pretoria Showgrounds [Online]. Available: http://www.info.gov.za/speeches/2009/09120112151001.htm [Accessed 15 March 2010].
Univers
ity O
f Cap
e Tow
n
76
TWISK, W. R. 2003. Applied longitudinal data analysis for epidemiology: A practical guide United Kingdom: Cambridge University Press.
UNAIDS 2010. Survival of children HIV-infected perinatally and through breastfeeding a pooled analysis of individual data from resource-constrained settings. Geneva, Switzerland UNAIDS.
UNICEF 1998. The state of the world's children. New York: UNICEF. UNICEF 2004. Progress for children: a child survival report card New York: UNICEF. UNICEF 2007. The state of the world’s children New York: UNICEF. UNICEF 2009. The state of the world's children 2009: maternal and newborn health New York: UNICEF. UNITED NATIONS. 2000. Resolution adopted by the General Assembly [Online].
Available: http://www.un.org/millennium/declaration/ares552e.htm [Accessed July 2009,].
VIOLARI, A., COTTON, M. F., GIBB, D. M., BABIKER, A. G., STEYN, J., MADHI, S. A., JEAN-PHILIPPE, P. & MCINTYRE, J. A. 2008. Early antiretroviral therapy and mortality among HIV-infected infants. New England Journal of Medicine, 359, 2233-2244.
WILCOXON, F. 1945. Individual Comparisons by Ranking Methods. Biometrics Bulletin, 1, 80–83.
WORLD BANK. 2009. Poverty analysis-Measuring Inequality [Online]. Available: http://go.worldbank.org/3SLYUTVY00 [Accessed July 2009,].
WORLD BANK INSTITUTE 2007. Health Outcome #2: anthropometrics. In: O'DONNELL, O., VAN DOORSLAER, E., WAGSTAFF, A. & LINDELOW, M. (eds.) Analyzing
Health Equity Using Household Survey Data: A Guide to Techniques and their
Implementation. Washington D.C: World Bank Institute. WORLD HEALTH ORGANIZATION 1995. Physical status: the use and interpretation of
anthropometry. World Health Organization Technical Report.854.
WORLD HEALTH ORGANIZATION. 2008. Water related diseases [Online]. Available: http://www.who.int/water_sanitation_health/diseases/malnutrition/en/ [Accessed August 2008 2008].
ZERE, E. & MCINTYRE, D. 2003. Inequalities in under-five child malnutrition in South Africa. International Journal for Equity in Health, 2, 7.