Major Australian bauxite deposits (Gt) • Deposit • Oפrang mine <0.01 0 0.02-0.03 0 0.00.09 0 0.10-0.20 0.21-0.44 • 0 >0.45 • NT Q WA N V Key consumer markets for primary aluminium, 2020 TAS • 60% China 3% Germany 7% United States 0 3% Vietnam @ 3% India Aluminium Bauxite is refined to recover alumina and lt to ke aluminium 2 tonnes of bauxite is required to produce one tonne of alumina China is e world's laest prucer & consumer of primary aluminium Each electric vehicle contains 0.25 tonne of aluminium Australia's aluminium � � World's 1st World's 1st World's 2nd bauxite alumina exporter alumina prucer produng naon in 2020 in 2020 Aluminium I Resources and Energy Quarterly September 2021 www.industry.gov.au/OCE
Transcript
Major Australian bauxite deposits (Gt)
• Deposit
• Operating mine
<0.01
0 0.02-0.03
0 0.04-0.09
0 0.10-0.20
0.21-0.44 •
0 >0.45
•
NT
QLO
WA SA
NSW
VIC
Key consumer markets for primary aluminium, 2020
TAS
• 60% China
3% Germany
7% United States
0 3%
Vietnam
@
.,.,./
3% India
Aluminium
Bauxite is refined to recover alumina and smelted to make aluminium
2-3 tonnes of bauxite is required to produce one tonne of alumina
China is the world's largest producer & consumer of primary aluminium
Each electric vehicle contains 0.25 tonne of aluminium
Australia's aluminium
� � l; World's 1st World's 1st World's 2nd
bauxite alumina exporter alumina producer producing nation in 2020 in 2020
Aluminium I Resources and Energy Quarterly September 2021 www.industry.gov.au/OCE
11.1 Summary Political instability in Guinea, strong Chinese demand and constrained
supply pushed the London Metal Exchange spot price for aluminium to a 13-year high of US$2,950 a tonne on 13 September 2021. World demand is expected to remain strong, and likely to see the primary aluminium price average US$2,384 a tonne in 2021 (up 40% from 2020), and to average over US$2,590 a tonne in 2023.
Annual Australian output is expected to be broadly steady over theoutlook period, remaining at around 1.6 million tonnes of aluminium and21 million tonnes of alumina (see Australia section).
The total value of Australian exports of aluminium, alumina and bauxiteis forecast to increase at an annual average rate of 5.8% between2021–22 and 2022–23, to reach nearly $14 billion by the end of theoutlook period.
11.2 Consumption China drove global aluminium, alumina and bauxite usage in H1 2021
Global primary aluminium consumption increased by 11% year-on-year to 35 million tonnes in the first-half of 2021. This was driven by a 13% year-on-year rise in aluminium consumption in China — the world’s largest aluminium consuming nation. The Chinese government’s spending on infrastructure projects added substantially to primary aluminium demand.
India’s primary aluminium consumption rose by 19% year-on-year to 966,000 tonnes in the first-half of 2021. Consumption is expected to rise further in the second half of 2021, after the Indian government recently announced further economic stimulus measures.
In Japan, primary aluminium demand increased by 13% year-on-year to 899,000 tonnes in the first-half of 2021, driven by increased aluminium use in new car models.
In the US, primary aluminium consumption fell by 8.9% year-on-year in the first-half of 2021, to 2.2 million tonnes, due to supply constraints.
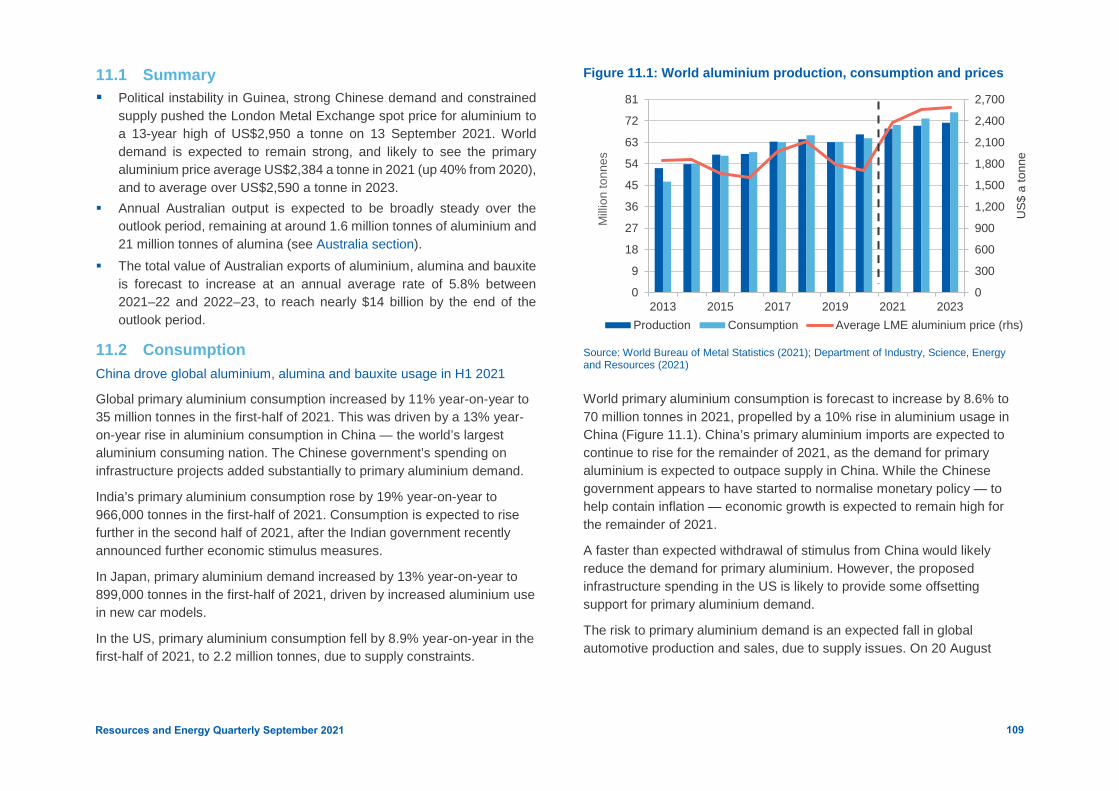
Figure 11.1: World aluminium production, consumption and prices
0
300
600
900
1,200
1,500
1,800
2,100
2,400
2,700
0
9
18
27
36
45
54
63
72
81
2013 2015 2017 2019 2021 2023
US$
a to
nne
Milli
on to
nnes
Production Consumption Average LME aluminium price (rhs)
Source: World Bureau of Metal Statistics (2021); Department of Industry, Science, Energy and Resources (2021)
World primary aluminium consumption is forecast to increase by 8.6% to 70 million tonnes in 2021, propelled by a 10% rise in aluminium usage in China (Figure 11.1). China’s primary aluminium imports are expected to continue to rise for the remainder of 2021, as the demand for primary aluminium is expected to outpace supply in China. While the Chinese government appears to have started to normalise monetary policy — to help contain inflation — economic growth is expected to remain high for the remainder of 2021.
A faster than expected withdrawal of stimulus from China would likely reduce the demand for primary aluminium. However, the proposed infrastructure spending in the US is likely to provide some offsetting support for primary aluminium demand.
The risk to primary aluminium demand is an expected fall in global automotive production and sales, due to supply issues. On 20 August
109Resources and Energy Quarterly September 2021
2021, Toyota announced a reduction of car production by 40% in September 2021, due to the shortage of microchips. According to IHS
Markit, the global shortage of semiconductors is likely to cut global auto production by over 7.0 million units in 2021. The supply disruption is expected to remain until the second-half of 2022.
World alumina usage increased by 1.7% year-on-year in the first-half of 2021, to 65 million tonnes, driven by higher aluminium production (which was up by 6.1% year-on-year in the first-half of 2021).
World alumina demand is estimated to increase by 1.7% to nearly 131 million tonnes in 2021 (Figure 11.2). An expected 3.7% rise in global primary aluminium production in 2021 is likely to lift global alumina demand.
China is expected to contribute strongly to the growth in global alumina
Figure 11.2: World alumina production, consumption and prices
0
100
200
300
400
500
0
30
60
90
120
150
2013 2015 2017 2019 2021 2023
US$
a to
nne
(FO
B Au
stra
lia)
Milli
on to
nnes
Production Consumption FOB Australia alumina prices (rhs)
Source: World Bureau of Metal Statistics (2021); Department of Industry, Science, Energy and Resources (2021)
demand, with an estimated 2.0 million tonnes of new primary aluminium capacity being added in 2021.
World bauxite usage increased by 4.1% year-on-year to 160 million tonnes in the first-half of 2021, propelled by increased global alumina production (up 6.2% year-on-year in the first-half of 2021) (see Section 11.4 production).
World bauxite consumption is forecast to grow by 5.0% to 323 million tonnes in 2021. The gains are expected to be driven by higher alumina output from existing refinery capacity in China and Brazil.
Global recovery to lift aluminium/alumina/bauxite demand in 2022/2023 World primary aluminium demand is forecast to increase at an average annual rate of 3.7% in 2022 and 2023, to nearly 76 million tonnes by 2023 (Figure 11.1). The global economic recovery is expected to support demand for cars, houses and electrical equipment, and thus aluminium consumption. An expected increase in the use of renewable energy equipment — such as wind and solar power generators — will also boost primary aluminium demand over the outlook period.
China’s primary aluminium consumption is expected to continue to grow strongly over the next two years, reaching 46 million tonnes in 2023. The Chinese government’s ambitious initiatives for promoting electric vehicle production are expected to bolster the demand for aluminium. These initiatives are likely to at least partly offset the withdrawal of some economic stimulus programs.
World alumina consumption is forecast to rise at an average annual rate of 1.5% in 2022 and 2023, reaching 136 million tonnes in 2023 (Figure 11.2). The rise in alumina demand will be driven by a 1.8% rise in primary aluminium production forecast in 2022 and 2023.
World bauxite consumption is forecast to grow at an average annual rate of 3.6% in 2022 and 2023, reaching 346 million tonnes in 2023. This is expected to be driven by the ramp up of new alumina capacity in China and India.
Resources and Energy Quarterly September 2021 110
11.3 Production Bauxite output fell, but aluminium and alumina output rose in H1 2021
Resources and Energy Quarterly September 2021
Global primary aluminium production increased by 6.1% year-on-year to 34 million tonnes in the first-half of 2021, propelled by higher output in China — the world’s largest aluminium producer. China produced nearly
20 million tonnes of primary aluminium over the first-half of 2021, up by 9.8% year-on-year, as primary aluminium producers responded to decade high primary aluminium prices.
Over the same period, primary aluminium production in Iran rose by 53% year-on-year to 250,000 tonnes, driven by the ramp up of production at the 1.0 million tonnes per year SALCO aluminium smelter. Primary aluminium production in Canada grew by 6.4% year-on-year, to 1.6 million tonnes. The growth is driven by the ramp up of production at the Alouette aluminium smelter (600,000 tonnes a year).
The Chinese government has implemented limits on some Chinese aluminium smelters to reduce their call on the nation’s power grid. In April 2021, China’s Industry and Information Technology Ministry started collecting energy consumption from smelters and refineries in energy intensive industries such as steel and aluminium. The Ministry is also conducting ongoing inspections to ensure the tiered electricity pricing systems for the aluminium industry are being properly implemented.
In March 2021, the provincial authority of Inner Mongolia in China requested two aluminium smelters in Baotou city to reduce output by 23,000 tonnes, in order to meet regional energy consumption targets.
The Yunnan Electric Power Dispatching Control Centre reduced the power supply to aluminium smelters in the Yunnan province between 10 and 20 May 2021, due to low hydro power generation in the midst of a drought. In a similar action, the Guangxi Power Corporation requested aluminium smelters in southern China’s Guangxi region to reduce power consumption by more than 30% from 15 August 2021.
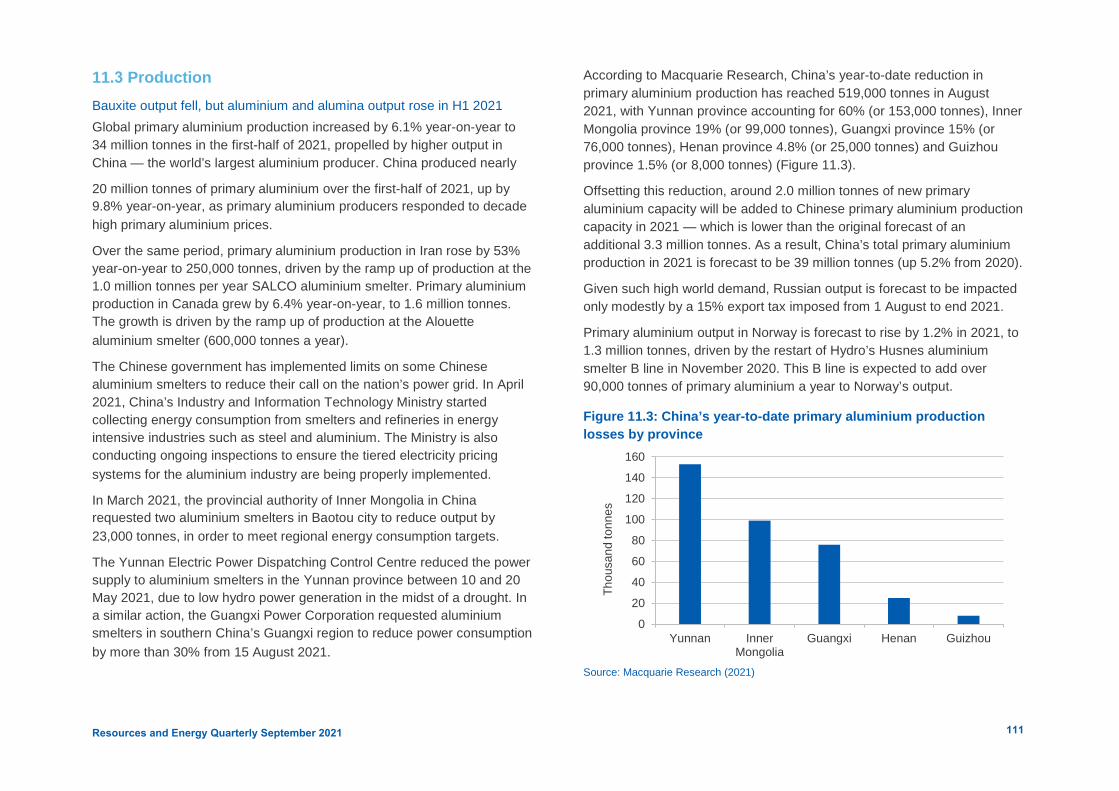
According to Macquarie Research, China’s year-to-date reduction in primary aluminium production has reached 519,000 tonnes in August 2021, with Yunnan province accounting for 60% (or 153,000 tonnes), Inner Mongolia province 19% (or 99,000 tonnes), Guangxi province 15% (or 76,000 tonnes), Henan province 4.8% (or 25,000 tonnes) and Guizhou province 1.5% (or 8,000 tonnes) (Figure 11.3).
Offsetting this reduction, around 2.0 million tonnes of new primary aluminium capacity will be added to Chinese primary aluminium production capacity in 2021 — which is lower than the original forecast of an additional 3.3 million tonnes. As a result, China’s total primary aluminium production in 2021 is forecast to be 39 million tonnes (up 5.2% from 2020).
Given such high world demand, Russian output is forecast to be impacted only modestly by a 15% export tax imposed from 1 August to end 2021.
Primary aluminium output in Norway is forecast to rise by 1.2% in 2021, to 1.3 million tonnes, driven by the restart of Hydro’s Husnes aluminium smelter B line in November 2020. This B line is expected to add over 90,000 tonnes of primary aluminium a year to Norway’s output.
Figure 11.3: China’s year-to-date primary aluminium production losses by province
0
20
40
60
80
100
120
140
160
Yunnan InnerMongolia
Guangxi Henan Guizhou
Thou
sand
tonn
es
Source: Macquarie Research (2021)
111
In the United Arab Emirates, Emirates Global Aluminium recently brought online 26 new reduction cells at potline 1 of its Al-Taweelah aluminium smelter. These new reduction cells will add an extra 30,000 tonnes a year. Another 66 new reduction cells are expected to be operational by the end of 2021, adding a further 48,000 tonnes of annual capacity.
In the US, primary aluminium production is forecast to decline by 9.2% in 2021, to 933,000 tonnes, due to supply chain bottlenecks.
As a result, world primary aluminium production is forecast to increase by 3.7% in 2021 to nearly 69 million tonnes (Figure 11.1).
World alumina supply increased by 6.2% year-on-year in the first half of 2020, to 69 million tonnes, driven by a 13% year-on-year rise in China’s alumina output. Chinese alumina refiners raised output to accommodate higher aluminium production. Over this period, production in Australia — the world’s second largest alumina producer — fell by 1.1% year-on-year, to 10 million tonnes. The fall was due to the planned maintenance of South 32’s Worsley alumina refinery in Western Australia.
World alumina supply is forecast to rise by 3.3% to over 137 million tonnes in 2021, driven by higher output in China and India. In China, Aluminium Corporation of China’s 2.0 million tonnes per year Huasheng Alumina Refinery started producing in September 2020, and is ramping up output in 2021. In India, Vedanta’s 3.0 million tonnes per year Lanjigarh expansion project is expected to be completed in early 2023.
Production at the 1.4 million tonnes a year Jamalco alumina refinery in Jamaica has been in curtailment, following a fire incident in August 2021 that damaged the plant’s power station. It is unlikely that the curtailment will be lifted in the coming months, as the refinery is struggling to find alternative power supply.
World bauxite supply decreased by 1.5% year-on-year in the first-half of 2021, to 185 million tonnes. Output in Australia — the world’s largest bauxite producing country — fell by 2.0% year-on-year due to planned maintenance at Metro Mining’s Bauxite Hills operation.
Over this period, bauxite production in Guinea — the world’s second largest bauxite producing country — increased by 2.7% year-on-year, as the ramp up of production has continued.
Figure 11.4: World bauxite production
0
70
140
210
280
350
420
2013 2015 2017 2019 2021 2023
Milli
on to
nnes
Source: Department of Industry, Science, Energy and Resources (2021)
For 2021, world bauxite supply is forecast to rise by 2.3%, to 377 million tonnes, driven by higher production in Australia (up 3.1% to 107 million tonnes) and Guinea (up 4.8% to 92 million tonnes) (Figure 11.4).
In Australia, the restart of Metro Mining’s Bauxite Hills mine following wet season shutdown from September 2020 to March 2021 is likely to add 4.0 million tonnes to Australian bauxite output in 2021.
In Guinea, Chalco’s Boffa bauxite mine is expected to reach its full capacity during the second-half of 2021, boosting output from 7.0 million tonnes in 2020 to 9.0 million tonnes in 2021.
In Inner Mongolia and Yunnan provinces, declining bauxite output (due to power restrictions) is likely to have an impact on China’s alumina output in 2021.
112Resources and Energy Quarterly September 2021
Aluminium, alumina and bauxite output set to rise over the outlook period World primary aluminium output is forecast to rise at an average annual rate of 1.8% in 2022 and 2023, to reach 71 million tonnes by 2023 (Figure 11.1). The gains are expected to be driven by additional capacity in China.
China’s primary aluminium output is forecast to reach 41 million tonnes by 2023. This is edging closer to the capacity cap of 45 million tonnes of primary aluminium per year — a policy introduced by China’s government in 2017, in response to environmental and oversupply concerns. The Chinese government’s Five Year Plan (2021–25), set in October 2020, calls for China’s production and capacity of both primary aluminium and alumina to peak by 2025. The closer China edges to its primary aluminium capacity cap, the greater the opportunity for other primary aluminium producing nations — such as Russia and Saudi Arabia — to fill the output gap.
Central and provincial authorities in China are expected to continue implementing strict environmental regulations — restricting energy consumption and emissions — from 2021 onwards.
World alumina supply is forecast to rise at an average annual rate of 0.7% in 2022 and 2023, reaching 140 million tonnes in 2023 (Figure 11.2). This growth will be driven by India and other small alumina refining nations.
In India, bauxite sourcing has improved, with Vedanta planning to lift capacity at its Lanjigarh refinery to 2.7 million tonnes in the short term, and to 6.0 million tonnes in the medium term. Hindalco’s 1.5 million tonnes a year Utkal Alumina Refinery is expected to come online in 2022.
In Vietnam, Vietnam Coal and Minerals Industries Group’s 650,000 tonnes a year Tan Rai Alumina Refinery is expected to commence commercial production in 2023.
In Indonesia, China Hongqiao and joint-venture partners’ 2.0 million tonnes a year Well Harvest alumina refinery expansion project is expected to come online in 2022.
World bauxite output is forecast to grow at an average annual rate of 1.6% in 2022 and 2023, reaching 389 million tonnes by 2023 (Figure 11.4). The gains are expected to be driven by newly added capacity in Guinea, where production is rising rapidly.
Guinea’s bauxite output is forecast to grow at an average 4.0% a year in 2022 and 2023. The Compagnie des Bauxites de Guinée mine in Guinea, which expanded from 13 to 18 million tonnes a year in 2019, is due to expand to 28 million tonnes by 2022. Emirates Global Aluminium is planning to ramp up output at its bauxite mine in Guinea, targeting 12 million tonnes per year towards the end of the outlook period.
The Indonesian government’s decision to delay the reintroduction of bauxite export bans (from 2022 to June 2023) is expected to increase global bauxite supply. In August 2021, China’s Tianshan Aluminium signed a cooperation deal with an unnamed Indonesian bauxite supplier to secure bauxite supply for its alumina refineries and aluminium smelters in China.
11.4 Prices Aluminium prices reached a 13-year high in September 2021 The spot price of aluminium reached a thirteen-year high of US$2,950 a tonne on 13 September 2021, driven by political instability in Guinea. At US$2,356 a tonne, the average London Metal Exchange (LME) spot price for primary aluminium has increased by 43% so far in 2021, compared to an average of US$1,809 a tonne in the second half of 2020.
Rising demand is the main contributor to the price increase. Global demand for everything from beer cans to packaging has rebounded from the lows of the COVID-19 pandemic in 2020. Primary aluminium demand rose by 10% year-on-year in the first-half of 2021, consistent with the rise in global industrial production and the global economic recovery.
The increasing price of aluminium was also driven by production constraints placed on Chinese aluminium smelters to reduce energy demand (see Section 11.4 production).
Resources and Energy Quarterly September 2021 113
Declining primary aluminium inventories are another contributor to the recent price strength. During the global financial crisis between mid-2007 and early 2009, most of the LME primary aluminium stocks were stored in Detroit (the US) and the Netherlands port of Vlissingen. However, the COVID-19 pandemic has changed the map of primary aluminium storage. Almost 90% of the LME primary aluminium stocks and 85% of off-warrant stocks are now sitting at Asian locations. Malaysia’s Port Klang has overtaken Rotterdam as the largest hub of exchange approved warehousing capacity, reaching a 770,000 square metres capacity at the end of June 2021.
The redistribution of primary aluminium inventory from the US and Europe to Asia has increased the premiums (in excess of US$500 a tonne) that the US and European buyers need to pay to acquire aluminium. In the US, the premium was never higher than $485 a tonne in 2018, when the US government imposed import tariffs and sanctions on Russian aluminium producer Rusal.
Source: London Metal Exchange (2021); World Bureau of Metals Statistics (2021)
In an attempt to boost primary aluminium supply and to de-escalate the rise of aluminium prices, the Chinese government held three auctions in July and September 2021 to release 210,000 tonnes of primary aluminium from state reserves. It is estimated that around 900,000 tonnes of primary aluminium are still held in state reserves. The sale of state primary aluminium reserves seems to have had a very minimal impact on the markets, as it only accounts for 0.3% of China’s total primary aluminium demand.
In a similar attempt to boost domestic primary aluminium supply and thus prevent prices from rising, the Russian government introduced new export taxes on primary aluminium, steel, nickel and copper on 24 June 2021. The export taxes commenced on 1 August 2021, and will end on 31 December 2021, with a base rate of 15% (or US$254 a tonne) of the export price.
Russia is the world’s second largest primary aluminium exporter, accounting for 14% of global primary aluminium exports. In 2020, Russia produced 3.9 million tonnes of primary aluminium, and exported 1.8 million tonnes of primary aluminium. Russian primary aluminium export prices are lower than the LME primary aluminium spot prices by 25 to 33%, due to some transfer pricing mechanisms that allow a Russian subsidiary company to sell aluminium to a parent company at the costs to be absorbed by the parent company. Consequently, the increased taxes are likely to reduce Russian primary aluminium producer margins, and to have little impacts on global aluminium prices.
As a result, the LME primary aluminium spot price is forecast to average US$2,384 a tonne in 2021, up 40% from 2020 (Figure 11.6).
The free on board (FOB) Australian alumina price has increased 26% so far in 2021, at US$385 a tonne on 16 September 2021 — compared to an average of US$267 a tonne in the first nine months of 2020 — driven by the political instability in Guinea.
114Resources and Energy Quarterly September 2021
The FOB Australian alumina price is forecast to increase by 5.3% in 2021, to US$285 a tonne, driven by increased primary aluminium production in China (Figure 11.6).
Aluminium and alumina prices expected to rise in 2022 and 2023
The LME aluminium spot price is forecast to increase by 7.6% to average US$2,565 a tonne in 2022, and to rise by a further 1.0% to average US$2,590 a tonne in 2023 (Figure 11.6). Rising primary aluminium consumption in China — the world’s largest primary aluminium consuming nation — and in the global transport industry (aviation and car manufacturing) are expected to be significant drivers of increased aluminium prices.
The FOB Australian alumina price is forecast to rise at an average annual rate of 4.6% in 2022 and 2023, to US$310 a tonne by 2023 (Figure 11.6). A forecast 1.8% average annual rise in world aluminium production in 2022 and 2023 is expected to provide support to alumina prices.
Figure 11.6: World primary aluminium and alumina prices
0
70
140
210
280
350
420
490
0
400
800
1,200
1,600
2,000
2,400
2,800
2013 2015 2017 2019 2021 2023
US$
a to
nne
(FO
B Au
stra
lia)
US$
a to
nne
Average primary aluminium LME priceAverage FOB Australia alumina price (rhs)
Source: LME (2021) spot prices; Bloomberg (2021); Department of Industry, Science, Energy and Resources (2021)
11.4 Australia’s exports and production Lower aluminium/bauxite export volumes cut export values in 2020–21 Australia’s aluminium, alumina and bauxite exports declined by 5.7% to $12 billion in 2020–21. Lower aluminium and bauxite export volumes were offset by higher aluminium prices and higher alumina export volumes.
Exports to rise over the outlook period An expected gain in aluminium prices over the outlook period is likely to provide additional earnings for Australian aluminium smelters. Australia’s aluminium, alumina and bauxite exports are forecast to increase by 12% in 2021–22 and by 0.5% in 2022–23, reaching nearly $14 billion in 2022–23.
The political instability in Guinea has the potential to impact global bauxite production and exports. Guinea is the world’s second largest bauxite producer and the world’s largest bauxite exporter. In 2020, Guinea produced 88 million tonnes of bauxite (accounted for 24% of global bauxite output), and exported 83 million tonnes of bauxite (accounted for 55% of global bauxite exports).
Figure 11.7: Australia’s aluminium exports and production
0
1
2
3
4
5
0.0
0.4
0.8
1.2
1.6
2.0
2012–13 2014–15 2016–17 2018–19 2020–21 2022–23
A$ b
illion
Milli
on to
nnes
Aluminium production Export volumesExport nominal values (rhs)
Source: ABS (2021) International Trade in Goods and Services, 5368.0; Department of Industry, Science, Energy and Resources (2021)
115Resources and Energy Quarterly September 2021
The political instability in Guinea is likely to provide an opportunity for Australian bauxite exporters to fill the potential production and export shortfall from Guinea. In 2020, Australia produced 104 million tonnes of bauxite (accounted for 28% of global bauxite output), and exported 37 million tonnes of bauxite (accounted for 25% of global bauxite exports). As the world’s largest bauxite producer and the world’s second largest bauxite exporter, Australia has the capacity to supply additional bauxite to the world, particularly to the Chinese bauxite market.
In the short-term, the risk to the assessment of Australian bauxite exports is the rise of Guinea as a major bauxite exporter to China (Figure 11.10). In July 2021, China Railway Construction Corporation completed the construction of a railway line from Boffa bauxite mine to Boke special economic zone. The railway line is expected to increase the transport of bauxite for export from 5,000 to 10,000 tonnes per freight trip.
The cost of shipping alumina from Australia to China has increased from an average US$18.00 to US$50.00 a tonne during the COVID-19 pandemic, due to the disruptions in the global shipping industry. This increased freight cost is impacting Australian alumina exporters’ margins and competitiveness, and is unlikely to be completely resolved in 2021–22.
Higher aluminium and alumina output, but 2020–21 bauxite output lower
Australia’s aluminium output rose by 0.8% in 2020–21, to nearly 1.6 million tonnes, driven by a 1.0% output rise at Rio Tinto’s Boyne Island aluminium smelter in Queensland and a 0.5% rise at Rio Tinto’s joint-venture Tomago aluminium smelter in NSW.
Australia’s alumina output increased by 1.6% in 2020–21 to nearly 21 million tonnes. The increase is attributed to an 8.1% rise in Rio Tinto’s joint-venture Queensland Alumina Limited in Queensland, and a 0.2% rise in Rio Tinto’s Yarwun alumina refinery in Queensland.
Australia’s bauxite production fell by 3.8% to 103 million tonnes in 2020–21, due to the suspension of operations at Metro Mining’s 6.0 million tonnes a year Bauxite Hills mine in Queensland (from September 2020 to
March 2021) due to the wet season shutdown and planned maintenance.
Steady aluminium, alumina and bauxite production over the outlook period No expansions or major disruptions are expected at existing aluminium and alumina operations in Australia over the outlook period. Australia’s aluminium output is forecast to remain at about 1.6 million tonnes a year out to 2022–23 (Figure 11.7). Alumina output is expected to remain at about 21 million tonnes per annum over the outlook period (Figure 11.8).
Australia’s bauxite output is forecast to rise at an average annual rate of 3.1% in 2021–22 and 2022–23, reaching 109 million tonnes in 2022–23 (Figure 11.9). Metro Mining’s Bauxite Hills mine in Queensland is expected to reach full production capacity of 6.0 million tonnes a year by the December quarter 2021.
In June 2020, Alcoa Australia applied to the Western Australia Environmental Protection Authority (WA EPA) to increase alumina production at its Pinjarra refinery from 5.0 to 5.25 million tonnes a year.
Figure 11.8: Australia’s alumina exports and production
0
2
4
6
8
10
12
0
4
8
12
16
20
24
2012–13 2014–15 2016–17 2018–19 2020–21 2022–23
A$ b
illion
Milli
on to
nnes
Alumina production Export volumes Export nominal values (rhs)
Source: ABS (2021) International Trade in Goods and Services, 5368.0; Department of Industry, Science, Energy and Resources (2021)
116Resources and Energy Quarterly September 2021
The company also applied to the WA EPA to increase bauxite production at its Huntly mine (annual production of 26 million tonnes). Both applications are being assessed by the WA EPA.
On 25 May 2021, Alumina Limited — the co-owner of Wagerup and Pinjarra alumina refineries in Western Australia — indicated the possibility of revisiting the expansion plan for Wagerup and Pinjarra in the coming years, as alumina demand is forecast to outpace the alumina supply.
On 10 August 2021, Tomago Aluminium — Australia’s largest electricity user — indicated the smelter is in talks with a range of energy suppliers for wind, solar, hydro power. The smelter indicated that it aims to switch to a renewable power supply in 2029, with gas fired power as a back-up.
On 24 August 2021, Rio Tinto and Sumitomo Corporation of Japan announced a study of the construction of a hydrogen pilot plant at their joint-venture Yarwun alumina refinery in Gladstone, Queensland. The study is to explore the potential use of hydrogen at the refinery and in the Gladstone area.
Revisions to the outlook
The forecast for Australia’s aluminium, alumina and bauxite exports earnings has been revised up from the June 2021 Resources and Energy Quarterly — by $1.0 billion to $13.4 billion in 2021–22, and by $853 million to nearly $14 billion in 2022–23.
The revision reflects a larger-than-expected rise in aluminium prices in the first nine months of 2021. The forecast for the LME aluminium spot price has been revised up by 12% (or US$250 a tonne) in 2021 from the June 2021 Resources and Energy Quarterly.
Figure 11.9: Australia’s bauxite exports and production
0
300
600
900
1,200
1,500
1,800
0
20
40
60
80
100
120
2012–13 2014–15 2016–17 2018–19 2020–21 2022–23
A$ m
illion
Milli
on to
nnes
Bauxite production Export volumes Export nominal values (rhs)
Source: ABS (2021) International Trade in Goods and Services, 5368.0; Department of Industry, Science, Energy and Resources (2021)
Figure 11.10: China’s bauxite imports by country
0
4
8
12
16
Jun-16 Jun-17 Jun-18 Jun-19 Jun-20 Jun-21M
illion
tonn
es
Australia Guinea Indonesia ROW
Notes: ROW: Rest of the world Source: Bloomberg (2021)
117Resources and Energy Quarterly September 2021
Table 11.1: Aluminium, alumina and bauxite outlook
Notes: c LME cash prices for primary aluminium; d In 2021 calendar year US dollars; e In 2021–22 financial year Australian dollars; f Forecast. Source: ABS (2021) International Trade in Goods and Services, 5464.0; AME Group (2021); LME (2021); Department of Industry, Science, Energy and Resources (2021); International Aluminium Institute (2021); World Bureau of Metal Statistics (2021).