i Public Interest Energy Research (PIER) Program WHITE PAPER Electric Distribution System Simulation and Analysis Tools Status and Research Gaps for Integration of Renewables and Electric Vehicles APRIL 2013 CEC50010055
Transcript
i
Publ ic Interest Energy Research (P IER) Program
WHITE PAPER
Electric Distribution System Simulation and Analysis Tools Status and Research Gaps for Integration of Renewables and Electric Vehicles
APRIL 2013
CEC-‐500-‐10 -‐055
ii
Prepared for: California Energy Commission
Prepared by: California Institute for Energy and Environment
Prepared by: Primary Author(s): Larry Miller Lloyd Cibulka Merwin Brown Alexandra von Meier California Institute for Energy and Environment University of California 2087 Addison Street Berkeley, CA 94704 916-555-1212 www.uc-ciee.org Contract Number: 500-10-055 Prepared for: California Energy Commission Cathy Turner Contract Manager Jamie Patterson Project Manager Mike Gravely Office Manager Energy Systems Integration Laurie ten Hope Deputy Director Research & Development Division Robert P. Oglesby Executive Director
iii
DISCLAIMER
This report was prepared as the result of work sponsored by the California Energy Commission. It does not necessarily represent the views of the Energy Commission, its employees or the State of California. The Energy Commission, the State of California, its employees, contractors and subcontractors make no warrant, express or implied, and assume no legal liability for the information in this report; nor does any party represent that the uses of this information will not infringe upon privately owned rights. This report has not been approved or disapproved by the California Energy Commission nor has the California Energy Commission passed upon the accuracy or adequacy of the information in this report.
iv
ACKNOWLEDGEMENTS The authors wish to acknowledge the technical contributions of all those we interviewed for this white paper, and the community of researchers whose conference presentations and published technical papers cited herein provided invaluable information on the state of the simulation art and on the needs of users of the technology.
Special thanks are due to the following persons for their input, guidance and support on numerous occasions: Michael Behnke, David Beauvais, Robert Broderick, Richard Dugan, Barry Mather, Tom McDermott, and Kevin Schneider.
The leadership and technical guidance of the Energy Commission, and in particular Jamie Patterson, Fernando Pina, Avtar Bining and Consuelo Sichon is especially acknowledged and appreciated.
v
PREFACE The California Energy Commission Public Interest Energy Research (PIER) Program supports public interest energy research and development that will help improve the quality of life in California by bringing environmentally safe, affordable, and reliable energy services and products to the marketplace.
The PIER Program conducts public interest research, development, and demonstration (RD&D) projects to benefit California.
The PIER Program strives to conduct the most promising public interest energy research by partnering with RD&D entities, including individuals, businesses, utilities, and public or private research institutions.
PIER funding efforts are focused on the following RD&D program areas:
• Buildings End-Use Energy Efficiency
• Energy Innovations Small Grants
• Energy-Related Environmental Research
• Energy Systems Integration
• Environmentally Preferred Advanced Generation
• Industrial/Agricultural/Water End-Use Energy Efficiency
• Renewable Energy Technologies
• Transportation
Electric Distribution System Simulation and Analysis Tools - Status and Research Gaps for Integration of Renewables and Electric Vehicles is the report for the Energy Commission project Distribution System Simulation Tools and Voltage Management Technologies, contract number 500-10-055, work authorization number WA004, Task 1.1: White Paper on Status and Research Gap Analysis Report on Simulation and Analysis Tools for Integration of Renewables and Electric Vehicles in Electric Distribution Systems, conducted by the California Institute for Energy and Environment. The information from this project contributes to PIER’s Energy Systems Integration Program.
For more information about the PIER Program, please visit the Energy Commission’s website at www.energy.ca.gov/research/ or contact the Energy Commission at 916-654-4878.
vi
ABSTRACT This white paper describes simulation and analysis tools, the current state of the art of simulation, and the research gaps for effective management of renewable resources and electric vehicles in distribution systems as California strives to achieve 33% renewable penetration by 2020 in accordance with the state’s Renewable Portfolio Standard (RPS). This white paper is intended to provide information that will help target future solicitations for research toward applications that will help California better reach its renewable energy goals.
Key words: California Energy Commission, distribution, renewable energy, RPS, Renewable Portfolio Standard, solar generation, photovoltaic generation, electric vehicles, renewable penetration.
Please use the following citation for this report:
Miller, Larry; Cibulka, Lloyd; Brown, Merwin; von Meier, Alexandra. (California Institute for Energy and Environment). 2013. Electric Distribution System Simulation and Analysis Tools Status and Research Gaps for Integration of Renewables and Electric Vehicles. California Energy Commission. Publication number: CEC-XXX-2013-XXX.
vii
TABLE OF CONTENTS Acknowledgements ................................................................................................................................. iv
PREFACE .................................................................................................................................................... v
ABSTRACT ............................................................................................................................................... vi
TABLE OF CONTENTS ........................................................................................................................ vii
List of Illustrations .................................................................................................................................... x
More Model Types and More Complex Models ............................................................................. 18
Distribution Automation ..................................................................................................................... 19
Data Analytics ...................................................................................................................................... 19
Advanced Inverters for Volt/VAR Control ..................................................................................... 20
Increasing Use of Dynamic and Transient Simulation ................................................................... 20
Integration of Distribution into Transmission Analysis ................................................................. 20
Research Gaps .......................................................................................................................................... 22
Standard Analyses for Distribution Feeders with Significant DER .............................................. 22
California Centric Feeder Prototypes and Test Cases .................................................................... 22
viii
System Optimization with High Levels of PV ................................................................................. 23
Advanced Solar Inverters ................................................................................................................... 23
High Performance Desktop Computing ........................................................................................... 23
Business Case for Distribution Automation ..................................................................................... 24
Recommendations and Conclusions ................................................................................................... 25
Long Term View ................................................................................................................................... 25
System Optimization ........................................................................................................................... 25
Standardized Simulations for High PV Penetrations ..................................................................... 25
Data Analytics ...................................................................................................................................... 25
List of Illustrations Figure 1 Installed Cost of PV in California ............................................................................................. 2
Figure 2 Solar Output and Simulated Response at End of Feeder .................................................. 11
Figure 5 Simulated Lightning Strike on 20 kV Line 14
1
Introduction Purpose of the White Paper The purpose of this White Paper is to assist the California Energy Commission in developing potential research projects addressing distribution system simulation and analysis tools that incorporate impacts from high penetrations of renewables and electric vehicles. California utilities use these tools to perform distribution system planning and analysis. The stakeholders on the Energy Commission's Technical Advisory Committee (TAC) recommended that a comprehensive review of the capabilities and research needs on this topic be considered a high priority.1
This paper is a report on the status of distribution system simulation and analysis technologies and the gaps between what practitioners need and what technologies are available. A particular focus is on the needs imposed by high penetration of photovoltaic (PV) power sources. This report will help define research plans and solicitations.
The Changing World of Distribution The electric grid has historically been divided into two very different operating systems: transmission and distribution. Transmission contains generation, high voltage transmission lines, and associated devices and control systems. The overall system is highly networked.
Distribution systems historically did not include generation and were typically radial in nature, beginning at a substation connected to the transmission system and branching from there much like a tree, with primary feeders and then secondary lines becoming progressively lower in capacity as they were located farther along the tree from the primary substation. This structure inherently depended on the fact that power flow was unidirectional and flowed outward from the substation. Control largely consisted of maintaining voltage within predefined limits everywhere along the lines. Voltage control was usually maintained with combinations of load tap changers for regulation and capacitor banks, either fixed or switched to provide reactive power, commonly called Volt Amp Reactive (VAR) support. Typically, device settings would be changed relatively infrequently, often only seasonally, but sometimes as often as daily. Protection systems also depended on the lack of generation as essential to their proper operation.
Changes to this “classical” form of distribution have been underway for a number of years. Many distribution systems now incorporate interconnections between feeders, creating meshed networks, although usually relatively loosely. Beginning in the late 1990s, several drivers have begun to impose needs for improved capabilities of distribution systems. Today, distributed generation (DG), also called distributed energy resources (DER), and typified by PV and wind turbines, has already become common, with some favorable areas already experiencing high penetration levels of PV. Electric vehicles have just begun to enter the transportation fleet and the next several years are expected to see a significant expansion of their numbers. In addition, demand response, electric storage, and conservation voltage reduction (CVR) are all combining to require that distribution systems must evolve and do so rapidly in the next few years.
For purposes of this paper, the degree of penetration of PV on a particular feeder or system is defined as the cumulative power capacity of PV installations on the system divided by the peak
1 A series of 5 TAC meetings were held by CIEE to provide status on research activities and reassess research needs and priorities, most recently in June, 2012 at Folsom, CA.
2
annual load, expressed as a percentage. Thus, 5 MW of PV installations on a feeder with a 10 MW annual peak load represents a 50% penetration
Drivers for Change The primary drivers of the changes occurring at the distribution level derive from either legislative or regulatory initiatives, or are market-oriented. Most of the policy drivers can, in turn, trace their origins to environmental concerns – especially, but not exclusively, to climate change. In 2006, Assembly Bill 32 (AB32) set targets for California to reduce its carbon emissions by 2020 to 1990 levels. AB32 has inspired a number of other regulations in the electric grid aimed at encouraging the use of renewable sources of energy. In the same year, Senate Bill 1 (SB1) established a rebate program for renewable sources. In 2011, SBX1 2 defined the requirement for a Renewable Portfolio Standard (RPS) of 33% by 2020. AB2514 required the California Public Utilities Commission (CPUC) to look into setting energy storage targets for utilities. Governor Brown has ordered utilities to add 20,000 Megawatts (MW) of distributed generation to the California distribution system. Other actions include requiring utilities to offer net metering to all customers who wish to install renewable energy sources (primarily wind and solar).
On the national level, federal policies have encouraged automakers to develop and market plug-in electric vehicles (PEVs), both pure electric and hybrid. California has already established itself as an early adopter of the new technology. While sales of PEVs to date have not had a significant impact on the distribution system, studies have indicated that, by 2020, PEVs could either create significant problems or represent an overall benefit to the electric grid, largely depending on how well utilities will manage the time of day or night when customers charge their vehicles.
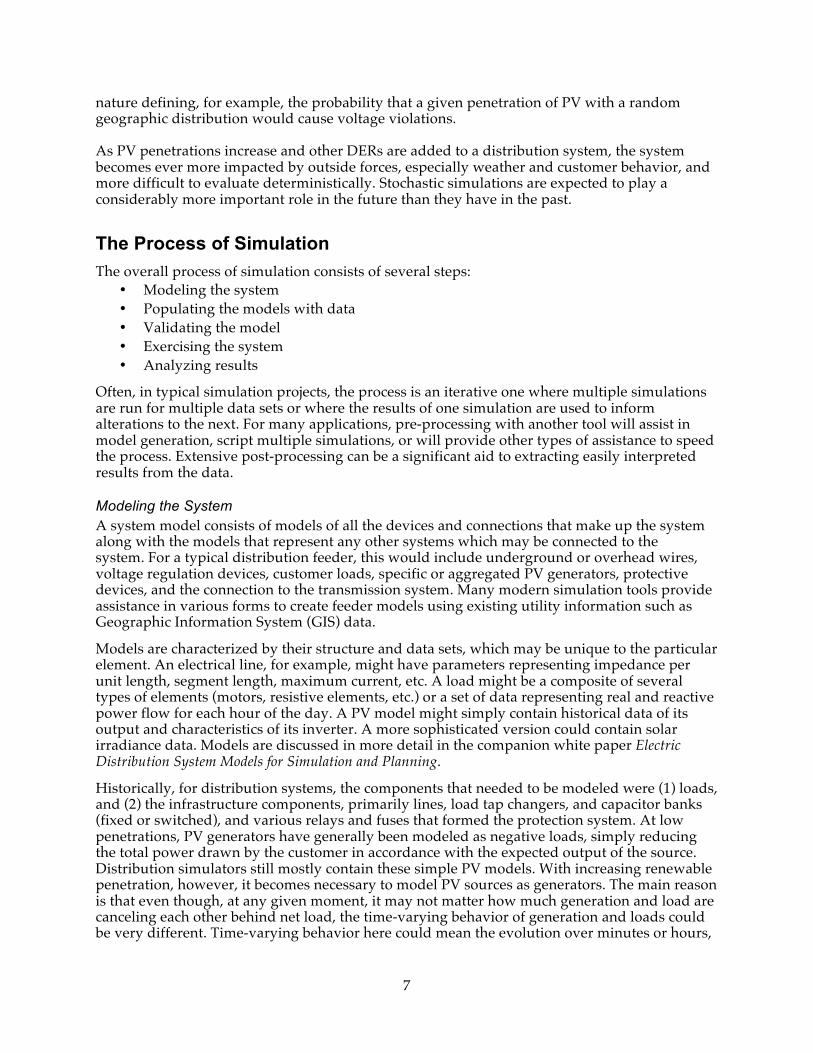
While policy and regulatory changes are directly impacting the grid, market forces have driven down the cost of renewable energy sources. Wind power is now widely viewed as cost competitive with coal powered generation. The cost of PV systems, while still more expensive than alternatives, has reached a significant milestone. Federal and state incentives, combined with policies that provide utility customers with the retail value of electricity they generate, have resulted in a business model that can provide a profit. As a result, in many locations, a utility customer can now install a PV system and finance it completely from the savings on electricity costs. In certain areas of California, utilities or solar aggregators are offering to lease rooftop space from utility customers to install PV systems which the utilities then operate and maintain. Figure 1 shows the average installed PV system cost over the last few years. The trend is downward and expected to continue.
Impacts of High Penetration of Renewables and Electric Vehicles The widespread installation of distributed generation, primarily in the form of PV, directly impacts the way in which a distribution system operates, not only due to the existence of generation, but because this generation can vary rapidly as a result of weather conditions. As penetration levels increase, so does the degree of impact. Utilities will typically assess these impacts with a series of simulations. These impacts fall into several categories:
• Maintaining Voltage Range within Allowable Limits
Figure 1 Installed Cost of PV in California Courtesy: Go Solar California
3
Voltage in a distribution system is primarily controlled with load tap changers, which can vary the output voltage of a transformer in stepwise increments, and capacitor banks, which function to locally increase the voltage when switched on. Generation in a distribution system tends to raise the voltage at the location of the generator. High penetrations can result in voltages exceeding allowable limits at certain locations.
On a clear day, solar generation varies only relatively slowly and predictably as the sun moves across the sky, and it would be relatively easy to make compensating adjustments with conventional equipment. On a cloudy day, however, solar output can change rapidly on time scales of seconds and minutes. Maintaining voltage levels under these conditions is more challenging and attempting to do so with conventional electromechanical equipment can lead to increased maintenance and reduced service life of the equipment.
• Proper Operation of Protection Systems The primary functions of power protection systems are to ensure safe operation of power systems and to minimize the impact of unavoidable faults in the system. Different network topologies require different protection schemes. Radial systems require only simple relays or fuses. For meshed (networked) systems, more sophisticated relays are needed, such as impedance relays which trip when unusually low system impedance is detected. Distributed generation changes the expected current flows and can cause improper protection system operation, in several notably different areas: recloser operation, fault currents and fault location, and reverse power flow. Recloser Operation As the large majority of faults are only momentary, distribution protection systems usually incorporate one or more automatic reclosers, which open a circuit for a brief period and then reenergize the line, if the fault was momentary (i.e., cleared itself). A sustained fault will cause the recloser to more permanently de-energize the line. DG can disrupt this process by continuing to energize the line for longer than the recloser time delay. Further, reclosers and fuses are coordinated so that a recloser functions before a fuse. Improper operation of the recloser can cause the fuse to blow, turning a momentary outage into a much longer one needing a fuse replacement. Finally, if the DG does not shut down during the recloser time delay, local islanding can occur and synchronization is lost between the grid and the DG. When the recloser reenergizes, the lack of synchronization can damage equipment. Fault Currents In the event of a short circuit, protective circuits are required to handle the maximum possible current flow, interrupt the flow of current through the fault, and trigger in a manner which minimizes the loss of load. Routine simulation studies are conducted when system changes warrant it to ensure that protection systems function as intended. Without distributed generation, the magnitude of fault currents depends primarily on the impedance of the source itself and the effective impedance of the line between the source and the fault. Further, the fault current and known impedance of the lines can give a reasonable estimate of a fault location, enabling operators to find and fix the fault to restore service more quickly. The existence of significant amounts of distributed generation on a system makes these computations more complex, as a high penetration of PV systems will generally increase the actual fault current, but may decrease the contribution coming from the grid. If the fault is at the end of a long line and the current is measured at the substation transformer, a large PV system in between can supply some of the fault current, thus reducing the current from the transformer.
4
Reverse Power Flow When distributed generation exceeds consumption, power flow reverses direction in that area of the system. With high penetration, this reverse current can actually exceed total load on the feeder and power can flow into the transmission system. Protective systems which were not designed to handle this situation can fail to operate correctly in the event of a fault.
• Power Quality Power quality issues due to the presence of DG arise from several sources: harmonics, voltage sag and flicker, phase imbalances, and resonances, among others. Inverters themselves can locally add harmonics to the distribution system if not adequately filtered. Voltage sag or flicker arises from the variable nature of PV when the output changes rapidly due to the passage of clouds. The existence of voltage distortions can be magnified if one of the harmonics occurs at a resonant frequency of a capacitor bank.
• Equipment Maintenance and Useful Equipment Life Much of the equipment used for controlling distribution voltage is electromechanical with maintenance intervals and useful life defined by the number of operating cycles. While little data has been collected, one concern is that the variable nature of PV will require equipment to cycle more often, thereby increasing maintenance and reducing the service life.
• Plug-in Electric Vehicles (PEVs) When in charging mode, PEVs can represent loads equivalent to one or two households, can represent significant additions to peak loads unless appropriately managed. Most residential chargers are expected to be Level 2 type, which operate at 240 Volts and typically draw 30 amperes (A) but can possibly draw up to 80 A. If driving ranges for PEVs increase in subsequent years, direct current (DC) chargers may become more common. These systems charge at still higher power levels. In neighborhoods where PEVs are clustered, low voltage transformers may need to be upgraded to handle the loads and, in some areas, power handling capacity may be insufficient if charging occurs at peak load times.
The primary mitigation for this is to manage when vehicles are charged, presumably using financial incentives for customers to charge at certain times and, potentially, active participation by utilities through charge control systems. On the positive side, if charging occurs primarily during periods of low demand, PEVs can be a significant asset to utilities by absorbing excess energy generation, e.g., wind power, which would otherwise not be needed to serve load. It will be up to utilities to find effective means to encourage customers to charge PEVs optimally or to allow utilities to control charging.
In addition to the direct impact of renewables and PEVs, the need to mitigate the issues created has contributed to the development of new approaches other than “business as usual” for utilities. In particular, demand response, storage, home area networks (HANs) and other technologies which fall under the general category of “Smart Grid” have been added to the requirements for managing distribution systems. Equally significant, the time frames of control systems for distribution voltage are shifting from seasonal or daily to minutes or seconds.
The net result of all these impacts is that successful operation of a distribution network is rapidly shifting away from a relatively simple radial system where adequacy was largely based on insuring that the system could manage the peak annual load. The new network is a complex system consisting of many subsystems whose management requires vastly more information about the system itself and is also strongly impacted by outside forces, such as weather and consumer behavior. Industry’s response to this has been the rapid rise of distribution management systems—systems that incorporate devices, controls and communication systems
5
to automatically manage the multiple needs of controlling voltage, optimizing power flow, and simultaneously managing all of the distributed energy resources (DER).
Key to managing any system as large, complex and expensive as a distribution network is the ability to simulate various aspects of the system in sufficient detail to be able to predict system behavior and provide the confidence that the system will perform as expected. The remainder of this paper discusses the types of simulations used, the trends for the future, the capabilities needed in the future, and the research gaps needed to be filled to meet the new capabilities required.
6
Simulation and Analysis Where possible, experimentation and direct measurement are favored to develop the knowledge that will allow the future behavior of a system to be predicted. In the case of the electric grid, however, this is not a practical approach. Instead, combinations of measurements on real systems and computer simulations are used for both planning and operations to predict future grid behavior and enable grid operators to successfully plan for both expected and unexpected events. In planning, computer simulations are routinely used to ensure that power can be reliably delivered within desired parameters, most contingencies have been allowed for, systems are protected, and they can be efficiently restored in the event of a disturbance.
Simulation is the process of creating a computer model of a system capable of closely replicating the behavior of a physical system and using that model to provide information about the expected behavior of the physical system under specified conditions. A simulation tool exercises the model in accordance with physical laws and requirements imposed on the system. For complex simulations, it is not unusual for a simulation tool to integrate with other tools (e.g., Matlab) for pre- and/or post-processing. In transmission operations, entire systems are modeled and the status of the network is simulated with state estimators that seek to provide an accurate estimate of the current state of the system in real time, and forecasting systems are used to estimate the needs for the near future, i.e., minutes to hours. For distribution systems, operational use of computer simulation is more limited and there has historically been much less data available. The primary use of simulation for distribution has been offline for planning purposes.
Deterministic and Stochastic Simulations Simulation can be either of two distinct types – deterministic or stochastic. A deterministic simulation produces defined results whose accuracy depends entirely on how well the model and associated data reflect reality. Until the last decade or so, virtually all electric grid simulations were deterministic. Generators would provide the output that was dispatched and specified sources and loads would provide exactly reproducible results. Stochastic simulations, by contrast, are not intended to produce a specific, single result. Their outputs represent results that define the probability that a specific outcome will fall within some range with some confidence level. Their value comes from providing statistical predictions when the lack of precise knowledge of all of sources, loads, or other aspects is inherent in the problem to be simulated or when providing that information is impractical. As a typical example, a deterministic power flow simulation might calculate the voltage at every node on the system at peak summer load with a model of a distribution feeder having a few large PV generators at particular locations and a known set of loads. For such a given set of parameters, a unique voltage pattern will be observed. If any parameter is changed, a new simulation will produce a new result. In contrast, suppose the goal were to know whether a feeder would maintain voltage within allowable limits when large numbers of smaller PV sources are randomly placed in the model. This would be impractical to study deterministically, so a stochastic approach might be to select a particular total amount of PV and perform a large number of tests, each with a different configuration of PV sources and locations, but each test having the same total amount of power from PV generators, i.e., a particular penetration level. The result would then be statistical in
7
nature defining, for example, the probability that a given penetration of PV with a random geographic distribution would cause voltage violations. As PV penetrations increase and other DERs are added to a distribution system, the system becomes ever more impacted by outside forces, especially weather and customer behavior, and more difficult to evaluate deterministically. Stochastic simulations are expected to play a considerably more important role in the future than they have in the past.
The Process of Simulation The overall process of simulation consists of several steps:
• Modeling the system • Populating the models with data • Validating the model • Exercising the system • Analyzing results
Often, in typical simulation projects, the process is an iterative one where multiple simulations are run for multiple data sets or where the results of one simulation are used to inform alterations to the next. For many applications, pre-processing with another tool will assist in model generation, script multiple simulations, or will provide other types of assistance to speed the process. Extensive post-processing can be a significant aid to extracting easily interpreted results from the data. Modeling the System A system model consists of models of all the devices and connections that make up the system along with the models that represent any other systems which may be connected to the system. For a typical distribution feeder, this would include underground or overhead wires, voltage regulation devices, customer loads, specific or aggregated PV generators, protective devices, and the connection to the transmission system. Many modern simulation tools provide assistance in various forms to create feeder models using existing utility information such as Geographic Information System (GIS) data.
Models are characterized by their structure and data sets, which may be unique to the particular element. An electrical line, for example, might have parameters representing impedance per unit length, segment length, maximum current, etc. A load might be a composite of several types of elements (motors, resistive elements, etc.) or a set of data representing real and reactive power flow for each hour of the day. A PV model might simply contain historical data of its output and characteristics of its inverter. A more sophisticated version could contain solar irradiance data. Models are discussed in more detail in the companion white paper Electric Distribution System Models for Simulation and Planning.
Historically, for distribution systems, the components that needed to be modeled were (1) loads, and (2) the infrastructure components, primarily lines, load tap changers, and capacitor banks (fixed or switched), and various relays and fuses that formed the protection system. At low penetrations, PV generators have generally been modeled as negative loads, simply reducing the total power drawn by the customer in accordance with the expected output of the source. Distribution simulators still mostly contain these simple PV models. With increasing renewable penetration, however, it becomes necessary to model PV sources as generators. The main reason is that even though, at any given moment, it may not matter how much generation and load are canceling each other behind net load, the time-varying behavior of generation and loads could be very different. Time-varying behavior here could mean the evolution over minutes or hours,
8
or the short-term response to transient phenomena such as voltage disturbances on the grid. Therefore, a good forecast of how the net load will evolve over time, or an assessment of whether the system is in a stable and secure operating state, requires parsing the separate contributions from generation and load. As the Smart Grid evolves, other DER such as storage and demand response will also need to be included for adequate modeling and existing models will need to become more sophisticated. As automated control systems add model complexity and short-term behavior becomes important, entire new classes of models may be required.
Populating the Models with Data Models are representations of physical devices. A PV model might include such features as maximum current, internal impedance, and how its output varies dynamically in response to line disturbances. These are characteristics of the model that are independent of day or night, sun or rain. The actual power output of the model requires a set of data. This could be as simple as defining a single power output. More complex modeling might use a set of solar irradiance curves for hourly outputs for a day, or several representing different seasons. Alternatively, the power output could be represented by actual historical data showing the variation over several hours with a 1-second resolution. The data set is separate from the model, and each model must be populated with data appropriate for the specific simulation.
If the goal were to determine the impact of PV on the existing voltage control system, a simulation project might want to explore periods of both high and low demand along with high and low PV output. Thus, loads might be populated first with historical data for a 24-hour period during a hot summer day and, on a subsequent run, with a cool but sunny spring day. The PV sources might be populated with actual historical output for those days or theoretical data based on solar irradiance for that location. For this type of simulation, the impact of cloud cover that reduces PV output may be ignored.
The data required by models depends on the purpose of the simulation. If, for example, the simulation examines the ramping requirements imposed by the variable nature of PV sources, then actual data with adequate time resolution from a PV system would be utilized.
Once the modeling process is complete and the models are populated with data, the simulation is run. Depending on the type of simulation, analysis may be conducted in either the frequency or the time domain.
Validating the Models A model is just that – a model. While the goal of building a model is to accurately represent the physical world, it does not automatically succeed. Some process is required to ensure that the performance of the model actually approaches the goal (i.e., the actual behavior of the real system) sufficiently closely to accomplish the purpose of the simulation. This process is known as “model validation.”
The best way to ensure that a model actually replicates the behavior of the real system is to run the simulation using actual historical data from the system being simulated and compare the results to the known real-world performance. This is a fairly standard technique for validating models of circuit elements where actual behavior of the element is well known or can be measured under laboratory conditions. Generally, circuit element models are provided in a model library by the providers of simulation tools and it is assumed that these models have been adequately validated. While generally true, it should be understood that the adequacy of a model depends on the application to be simulated. This is particularly true of newer models required for PV and other elements expected to be part of Smart Grid distribution systems.
As an example, consider a PV system. A very simple model is simply a negative load. For low penetrations in smaller systems, this may be totally adequate for power flow calculations. At higher penetrations, the behavior as a generator may become important and a more
9
sophisticated model is required. If transient behavior is being simulated, the individual dynamics of both generation and load may be important, and also the actual details of inverter operation will need to be included in the model.
Exercising the Model The actual running of a simulation usually consists of starting the process and waiting for the computer to finish. Depending on the complexity of the models and the specific type of simulation, this can take anywhere from a few seconds to several hours. Frequently, many simulations may require a number of runs in succession to produce the final answer. To reduce the time spent by engineers, some tools provide interfaces to other tools such as Matlab for preprocessing of information, which can include scripting for performing a series of operations automatically.
Analyzing Results Once a simulation is complete, the output may or may not be provided in the desired final form. If the results need to be analyzed and processed in some fashion, this post-processing can often be performed automatically by again interfacing to another tool, possibly the same one used for preprocessing.
10
Types of Simulation Simulation can be classified into four major categories defined by time frames of interest: static, quasi-static, dynamic, and transient. A static simulation is the process of solving a model for voltages and currents at every node for a single point in time, and assumes the system is in equilibrium (steady-state). Historically, load flow might be simulated only for peak annual load. Without DG, most distribution simulations are static. The time varying nature of PV is imposing the requirement of quasi-static simulations for many purposes.
Quasi-static simulations assume that changes occur sufficiently slowly that the system can be considered to be static at each simulation point. A quasi-static process is one of making a static simulation at a starting point in time, then increasing the time in small steps and repeating the process. Time steps can be fixed or variable, with automatic variable steps being selected by the simulation tool based on how much the system variables, primarily load and generation, are changing.
Quasi-static simulations are relatively fast and can usually be run on desktop computers. This is the preferred type of simulation to address the impacts of high penetration DG, especially voltage variations, short circuit currents, and reverse power flow. With suitable models, such a simulation can also assess the impact on equipment life by determining the number of setting changes for load tap changers and other equipment whose maintenance schedules and useful life are based on the number of setting changes.
Some tools are capable of both deterministic and stochastic simulations, while others currently have no stochastic capabilities. Unless designed for the purpose, models used for quasi-static simulations are not suitable for dynamic or transient analyses. Typical simulation interval time frames are seconds or minutes to hours with simulations spanning hours or days up to a year or more.
An important distinction between simulations of transmission and distribution systems is that transmission simulations generally model a balanced set of three phases, which requires performing calculations for only one phase. (One exception is the analysis of faults, which tend not to occur on all three phases simultaneously.) For distribution systems, by contrast, it is not generally a good assumption that the three phases are balanced even during normal operation, since there is less of a statistical effect of combining large numbers of individual single-phase loads. Currents on the different phases of a distribution circuit often vary by 10 or 20 percent relative to each other. Consequently, effective distribution simulation usually requires modeling an unbalanced three-phase system. Naturally, this is much more computation intensive and requires more data. The distinction between single- and three-phase models also introduces a problem when trying to integrate analyses of transmission and distribution systems.
Dynamic simulations examine the system behavior when the system cannot be treated as if it were in equilibrium at every time of interest. Interval time frames are typically fractions of a second. Dynamic simulations are most often applied at the transmission level to study oscillations and system stability after a disturbance, but may be used occasionally at the distribution level, simulating behavior of machine control systems, for example. Microgrids require dynamic simulation to produce accurate results, as do analyses that study possible circuit resonances, which can occur from the interaction of harmonics with capacitor banks.
Transient simulations are used to determine system behavior in response to a system disturbance such as faults, protection system operations, switching transients, overvoltage caused by lightning, and similar events. Both dynamic and transient simulations require detailed models and specialized algorithms. Simulations are usually computer intensive and can take several hours on a large computer for a simulated time of a few seconds. The
11
Electromagnetic Transient Program (EMTP) and PSCAD are large programs used primarily for transmission. Unfortunately, some programs primarily intended for transmission may not adequately simulate unbalanced three-phase systems.
Static and Quasi-Static Applications Voltage As PV is added to a distribution system, the first concern is whether voltage remains within acceptable limits. The presence of PV tends to raise voltage at its point of connection and can distort the expected change of voltage along the length of the distribution line. At the same time, it tends to reduce peak consumption during peak summer loads. Simulations are used to answer a large variety of questions. To list a few:
• Are current voltage controls adequate for planned PV installations? • What is the maximum PV that the system can handle with current controls? • Where are the optimum locations and sizes for capacitor banks? • What is the impact of cloud cover on voltage? • How much can distribution automation reduce losses? • What is the impact of PV on equipment life? • How do large numbers of small PV sources impact the distribution system? • How much would various amounts of storage mitigate the impact of a large amount of
PV?
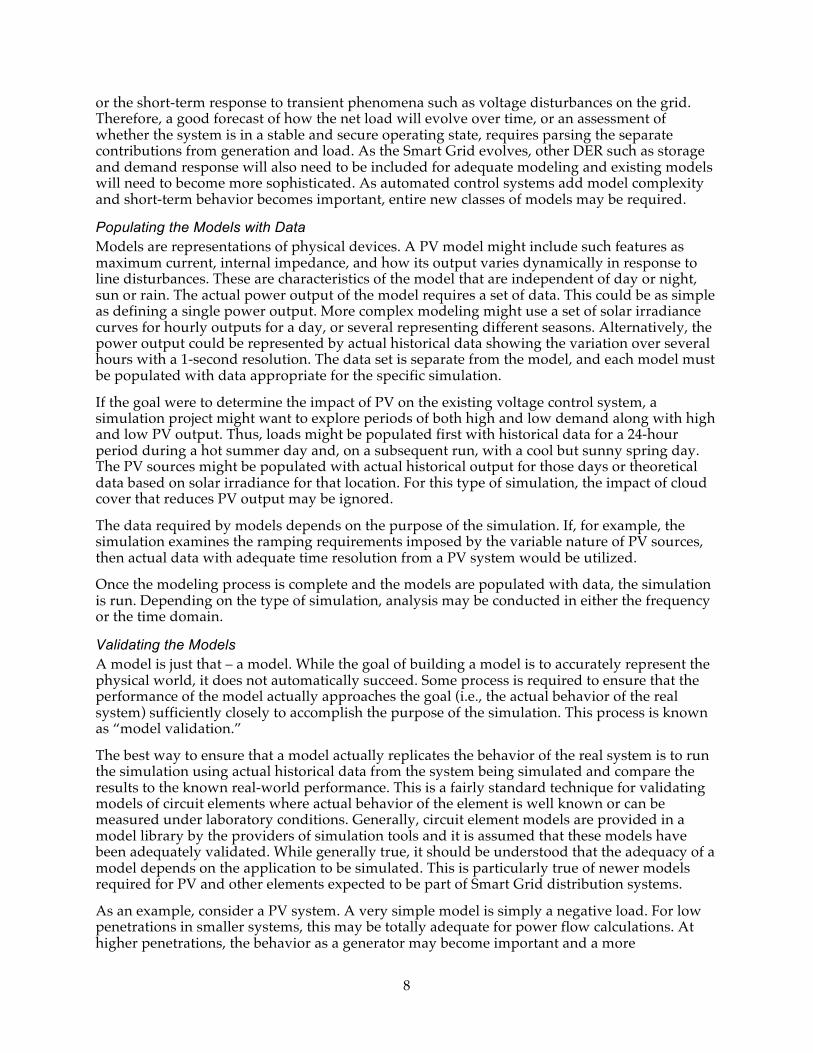
Figure 2 is an example of a quasi-static time series voltage simulation of a feeder in response to clouds passing over a PV system. The graph on the left is measured data at 1 second intervals for a PV system as clouds pass by. On the right, the impact is simulated at the end of the feeder. The three curves represent the three phases of the voltage.
Figure 2 Solar Output and Simulated Response at End of Feeder (Courtesy of EPRI)
Short Circuit Current Short circuit simulations serve to ensure that interrupting capacities are adequate for fault clearance devices (circuit breakers, fuses, and reclosers) and that the settings and response times of these protective devices are coordinated properly to ensure efficient operation and to minimize loss of load. Three-phase models are required, since short circuits can occur between phase and ground, or between phases. As PV penetration increases, each PV system can contribute additional short-circuit current, eventually exceeding the capacity of the protection
12
system to respond properly. Depending on measurement location, PV can impact whether the measured current actually reflects the fault current and thus whether the protective circuits operate correctly. Quasi-static simulations are useful for determining the final currents due to a fault, but for detailed analysis of the time dependent behavior, transient simulation is required.
Reverse Power Flow PV systems generate power, which reduces the amount of power required from the distribution substation. If the PV power generated exceeds the local demand, power will flow toward rather than away from the substation. If the generation is high enough to exceed total demand on the feeder, power will flow into the substation transformer and appear as a source to the transmission system. In addition to impacting the voltage control system, protection systems may not function as expected if they have not been designed to handle reverse power flow.
Equipment Maintenance and Operating Life Distribution system architecture varies widely, but mechanical devices, notably load tap changers, are commonly used for voltage control. A load tap changer physically moves the point of electrical contact along one conductor coil of a transformer, effectively changing the transformer’s turns ratio and thus the output voltage. These mechanical devices have maintenance schedules and predicted service lives based on total number of operations. Historically, these devices would only cycle relatively infrequently. A typical application would be a twice daily routine in the summer: a step up in the early afternoon when air conditioner loads begin to rise, and then a corresponding step down later the same day as loads decrease. The variable nature of PV due to cloud cover has created concerns that equipment would need to cycle more often, reducing life and increasing maintenance requirements. In Figure 2, this effect can be seen as additional regulator operations as PV output steps up or down by as much as 80%.
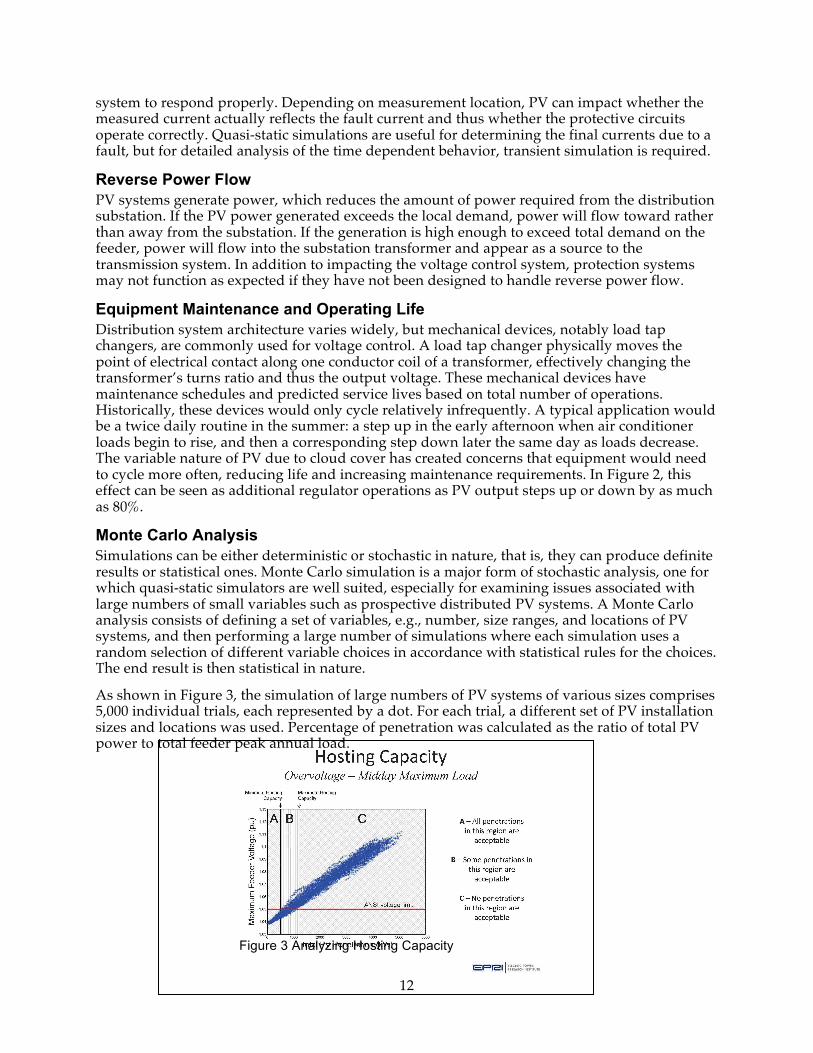
Monte Carlo Analysis Simulations can be either deterministic or stochastic in nature, that is, they can produce definite results or statistical ones. Monte Carlo simulation is a major form of stochastic analysis, one for which quasi-static simulators are well suited, especially for examining issues associated with large numbers of small variables such as prospective distributed PV systems. A Monte Carlo analysis consists of defining a set of variables, e.g., number, size ranges, and locations of PV systems, and then performing a large number of simulations where each simulation uses a random selection of different variable choices in accordance with statistical rules for the choices. The end result is then statistical in nature.
As shown in Figure 3, the simulation of large numbers of PV systems of various sizes comprises 5,000 individual trials, each represented by a dot. For each trial, a different set of PV installation sizes and locations was used. Percentage of penetration was calculated as the ratio of total PV power to total feeder peak annual load.
Figure 3 Analyzing Hosting Capacity
13
(Courtesy EPRI)
Dynamic and Transient Applications Microgrids Microgrids containing PV systems and other energy sources, storage, and controllable loads can offer power quality, security, and other advantages. These systems can operate on grid or off grid as an island. Automatic control systems are intended to maintain performance when off grid and dynamic simulation is required to adequately reproduce the behavior. Figure 4 shows the simulated transition over a four-second period from a grid-supported system to an island, for a microgrid with a variety of different generators.
Figure 4 Microgrid Transition to Island (Courtesy: Chienkuo Technology University)
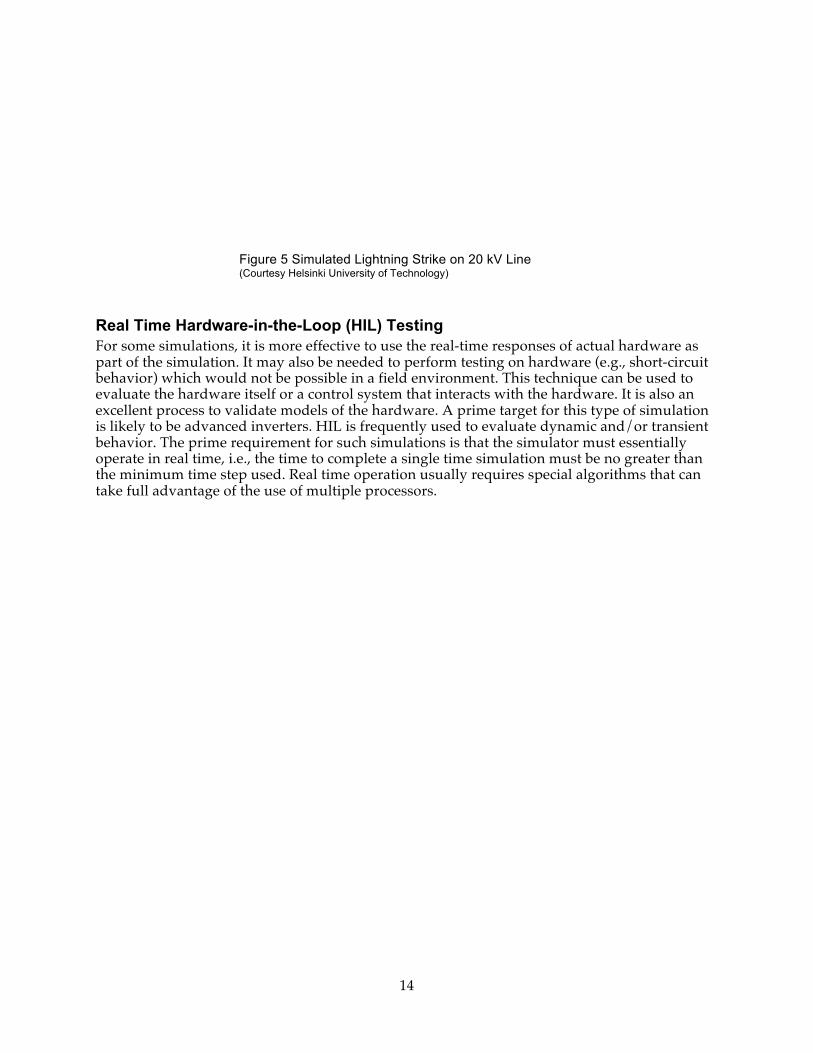
Transients When a disturbance occurs, transient behavior of the system follows for a period of time. These effects can be significant and simulation of them usually requires very detailed models. The penetration of DG does not typically lead to the need for transient analyses but simply complicates the process as transient models for inverters and other DG components are required. Types of simulations requiring transient analysis include the detailed circuit behavior immediately following a fault and the transient overvoltage resulting from a lightning strike. Figure 5 depicts results of an analysis performed to examine the transient overvoltage caused by a lightning strike on a 20kV distribution line.
Grid Power Gas Generator Power
Diesel Generator Power Micro-Hydro Generator
14
Figure 5 Simulated Lightning Strike on 20 kV Line (Courtesy Helsinki University of Technology)
Real Time Hardware-in-the-Loop (HIL) Testing For some simulations, it is more effective to use the real-time responses of actual hardware as part of the simulation. It may also be needed to perform testing on hardware (e.g., short-circuit behavior) which would not be possible in a field environment. This technique can be used to evaluate the hardware itself or a control system that interacts with the hardware. It is also an excellent process to validate models of the hardware. A prime target for this type of simulation is likely to be advanced inverters. HIL is frequently used to evaluate dynamic and/or transient behavior. The prime requirement for such simulations is that the simulator must essentially operate in real time, i.e., the time to complete a single time simulation must be no greater than the minimum time step used. Real time operation usually requires special algorithms that can take full advantage of the use of multiple processors.
15
Tools and the Current State of the Art The state of the art for the simulation of distribution systems is rapidly evolving. As the penetration of PV and the size of the PEV fleet increase, mitigation strategies such as distributed storage and customer participation (demand response, “smart” charging) are also growing and the entire nature of the distribution system is changing.
Analytic tools for simulation of distribution level issues have widely proliferated in the past several years and capabilities are rapidly evolving, largely in response to the increasing sophistication of distribution. Advanced open-source programs have been developed which supplement the more conventional programs available from most providers of commercial software to utilities. The following briefly describes some of the most commonly used programs, although there are many others. It should be noted that the “state-of-the-art” capabilities are undergoing an extremely rapid evolution. Many of the programs described are adding new capabilities and upgrades every few months. Capabilities described represent the time frame of the first quarter of 2013.
Static and Quasi-static Time Series Simulators Commercial versions of simulators for distribution are provided by most vendors of utility software. These are often modules of larger systems aimed at more general utility needs. They all include the ability to model balanced or unbalanced 3-phase and single-phase behavior and generally include extensive models for distribution infrastructure and at least some type of PV model. All can perform “standard” static simulations related to power flow and voltage drops, harmonics, fault currents, switching operations, capacitor placement, and similar requirements. Typically, time series simulations are limited or non-existent and most have no built-in capability to simulate realistic PV scenarios, although several vendors are considering or are in the process of adding time series capability. None have Monte Carlo simulation capability. With some exceptions, commercial offerings are primarily intended for static analysis. Computations are done in the frequency domain. Infrastructure includes conductors, transformers, switches, circuit breakers, regulators, switched and fixed capacitor banks.
Two open-source, no-license-fee tools have been designed for quasi-static simulations of distribution with high penetration of PV, PEVs, and associated Smart Grid resources such as storage and demand response that might be needed to mitigate their impacts. GridLAB-D developed by Pacific Northwest National Laboratory (PNNL) and OpenDSS by Electric Power Research Institute (EPRI) have been aimed at simulation of distribution that extensively incorporates distributed sources and other forms of DER.
GridLAB-D2 Developed by Pacific Northwest National Laboratory (PNNL), this open-source program is designed for use in distribution simulation and with emphasis on effectively modeling and simulating Smart Grid technologies.
The core of GridLAB-D contains four integrated modules: power systems, buildings, control systems, and marketing. The tool includes models and capabilities to analyze 3-phase, unbalanced (meshed or radial) power systems, with demand response, storage, and distributed generation. Combined heat and power (CHP) models allow the capture of the effects of waste heat and offsetting heating requirements in buildings. The market module allows simulations to include cost and rate structures to be integrated into simulations. Monte Carlo simulations are supported.
2 http://eioc.pnnl.gov/brochures/gridlab_d.pdf
16
New capabilities are rapidly being added. Recently, PNNL incorporated the NREL Solar Advisor Model as its PV model. Expected in the summer of 2013, a new release should add improvements in interfacing third-party tools, and co-simulation capability with a commercial transmission tool and with an open-source communication simulator. In February 2013, Battelle released Grid Command Distribution, a separate tool designed to provide pre- and post-processing for GridLAB-D. Battelle claims that this allows the time for creation of feeder models to be reduced from days to minutes, using already available utility databases. As a result of its core capabilities in buildings and markets as well as power systems, GridLAB-D is considered to be a tool well suited for many types of simulations that are broader than simply technical assessments of issues and can be used to look at impacts of policies as well as economic considerations. However, because of the wide flexibility, GridLAB-D may not be as convenient as systems that are intended primarily to perform well-defined simulations for common utility needs. OpenDSS3 Electric Power Research Institute (EPRI) has developed this open source tool which, like GridLAB-D, is specifically aimed at distribution. OpenDSS supports all steady-state (frequency domain) analyses commonly performed on electric power distribution systems, such as power flow, harmonic analysis and fault current calculations. Models are available for many common distribution components and control systems, as well as for storage and PV systems, and customized models can also be incorporated. It can examine cost impacts, the impacts of PEVs and charging strategies. Monte Carlo simulations are supported. In addition, it supports some unusual types of analyses that are designed to meet future needs. It has a dynamic mode to simulate generator swings during disturbances, albeit with a relatively simple generator model. It can simulate not only 3-phase systems, but n-phase models of arbitrary configuration, which would be useful, for example, for analyzing stray voltages from multiple feeders sharing a common neutral. While OpenDSS has built in a number of standard simulations, it is also capable of user-defined scripted simulations. Through the COM interface, the user is capable of performing all the functions of the simulator, including definition of the model data. It can be driven entirely from a Microsoft Office tool through VBA, for example, or from any other third-party analysis program (e.g., Matlab Interface) that can handle COM.
OpenDSS is more focused toward technical analysis than GridLAB-D and, while having similar capabilities, has more directed simulations for common utility issues and comparative testing has shown somewhat faster operation.
CYMDIST The Cooper Power Systems distribution simulator is called CYMDIST, a part of the larger software program CYME 5.0. CYMDIST is one of the most widely used commercial systems for distribution simulation. CYMDIST is a modular system with basic capability for static load flow and fault analysis. Add-on modules perform more in-depth analyses including reliability analysis, contingency analysis, harmonic analysis, and switching (tie-points) optimization. Quasi-static time series simulations are available, but Monte Carlo and other stochastic simulations are not.
SynerGEE The GL Group distribution simulator is SynerGEE. It is primarily a static simulator with a limited PV model and no models for storage or demand response. It does not perform Monte Carlo simulations.
Distribution Engineering Workstation (ISM-DEW) This tool, offered by Electrical Distribution Design (EDD), is unique among currently available software packages in that it is based on an Integrated System Model (ISM). ISM models an entire system, potentially including both transmission and distribution and modeling down to individual customer loads, without restriction on the number of nodes. It can model not only a feeder, but all the feeders in the system. Licensed by EPRI, the tool is capable of static, quasi-static, and (by interfacing with Matlab) dynamic simulations; it can perform stochastic as well as deterministic simulations. EDD offers model building based on existing utility databases such as Geographic Information Systems (GIS) and Advanced Metering Infrastructure (AMI). DEW utilizes algorithms that effectively parse the calculations for use with multiple processors.
DistriView Aspen, Inc. offers DistriView as their distribution level tool. It is a static simulator with minimal capability to analyze DER. There are no internal models for PV or storage. Automatic time series simulations are not available, nor are Monte Carlo simulations.
WindMil The distribution simulator from Milsoft Utility Solutions is WindMil. It is a static simulator with capabilities and limitations similar to other commercial products. Automatic time series simulations are not available, nor are Monte Carlo simulations.
Dynamic and Transient Analysis Programs Simulators that can perform true dynamic and transient analysis are significantly different from static and quasi-static simulators. Analysis is performed in the time domain using detailed component models which closely replicate the dynamic response of a physical device. Primarily used in transmission systems for analyzing wide area oscillations and transient behavior of systems after a disturbance, they are finding some limited applications in distribution systems for simulating machine control systems and transient overvoltage. Analysis is typically on a single phase. It is not expected that they will play a significant role for distribution related to the high penetration of renewables and electric vehicles.
The Electromagnetic Transient Program (EMTP) is widely considered as the standard for transient analysis, as it uses very detailed, 3-phase models for analysis of unbalanced phases, harmonics and other issues where balanced phases cannot be assumed. Originally developed in the 1960s and improved over a number of years by an international consortium of utilities and electric power organizations, the current version is EMTP-RV (Restructured Version), marketed by Powersys.
Several commercial programs are widely used by utilities and universities for engineering studies at the transmission level. While these programs are widely used by utilities and all have some capabilities to model distribution, most are intended only for single-phase or balanced 3-phase simulations and none are really intended, at least at this time, to handle simulations associated with extensive PV and other types of DER.
18
Trends and Future Capabilities Increased Distribution System Complexity The California RPS goal of 33% renewable energy supply by 2020 and other Federal and state policy goals and incentives encouraging PV systems and electric vehicles are driving an unprecedented rate of change in the capabilities needed by distribution systems. The concept of the Smart Grid is intended to embody these changes. Distribution is rapidly evolving from a system intended for the relatively simple task of distributing power from the bulk system to end users to a new system incorporating a variety of DER, third-party distribution level generators, and communication systems.
Smart Meters are already being widely deployed and are expected to become near universal at IOUs in California within the next year or two. Vastly increased data availability from these meters is offering both new opportunities and challenges. In addition to Smart Meters, the increased demands will drive the need for additional observability of the distribution system.
As demand response, advanced inverters, distributed storage, electric vehicles, microgrids, and home networks evolve and increase penetration, utilities will increasingly interact more with customers and third-party aggregators. Customer choice and decision making will become increasingly important factors in grid operations.
Rapid Evolution of Analysis and Tools Distribution simulation is a rapidly evolving field, largely due to the addition of new technologies and the resulting increasing complexity of distribution systems. Conventional distribution simulation planning tools, largely static simulators, are inadequate for planning a system containing significant amounts of variable distributed generation and PEVs, and for evaluating new technologies to mitigate their impacts.
Commercial vendors of modeling and analysis tools are responding to the new demands by developing new tools and adding capabilities to existing ones at a rapid rate. Most vendors have added or are in the process of adding quasi-static time series capabilities to their distribution simulation products. The state of the art is advancing with a speed that is reminiscent of the evolution of the personal computer. In fact, these developments are related, because advanced simulation techniques often require the efficacious management of larger data volumes, as discussed further below.
Increased Stochastic Modeling Utility engineers are accustomed to deterministic results of modeling efforts. Distributed resources, however, inherently imply large numbers of smaller independent resources. While a single 2 MW PV system at a particular location may be easily simulated deterministically, 1000 systems averaging 2 kW each may produce similar results or may be very different depending on the locational and size distributions. Such systems require statistical evaluations simply because effective deterministic ones are likely to be impractical. As PV and electric vehicle penetration increases, stochastic modeling will be the only way to reasonably plan some aspects of the distribution grid.
More Model Types and More Complex Models The IEEE 1547 Standard defines certain performance requirements for inverters used in PV systems. Currently, key requirements are that inverters always operate at unity power factor and that they simply shut off and remain off after certain types of disturbances. The standard is
19
currently in the process of review and modification. It is widely expected that these requirements will be changed to allow inverter operation in all four quadrants (positive and negative real and reactive power, respectively) and to impose low-voltage ride-through (LVRT) requirements. These offer new opportunities but also new model requirements.
End use loads are changing. Electronic loads are an increasing percentage of power consumption. As California’s PEV fleet increases, vehicle charging will represent an increasing share of the total load and loads will become increasingly more subject to being influenced by pricing strategies and customer choices.
PV models are becoming more complex. Depending on the application, models that once incorporated output power vs. time of day in hours for the summer peak might now contain seasonal or even daily outputs with time resolutions down to minutes or even seconds.
The above developments illustrate new and different components that will have to be properly represented – that is, modeled – to play their respective roles in simulation exercises. In some cases (such as very new equipment) no models may yet be available; in other cases, models may exist, but require continuing validation to ensure that they in fact accurately represent the behavior of these evolving devices. Because this is a large area of research and development by itself, a companion white paper specifically on the subject of models, titled Electric Distribution System Models for Simulation and Planning, will be issued later in the summer of 2013.
Distribution Automation As distribution systems have more variable and faster-acting components, it becomes harder for a human operator to manually control the system. Variable resources are shrinking the time available for the decision-making process, while also rendering the decisions themselves more difficult. One solution to this dilemma is distribution automation, or the ability to make and implement decisions by computer. “Open-loop” automation systems refer to those in which control actions are analyzed and proposed by the computer, but authorized by a human operator, whereas in “closed-loop” systems the actions are implemented directly and immediately by the computer without operator intervention. The latter type would be necessary for extremely rapid responses, e.g., compensating for fast ramping in PV outputs by managing mitigation options such as demand response or storage, or for rapid circuit reconfiguration to avoid (or dramatically shorten) customer outages.
Distribution automation systems are expensive and require advanced control elements and communication systems. It is important to appreciate that many decisions that a distribution operator would make, especially switching operations that energize or de-energize some part of a circuit, carry an inherent risk – whether of unintentionally interrupting customers, blowing up a piece of equipment, or, in the worst case, electrocuting someone. Substantial simulation is a vital part of the planning process to ensure safe and reliable operation of DA systems.
Data Analytics Data analytics is the process of analyzing available data for useful information, often called “mining” the data. Given the general advances in information technology, the ability to store and move data is no longer an important constraint in most settings. In the IT community, the magnitude of what is considered “big data” is continually expanding, as is the scope of computations that can be readily performed on standard platforms. However, the effective utilization of data (in the electric power industry and elsewhere) hinges first on the physical collection of data, and second on the ability to interpret or make sense of the numerous bits and bytes.
20
For example, consider the data transmitted every 15 minutes by a large customer base of Smart Meters. The Advanced Metering Infrastructure (AMI) represents the crucial component of physical data collection. Moving and storing these data is not a big deal, in the scheme of things. But for the raw AMI data to provide information beyond account billing that is useful for grid operators and planners, the data must be aggregated (that is, assembled together) and analyzed (that is, taken apart) in the appropriate and logical ways to tell a meaningful story and yield actionable intelligence.
While not simulation, this type of data analysis is expected to play an increasingly important role in the future planning by utilities, although exactly what the most useful applications of that analysis will be is less clear. Tools for handling big data are largely confined to the tasks of storing and accessing the data. The authors are not aware of any tools specifically aimed at data analytics for use in distribution systems. However, the field is rapidly developing and, in 2011, an organization, Utility Analytics Institute, was formed specifically to advance the use of big data by utilities.
Advanced Inverters for Volt/VAR Control Today’s commonly used devices for voltage control primarily comprise electromechanical elements such as load tap changers and switched capacitors. High levels of PV penetration may cause more frequent switching of such devices, thus shortening their useful life, which is normally defined in terms of number of operating cycles. Advanced solar inverters are capable of operation at any desired phase angle with respect to the grid, providing significant opportunity for Volt/VAR control. Currently disallowed by IEEE 1547, this limitation is widely expected to be relaxed in the near future. With appropriate algorithms, PV inverters should be able to play a significant role in reducing voltage variations and mitigating variability of PV power output. Additionally, PV inverters offer the potential to provide VAR support with modest additional power requirements, even at night when no real power can be generated.
Increasing Use of Dynamic and Transient Simulation Dynamic simulation is required to adequately simulate machine control systems that must operate in very short time frames. Microgrids are one example. If, as expected, changes to IEEE 1547 permit the use of advanced inverters with four-quadrant operation and incorporating low-voltage ride-through capability, these functions may require dynamic simulation to adequately study certain impacts such as fault currents and anti-islanding.
Co-simulation Co-simulation is the cooperative simulation of two different types of analysis. Any “smart grid” inherently contains not only an electrical system, but also one or more communications systems. Sensor networks, distribution devices, communication links, and automatic controls must all interact to produce a desired result. For some applications, the behavior of one system can have a significant impact on another. In particular, communication latency can have a strong impact on whether automatic controls can react rapidly enough to perform properly. Co-simulation capability is likely to be increasingly useful and important as distribution automation adds ever more advanced features.
Integration of Distribution into Transmission Analysis As PV penetration increases, the percentage of total power generated and at least some of the resources needed to meet grid requirements (e.g., frequency regulation) will be resident in the distribution system. Reverse power flow (from distribution to transmission) will become more frequent. Distribution substations will no longer be considered or represented as simple loads,
21
and transmission planning studies will require more consideration of the interactions with the distribution system.
22
Research Gaps Standard Analyses for Distribution Feeders with Significant DER The general impacts of high penetrations of PV are reasonably well known. Simulators such as GridLAB-D and OpenDSS are very flexible tools that allow a user to create a large range of different simulations. The drawback to that flexibility is that such tools usually require more effort to accomplish the task. By contrast, the typical commercial offering is less flexible and often less capable. However, these tools have created “standard” analyses to simulate a number of common applications (e.g., power flow, harmonic analysis, fault currents, etc.). As a result, these applications tend to be the ones routinely run, and therefore well accepted by, utilities.
The addition of high levels of distributed generation and their associated impacts require not only additional models for the existing simulations, but potentially entirely new types of simulations. One example of this is the estimation of the PV hosting capacity, the amount of PV that a feeder can support. The use of advanced inverter capabilities such as voltage ride through may require testing for unintentional islanding when inverters do not automatically shut off and remain off after a disturbance.
A utility agreement on a “standard” set of simulations needed to ensure acceptable performance for a distribution feeder or group of feeders that contain distributed PV and other aspects of the Smart Grid would speed implementation by commercial providers. A possible basis for this could be the Rocky Mountain Institute’s (RMI) Electricity Distribution Grid Evaluator (EDGE) model. This MATLAB based tool, funded by the DOE Sunshot program, is designed to assess costs and value of DER and incorporates a Distribution System Submodule analyzes various impacts of high penetration levels of DER.
California Centric Feeder Prototypes and Test Cases Creating accurate feeder models can be time and resource intensive. Characteristics such as percentage of commercial, industrial, and residential loads or degrees of radial geometry versus meshed geometry cause different types of feeders to behave very differently. For some applications, a detailed model of a specific feeder is not required; a model which simply has many of the same general characteristics will be sufficient for many purposes.
Prototype feeders have been developed for various applications. Using a statistical clustering method that groups elements by how similar or different they are from each other on a number of specific criteria, and then representing the average or typical member of each cluster, developers of GridLAB-D have created a number of prototype or “taxonomy” feeder models to represent typical feeders across the nation. IEEE has, over the years, promulgated a number of different test feeders for the purpose of providing researchers with concrete cases that don’t compromise confidential information about actual circuits but likely resemble many real circuits in their key characteristics and therefore yield some generalizable findings. In 2010, the IEEE 8500 node prototype feeder was released to provide a benchmark for researchers who want to find out if algorithms they have developed will scale up.
Existing prototype feeders, however, are not necessarily a good match for the types typical of those used by California IOUs. A set of prototype feeders is needed that capture the particular variety of feeders common in California. The Distribution Monitoring for Renewables Integration project funded by the CEC [Contract **-019] has as one of its goals to distill such a set of California-specific taxonomy feeders. Once these taxonomy feeders have been created, they can be used to build reference test cases that combine with highly variable PV output data for testing and validating new analysis methods.
23
System Optimization with High Levels of PV High penetrations of PV and large fleets of PEVs are widely viewed as significant challenges to adequately maintain and operate transmission and distribution systems. However, these same systems offer the promise of actually aiding rather than hindering effective operation. The use of advanced inverters can help support voltage by generating VARs when a cloud reduces real power. Controlling the time of charging of PEVs can compensate for the tendency of wind systems to generate more power at night than is needed. Demand response algorithms can help flatten load curves. Studies are needed which investigate the potential of PV and other DER at very high penetrations (50% - 200%) to be actively used to mitigate issues created by PV power variability and other grid concerns both at distribution and transmission.
Advanced Solar Inverters Advanced inverters with programmable phase control and low-voltage ride-through capabilities will offer the prospect of significant new opportunities for Volt/VAR control, outage management, and other operational control issues, but will also add challenges as the new capabilities can potentially complicate analyses for safety, fault currents, islanding, and other issues.
Advanced inverter models and studies are required to determine the control algorithms that can best improve voltage control under high penetration of PV while minimizing or eliminating undesired impacts on distribution systems. Studies are also required to determine whether existing “standard” analyses of fault currents and islanding are adequate when advanced inverter functions are in general use.
Co-simulation Co-simulation is the ability of two simulations to work together to evaluate a combined system. The trend to evolve smarter distribution demands that the communication infrastructure become a fundamental part of the system. Simulation of communication systems, however, has generally not been integrated with distribution system simulation, but has been simulated separately. As automatic controls are introduced, the performance aspects of communication systems, particularly latency, become critical factors in whether a system will operate correctly. It is essential for the evaluation of the Smart Grid, in that the overall system dynamics depend both on network and control and on the physical properties of the power system. The ability for distribution simulators to collaborate with communication system simulators will become ever more important as distribution control becomes more automated.
Dynamic Simulation From a historical perspective, dynamic simulation has been widely used in transmission but has had little application in distribution. Current dynamic simulators intended for transmission usually operate under the assumption of a balanced 3-phase system and are not well suited for distribution. New Smart Grid technologies, however, bring new problems that are dynamic in nature. Microgrids require dynamic simulation to adequately replicate their behavior, as do anti-islanding issues arising from advanced inverters with low-voltage ride-through. As distribution automation institutes machine controls with operating times of sub-seconds, quasi-static simulations become inadequate, and improved dynamic simulation tools and models will be needed to study the operation of unbalanced 3-phase distribution systems.
High Performance Desktop Computing In recent years, Moore’s Law, which projects that computer speeds will double every 2 years or so, has effectively come to a halt. In order to continue improving performance, chip
24
manufacturers have begun packaging multiple processors into a single circuit and multiprocessor systems have become common, incorporating not only multiple processors on a chip, but multiple processing chips. Making full use of multiprocessor capabilities requires an effective division of labor between processors with minimal overhead. Non-proprietary algorithms for simulation that can maximize the use of multiple processors need to be developed and made available.
Business Case for Distribution Automation Distribution automation systems are offered by every major supplier of utility tools. The benefits of these systems are well known, at least qualitatively. What is not well known is whether the cost of such a system is the most effective use of dollars expended. California IOUs must justify the cost when filing a rate case to the California Public Utilities Commission (CPUC). A business case analysis would assist utilities in the decision making process about distribution automation. While not directly related to simulation, it has emerged as a research gap in discussions with various experts. It is an important piece of the overall task of deciding what elements should be a part of an automation system and focusing modeling on those aspects.
25
Recommendations and Conclusions This paper has reviewed the process, state of the art, trends for the future, and research gaps for modeling and simulation and analysis of distribution systems with high penetrations of PV and PEVs. While the authors are not recommending specific projects to deal with the impacts and the research gaps, in the literature and in conversations with recognized experts, certain concepts are emerging that we recommend be considered when planning future public interest research.
Long Term View The rapid increase of penetration of PV systems is creating equally rapid evolution of simulation tools and models. Both open-source and commercial tools are adding capabilities to handle increased PV, PEVs, and all forms of DER almost on a monthly basis. Public interest energy research, by its nature, is best suited to deal with longer-term concerns, especially those that do not have immediate and obvious applications. Those areas are already receiving attention from researchers and commercial interests. The authors support the view that new public interest research in the area of simulation and data analysis should focus on answering research questions that need commercial approaches to those problems which will become significant in the 5 to 10 year time frame.
System Optimization California has embarked on the most aggressive policy of any state to reduce the carbon footprint of electricity generation. A reasonable assumption is that this policy is likely to continue beyond 2020 to levels of penetration still higher than the current target of 33%. Advanced inverters for PV systems offer solutions or mitigation to some of the challenges of very high penetration levels of time varying resources. As a principle, using PV to assist in solving the problems it creates may be the only practical and cost-effective way of continuing the policy of encouraging ever greater percentages of California’s energy from renewable sources. Studies are needed to determine the most effective ways of utilizing the advanced inverter capabilities to optimize system performance.
Standardized Simulations for High PV Penetrations Agreed-upon standards invariably speed development and commercialization of technologies. Commercial simulation products have, to a large extent, standardized on commonly used simulations that are needed by most utilities. This has enabled busy engineers to perform many planning functions relatively quickly and easily because the simulation has been pre-organized to perform the function needed. The existence of high penetrations of PV has created the need for new or expanded types of simulations. Industry wide agreement on what types of simulations are appropriate for these conditions would strongly encourage the commercial implementation of those capabilities into current tools.
Data Analytics Data analytics is the study and extraction of useful, but frequently unobvious information from large volumes of data. While not simulation, it is a form of data analysis and is expected to play a role in utility planning. The specific applications and tools to be used to extract useful information from so called “big data” are not yet defined, but it seems highly likely that dramatically increased data will be available in the future from distribution systems and that valuable uses will be found. The authors recommend continued monitoring of progress in the field of data utility analytics for possible future public interest research activities.
26
27
References Agüero, J.; Willis, H.; Enslin, J.; Katiraei, F.; Spare, J.; Cecchi, V., Closed-loop operation of Power Distribution Systems for Integration of High Penetration Levels of Distributed Energy Resources, Proceedings of the 2013 DistribuTECH Conference, San Diego, CA.
Arritt, R.; Dugan, R., Distribution System Analysis and the Future Smart Grid, 2011 IEEE Rural Electric Power Conference (REPC).
Aukai, T.; Nakafuji, D.; Stewart, E.; Davis, R.; Quach, B.; Sisan-Lebrilla, E., Proactive Approach Process: Cluster Evaluations for Oahu, Proceedings of the 2013 DistribuTECH Conference, San Diego, CA.
Behnke, M., Short Circuit Contribution from PV Power Plants, Proceedings of the NREL Distribution System Modeling Workshop, La Jolla, CA, 2012.
Behnke, M., Generic Solar Model Status, Western Electricity Coordinating Council Renewable Energy Modeling Task Force Meeting, Salt Lake City, UT, 2012.
Biserica, M.; Besanger, Y.; Caire, R.; Chilard, O.; Deschamps, P., Neural Networks to Improve Distribution State Estimation—Volt Var Control Performance, IEEE Transactions on Smart Grid, Vol. 3, No. 3, 2012.
Boudreau, R.; Ruppert, P., Managing Distributed Generation through Predictive and Optimized Analytics, Proceedings of the 2013 DistribuTECH Conference, San Diego, CA.
Broderick, R., Distribution System PV Generation: Modeling and Analysis, Proceedings of the NREL Distribution System Modeling Workshop, La Jolla, CA, 2012.
Broderick, R., Workshop Findings for Distributed System Modeling-PV Integration, Proceedings of the NREL Distribution System Modeling Workshop, La Jolla, CA, 2012.
Chen, P., Stochastic Modeling and Analysis of Power System with Renewable Generation, Dissertation submitted to the Faculty of Engineering, Science & Medicine at Aalborg University, 2010.
Clarke, C., Distribution System Modeling, Proceedings of the NREL Distribution System Modeling Workshop, La Jolla, CA, 2012.
Dugan, R., The Value of Quasi-Static Time Series Simulation, Proceedings of the NREL Distribution System Modeling Workshop, La Jolla, CA, 2012.
Dugan, R.; Arritt, R.; McDermott, T.; Brahma, S.; Schneider, K., Distribution System Analysis to Support the Smart Grid, 2010 IEEE Power and Energy Society General Meeting.
Farivar, M.; Clarke, C.; Low, L.; Chandy, M., Inverter VAR Control for Distribution Systems with Renewables, http://smart.caltech.edu/papers/varrenewables.pdf, 2011.
Geidl, M., Protection of Power Systems with Distributed Generation: State of the Art, http://www.eeh.ee.ethz.ch/uploads/tx_ethpublications/geidl_protection_dg.pdf, 2005.
Green, J., 2012 Grid Strategy: Distribution Management System - Advanced Applications for Distributed Energy Resources, IEEE Power and Energy Systems DMS Task Force Meeting, 2013.
Huang, W.; Yao, K.; Wu, C.; Wang, S., Dynamic Simulation and Analysis of a Low-Voltage Micro-Grid, 2012 International Conference on Computing, Measurement, Control and Sensor Network, 2012.
28
Lave, M.; Stein, J.; Ellis, A., Analyzing and Simulating the Reduction in PV Powerplant Variability Due to Geographic Smoothing in Ota City, Japan and Alamosa, CO, http://energy.sandia.gov/wp/wp-content/gallery/uploads/PVSC_38_Lave_FINAL.pdf, 2012.
Liberatore, V.; Al-Hammouri, A., Smart Grid Communication and Co-Simulation, Energytech 2011.
Manitsas, E.; Singh, R.; Pal, B.; Strbac, G., Distribution System State Estimation Using an Artificial Neural Network Approach for Pseudo Measurement Modeling, IEEE Transactions on Power Systems, Volume 27, Issue 4, 2012.
Mather, B., Southern California Edison High-Penetration Photovoltaic Project – Year 1, Proceedings of the NREL Distribution System Modeling Workshop, La Jolla, CA, 2012.
Mather, B., High-Penetration PV Integration Distribution System Modeling Challenges, Proceedings of the PV Grid Integration Workshop, Tucson, AZ, 2012.
Montenegro, D.; Hernandez, M.; Ramos, G., Real Time OpenDSS framework for Distribution Systems Simulation and Analysis, Sixth IEEE/PES Latin America T&D Conference and Exposition, 2012.
Monti, A., Advanced Simulation Methods for Smart Grids, http://www.ikr.uni-stuttgart.de/Content/itg/fg524/Meetings/2011-07-13-Aachen/11_ITG524_Aachen_Monti.pdf, 2011.
Narang, D.; Hambrick, J., High Penetration PV Deployment in the Arizona Public Service System, 37th IEEE Photovoltaic Specialists Conference, 2011.
Payne, J.; Gu, F.; Brouwer, J.; Samuelsen, S., Evaluation of High Pen PV in Distribution Circuits, High Penetration Solar Forum 2013, San Diego, CA.
Post, K., Swayne, T., Distribution Photovoltaic Solar Impact Study, Proceedings of the 2013 DistribuTECH Conference, San Diego, CA.
Reno, M.; Ellis, A.; Quiroz, J.; Grijalva, S., Modeling Distribution System Impacts of Solar Variability and Interconnection Location, http://energy.sandia.gov/wp/wp-content/gallery/uploads/Reno_ASES_SAND2012-2390C.pdf, 2012.
Resnick Institute, California Institute of Technology, Grid 2020: Towards a Policy of Renewable and Distributed Energy Resources, 2012.
Rocky Mountain Institute, EDGE Model Executive Summary, http://www.rmi.org/PDF_Electricity_Distribution_Grid_Evaluator_EDGE_Model, 2013
Ropp, M.; Ellis, A., Suggested Guidelines for Assessment of DG Unintentional Islanding, http://energy.sandia.gov/wp/wp-content/gallery/uploads/SAND2012-1365-v2.pdf, 2012.
Rylander, M.; Smith, J., Determining Distribution System Hosting Capacity for Photovoltaics, Proceedings of the 2013 DistribuTECH Conference, San Diego, CA, 2013.
Schneider, K., Quasi-Static Time-Series Simulations, Proceedings of the NREL Distribution System Modeling Workshop, La Jolla, CA, 2012.
See, J.; Carr, W.; Collier, S., Real Time Distribution Analysis for Electric Utilities, 2008 IEEE Rural Electric Power Conference.
Sterkel, M., California Perspective on High Penetration PV, CPUC High Penetration Solar Forum, 2011.
29
Stewart, E.; Aukai, T.; Nakafuji, D.; MacPherson, M., Quantifying Long Term Variability Impacts on Voltage Regulation Equipment: HiP - PV Lessons Learned from Analysis on HECO Feeders, Proceedings of the 2013 DistribuTECH Conference, San Diego, CA.
Sun, C.; Dow, L., Solar Photovoltaic Impacts on the Distribution Grid, Proceedings of the 2013 DistribuTECH Conference, San Diego, CA.
Taft, J., Cyber-Physical Architecture for the Power Grid of 2020, Resnick Institute, California Institute of Technology, GRID 2020 Discussion Series, 2012.
Taylor, J.; Smith, J.W.; Dugan, R., Distribution Modeling Requirements for Integration of PV, PEV, and Storage in a Smart Grid Environment, 2011 IEEE Power and Energy Society General Meeting.
Trussell, L., Engineering PV with SynerGEE Electric, Proceedings of the NREL Distribution System Modeling Workshop, La Jolla, CA, 2012.
Uluski, R., Grid Analytics for Modern Distribution, Proceedings of the 2013 DistribuTECH Conference, San Diego, CA.
Yinger, R.; Bravo, R.; Robles, S.; Tamae, W.; Shas, S., Behavior of New Customer Loads/Generation Connected to the Distribution System, Proceedings of the 2013 DistribuTECH Conference, San Diego, CA.
Zayandehroodi, H.; Mohamed, A.; Shareef, H.; Mohammadjafari, M., An Automated Protection Method for Distribution Networks with Distributed Generations Using Radial Basis Function Neural Network, the 5th International Power Engineering and Optimization Conference, 2011.